Embed Size (px)
Citation preview

Economic Research Southern Africa (ERSA) is a research programme funded by the National
Treasury of South Africa. The views expressed are those of the author(s) and do not necessarily represent those of the funder, ERSA or the author’s affiliated
institution(s). ERSA shall not be liable to any person for inaccurate information or opinions contained herein.
Mirror, Mirror on the Wall, Who is the
Most Central of Them All?
Co-Pierre Georg, and Michael E. Rose
ERSA working paper 571
January 2016

Mirror, Mirror on the Wall, Who is
the Most Central of Them All? ∗
Co-Pierre Georg†, and Michael E. Rose‡
In academia, informal collaboration is an integral element in the pro-
duction of knowledge. We construct the social network of informal collab-
oration using acknowledgments of 2782 scholarly articles published in six
journals in financial economics. We rank financial economists according to
their centrality in the network and find that central commenters are not
necessarily the most central or the most productive authors. We explore
the determinants of high centrality rankings using detailed CV data for
the most central academics. A PhD from a better ranked department is
associated with a better centrality ranking. Seniority is associated with
worse rankings, albeit at a decreasing rate.
Keywords: Knowledge production, formal collaboration, informal col-
laboration, social network, acknowledgements∗We would like to thank Michael Gofman, Falko Fecht and Alex Oettl for comments and sug-
gestions on an earlier draft. For valuable research assistance, we thank Francis Leni Anguyano,Patricia Chirwa, Aldu Duminy, Samantha Filby, Jesslyn Jonathan, Chris McPetrie and Khany-isa Yolanda Nogaya. We also thank Martin Rünz and Claudio Rocchini for their code used for agraph.
† University of Cape Town. E-Mail: [email protected], Economic ResearchSouthern Africa, and Deutsche Bundesbank. The views expressed in this paper do not necessar-ily reflect the views of Deutsche Bundesbank.
‡ University of Cape Town. E-Mail: [email protected]. Corresponding author.
1
JEL Classification: A14, D83, G00
1. Introduction
Collaboration is increasingly important for scientific progress. Academics collaborate
formally by co-authoring research papers, but most collaboration is informal, e.g.
providing commentary to colleagues, feedback during seminar presentations, giving
discussions at conferences, or refereeing manuscripts for scholarly journals. With few
notable exceptions, however, the literature studies formal collaboration only. We
study the social network of informal collaboration in financial economics, rank the
most central financial economists in our network, and investigate their characteristics.
Editors of the top scholarly journals in financial economics advise authors to
collaborate informally (Green et al., 2002) and young economists are encouraged to
acknowledge helpful input generously (Thomson, 1999). Indeed, authors commonly
acknowledge helpful colleagues, seminar and conference participants as well as referees
in the title page footnote or a separate section (Laband and Tollison, 2000; Cronin,
1995). We use this unique setting in which informal collaboration is well documented,
to construct a novel dataset on informal collaboration.
We distinguish between three forms of informal collaboration.1 First, social in-
formal collaboration is the collaboration between authors and commenters who are
individually acknowledged for providing commentary, insights or for engaging in dis-
cussions about the paper. Second, institutional informal collaboration captures pre-
sentations in research seminars at universities, central banks, government institutions,
and think tanks. And third, institutionalized informal collaboration captures confer-
ences where a paper has been presented. While all three forms increase over time at
the extensive and intensive margin, their differences reveal journal-specific patterns.
In this paper we focus on social informal collaboration only and construct a net-
1The term derives partly from Laband and Tollison (2000, pp. 645-646), who refer to the pro-vision of commentary by colleagues as informal intellectual collaboration.
2
work which we term social network of informal collaboration. Networks are a necessary
conduit for information transmission and as such, they enjoy growing attention of sci-
entists to highlight the flow of information (Phelps et al., 2012). The social network
of informal collaboration connects financial economists whenever one acknowledges
the other. However, information also flows among co-authors. We therefore add a
link between two researchers if they co-author a paper.
Different network centrality measures shed light on the role specific individuals
play in the transmission of information or the influence they exert on their neighbors
Jackson (2014); Ballester et al. (2006). We rank the most central financial economists
according to two different centrality measures obtained from the social network of
informal collaboration and compare their rank with centrality measures obtained from
the social network of formal collaboration (i.e. the network of co-authorship). These
centrality measures are betweenness centrality and eigenvector centrality, both of
which are related but distinct: betweenness centrality measures the importance for
transmitting information while eigenvector centrality points to the most connected
group, i.e. the opinion leaders, in the network.
To understand what determines network centrality, we conduct ordered logit re-
gressions on subsets compromising the 100 most central financial economists in the
social network of informal collaboration. The subsets are distinct because a researcher
with high betweenness centrality is not necessarily highly eigenvector central. Results
from the regressions suggest that seniority is most important for a high eigenvector
centrality. Having served many years as editor in multiple journals is associated with
a high betweenness centrality rank.
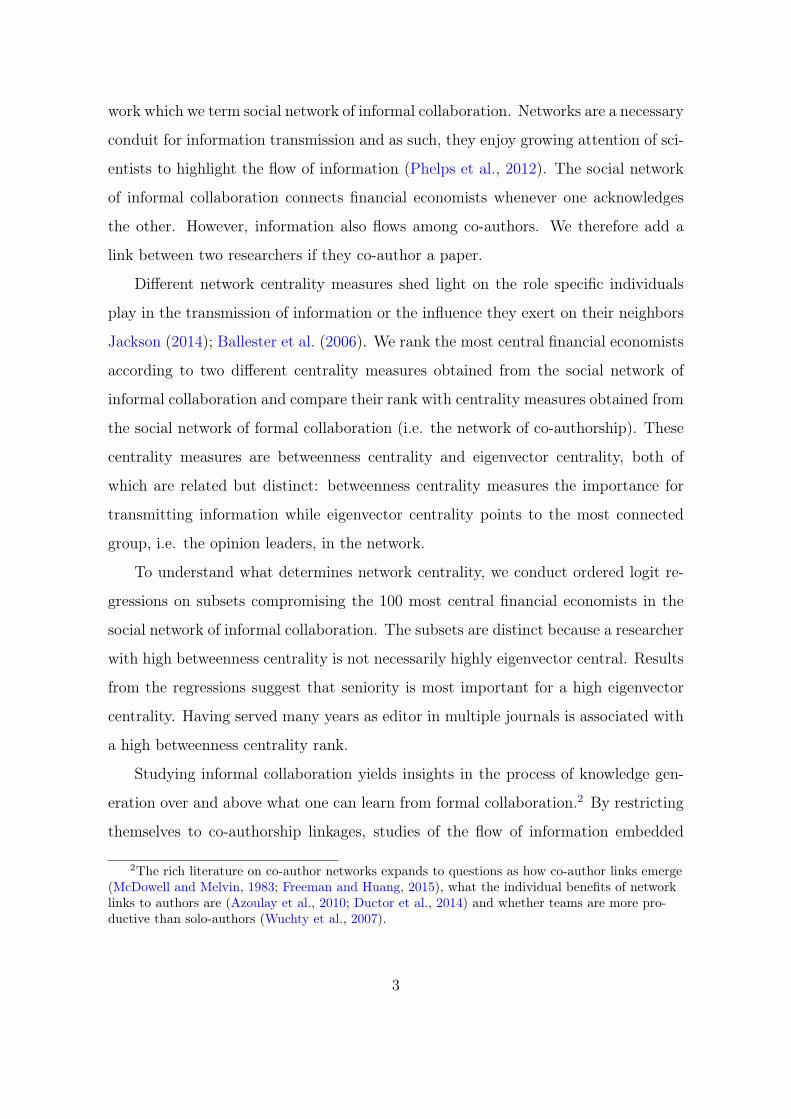
Studying informal collaboration yields insights in the process of knowledge gen-
eration over and above what one can learn from formal collaboration.2 By restricting
themselves to co-authorship linkages, studies of the flow of information embedded
2The rich literature on co-author networks expands to questions as how co-author links emerge(McDowell and Melvin, 1983; Freeman and Huang, 2015), what the individual benefits of networklinks to authors are (Azoulay et al., 2010; Ductor et al., 2014) and whether teams are more pro-ductive than solo-authors (Wuchty et al., 2007).
3

in co-authorship networks might overestimate the importance of highly productive
individuals. Goyal et al. (2006), for example, show that the network of formal col-
laboration evolves into a network with small-world properties as technology lowers
the cost of formal collaboration, i.e. makes it easier to co-author papers. Including
connections between authors and commenters allows us to analyze various dimensions
of information flow. For instance, most authors are isolated in the social network of
formal collaboration but end up well connected once we include author-commenter
links. Our paper thus provides a more nuanced view of the generation of knowledge
which can help identifying the determinants of successful research papers.
Our results are not only relevant to other financial economists working in the field.
We also provide the first large-scale examinations of the social network of informal
collaboration in science, which is visible only through acknowledgements. From this
perspective, Economics is an interesting discipline because it strongly emphasizes
informal collaboration, compared to the natural sciences (Laband and Tollison, 2000).
Additionally, it is more hierarchically organized and less fragmented than other social
sciences (Fourcade et al., 2015). Financial economics itself is an interesting field
because it is both sufficiently large and homogeneous.
2. Data
We use data from two different sources: 1) Acknowledgment sections and bibliometric
data from 2782 research articles and 2) CVs of 258 financial economists.
Our main data source is research articles that have been published in six scholarly
journals. We focus on six journals with a similar focus on financial economics: The
Journal of Finance (JF), the Journal of Financial Economics (JFE), The Review of
Economic Studies (RFS), the Journal of Financial Intermediation (JFI), the Journal of
Money, Credit, & Banking (JMCB), and the Journal of Banking and Finance (JBF).
The first three journals are commonly regarded as general interest journals, while the
remaining three journals are considered to be field journals. The set of general interest
4

journals for example is identical to the set used in the study of Borokhovich et al.
(2000), who examine impact in financial economics. As of 2014, all general interest
journals had an impact factor well above five, while the field journals’ impact factor
was between 1.5 and 2.5.
We look at articles published during two sample periods: The early sample con-
sists of articles published between 1998 - 2000 and the late sample of those published
between 2009 - 2011. The rationale behind this split is to account for effects of
organizational and technological change on the academic publication process. We
restrict our analysis to what the publishers Wiley (JF and JMCB), Oxford Journals
(RFS) and Ohio State University Press (JMCB) call Articles and what Elsevier (JBF,
JFE, JFI) calls Original Research Articles. Additionally, we omit notes, discussions,
shorter articles, conference announcements, minutes, policymakers roundtable, etc.
This gives us a total of 2782 (early: 887; late: 1895) articles.
The sample is very homogeneous: 92% of 2261 articles listing Journal of Economic
Literature (JEL) codes belong to JEL category G (Financial Economics).3 Additional
6% list E (Macroeconomics and Monetary Economics), but not G. The six journals are
not only homogeneous in their research focus, but also in their editorial process: All
journals except the JMCB used single blind referee process throughout the sample
period, which puts the JMCB at a mildly special position. The JFE used to be
special as well, as it had a policy according which referees could reveal themselves
upon publication. On top of that, three journals (RFS, JFE and JBF) explicitly
encourage authors to acknowledge helpful individuals on the paper.4
For each paper we collect standard bibliometric information. This includes title,
all authors, each affiliation for all authors, listed JEL codes and the number of pages.
Our main interest is directed at acknowledgement sections, typically located on
3Not all articles list JEL codes. The JF for instance never lists JEL codes, while the RFSintroduced JEL codes in Winter 2006 only. For articles not listing JEL codes, we conductedan internet search to obtain JEL codes from latest working paper version. This is the case for224 articles.
4We are grateful to the journal editors for answering a short questionnaire.
5
the title page of an article. Authors commonly acknowledge helpful input by col-
leagues and state where a paper has been presented. Funding sources and hospitality
during visiting positions are often acknowledged, too, as well as research assistance.
From the acknowledgement section we collect: which seminars and conferences the
article has been presented, visiting (and former) faculty positions and the names of
colleagues that have provided input.
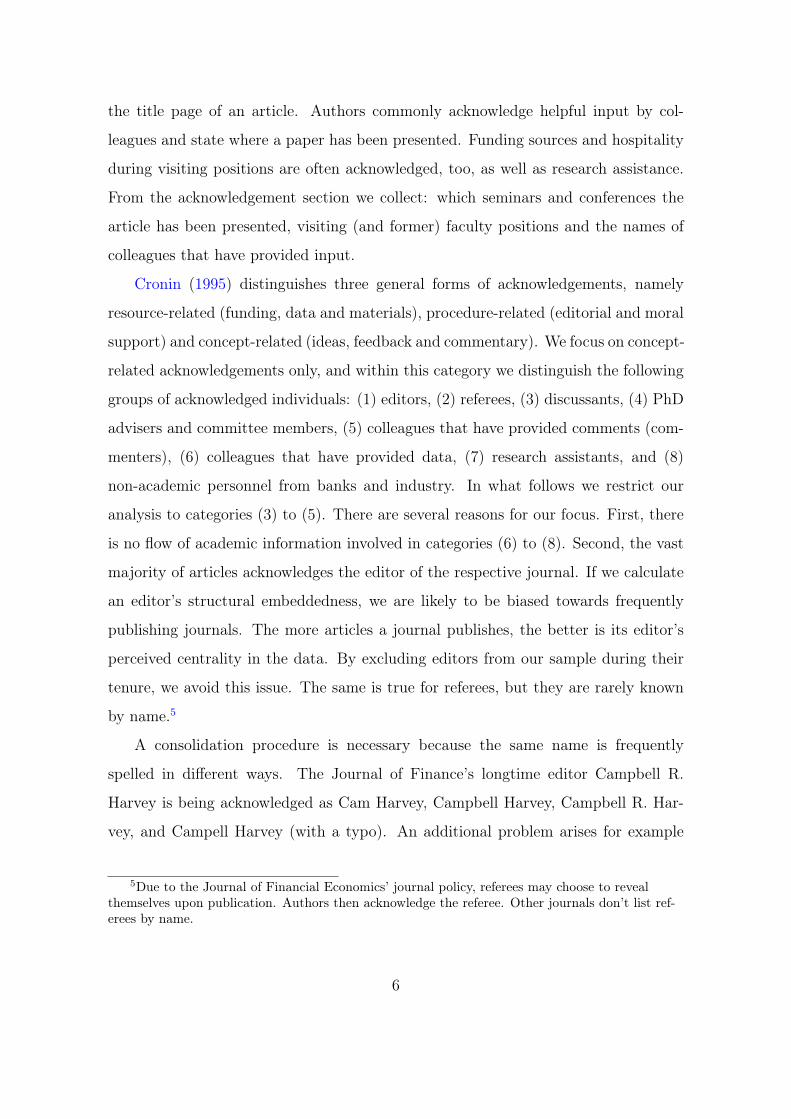
Cronin (1995) distinguishes three general forms of acknowledgements, namely
resource-related (funding, data and materials), procedure-related (editorial and moral
support) and concept-related (ideas, feedback and commentary). We focus on concept-
related acknowledgements only, and within this category we distinguish the following
groups of acknowledged individuals: (1) editors, (2) referees, (3) discussants, (4) PhD
advisers and committee members, (5) colleagues that have provided comments (com-
menters), (6) colleagues that have provided data, (7) research assistants, and (8)
non-academic personnel from banks and industry. In what follows we restrict our
analysis to categories (3) to (5). There are several reasons for our focus. First, there
is no flow of academic information involved in categories (6) to (8). Second, the vast
majority of articles acknowledges the editor of the respective journal. If we calculate
an editor’s structural embeddedness, we are likely to be biased towards frequently
publishing journals. The more articles a journal publishes, the better is its editor’s
perceived centrality in the data. By excluding editors from our sample during their
tenure, we avoid this issue. The same is true for referees, but they are rarely known
by name.5
A consolidation procedure is necessary because the same name is frequently
spelled in different ways. The Journal of Finance’s longtime editor Campbell R.
Harvey is being acknowledged as Cam Harvey, Campbell Harvey, Campbell R. Har-
vey, and Campell Harvey (with a typo). An additional problem arises for example
5Due to the Journal of Financial Economics’ journal policy, referees may choose to revealthemselves upon publication. Authors then acknowledge the referee. Other journals don’t list ref-erees by name.
6

with different naming conventions e.g. for Asian names (first name, last name vs. last
name, first name). To account for all these effects, we conduct an internet search for
all authors and acknowledged individuals to find their full and proper name. After
the consolidation process we are left with 3449 (7522) names in the early (late) time-
frame. Some researchers appear in both timeframes, which gives us a total of 9463
academics in our dataset.
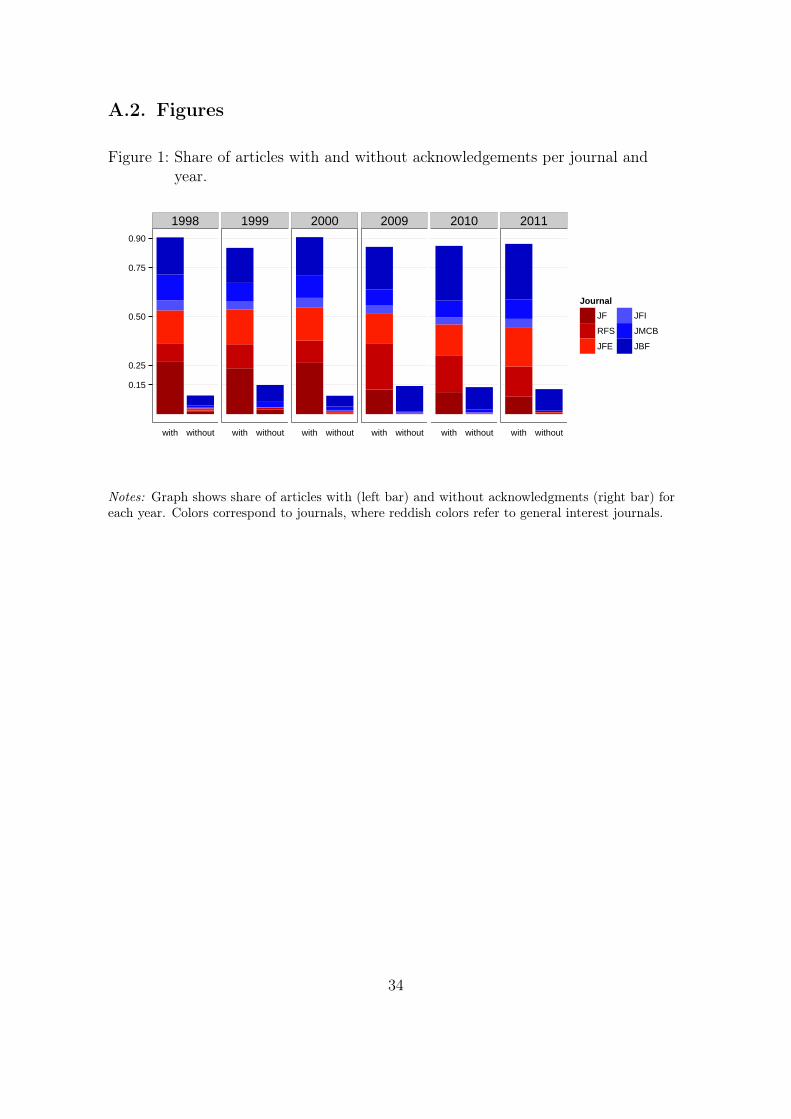
The vast majority of published research articles acknowledges informal input by
colleagues. Of all the 2782 articles in our dataset, 501 (18%) articles do not acknowl-
edge any commenter.6 In total, the share of articles reporting informal collaboration
(the extensive margin) has remained very stable over time, albeit general interest
publications report informal collaboration more often. Figure 1 documents this de-
velopment.
FIGURE 1 ABOUT HERE
General interest publications not only acknowledge informal collaboration more
often, they also report a higher intensity of informal collaboration. Figure 2 shows
the average number of authors, commenters, seminars and conferences, grouped by
year and journal. General interest publications acknowledge almost twice as many
colleagues than papers published in a field journal (left figure), and are presented
more than twice as often at seminars and conferences (center and right figure).
FIGURE 2 ABOUT HERE
Another striking fact is how well the general journal ranking is reflected by the
amount of informal collaboration. The Journal of Finance (JF) usually has the highest
intensity of informal collaboration, with the Journal of Banking and Finance mostly at
the bottom. All three general interest journals are very close together. But not so the
6These articles may, however, acknowledge comments by editors, referees, funding, data ex-change and research assistance. We are only interested in informal collaboration prior to publica-tion.
7
field journals, where collaboration patterns in the Journal of Financial Intermediation
resemble those in general interest journal more and more.
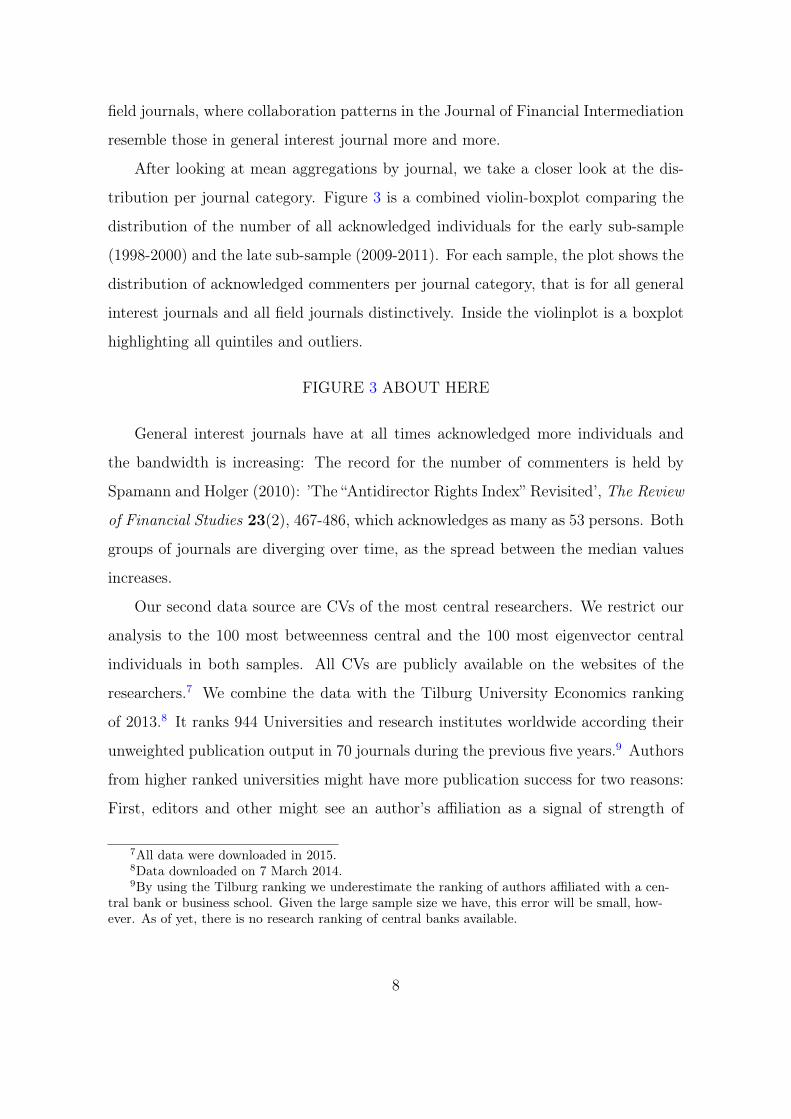
After looking at mean aggregations by journal, we take a closer look at the dis-
tribution per journal category. Figure 3 is a combined violin-boxplot comparing the
distribution of the number of all acknowledged individuals for the early sub-sample
(1998-2000) and the late sub-sample (2009-2011). For each sample, the plot shows the
distribution of acknowledged commenters per journal category, that is for all general
interest journals and all field journals distinctively. Inside the violinplot is a boxplot
highlighting all quintiles and outliers.
FIGURE 3 ABOUT HERE
General interest journals have at all times acknowledged more individuals and
the bandwidth is increasing: The record for the number of commenters is held by
Spamann and Holger (2010): ’The “Antidirector Rights Index” Revisited’, The Review
of Financial Studies 23(2), 467-486, which acknowledges as many as 53 persons. Both
groups of journals are diverging over time, as the spread between the median values
increases.
Our second data source are CVs of the most central researchers. We restrict our
analysis to the 100 most betweenness central and the 100 most eigenvector central
individuals in both samples. All CVs are publicly available on the websites of the
researchers.7 We combine the data with the Tilburg University Economics ranking
of 2013.8 It ranks 944 Universities and research institutes worldwide according their
unweighted publication output in 70 journals during the previous five years.9 Authors
from higher ranked universities might have more publication success for two reasons:
First, editors and other might see an author’s affiliation as a signal of strength of
7All data were downloaded in 2015.8Data downloaded on 7 March 2014.9By using the Tilburg ranking we underestimate the ranking of authors affiliated with a cen-
tral bank or business school. Given the large sample size we have, this error will be small, how-ever. As of yet, there is no research ranking of central banks available.
8
the author and thus of the paper. As a consequence, an article might be more visi-
ble. Second, authors from better ranked universities have colleagues who have more
publication success and are thus able to provide more insightful feedback.
Using information from CVs, we compute seven variables: 1) the rank of the PhD
granting university in the 2013 Tilburg Ranking, 2) the Tilburg rank of the current
affiliation, 3) a binary variable equal to 1 if the researcher is a woman,10 4) the number
of years the person has been serving as managing or associated editor, 5) a binary
variable indicating membership in either NBER or CEPR as of 2015, 6) seniority,
measured as the difference between the year 2012, the last year in our data sample,
and the year in which the PhD was awarded, and 7) the square of seniority to capture
non-monotonic age-effects. The eighth variable is the number of times a person has
been acknowledged during the current dataset (early or late) and is obtained from
our main dataset.
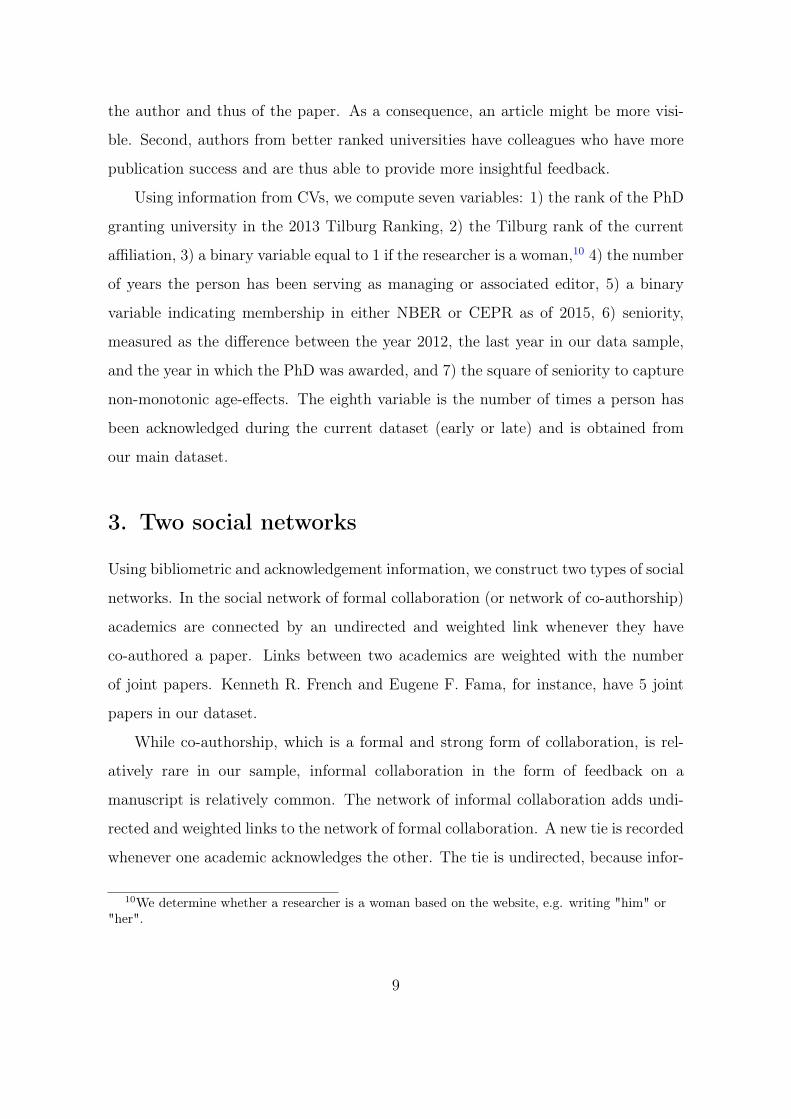
3. Two social networks
Using bibliometric and acknowledgement information, we construct two types of social
networks. In the social network of formal collaboration (or network of co-authorship)
academics are connected by an undirected and weighted link whenever they have
co-authored a paper. Links between two academics are weighted with the number
of joint papers. Kenneth R. French and Eugene F. Fama, for instance, have 5 joint
papers in our dataset.
While co-authorship, which is a formal and strong form of collaboration, is rel-
atively rare in our sample, informal collaboration in the form of feedback on a
manuscript is relatively common. The network of informal collaboration adds undi-
rected and weighted links to the network of formal collaboration. A new tie is recorded
whenever one academic acknowledges the other. The tie is undirected, because infor-
10We determine whether a researcher is a woman based on the website, e.g. writing "him" or"her".
9
mation flows in both directions: from the author to the commenter because the author
tells the commenter, sometimes in great detail, about the paper, and from the com-
menter to the author, because the commenter provides feedback. Each link between
an author and an acknowledged commenter is weighted with the inverse number of
authors to account for the fact that commenters typically provide feedback to a single
author. The strongest link has a weight of 8 and is between Amir Sufi and Douglas
W. Diamond.
Consequently, every author shows up in both networks: in the network of formal
collaboration with her co-authors as network neighbors, and in the network of informal
collaboration with her co-authors and her acknowledged commenters as neighbors.
Both networks account for different dimensions of scientific collaboration. A node
with many ties in the formal network (co-author network) is someone who is likely to
publish and collaborate often. Therefore, the formal network captures productivity.
The network of informal collaboration on the other hand additionally accounts for
information embedded in less formal but common interactions between academics.
Studies on co-authors networks hence underestimate the information flow embedded
in the informal exchange of ideas and information between authors and commenters.
The network of informal collaboration additionally captures a dimension that
Oettl (2012) denotes helpfulness. This is plausible because a node with many ties
in the network of informal collaboration represents a researcher that comments (dis-
cusses, advises, etc.) often. A very productive researcher is not necessarily a very
helpful researcher in the sense that she helps others during the publication process.
The rise of co-authorship in scientific work has been well documented (McDowell
and Melvin, 1983; Barnett et al., 1988; Goyal et al., 2006). A crucial assumption of
these studies is that information flows through joint papers and projects. This lit-
erature, however, is oblivious to other forms of information flow between academics.
The connectedness of authors increases dramatically when commenters are taken into
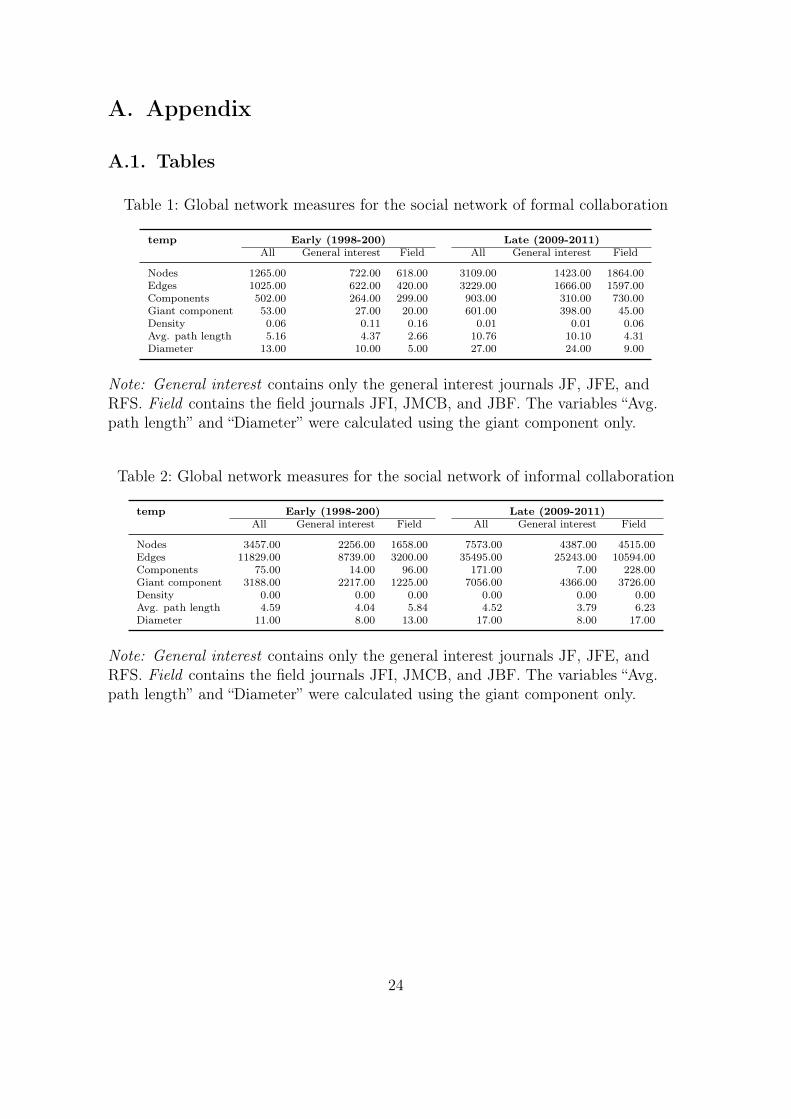
account. Table 1 gives an overview of key figures of the social network of formal col-
laboration while Table 2 shows key figures for the social network of informal collabo-
10
ration. To highlight existing differences between the journals, we also build networks
using subsamples of general interest journals and field journals.
TABLE 1 ABOUT HERE
TABLE 2 ABOUT HERE
Due to the higher number of co-author links, the network is more connected in
2009-2011 than it was a decade earlier. For example, the number of unconnected
components decreased while the size of the giant component increased. This is also
visible in Figure 4, which shows the co-author network for both points in time.
FIGURE 4 ABOUT HERE
Comparing the two subsamples by journal quality provides evidence that in all
dimensions the formal network for general interest journals is better connected than
the network build of field journal publications only. While there were more authors
publishing in general interest than in field journals in the early sample, the reverse
is the case for the late sample: the number of authors publishing in general interest
journals has doubled from the late to the early sample, but at the same time the
number of authors publishing in field journals has more than tripled. The rise in
co-authorship documented in the literature can be seen in the increase in the number
of edges (each edge indicating a unique co-author relationship). There are more than
twice as many edges for publications in general interest journals in the late sample
than in the early sample and over four times as many in the field journal sample. The
expansion of the network from the early to the late sample did not lead to an increase
of the shortest path length within the network, which is relevant for the transmission
of information.
Direct comparison of both social networks highlights the estimation error when
informal social collaboration is ignored: There are at least twice as many nodes and
at least ten times as many edges. The contrast is even starker for general interest
11
publications. The overlap between the two social networks is surprisingly small: Out
of 3919 authors, 1858 (about 47%) are never acknowledged as commenter. Of 7603
acknowledged researchers 5542 (about 72%) are not publishing in the set of our jour-
nals. These relationships hold for every subset, regardless of journal quality, or early
or late sample. Obviously, a lot more researchers are involved in the generation of
knowledge than those actually publishing.
Table 2 gives an idea of the connectedness of the social network of informal col-
laboration, too. The network expanded massively due to the larger number of com-
menters. The expansion is proportionally larger than the increase in the number of
publication would suggest. Although the number of edges grew more than the num-
ber of nodes, the network has not become more connected generally. The number of
components increased, entirely caused by publications in field journals. The largest
component – the so called giant component – was already very large in the early sub-
sample, connecting more than 95% of all academics in the network, and has grown
even more to 98%. Density remained at values close to 0 and the average shortest
path length remained broadly constant at 4.5. Diameter, being the longest of all
shortest paths, even increased by two nodes, meaning that information today travels
longer on average through the social network of informal collaboration.
Figure 5 shows the social network of informal collaboration for both points in
time. The links are color-coded according journal group, with links occurring in field
journals being blue and those in general interest journal being red (links occurring in
both points in time are extremely rare and colored in purple). It is a striking feature
of both timeframes that blue links are almost exclusively at the network’s periphery
while the remaining red links dominate the center. This highlights the importance of
central commenters for the flow of information traversing from one side of the network
to the other.
FIGURE 5 ABOUT HERE
The observation that commenting on each others work is prevalent raises the
12

question as to why researchers invest their sparse time to read manuscripts when
they do not receive credit for it. One possible explanation is that researchers are
following a quid-pro-quo strategy, that is to help colleagues that have helped them.
Our data allow us to calculate the amount of reciprocity in the social network of
informal collaboration. Reciprocity takes two forms: First, comment on the work of
one’s coauthors, and second, comment on the work of one’s commenters.
We first examine whether acknowledged commenters are also co-authors. We
denote the number by Θ and define it for each timepoint t ∈ {early, late} as the
sum of all commenter-author links that appear both in the social network of formal
collaboration Ga and the social network of informal collaboration Gc:
Θt =P∑p
κp∑I
ιp∑F
{gIik|gIik = gFik = 1}. (1)
gIik = 1 if commenter i is acknowledged by author k, while gFik = 1 if i and k have
coauthored a paper. Θearly is 193, while Θlate equals 538. In order to normalize these
numbers, we divide by the number of possible links Ξ. We define Ξt for each t as:
Ξt =P∑p
κp∑k
Nak,t(GF ) \ κp, (2)
where Nk,t(GF ) is the set of neighbors of author k in the network of formal collabo-
ration GF in timepoint t. In the early (late) sub-sample there are 1180 (4664) possi-
ble links of commenting co-authors. Hence, between 1998 and 2000, (Θearly/Ξearly) ∗
100% ≈ 16% of all (feasible) authors commented on their co-authors other work, while
between 2009 and 2011 the respective ratio decreased to Θlate/Ξlate ∗ 100% ≈ 12%.
It remains subject to speculation why over time less authors read the drafts of their
co-authors.
Next, we examine the extend to which authors comment on the work of their
commenters. We define the number of reciprocal commenter links as Λt for each
13
timepoint t, where
Λt =NI∑i
NI∑j 6=i
{gIij|gIji = 1} (3)
for any two nodes i and j in the social network of informal collaboration. The count
of reciprocal links in the early sub-sample equals 698 and 1364 in the late sub-sample.
In order to normalize these numbers, we divide by the number of possible reciprocal
links φ. There are two necessary conditions for a possibly reciprocal commenter link:
First, j is an author herself, that is j ∈ NF , and second, there is at least one paper
where j is not a coauthor of i, that is j /∈ Ni(GF ). Hence,
φ =NI∑i
NI∑j 6=i∧∈NF∧j /∈Ni(GF )
gIji (4)
In the early sub-sample there are 2912 such links, while in the late sub-sample there
are 8117 links that could possible be reciprocal. Hence, Λearly/φlate ∗ 100% ≈ 24%
and Λlate/φearly ∗ 100% ≈ 17%. Again, it is a puzzle while the share of reciprocal
author-commenter links declined.
One caveat is in order, as we only observe commenting ties within our dataset
consisting of financial economics journals. This is not necessarily the natural domain
of all commenters, given their field of expertise. For example, 2014’s Nobel price
laureate Lars Peter Hansen has been acknowledged by more than 20 articles in our
dataset, while he didn’t author a single article in our dataset.
4. Who are the most central authors and
commenters?
While the previous section examines the global structure of the social network of
formal and informal collaboration, we now turn to a closer analysis of individual
academics. For every node in SF as well as for every node in SI we compute the
14

degree. For nodes that are in the respective giant components we additionally compute
betweenness centrality and eigenvector centrality. We also count, in our dataset,
the number of papers an author wrote and the number of times a commenter is
acknowledged. The number of published papers can be understood as measure of
productivity while the number of times a commenter is being acknowledged serves as
helpfulness measure (Oettl, 2012).
We compute Spearman correlation coefficients among all centrality measures in
both networks. We also correlate the measures with the number of papers per author
and the number of times the person has been acknowledged. Table 3 shows the
correlation coefficients for both timepoints (early networks in Panel A, late networks
in Panel B).
TABLE 3 ABOUT HERE
There are three interesting facts we want to highlight: First, being an author
with a high number of papers is positively, but not strongly correlated with being
a central author - except for betweenness centrality. Second, being an author with
a high number of published papers is only mildly correlated with being a frequently
acknowledged commenter (correlation is 0.33 in the early and 0.35 in the late time-
frame). Third, and most interestingly, central commenters are usually not central
authors–the highest correlation is 0.63, and between betweenness central commenters
are usually not betweenness central authors.
The low correlation between productive and central commenters suggests limited
scope for strategic acknowledging, by which authors try to steer editors.11 For ex-
ample, authors would mention well-known researchers in the field to signal quality.
Another possibility is to acknowledge peers having a reputation of being demanding
referees to prevent the editor picking the already acknowledged peer as referee to the
11Hamermesh (1991) defines strategic acknowledging as thanking "someone who has not seenthe paper, as a talisman against that person being chosen" as referee. He continues to write"DON’T PLAY THESE GAMES" (p. 171) [Emphasis in the original]. Editors however suggestedto us that they rarely look into the acknowledgements, and if so, to pick a referee.
15
paper. A third possibility is to acknowledge researchers that are socially close to the
editor, again as a signal to the editor (and the referee, in case of single-blind referee
processes). From our data it is visible, that it is precisely not the most productive
authors that are being acknowledged often.
To make our analysis more palpable, we list the 25 most central authors according
our two centrality definitions along with the 25 authors with the highest degree and
the 25 authors with the most papers in our dataset. Table 4 lists the authors from
the early timeframe while table 5 lists those for the late timeframe.12
TABLE 4 ABOUT HERE
TABLE 5 ABOUT HERE
Laband and Tollison (2003) compile a list of the most often thanked authors from
a sample of three general interest Economics journals over forty years. Our sample
however adopts a network view of a much more homogeneous sample. Table 6 lists 25
top nodes in terms of a) degree, b) betweenness centrality, c) eigenvector centrality
and d) number of thanks in the early timeframe (1998-2000). Table 7 does so for the
late timeframe (2009-2011).
TABLE 6 ABOUT HERE
TABLE 7 ABOUT HERE
Some of the great financial economists of our time are prominently featured in
the ranking. Again, it is apparent that often thanked scientists are not necessarily
those most central e.g. in terms of betweenness centrality.
It is worth noting that the rankings are only partially overlapping. For example, of
the 25 most thanked commenters in the late social network of informal collaboration,
only 11 are among the 25 researchers with the highest degree, nine are among the
25 most betweenness central researchers and ten are among the 25 most eigenvector
central researchers.12In the Online Appendix B we list the top 100 most central academics.
16

5. What determines centrality rank?
It is not only interesting to know the names of the most central researchers, but also
what they have in common. To this end, we explore the determinants of the 100 most
central financial economists in the social network of informal collaboration.
We explore the determinants of the rankings of two partially overlapping subsets
for each point in time: From the 100 most betweenness central researchers in the
late subset, only 35 are among the 100 most eigenvector central individuals and vice
versa. In the early subset there are 40 individuals that are both among the 100 most
betweenness central researchers and the 100 most eigenvector central researchers. For
this reason we report two distinct summary statistics per point in time. Table 8
presents the summary statistics for the early subset (1998-2000) and Table 10 those
for the late subset (2009-2011). All the characteristics but the last originate from the
author’s CV, which we obtain by conducting an internet search. The first column, N ,
indicates the number of persons for which the corresponding observation is available.
For example, not every CV is available, not every affiliation is ranked in the Tilburg
Economics University ranking, not every researcher indicated the year in which he
obtained his PhD in his CV, and so on.
Looking at the average top 100 researchers reveals some interesting insights on
who is acknowledged and who maintains a central position in the network. Table
10 presents summary statistics of individual characteristics for the 100 most often
acknowledged researchers (Panel A), the 100 most betweenness central researcher
(Panel B), and the 100 most eigenvector central researchers (Panel C). The average
top 100 most often acknowledged commenter has been trained at fairly high ranked
universities, works now at a much lower ranked university, is male (there are four
women in the ranking), has served nearly 13 journal-years as editor (each year per
journal counts as one year), is a member of either NBER or CEPR in half of the cases,
has received the PhD about 24 years ago and has been acknowledged 25 times. In
comparison, the average top 100 betweenness central researcher has been trained at
17
a lower ranked university. Both the average top 100 betweenness central researcher
and the average top 100 eigenvector central commenter work at higher ranked uni-
versities, are less often member of either NBER or CEPR, less senior and less often
acknowledged. There are differences among the most central commenters, too: the
average top 100 betweenness central commenters has been acknowledged less often, is
more senior and has served more years as editor than the average top 100 eigenvector
central commenter.
Table 8 ABOUT HERE
Table 10 ABOUT HERE
In contrast, Table 8 shows that all average top 100 individuals were much more
similar in the early subset. On average, all groups graduated from universities that
are ranked similarly, work at relatively equally ranked universities today, are male,
have worked 12.5 to 15 years as editor in total, are a member of NBER or CEPR
in every fourth case and look back on 26 to 28 years of experience. They have been
acknowledged on average about 10 times in the early subset.
We fit the following proportional odds model to study which characteristics ex-
plain a good placement in our rankings:
logit(p(Y ≤ g)) = β0g − (β1X1 + . . .+ β8X8) (g = 1, . . . , 99) (5)
where X1, . . . , X8 correspond to the eight variables described above. The correspond-
ing coefficients β1, . . . , β8 are proportional odds ratios and apply at the sample mean.
Their interpretations are similar to those of common logistic regressions: Increasing
the explanatory variable by 1 unit, the odds of being ranked 50 applying versus being
ranked lower are x times greater, where x is the coefficient.
Table 9 reports regression results for the early subset, while Table 11 reports
those for the late subset. In the first column, Y is the rank according the number of
acknowledgments, in the second column Y is the betweenness centrality rank and in
18

the third column Y is the rank according eigenvector centrality. Hence, a negative
coefficient would be associated with a higher rank.
Turning to the early subset (Table 9) first, the rank of the PhD institution as well
as the rank of the current affiliation have no statistically significantly effect on the
ranking, regardless of the dimension. There is weak evidence that female researchers
are higher ranked in the acknowledgment- and the betweenness centrality ranking
but lower ranked in the eigenvector centrality ranking. Having served many years as
editor is insignificantly associated with a high rank, except for betweenness centrality.
Being member of either NBER or CEPR is associated with a more central position,
but also with being acknowledged less often. There are decreasing negative seniority
effects for the rank eigenvector centrality.
Table 9 ABOUT HERE
Table 11 ABOUT HERE
In the late subset (Table 11), the ranking of the PhD affiliation is now positively
associated with a high rank, while women now experience a statistically insignificant
malus on all rankings. Having served many years as editor, however, is associated
with a lower acknowledgement-ranking. Being a member of either the NBER or
CEPR is associated with lower ranks in all specifications (the coefficient in the thanks
ranking is the only one being statistically significant, though). Non-trivial seniority
effects pertain in the late subset as well: The older a researcher becomes, the lower
his ranking according the number of thanks and eigenvector centrality until a tipping
point, after which ranks improve with age. The relationship for betweenness centrality
is the opposite, but with high standard deviations.
6. Concluding remarks
This paper highlights the importance of informal collaboration in our profession.
Informal collaboration is, in different shades, vital to other disciplines as well (Cronin,
19
1995). The investigation of informal collaboration, as well as the flow of information
they reveal, can help to understand differences in (perceived) quality among journals,
research papers and authors. They have implications for researchers, especially junior
ones, as they suggest to informally collaborate from the very first step of the career.
We document the structure of the social network of informal collaboration and
its evolution over time. There is a substantial difference between the social network
of formal collaboration, i.e. co-authorship, and the social network of informal collab-
oration. Focusing on co-authorship networks will therefore likely ignore important
channels of information transmission.
The next natural question to ask is whether receiving commentary from a col-
league increases the subsequent publication success of a research paper if the colleague
is more central in the social network of informal collaboration. One shortcoming of
our data is that the Tilburg ranking of universities does not include central banks
and other policy institutions but which engage in high-quality academic research. A
better suited ranking would include these institutions. Another closely related ques-
tion is in how far an adviser’s position in the social network of informal collaboration
affects the placement of PhD students. A vast literature on job referrals in labor
economics (see, for example, Kramarz and Skans (2014)) suggests such a relation.
Finally, Welch (2014) shows that referee recommendations differ significantly for the
same paper. It would be interesting to study whether social distance of a referee to the
author plays a role in the recommendation. Brogaard et al. (2014) show that having
an editor of a journal as visiting faculty increases the probability that papers of other
faculty members are published in the editor’s journal. But these papers receive more
than average citations, which motivates the hypothesis that additional information
(i.e. lower social distance) to an author would allow referee’s to make better informed
decisions about the paper’s "true" quality.
All these questions are relevant to the profession and our paper is merely a first
step towards a broader understanding of the role informal collaboration plays in the
creation of knowledge.
20

References
Azoulay, P., Graff Zivin, J. S. and Wang, J. (2010), ‘Superstar Extinction’, The
Quarterly Journal of Economics 125(2), 549–589.
Ballester, C., Calvó-Armengol, A. and Zenou, Y. (2006), ‘Who’s Who in Networks.
Wanted: The Key Player’, Econometrica 74(5), 1403–1417.
Barnett, A. H., Ault, R. W. and Kaserman, D. L. (1988), ‘The Rising Incidence of
Co-authorship in Economics: Further Evidence’, The Review of Economics and
Statistics 70(3), 539–43.
Bonacich, P. (1986), ‘Power and Centrality: A Family of Measures’, American Journal
of Sociology 92(5), 1170–1182.
Borokhovich, K. A., Bricker, R. J. and Simkins, B. J. (2000), ‘An Analysis of Finance
Journal Impact Factors’, The Journal of Finance 55(3), 1457–1469.
Brogaard, J., Engelberg, J. and Parsons, C. A. (2014), ‘Networks and produc-
tivity: Causal evidence from editor rotations’, Journal of Financial Economics
111(1), 251–270.
Cronin, B. (1995), The Scholar’s Courtesy: The Role of Acknowledgment in the Pri-
mary Communication Process, Taylor Graham, Los Angeles, CA.
Ductor, L., Fafchamps, M., Goyal, S. and Leij, M. J. V. D. (2014), ‘Social Networks
and Research Output’, The Review of Economics and Statistics 96(5), 936–948.
Fourcade, M., Ollion, E. and Algan, Y. (2015), ‘The Superiority of Economists’,
Journal of Economic Perspectives 29(1), 89–114.
Freeman, L. C. (1979), ‘Centrality in Social Networks Conceptual Clarification’, Social
Networks 1, 215–239.
21

Freeman, R. B. and Huang, W. (2015), ‘Collaborating with People Like Me: Ethnic
Co-authorship within the US’, Journal of Labor Economics 33(S1), S289–S318.
Goyal, S., van der Leij, M. J. and Maria-Gozalez, J. L. (2006), ‘Economics: An
Emerging Small World’, Journal of Political Economy 114, 403–412.
Green, R., O’Hara, M. and Schwert, G. W. (2002), ‘Joint editorial’, The Journal of
Finance 57(2), 1031–1032.
Hamermesh, D. S. (1991), ‘The Young Economist’s Guide to Professional Etiquette’,
The Journal of Economic Perspectives 6(1), 169–179.
Jackson, M. O. (2014), ‘Networks in the Understanding of Economic Behaviors’, Jour-
nal of Economic Perspectives 28(4), 3–22.
Kramarz, F. and Skans, O. N. (2014), ‘When Strong Ties are Strong: Networks and
Youth Labour Market Entry’, The Review of Economic Studies 81(3).
Laband, D. N. and Tollison, R. D. (2000), ‘Intellectual Collaboration’, Journal of
Political Economy 108(3), 632–661.
Laband, D. N. and Tollison, R. D. (2003), ‘Good colleagues’, Journal of Economic
Behavior & Organization 52(4), 505–512.
McDowell, J. M. and Melvin, M. (1983), ‘The Determinants of Co-Authorship: An
Analysis of the Economics Literature’, The Review of Economics and Statistics
65(1), 155–160.
Oettl, A. (2012), ‘Reconceptualizing Stars: Scientist Helpfulness and Peer Perfor-
mance’, Management Science 58(6), 1122–1140.
Phelps, C., Heidl, R. and Wadhwa, A. (2012), ‘Knowledge, Networks, and Knowledge
Networks: A Review and Research Agenda’, Journal of Management 38(4), 1115–
1166.
22

Thomson, W. (1999), ‘The Young Person’s Guide to Writing Economic Theory’, Jour-
nal of Economic Literature 37(1), 157–183.
Welch, I. (2014), ‘Referee Recommendations’, The Review of Financial Studies
27(9), 2773–2804.
Wuchty, S., Jones, B. F. and Uzzi, B. (2007), ‘The Increasing Dominance of Teams
in Production of Knowledge’, Science 316(5827), 1036–1039.
23
A. Appendix
A.1. Tables
Table 1: Global network measures for the social network of formal collaboration
temp Early (1998-200) Late (2009-2011)All General interest Field All General interest Field
Nodes 1265.00 722.00 618.00 3109.00 1423.00 1864.00Edges 1025.00 622.00 420.00 3229.00 1666.00 1597.00Components 502.00 264.00 299.00 903.00 310.00 730.00Giant component 53.00 27.00 20.00 601.00 398.00 45.00Density 0.06 0.11 0.16 0.01 0.01 0.06Avg. path length 5.16 4.37 2.66 10.76 10.10 4.31Diameter 13.00 10.00 5.00 27.00 24.00 9.00
Note: General interest contains only the general interest journals JF, JFE, andRFS. Field contains the field journals JFI, JMCB, and JBF. The variables “Avg.path length” and “Diameter” were calculated using the giant component only.
Table 2: Global network measures for the social network of informal collaboration
temp Early (1998-200) Late (2009-2011)All General interest Field All General interest Field
Nodes 3457.00 2256.00 1658.00 7573.00 4387.00 4515.00Edges 11829.00 8739.00 3200.00 35495.00 25243.00 10594.00Components 75.00 14.00 96.00 171.00 7.00 228.00Giant component 3188.00 2217.00 1225.00 7056.00 4366.00 3726.00Density 0.00 0.00 0.00 0.00 0.00 0.00Avg. path length 4.59 4.04 5.84 4.52 3.79 6.23Diameter 11.00 8.00 13.00 17.00 8.00 17.00
Note: General interest contains only the general interest journals JF, JFE, andRFS. Field contains the field journals JFI, JMCB, and JBF. The variables “Avg.path length” and “Diameter” were calculated using the giant component only.
24
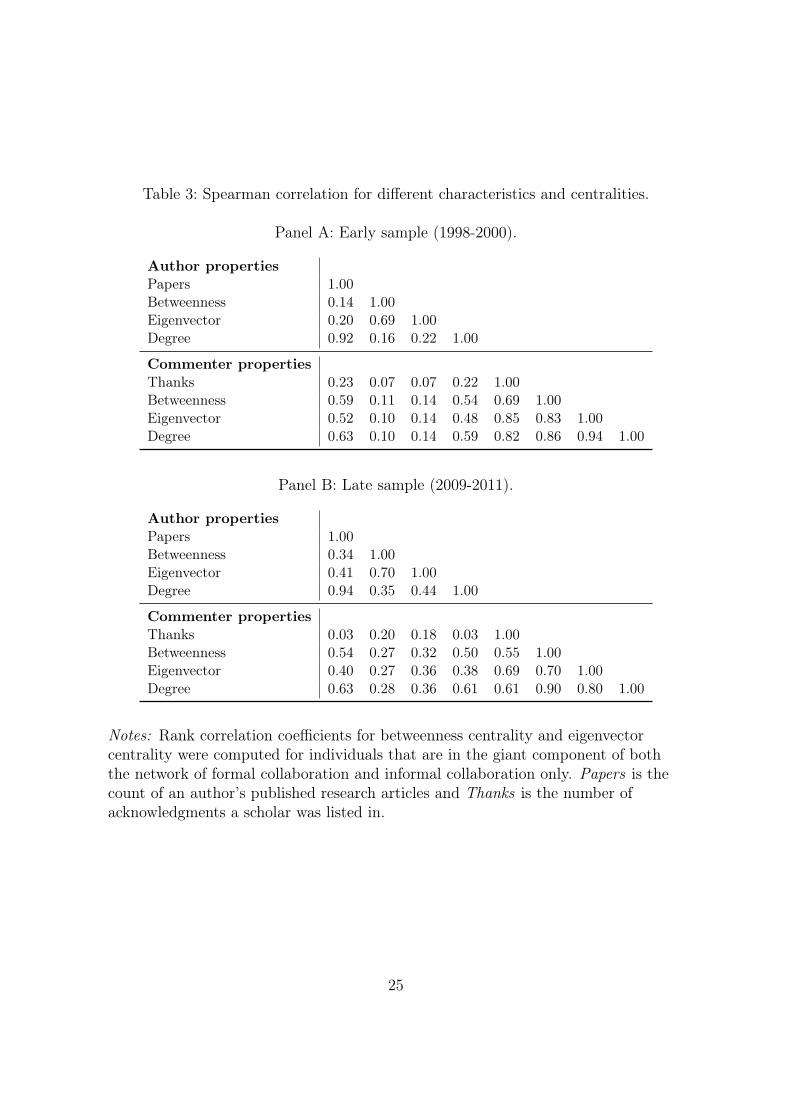
Table 3: Spearman correlation for different characteristics and centralities.
Panel A: Early sample (1998-2000).
Author propertiesPapers 1.00Betweenness 0.14 1.00Eigenvector 0.20 0.69 1.00Degree 0.92 0.16 0.22 1.00
Commenter propertiesThanks 0.23 0.07 0.07 0.22 1.00Betweenness 0.59 0.11 0.14 0.54 0.69 1.00Eigenvector 0.52 0.10 0.14 0.48 0.85 0.83 1.00Degree 0.63 0.10 0.14 0.59 0.82 0.86 0.94 1.00
Panel B: Late sample (2009-2011).
Author propertiesPapers 1.00Betweenness 0.34 1.00Eigenvector 0.41 0.70 1.00Degree 0.94 0.35 0.44 1.00
Commenter propertiesThanks 0.03 0.20 0.18 0.03 1.00Betweenness 0.54 0.27 0.32 0.50 0.55 1.00Eigenvector 0.40 0.27 0.36 0.38 0.69 0.70 1.00Degree 0.63 0.28 0.36 0.61 0.61 0.90 0.80 1.00
Notes: Rank correlation coefficients for betweenness centrality and eigenvectorcentrality were computed for individuals that are in the giant component of boththe network of formal collaboration and informal collaboration only. Papers is thecount of an author’s published research articles and Thanks is the number ofacknowledgments a scholar was listed in.
25

Table 4: Top 25 researchers in the social network of formal collaboration in the early subsample (1998-200) according todifferent defintions.
# of Papers Betweenness Eigenvector Degree
1 Anthony Saunders (8) 1 Anthony Saunders (8) 1 Allen N Berger (6) 1 Allen N Berger (6)2 Allen N Berger (6) 2 Allen N Berger (6) 2 Anthony Saunders (8) 2 Anthony Saunders (8)2 Arnoud Wa Boot (6) 3 Kose John (3) 3 Gregory F Udell (2) 3 Avanidhar Subrahmanyam (5)4 Avanidhar Subrahmanyam (5) 4 Rangarajan K Sundaram (2) 4 J David Cummins (2) 3 Michael J Barclay (3)4 Eugene F Fama (5) 5 David L Yermack (3) 4 Mary A Weiss (2) 3 Michael S Weisbach (5)4 Maureen O’Hara (5) 6 Anil Shivdasani (2) 6 Joseph M Scalise (1) 3 Rene M Stulz (3)4 Michael S Weisbach (5) 7 Jun-Koo Kang (2) 7 Diana Hancock (3) 7 Jeffrey L Coles (3)4 Paul A Gompers (5) 8 Rene M Stulz (3) 8 Hongmin Zi (1) 7 Jeffry M Netter (2)4 Paul H Schultz (5) 9 Mark J Flannery (3) 9 Berry K Wilson (3) 7 Larry Hp Lang (3)
10 Andrei Shleifer (4) 10 Joel F Houston (3) 10 Daniel M Covitz (1) 7 Roni Michaely (4)10 Andrew W Lo (4) 11 Berry K Wilson (3) 11 Seth D Bonime (1) 7 Wayne E Ferson (3)10 Anjan V Thakor (4) 11 Diana Hancock (3) 12 Mark J Flannery (3) 7 William L Megginson (3)10 Bruce D Smith (4) 11 Michael D Ryngaert (3) 13 Kose John (3) 13 Andrew D Clare (3)10 Charles M Kahn (4) 11 Tim Opler (2) 14 Philip E Strahan (2) 13 Andrew W Lo (4)10 Edward J Kane (4) 15 Gerard Caprio (1) 15 Sally M Davies (1) 13 Diana Hancock (3)10 Eugene Kandel (4) 16 Edward J Kane (4) 16 Rebecca S Demsetz (1) 13 Eugene Kandel (4)10 Franklin Allen (4) 16 Eli Ofek (2) 17 Lemma W Senbet (2) 13 Hamid Mehran (3)10 Harrison Hong (4) 16 Manju Puri (3) 18 Gerard Caprio (1) 13 Kent L Womack (3)10 Ivo Welch (4) 16 Philip E Strahan (2) 19 Manju Puri (3) 13 Maureen O’Hara (5)10 Jeremy C Stein (4) 20 David B Humphrey (1) 20 Amar Gande (1) 13 Philip H Dybvig (3)10 John R Graham (4) 21 J David Cummins (2) 22 Jianping Mei (1) 13 Randall Morck (3)10 Joshua Lerner (4) 21 Mary A Weiss (2) 21 Lazarus A Angbazo (1) 13 Reena Aggarwal (4)10 Kenneth R French (4) 23 Joseph M Scalise (1) 23 Sharon Tennyson (1) 13 Tim Opler (2)10 Loretta J Mester (4) 24 Hongmin Zi (1) 24 James A Wilcox (2) 24 Ananth Madhavan (3)10 Lubos Pastor (4) 24 Sharon Tennyson (1) 25 David B Humphrey (1) 24 Andrei Shleifer (4)
Notes: Table lists top researchers in the network in terms of number of authored papers in our dataset, betweennesscentrality, eigenvector centraliy and degree (neighbor count). Betweenness centrality of a researcher in the social networkof informal collaboration is the probability that she is on the shortest path between any two other nodes (equation7). Eigenvector centrality of a researcher in the social network of informal collaboration is the weighted count of hernetwork neighbors, where the weights correspond to the neighbors’ eigenvector centrality (equation 9). Both centralitieswere calculated using the largest connected network component. Numbers in parentheses indicate the number of paperswritten in our dataset. Affiliation below name is the main affiliation as indicated on the last paper published during thistime.
26

Table 5: Top 25 researchers in the social network of formal collaboration in the late subsample (2009-2011) according todifferent defintions.
# of Papers Betweenness Eigenvector Degree
1 Rene M Stulz (11) 1 Kose John (4) 1 Chen Lin (8) 1 Rene M Stulz (11)2 Thomas J Chemmanur (9) 2 Itay Goldstein (4) 2 Yue Ma (5) 2 Chen Lin (8)3 Alex Edmans (8) 3 Lucian A Bebchuk (5) 3 Joel F Houston (2) 3 Massimo Massa (8)3 Allen N Berger (8) 4 Kj Martijn Cremers (4) 4 Yuhai Xuan (3) 3 Shane A Johnson (4)3 Chen Lin (8) 5 Alon Brav (3) 5 Ping Lin (2) 3 Thomas J Chemmanur (9)3 Massimo Massa (8) 6 Vinay B Nair (3) 6 Hong Zou (2) 3 Viral V Acharya (8)3 Richard Roll (8) 7 John R Graham (4) 7 Murillo Campello (5) 7 Allen N Berger (8)3 Robin Greenwood (8) 8 Viral V Acharya (8) 8 Paul H Malatesta (2) 7 Geert Bekaert (6)3 Viral V Acharya (8) 9 Iftekhar Hasan (7) 9 Frank M Song (1) 9 Anthony Saunders (4)
10 Iftekhar Hasan (7) 10 Miguel A Ferreira (5) 10 James R Barth (1) 9 David A Hirshleifer (6)10 Philip E Strahan (7) 11 Michael W Brandt (4) 11 Micah S Officer (3) 9 Iftekhar Hasan (7)12 Amir Sufi (6) 12 Pedro Santa-Clara (2) 12 Michael Firth (2) 12 Chunchi Wu (6)12 Avanidhar Subrahmanyam (6) 13 Campbell R Harvey (3) 14 Ping Liu (1) 12 Dimitry Livdan (6)12 Chunchi Wu (6) 14 Allen N Berger (8) 13 Sonia Ml Wong (1) 12 Gerald J Lobo (5)12 David A Hirshleifer (6) 15 Anthony Saunders (4) 15 John R Graham (4) 12 Henk Berkman (4)12 Dimitry Livdan (6) 16 Bruce I Carlin (4) 16 Campbell R Harvey (3) 12 Kose John (4)12 Geert Bekaert (6) 17 Augustin Landier (3) 17 Heitor W Almeida (3) 12 Murillo Campello (5)12 Rudiger Fahlenbrach (6) 18 Simon Gervais (2) 18 Erasmo Giambona (2) 12 Steven Ongena (6)12 Steven Ongena (6) 19 S Viswanathan (4) 19 Dirk Hackbarth (2) 12 Yan Leung Cheung (3)12 Victoria Ivashina (6) 20 Terrance Odean (3) 20 Antonio F Galvao (1) 20 Alok Kumar (5)21 Adair Morse (5) 21 Erasmo Giambona (2) 21 Kathryn L Dewenter (1) 20 Haitao Li (4)21 Alok Kumar (5) 22 Victoria Ivashina (6) 22 Xi Han (1) 20 Ilya A Strebulaev (5)21 Amiyatosh K Purnanandam (5) 23 Murillo Campello (5) 23 Oguzhan Ozbas (5) 20 John R Graham (4)21 Berk A Sensoy (5) 24 Micah S Officer (3) 24 Berk A Sensoy (5) 20 Jorg Rocholl (5)21 Christopher A Hennessy (5) 25 Rene M Stulz (11) 25 Geert Bekaert (6) 20 Karl V Lins (3)
Notes: Table lists top researchers in the network in terms of number of authored papers in our dataset, betweennesscentrality, eigenvector centraliy and degree (neighbor count). Betweenness centrality of a researcher in the social networkof informal collaboration is the probability that she is on the shortest path between any two other nodes (equation7). Eigenvector centrality of a researcher in the social network of informal collaboration is the weighted count of hernetwork neighbors, where the weights correspond to the neighbors’ eigenvector centrality (equation 9). Both centralitieswere calculated using the largest connected network component. Numbers in parentheses indicate the number of paperswritten in our dataset. Affiliation below name is the main affiliation as indicated on the last paper published during thistime.
27
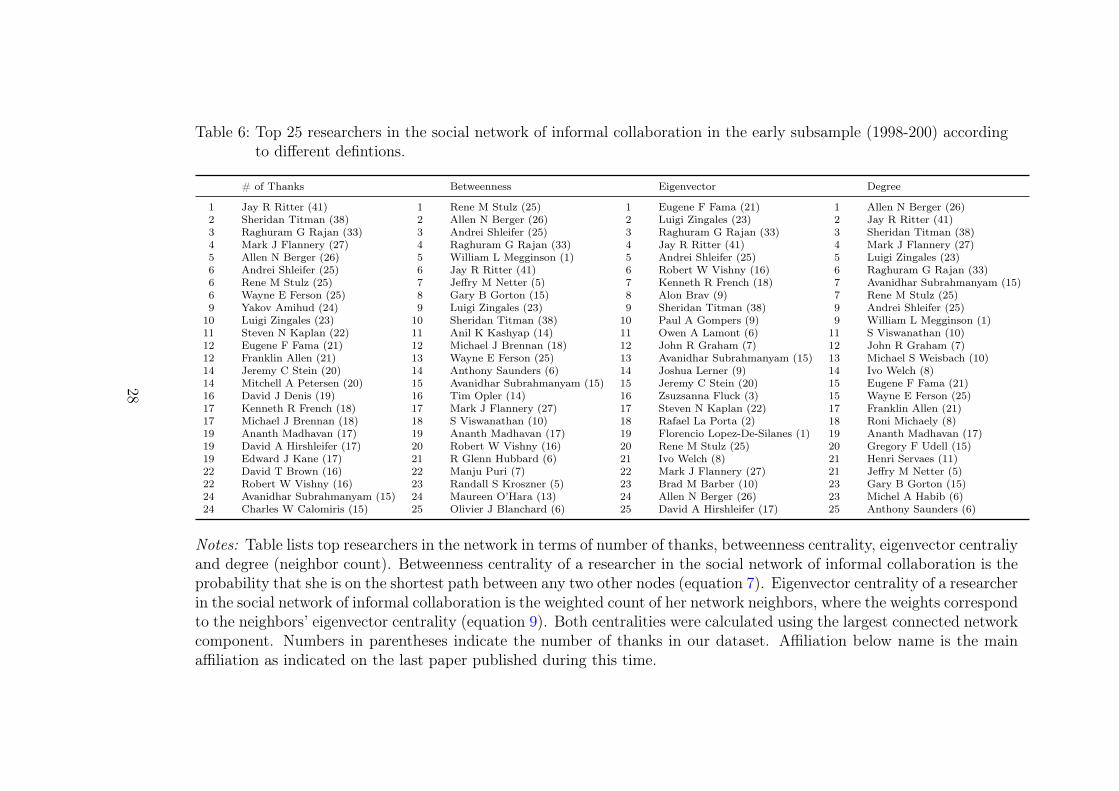
Table 6: Top 25 researchers in the social network of informal collaboration in the early subsample (1998-200) accordingto different defintions.
# of Thanks Betweenness Eigenvector Degree
1 Jay R Ritter (41) 1 Rene M Stulz (25) 1 Eugene F Fama (21) 1 Allen N Berger (26)2 Sheridan Titman (38) 2 Allen N Berger (26) 2 Luigi Zingales (23) 2 Jay R Ritter (41)3 Raghuram G Rajan (33) 3 Andrei Shleifer (25) 3 Raghuram G Rajan (33) 3 Sheridan Titman (38)4 Mark J Flannery (27) 4 Raghuram G Rajan (33) 4 Jay R Ritter (41) 4 Mark J Flannery (27)5 Allen N Berger (26) 5 William L Megginson (1) 5 Andrei Shleifer (25) 5 Luigi Zingales (23)6 Andrei Shleifer (25) 6 Jay R Ritter (41) 6 Robert W Vishny (16) 6 Raghuram G Rajan (33)6 Rene M Stulz (25) 7 Jeffry M Netter (5) 7 Kenneth R French (18) 7 Avanidhar Subrahmanyam (15)6 Wayne E Ferson (25) 8 Gary B Gorton (15) 8 Alon Brav (9) 7 Rene M Stulz (25)9 Yakov Amihud (24) 9 Luigi Zingales (23) 9 Sheridan Titman (38) 9 Andrei Shleifer (25)
10 Luigi Zingales (23) 10 Sheridan Titman (38) 10 Paul A Gompers (9) 9 William L Megginson (1)11 Steven N Kaplan (22) 11 Anil K Kashyap (14) 11 Owen A Lamont (6) 11 S Viswanathan (10)12 Eugene F Fama (21) 12 Michael J Brennan (18) 12 John R Graham (7) 12 John R Graham (7)12 Franklin Allen (21) 13 Wayne E Ferson (25) 13 Avanidhar Subrahmanyam (15) 13 Michael S Weisbach (10)14 Jeremy C Stein (20) 14 Anthony Saunders (6) 14 Joshua Lerner (9) 14 Ivo Welch (8)14 Mitchell A Petersen (20) 15 Avanidhar Subrahmanyam (15) 15 Jeremy C Stein (20) 15 Eugene F Fama (21)16 David J Denis (19) 16 Tim Opler (14) 16 Zsuzsanna Fluck (3) 15 Wayne E Ferson (25)17 Kenneth R French (18) 17 Mark J Flannery (27) 17 Steven N Kaplan (22) 17 Franklin Allen (21)17 Michael J Brennan (18) 18 S Viswanathan (10) 18 Rafael La Porta (2) 18 Roni Michaely (8)19 Ananth Madhavan (17) 19 Ananth Madhavan (17) 19 Florencio Lopez-De-Silanes (1) 19 Ananth Madhavan (17)19 David A Hirshleifer (17) 20 Robert W Vishny (16) 20 Rene M Stulz (25) 20 Gregory F Udell (15)19 Edward J Kane (17) 21 R Glenn Hubbard (6) 21 Ivo Welch (8) 21 Henri Servaes (11)22 David T Brown (16) 22 Manju Puri (7) 22 Mark J Flannery (27) 21 Jeffry M Netter (5)22 Robert W Vishny (16) 23 Randall S Kroszner (5) 23 Brad M Barber (10) 23 Gary B Gorton (15)24 Avanidhar Subrahmanyam (15) 24 Maureen O’Hara (13) 24 Allen N Berger (26) 23 Michel A Habib (6)24 Charles W Calomiris (15) 25 Olivier J Blanchard (6) 25 David A Hirshleifer (17) 25 Anthony Saunders (6)
Notes: Table lists top researchers in the network in terms of number of thanks, betweenness centrality, eigenvector centraliyand degree (neighbor count). Betweenness centrality of a researcher in the social network of informal collaboration is theprobability that she is on the shortest path between any two other nodes (equation 7). Eigenvector centrality of a researcherin the social network of informal collaboration is the weighted count of her network neighbors, where the weights correspondto the neighbors’ eigenvector centrality (equation 9). Both centralities were calculated using the largest connected networkcomponent. Numbers in parentheses indicate the number of thanks in our dataset. Affiliation below name is the mainaffiliation as indicated on the last paper published during this time.
28
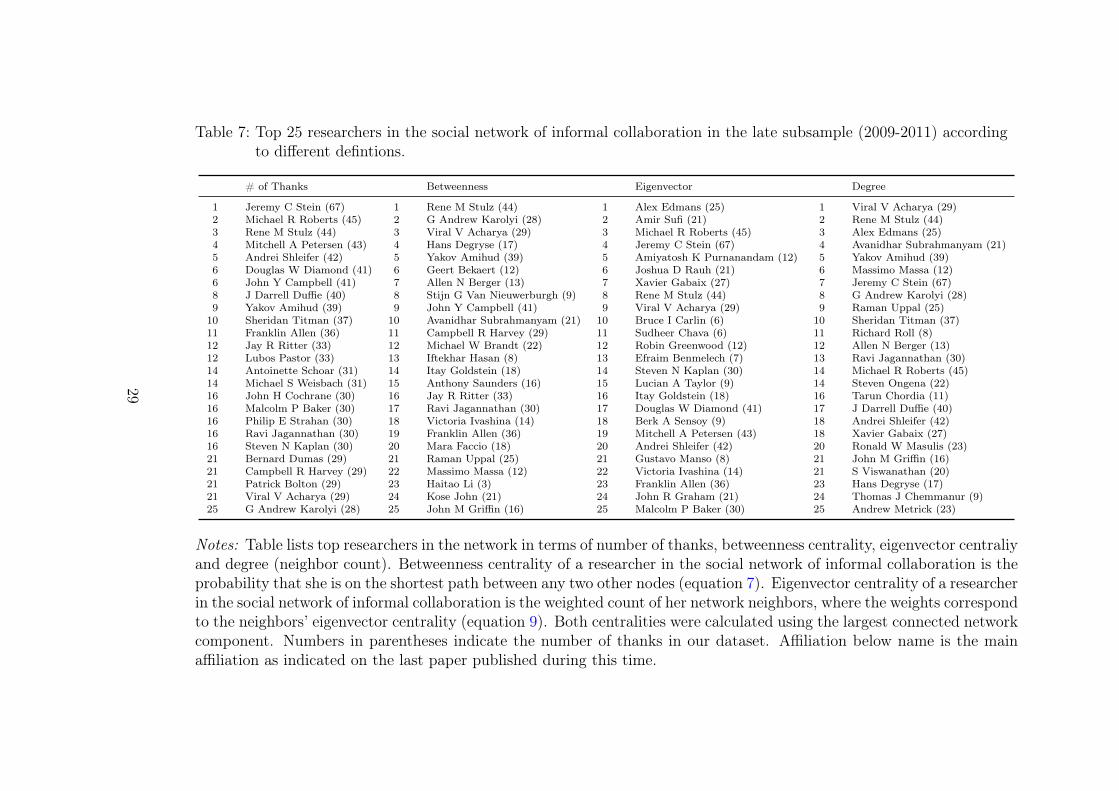
Table 7: Top 25 researchers in the social network of informal collaboration in the late subsample (2009-2011) accordingto different defintions.
# of Thanks Betweenness Eigenvector Degree
1 Jeremy C Stein (67) 1 Rene M Stulz (44) 1 Alex Edmans (25) 1 Viral V Acharya (29)2 Michael R Roberts (45) 2 G Andrew Karolyi (28) 2 Amir Sufi (21) 2 Rene M Stulz (44)3 Rene M Stulz (44) 3 Viral V Acharya (29) 3 Michael R Roberts (45) 3 Alex Edmans (25)4 Mitchell A Petersen (43) 4 Hans Degryse (17) 4 Jeremy C Stein (67) 4 Avanidhar Subrahmanyam (21)5 Andrei Shleifer (42) 5 Yakov Amihud (39) 5 Amiyatosh K Purnanandam (12) 5 Yakov Amihud (39)6 Douglas W Diamond (41) 6 Geert Bekaert (12) 6 Joshua D Rauh (21) 6 Massimo Massa (12)6 John Y Campbell (41) 7 Allen N Berger (13) 7 Xavier Gabaix (27) 7 Jeremy C Stein (67)8 J Darrell Duffie (40) 8 Stijn G Van Nieuwerburgh (9) 8 Rene M Stulz (44) 8 G Andrew Karolyi (28)9 Yakov Amihud (39) 9 John Y Campbell (41) 9 Viral V Acharya (29) 9 Raman Uppal (25)
10 Sheridan Titman (37) 10 Avanidhar Subrahmanyam (21) 10 Bruce I Carlin (6) 10 Sheridan Titman (37)11 Franklin Allen (36) 11 Campbell R Harvey (29) 11 Sudheer Chava (6) 11 Richard Roll (8)12 Jay R Ritter (33) 12 Michael W Brandt (22) 12 Robin Greenwood (12) 12 Allen N Berger (13)12 Lubos Pastor (33) 13 Iftekhar Hasan (8) 13 Efraim Benmelech (7) 13 Ravi Jagannathan (30)14 Antoinette Schoar (31) 14 Itay Goldstein (18) 14 Steven N Kaplan (30) 14 Michael R Roberts (45)14 Michael S Weisbach (31) 15 Anthony Saunders (16) 15 Lucian A Taylor (9) 14 Steven Ongena (22)16 John H Cochrane (30) 16 Jay R Ritter (33) 16 Itay Goldstein (18) 16 Tarun Chordia (11)16 Malcolm P Baker (30) 17 Ravi Jagannathan (30) 17 Douglas W Diamond (41) 17 J Darrell Duffie (40)16 Philip E Strahan (30) 18 Victoria Ivashina (14) 18 Berk A Sensoy (9) 18 Andrei Shleifer (42)16 Ravi Jagannathan (30) 19 Franklin Allen (36) 19 Mitchell A Petersen (43) 18 Xavier Gabaix (27)16 Steven N Kaplan (30) 20 Mara Faccio (18) 20 Andrei Shleifer (42) 20 Ronald W Masulis (23)21 Bernard Dumas (29) 21 Raman Uppal (25) 21 Gustavo Manso (8) 21 John M Griffin (16)21 Campbell R Harvey (29) 22 Massimo Massa (12) 22 Victoria Ivashina (14) 21 S Viswanathan (20)21 Patrick Bolton (29) 23 Haitao Li (3) 23 Franklin Allen (36) 23 Hans Degryse (17)21 Viral V Acharya (29) 24 Kose John (21) 24 John R Graham (21) 24 Thomas J Chemmanur (9)25 G Andrew Karolyi (28) 25 John M Griffin (16) 25 Malcolm P Baker (30) 25 Andrew Metrick (23)
Notes: Table lists top researchers in the network in terms of number of thanks, betweenness centrality, eigenvector centraliyand degree (neighbor count). Betweenness centrality of a researcher in the social network of informal collaboration is theprobability that she is on the shortest path between any two other nodes (equation 7). Eigenvector centrality of a researcherin the social network of informal collaboration is the weighted count of her network neighbors, where the weights correspondto the neighbors’ eigenvector centrality (equation 9). Both centralities were calculated using the largest connected networkcomponent. Numbers in parentheses indicate the number of thanks in our dataset. Affiliation below name is the mainaffiliation as indicated on the last paper published during this time.
29
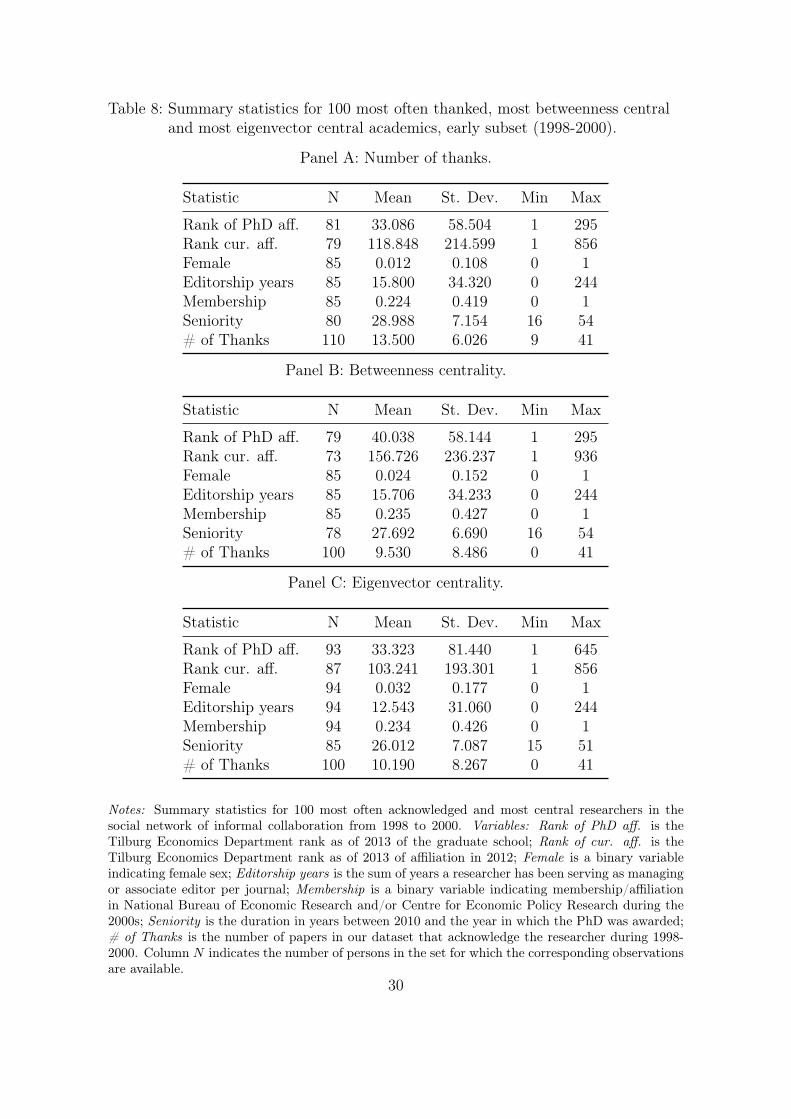
Table 8: Summary statistics for 100 most often thanked, most betweenness centraland most eigenvector central academics, early subset (1998-2000).
Panel A: Number of thanks.
Statistic N Mean St. Dev. Min Max
Rank of PhD aff. 81 33.086 58.504 1 295Rank cur. aff. 79 118.848 214.599 1 856Female 85 0.012 0.108 0 1Editorship years 85 15.800 34.320 0 244Membership 85 0.224 0.419 0 1Seniority 80 28.988 7.154 16 54# of Thanks 110 13.500 6.026 9 41
Panel B: Betweenness centrality.
Statistic N Mean St. Dev. Min Max
Rank of PhD aff. 79 40.038 58.144 1 295Rank cur. aff. 73 156.726 236.237 1 936Female 85 0.024 0.152 0 1Editorship years 85 15.706 34.233 0 244Membership 85 0.235 0.427 0 1Seniority 78 27.692 6.690 16 54# of Thanks 100 9.530 8.486 0 41
Panel C: Eigenvector centrality.
Statistic N Mean St. Dev. Min Max
Rank of PhD aff. 93 33.323 81.440 1 645Rank cur. aff. 87 103.241 193.301 1 856Female 94 0.032 0.177 0 1Editorship years 94 12.543 31.060 0 244Membership 94 0.234 0.426 0 1Seniority 85 26.012 7.087 15 51# of Thanks 100 10.190 8.267 0 41
Notes: Summary statistics for 100 most often acknowledged and most central researchers in thesocial network of informal collaboration from 1998 to 2000. Variables: Rank of PhD aff. is theTilburg Economics Department rank as of 2013 of the graduate school; Rank of cur. aff. is theTilburg Economics Department rank as of 2013 of affiliation in 2012; Female is a binary variableindicating female sex; Editorship years is the sum of years a researcher has been serving as managingor associate editor per journal; Membership is a binary variable indicating membership/affiliationin National Bureau of Economic Research and/or Centre for Economic Policy Research during the2000s; Seniority is the duration in years between 2010 and the year in which the PhD was awarded;# of Thanks is the number of papers in our dataset that acknowledge the researcher during 1998-2000. Column N indicates the number of persons in the set for which the corresponding observationsare available.
30
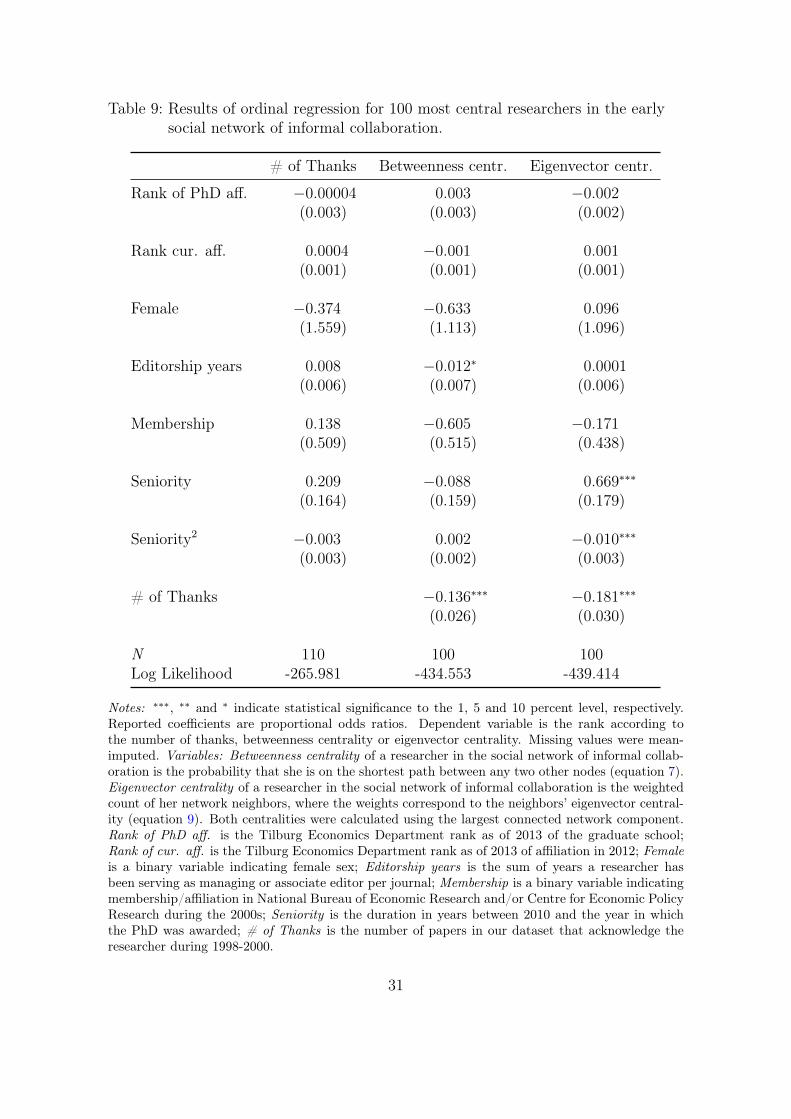
Table 9: Results of ordinal regression for 100 most central researchers in the earlysocial network of informal collaboration.
# of Thanks Betweenness centr. Eigenvector centr.
Rank of PhD aff. −0.00004 0.003 −0.002(0.003) (0.003) (0.002)
Rank cur. aff. 0.0004 −0.001 0.001(0.001) (0.001) (0.001)
Female −0.374 −0.633 0.096(1.559) (1.113) (1.096)
Editorship years 0.008 −0.012∗ 0.0001(0.006) (0.007) (0.006)
Membership 0.138 −0.605 −0.171(0.509) (0.515) (0.438)
Seniority 0.209 −0.088 0.669∗∗∗
(0.164) (0.159) (0.179)
Seniority2 −0.003 0.002 −0.010∗∗∗
(0.003) (0.002) (0.003)
# of Thanks −0.136∗∗∗ −0.181∗∗∗
(0.026) (0.030)
N 110 100 100Log Likelihood -265.981 -434.553 -439.414
Notes: ∗∗∗, ∗∗ and ∗ indicate statistical significance to the 1, 5 and 10 percent level, respectively.Reported coefficients are proportional odds ratios. Dependent variable is the rank according tothe number of thanks, betweenness centrality or eigenvector centrality. Missing values were mean-imputed. Variables: Betweenness centrality of a researcher in the social network of informal collab-oration is the probability that she is on the shortest path between any two other nodes (equation 7).Eigenvector centrality of a researcher in the social network of informal collaboration is the weightedcount of her network neighbors, where the weights correspond to the neighbors’ eigenvector central-ity (equation 9). Both centralities were calculated using the largest connected network component.Rank of PhD aff. is the Tilburg Economics Department rank as of 2013 of the graduate school;Rank of cur. aff. is the Tilburg Economics Department rank as of 2013 of affiliation in 2012; Femaleis a binary variable indicating female sex; Editorship years is the sum of years a researcher hasbeen serving as managing or associate editor per journal; Membership is a binary variable indicatingmembership/affiliation in National Bureau of Economic Research and/or Centre for Economic PolicyResearch during the 2000s; Seniority is the duration in years between 2010 and the year in whichthe PhD was awarded; # of Thanks is the number of papers in our dataset that acknowledge theresearcher during 1998-2000.
31

Table 10: Summary statistics for 100 most often thanked, most betweenness centraland most eigenvector central academics, late subset (2009-2011).
Panel A: Number of thanks.
Statistic N Mean St. Dev. Min Max
Rank of PhD aff. 86 48.709 138.625 1 911Rank cur. aff. 80 110.200 209.594 1 781Female 88 0.068 0.254 0 1Editorship years 88 12.193 31.898 0 244Membership 88 0.443 0.500 0 1Seniority 84 23.440 9.341 7 51# of Thanks 104 24.615 8.056 17 67
Panel B: Betweenness centrality.
Statistic N Mean St. Dev. Min Max
Rank of PhD aff. 93 78.151 144.065 1 911Rank cur. aff. 82 149.341 207.487 1 781Female 95 0.053 0.224 0 1Editorship years 95 12.958 35.255 0 244Membership 95 0.221 0.417 0 1Seniority 86 21.849 9.414 7 46# of Thanks 100 15.760 11.835 0 67
Panel C: Eigenvector centrality.
Statistic N Mean St. Dev. Min Max
Rank of PhD aff. 97 29.010 90.882 1 659Rank cur. aff. 96 125.635 232.466 1 781Female 99 0.040 0.198 0 1Editorship years 99 9.909 32.704 0 244Membership 99 0.374 0.486 0 1Seniority 98 17.653 9.627 5 50# of Thanks 100 19.110 11.770 2 67
Notes: Summary statistics for 100 most often acknowledged and most central researchers in thesocial network of informal collaboration from 2009 to 2011. Variables: Rank of PhD aff. is theTilburg Economics Department rank as of 2013 of the graduate school; Rank of cur. aff. is theTilburg Economics Department rank as of 2013 of affiliation in 2012; Female is a binary variableindicating female sex; Editorship years is the sum of years a researcher has been serving as managingor associate editor per journal; Membership is a binary variable indicating membership/affiliationin National Bureau of Economic Research and/or Centre for Economic Policy Research during the2000s; Seniority is the duration in years between 2010 and the year in which the PhD was awarded;# of Thanks is the number of papers in our dataset that acknowledge the researcher during 2009-2011. Column N indicates the number of persons in the set for which the corresponding observationsare available.
32
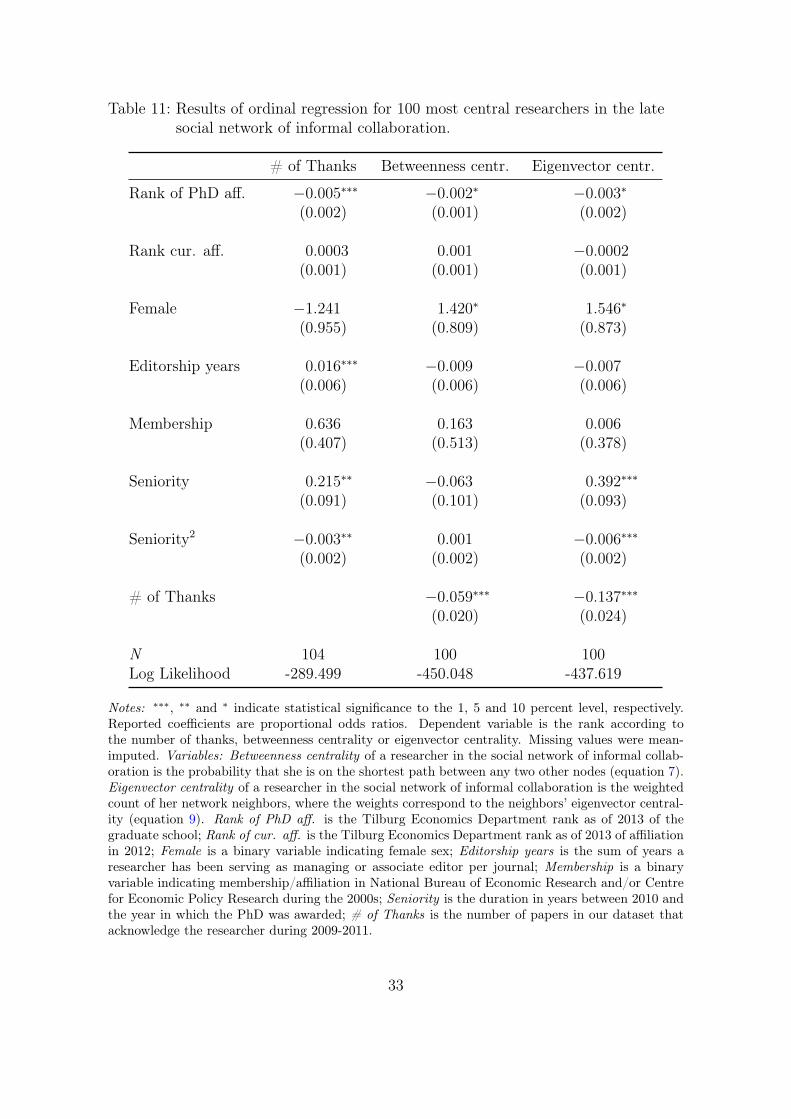
Table 11: Results of ordinal regression for 100 most central researchers in the latesocial network of informal collaboration.
# of Thanks Betweenness centr. Eigenvector centr.
Rank of PhD aff. −0.005∗∗∗ −0.002∗ −0.003∗
(0.002) (0.001) (0.002)
Rank cur. aff. 0.0003 0.001 −0.0002(0.001) (0.001) (0.001)
Female −1.241 1.420∗ 1.546∗
(0.955) (0.809) (0.873)
Editorship years 0.016∗∗∗ −0.009 −0.007(0.006) (0.006) (0.006)
Membership 0.636 0.163 0.006(0.407) (0.513) (0.378)
Seniority 0.215∗∗ −0.063 0.392∗∗∗
(0.091) (0.101) (0.093)
Seniority2 −0.003∗∗ 0.001 −0.006∗∗∗
(0.002) (0.002) (0.002)
# of Thanks −0.059∗∗∗ −0.137∗∗∗
(0.020) (0.024)
N 104 100 100Log Likelihood -289.499 -450.048 -437.619
Notes: ∗∗∗, ∗∗ and ∗ indicate statistical significance to the 1, 5 and 10 percent level, respectively.Reported coefficients are proportional odds ratios. Dependent variable is the rank according tothe number of thanks, betweenness centrality or eigenvector centrality. Missing values were mean-imputed. Variables: Betweenness centrality of a researcher in the social network of informal collab-oration is the probability that she is on the shortest path between any two other nodes (equation 7).Eigenvector centrality of a researcher in the social network of informal collaboration is the weightedcount of her network neighbors, where the weights correspond to the neighbors’ eigenvector central-ity (equation 9). Rank of PhD aff. is the Tilburg Economics Department rank as of 2013 of thegraduate school; Rank of cur. aff. is the Tilburg Economics Department rank as of 2013 of affiliationin 2012; Female is a binary variable indicating female sex; Editorship years is the sum of years aresearcher has been serving as managing or associate editor per journal; Membership is a binaryvariable indicating membership/affiliation in National Bureau of Economic Research and/or Centrefor Economic Policy Research during the 2000s; Seniority is the duration in years between 2010 andthe year in which the PhD was awarded; # of Thanks is the number of papers in our dataset thatacknowledge the researcher during 2009-2011.
33
A.2. Figures
Figure 1: Share of articles with and without acknowledgements per journal andyear.
1998 1999 2000 2009 2010 2011
0.15
0.25
0.50
0.75
0.90
with without with without with without with without with without with without
Journal
JF
RFS
JFE
JFI
JMCB
JBF
Notes: Graph shows share of articles with (left bar) and without acknowledgments (right bar) foreach year. Colors correspond to journals, where reddish colors refer to general interest journals.
34
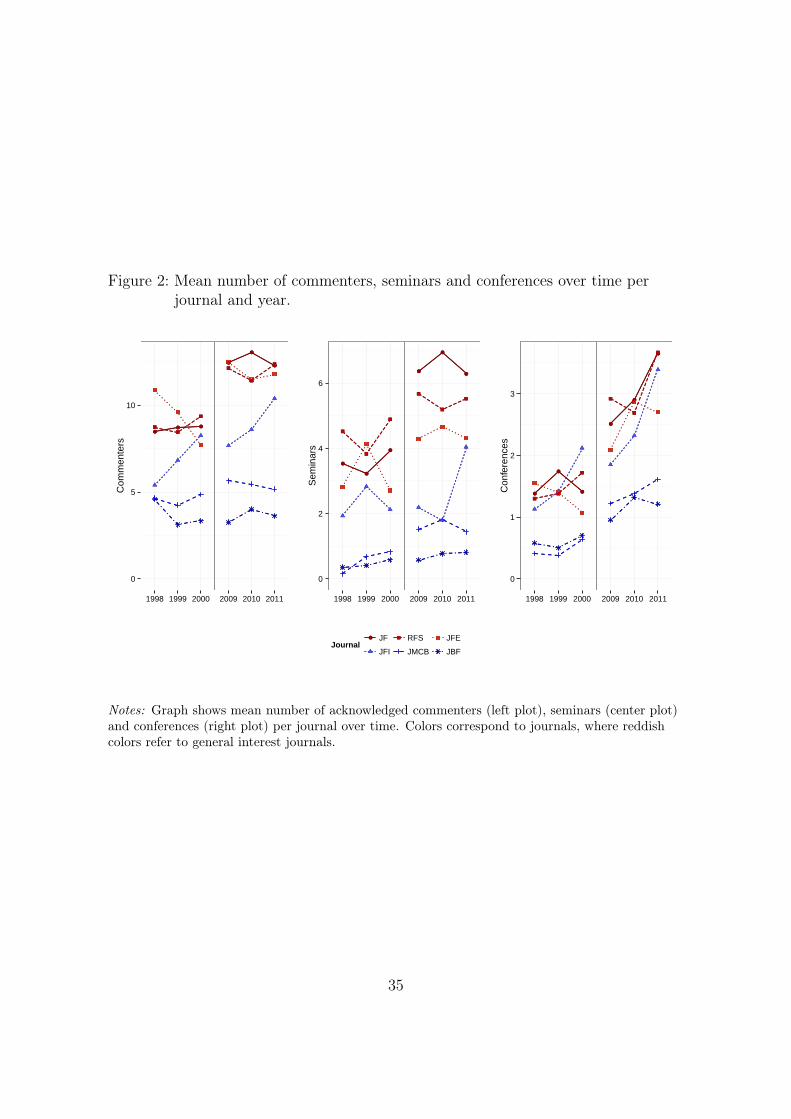
Figure 2: Mean number of commenters, seminars and conferences over time perjournal and year.
●● ●
●● ●
●
●
●●
●
●
0
5
10
1998 1999 2000 2009 2010 2011
Com
men
ters
●
●
●
●
●
●
●
●
●●
●
●
0
2
4
6
1998 1999 2000 2009 2010 2011
Sem
inar
s
●
●
●●
●
●
●
●
●
●
●
●
0
1
2
3
1998 1999 2000 2009 2010 2011
Con
fere
nces
Journal●● JF
JFI
RFS
JMCB
JFE
JBF
Notes: Graph shows mean number of acknowledged commenters (left plot), seminars (center plot)and conferences (right plot) per journal over time. Colors correspond to journals, where reddishcolors refer to general interest journals.
35

Figure 3: Distribution of commenters, seminars and conferences acknowledged on allpapers per timepoint and journalgroup.
●
●●●
●
●
●
●
●
●
●
●●
●
●●
●
●
●●
●
●
●
●
●●●●●
●
●●
●
●
●●
●
●
●
●
●
●
●
●
●●
●
●
●
●
●
●
●
●
●
●
●
0
3
8
3
11
34
53
early late
Commenters
●
●●●
●
●
●
●
●
●
●
●●
●●●
●
●
●●
●
●
●
●
●●●●
●
●
●
●
●
●
●
●
●
●
●
●
●
●
●
●
●
●●
●●
●
●
●●●●●
●
●
●
●●●
●
●
●
●
●
●
●
●
●
●●
●
●
●
●
●
●
●
●
●
●
●
●●
●
●●
●●
●
●
●●
●
●●
●
●●●
●
●
●
●
●
●
●
●
●●
●●
●
●
●
●
●
●
●●
●
●
●
●
●
●
●●
●●
●
●
●
●●
●
●
●
●
●
●
●●
●
●
●
●
●
●
●
●
●
●
●
●
●
●
●
●
●
●
●
●
●
●
●
●
●
●
●
●●
●
●●
●
●
●
●
●
●
●●
●●
●
●
●
●
●
●
●
●
●
●●
●
●
●
●
●●
●
●
●
●
●
●
●
●
●
●
00
2
0
4
20
27
early late
Seminars
●●●●●●●●●●●
●●●●
●
●
●
●●
●
●●●
●
●
●
●
●●
●
●
●●
●
●
●
●●
● ●●
●
●
●
●
●
●
●●
●
●
●
●
●●
●
●
●
●
●
●
●●
●
●
●●
●●
●●
●●
●●
●
●
●
●
●
●
●
●●
●
●●●
●
●
●●●
●●●
●
●●●●●●●●
●
●
●
●
●
●
●
●
00112
10
23
early late
Conferences
Journalgroup
field generalinterest
Notes: Graph shows distribution of the number of acknowledged commenters (left plot), seminars(center plot) and conferences (right plot) per journalgroup in comparison for the early and the latetimepoint. Distribution is shown by a combined box-violinplot: The thicker the violin, the higherthe density at this point. The rectangle inside the violin symbolizes the inner quartile, being therange between the 25%-quantile and the 75%-quantile. Points at the upper tail visualize outliers,defined as being more extreme than 1.5 times the inner-quartile range.
36
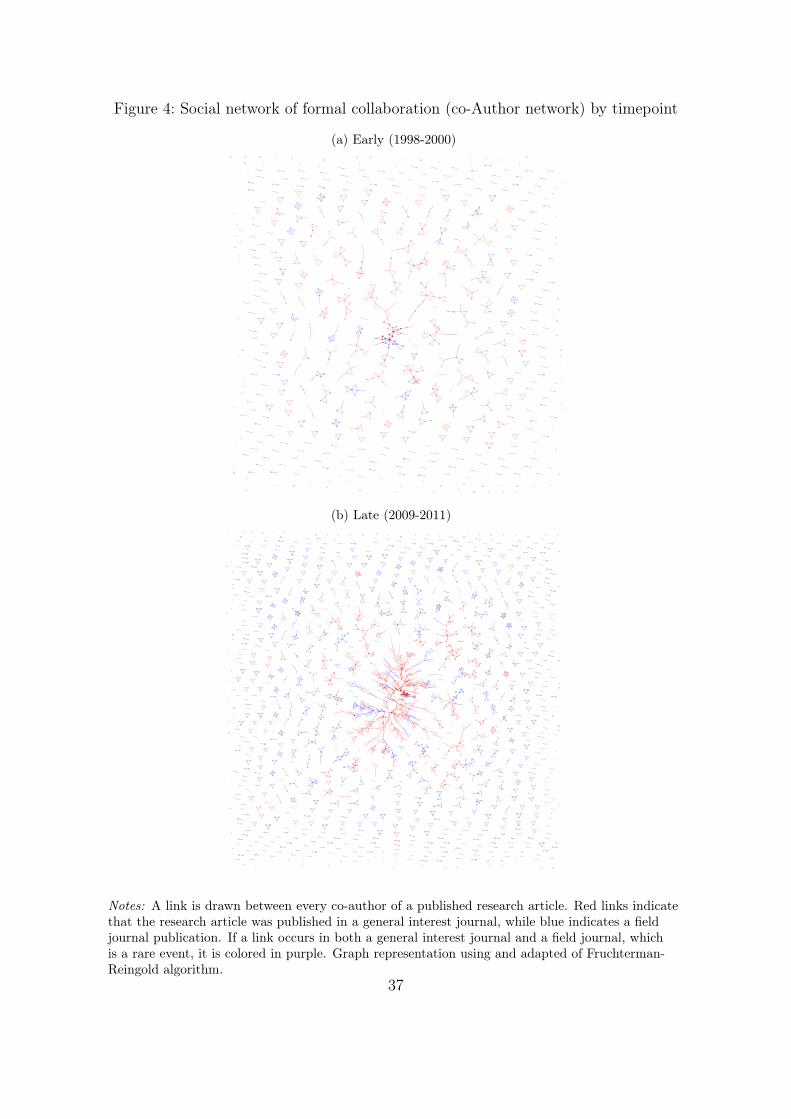
Figure 4: Social network of formal collaboration (co-Author network) by timepoint
(a) Early (1998-2000)
(b) Late (2009-2011)
Notes: A link is drawn between every co-author of a published research article. Red links indicatethat the research article was published in a general interest journal, while blue indicates a fieldjournal publication. If a link occurs in both a general interest journal and a field journal, whichis a rare event, it is colored in purple. Graph representation using and adapted of Fruchterman-Reingold algorithm.
37

Figure 5: Social network of informal collaboration (commenter network) by time-point
(a) Early (1998-2000)
(b) Late (2009-2011)
Notes: A link is drawn between an acknowledged commenter and every author of a published re-search article. Red links indicate that the research article was published in a general interest jour-nal, while blue indicates a field journal publication. If a link occurs in both a general interest jour-nal and a field journal, which is a rare event, it is colored in purple. Only the giant component isshown. Graph representation using and adapted of Fruchterman-Reingold algorithm.38

B. Online Appendix
B.1. Network nomenclature
We introduce some graph theory in order to examine the network structure. Formally,
let Pt be the number of articles in t ∈ early, late, where early refers to papers published
between 1998 and 2000 and late refers to publications between 2009 and 2011. To
each paper p ∈ Pt, there is a set of authors κp and a set of commenters ιp. Every
author k ∈ κp is part of the set of nodes of the social network of formal collaboration
SF (or co-author network) and also part of the set of nodes of the social network of
informal collaboration SI . Every commenter i ∈ ιp is part a of the social network of
informal collaboration SI . Of course, i can equal k, namely when an author comments
on the work of others.
A link between two academics k, l ∈ SF in the social network of formal collabora-
tion is denoted sFkl and takes the values {0, 1, . . . lc} where lc is the maximum number
of papers academics have co-authored. The set of all sFkl forms the symmetric adja-
cency matrix of the co-author network SF . Similarly, a link between two academics
i, k ∈ SI in the network of informal collaboration is denoted sIik and takes values
{wik ∈ R0,+. wik reflects a weighting scheme to account for possible misspecifica-
tion of author-commenter-ties. wik increases by 1/ | κp | if author i acknowledges
commenter k on paper p. If the commenter has been acknowledged once on a paper
written by two authors, the weight of each of the two links would be 1/2. If one of
the author acknowledges this commenter on another solo-paper, the link increases to
3/2, reflecting a deeper relationship. k may, however, also be a co-author of i, in
which case wik increases by 1. The adjacency matrix of the acknowledgement net-
work is symmetric as acknowledgements are undirected. Hence, if k is author and i
commenter, the same weighting scheme applies.
The set of co-authors of academic k in the co-author network SF is denoted
Ni(SF ) = {j|gckj ≥ 0}. The number of co-authors of academic K, also denoted
39

academic K’s degree, is given by |Ni(SF )|. Same logic applies to the social network
of informal collaboration SI .
Using the density of each node we can characterize network density. Density is
defined as the share of realized paths∑S
i,j sij on the number of potential paths n(n−1)2
given the network size n:
density =S∑i,j
sij2
n(n− 1)(6)
Density measures the network’s efficiency in information transmission. The higher the
number, the more potential connections are realized and thus the faster the transmis-
sion.
In real world networks it is common that nodes are not connected, not even with
intermediate steps. Formally, two nodes belong to the same network component l if
there exists a path between them. There can be as many components as there are
nodes, is the case if all nodes are isolated, but at least one component. A network
component of a directed graph is said to be weakly connected if there is a path
between any two nodes in the component when the directionality is ignored. The size
of a component is the number of nodes (i.e. the number of academics) it contains. If
a node i belongs to a small network component, all other nodes are fairly close. In
contrast, a node in a large network might have a potentially much smaller centrality
because many other nodes are far away.
Within the same component we can compute network centralities because most
centrality definitions rely on paths. Centralities in essence give a ranking of nodes to
make their position comparable; the actual number is often meaningless. We present
four centrality measures: count of (direct) neighbors or degree, count of indirect
neighbors, betweenness centrality and eigenvector centrality. The count of direct and
indirect neighbors are trivial by definition and answer the question: How many aca-
demics can this academic reach directly (indirectly)? It is a proxy for communicative
activity.
Betweenness centrality is a more complex measure and was first published by
40
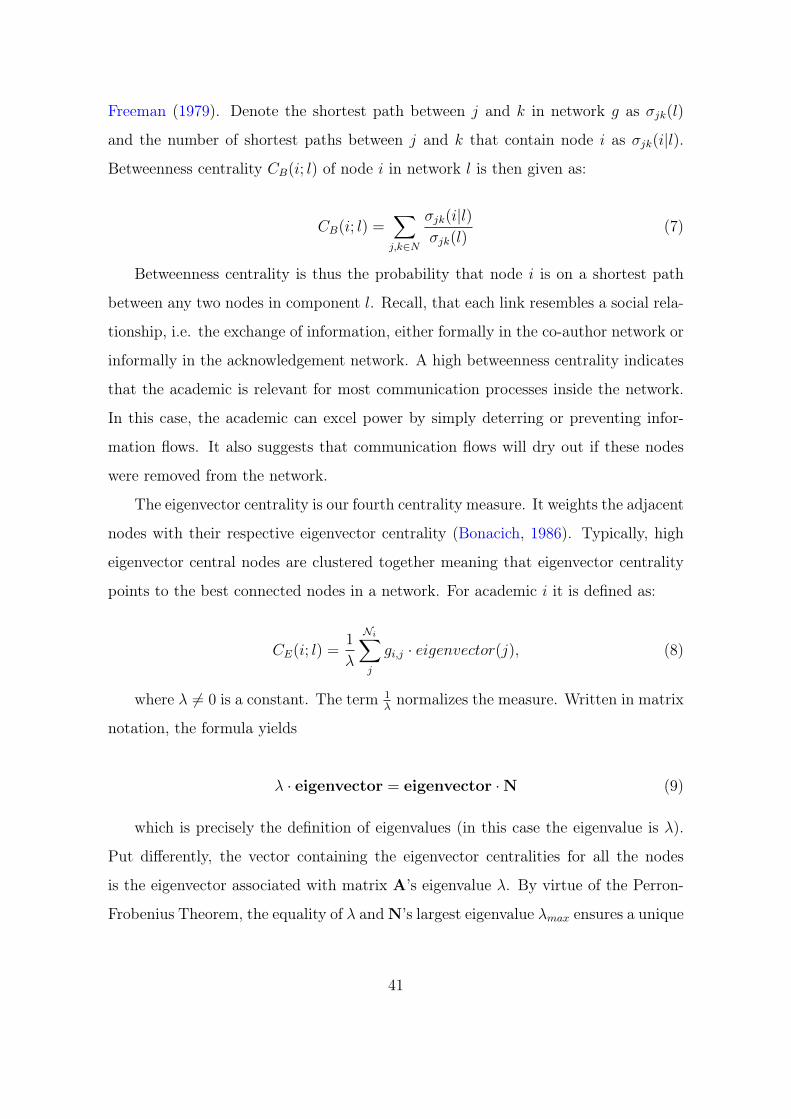
Freeman (1979). Denote the shortest path between j and k in network g as σjk(l)
and the number of shortest paths between j and k that contain node i as σjk(i|l).
Betweenness centrality CB(i; l) of node i in network l is then given as:
CB(i; l) =∑j,k∈N
σjk(i|l)σjk(l)
(7)
Betweenness centrality is thus the probability that node i is on a shortest path
between any two nodes in component l. Recall, that each link resembles a social rela-
tionship, i.e. the exchange of information, either formally in the co-author network or
informally in the acknowledgement network. A high betweenness centrality indicates
that the academic is relevant for most communication processes inside the network.
In this case, the academic can excel power by simply deterring or preventing infor-
mation flows. It also suggests that communication flows will dry out if these nodes
were removed from the network.
The eigenvector centrality is our fourth centrality measure. It weights the adjacent
nodes with their respective eigenvector centrality (Bonacich, 1986). Typically, high
eigenvector central nodes are clustered together meaning that eigenvector centrality
points to the best connected nodes in a network. For academic i it is defined as:
CE(i; l) =1
λ
Ni∑j
gi,j · eigenvector(j), (8)
where λ 6= 0 is a constant. The term 1λnormalizes the measure. Written in matrix
notation, the formula yields
λ · eigenvector = eigenvector ·N (9)
which is precisely the definition of eigenvalues (in this case the eigenvalue is λ).
Put differently, the vector containing the eigenvector centralities for all the nodes
is the eigenvector associated with matrix A’s eigenvalue λ. By virtue of the Perron-
Frobenius Theorem, the equality of λ andN’s largest eigenvalue λmax ensures a unique
41

Figure 6: Illustration of centrality measures
(a) Betweenness centrality (b) Eigenvector centrality
Note: Illustration of two centrality measures for the same hypothetical network of 256 nodes. Redindicates nodes with high values and blue indicates nodes with low values.
and positive solution. Eigenvector centrality is high when an academic knows many
academics or few academic in central places, or both.
Though all the centrality measures are related, they focus on different aspects.
Figure 6 compares all four centrality measures that we use on the same (example)
network. To broker between groups requires a high betweenness centrality (6a). Very
eigenvector central nodes (6b) are likely to be the center of the best-connected clique
in a network. The centrality decreases evenly in concentric rings from the most
eigenvector central node.
B.2. Top 100 lists
42

Table 12: Most central researchers in the social network of formal collaboration in the early subsample (1998-200) - rank26 through 100
Betweenness Eigenvector Degree
1 Anthony Saunders (8) 1 Allen N Berger (6) 24 Arnoud Wa Boot (6)
2 Allen N Berger (6) 2 Anthony Saunders (8) 24 B Espen Eckbo (3)
3 Kose John (3) 3 Gregory F Udell (2) 24 Bruce D Smith (4)
4 Rangarajan K Sundaram (2) 4 J David Cummins (2) 24 Charles Cao (2)
5 David L Yermack (3) 4 Mary A Weiss (2) 24 Charles M Kahn (4)
6 Anil Shivdasani (2) 6 Joseph M Scalise (1) 24 Daniel Levy (2)
7 Jun-Koo Kang (2) 7 Diana Hancock (3) 24 David L Yermack (3)
8 Rene M Stulz (3) 8 Hongmin Zi (1) 24 Dong-Hyun Ahn (2)
9 Mark J Flannery (3) 9 Berry K Wilson (3) 24 Eric C Chang (3)
10 Joel F Houston (3) 10 Daniel M Covitz (1) 24 Franklin Allen (4)
11 Berry K Wilson (3) 11 Seth D Bonime (1) 24 Henri Servaes (3)
11 Diana Hancock (3) 12 Mark J Flannery (3) 24 Ike Mathur (2)
11 Michael D Ryngaert (3) 13 Kose John (3) 24 Ivo Welch (4)
11 Tim Opler (2) 14 Philip E Strahan (2) 24 J David Cummins (2)
15 Gerard Caprio (1) 15 Sally M Davies (1) 24 J Harold Mulherin (2)
Notes: Table lists top researchers in the network in terms of betweenness centrality, eigenvector centraliy and degree
(neighbor count). Betweenness centrality of a researcher in the social network of informal collaboration is the probability
that she is on the shortest path between any two other nodes (equation 7). Eigenvector centrality of a researcher in the
social network of informal collaboration is the weighted count of her network neighbors, where the weights correspond to
the neighbors’ eigenvector centrality (equation 9). Both centralities were calculated using the largest connected network
component. Numbers in parentheses indicate the number of papers written in our dataset.
43
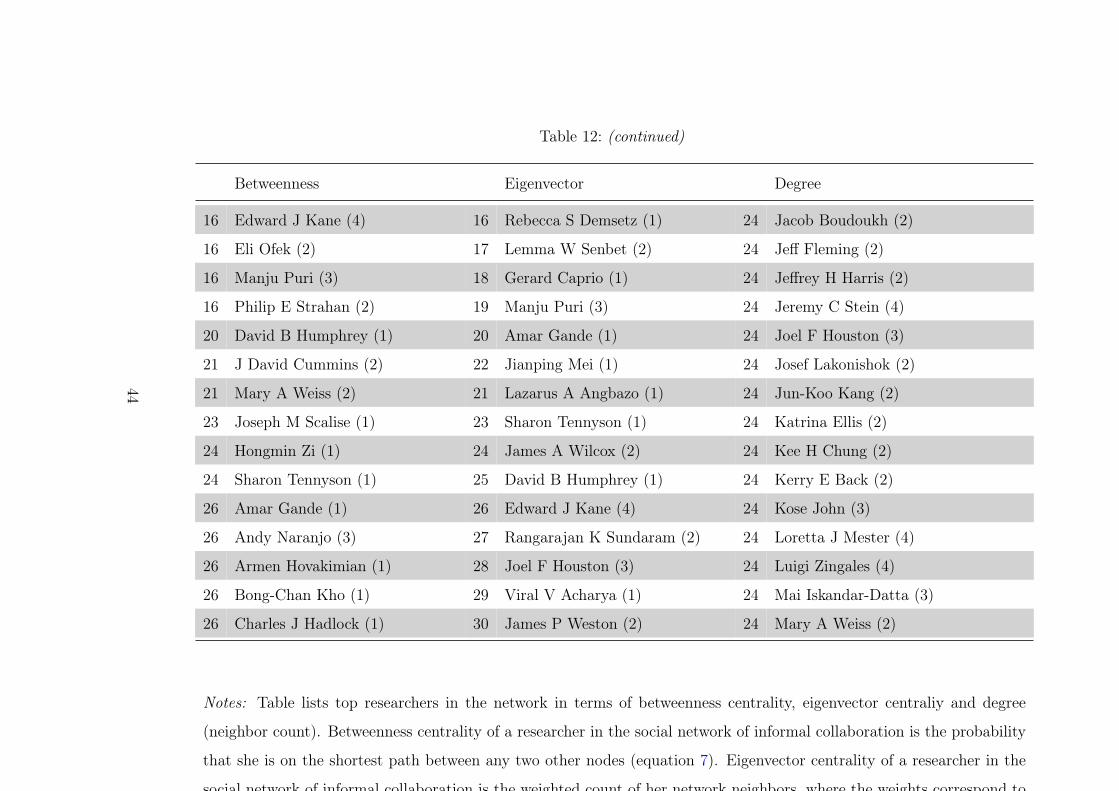
Table 12: (continued)
Betweenness Eigenvector Degree
16 Edward J Kane (4) 16 Rebecca S Demsetz (1) 24 Jacob Boudoukh (2)
16 Eli Ofek (2) 17 Lemma W Senbet (2) 24 Jeff Fleming (2)
16 Manju Puri (3) 18 Gerard Caprio (1) 24 Jeffrey H Harris (2)
16 Philip E Strahan (2) 19 Manju Puri (3) 24 Jeremy C Stein (4)
20 David B Humphrey (1) 20 Amar Gande (1) 24 Joel F Houston (3)
21 J David Cummins (2) 22 Jianping Mei (1) 24 Josef Lakonishok (2)
21 Mary A Weiss (2) 21 Lazarus A Angbazo (1) 24 Jun-Koo Kang (2)
23 Joseph M Scalise (1) 23 Sharon Tennyson (1) 24 Katrina Ellis (2)
24 Hongmin Zi (1) 24 James A Wilcox (2) 24 Kee H Chung (2)
24 Sharon Tennyson (1) 25 David B Humphrey (1) 24 Kerry E Back (2)
26 Amar Gande (1) 26 Edward J Kane (4) 24 Kose John (3)
26 Andy Naranjo (3) 27 Rangarajan K Sundaram (2) 24 Loretta J Mester (4)
26 Armen Hovakimian (1) 28 Joel F Houston (3) 24 Luigi Zingales (4)
26 Bong-Chan Kho (1) 29 Viral V Acharya (1) 24 Mai Iskandar-Datta (3)
26 Charles J Hadlock (1) 30 James P Weston (2) 24 Mary A Weiss (2)
Notes: Table lists top researchers in the network in terms of betweenness centrality, eigenvector centraliy and degree
(neighbor count). Betweenness centrality of a researcher in the social network of informal collaboration is the probability
that she is on the shortest path between any two other nodes (equation 7). Eigenvector centrality of a researcher in the
social network of informal collaboration is the weighted count of her network neighbors, where the weights correspond to
the neighbors’ eigenvector centrality (equation 9). Both centralities were calculated using the largest connected network
component. Numbers in parentheses indicate the number of papers written in our dataset.
44
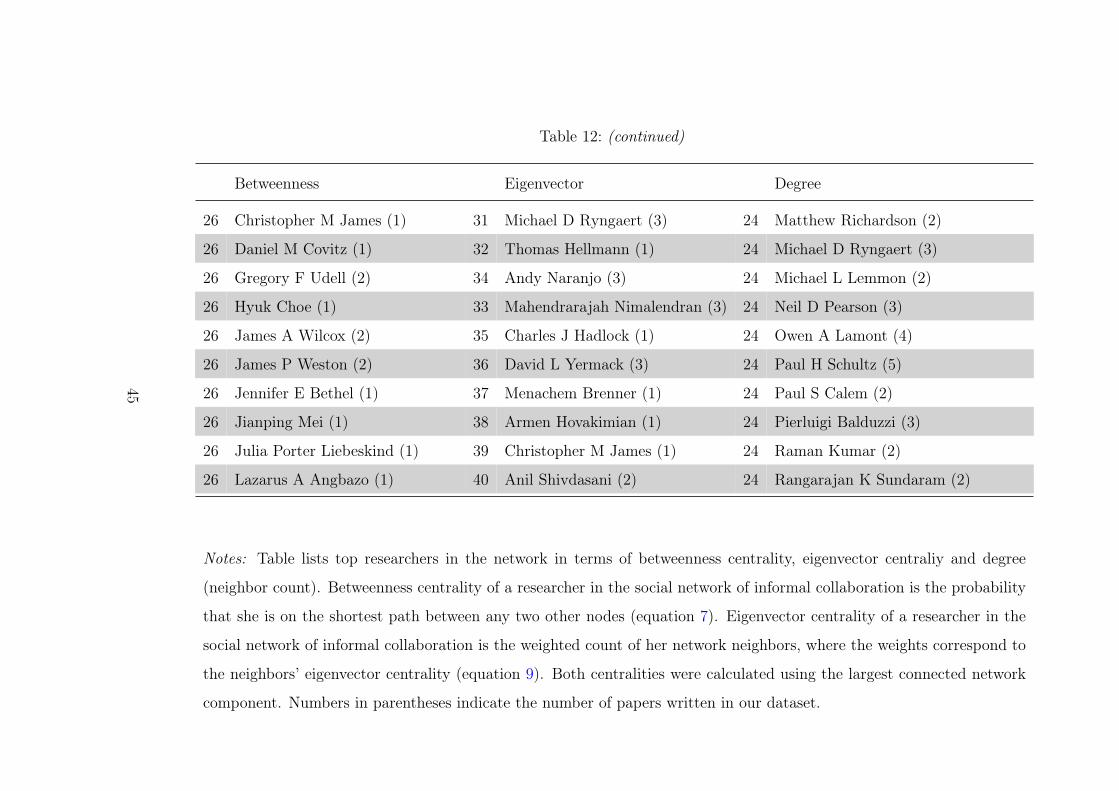
Table 12: (continued)
Betweenness Eigenvector Degree
26 Christopher M James (1) 31 Michael D Ryngaert (3) 24 Matthew Richardson (2)
26 Daniel M Covitz (1) 32 Thomas Hellmann (1) 24 Michael D Ryngaert (3)
26 Gregory F Udell (2) 34 Andy Naranjo (3) 24 Michael L Lemmon (2)
26 Hyuk Choe (1) 33 Mahendrarajah Nimalendran (3) 24 Neil D Pearson (3)
26 James A Wilcox (2) 35 Charles J Hadlock (1) 24 Owen A Lamont (4)
26 James P Weston (2) 36 David L Yermack (3) 24 Paul H Schultz (5)
26 Jennifer E Bethel (1) 37 Menachem Brenner (1) 24 Paul S Calem (2)
26 Jianping Mei (1) 38 Armen Hovakimian (1) 24 Pierluigi Balduzzi (3)
26 Julia Porter Liebeskind (1) 39 Christopher M James (1) 24 Raman Kumar (2)
26 Lazarus A Angbazo (1) 40 Anil Shivdasani (2) 24 Rangarajan K Sundaram (2)
Notes: Table lists top researchers in the network in terms of betweenness centrality, eigenvector centraliy and degree
(neighbor count). Betweenness centrality of a researcher in the social network of informal collaboration is the probability
that she is on the shortest path between any two other nodes (equation 7). Eigenvector centrality of a researcher in the
social network of informal collaboration is the weighted count of her network neighbors, where the weights correspond to
the neighbors’ eigenvector centrality (equation 9). Both centralities were calculated using the largest connected network
component. Numbers in parentheses indicate the number of papers written in our dataset.
45

Table 12: (continued)
Betweenness Eigenvector Degree
26 Lee Pinkowitz (1) 41 Eli Ofek (2) 24 Raphael W Bostic (2)
26 Lemma W Senbet (2) 42 Jun-Koo Kang (2) 24 Robert B Avery (2)
26 Mahendrarajah Nimalendran (3) 43 Takeshi Yamada (1) 24 Robert F Whitelaw (3)
26 Menachem Brenner (1) 44 Philip G Berger (1) 24 Robert L Kieschnick (2)
26 Philip G Berger (1) 45 Rene M Stulz (3) 24 Robert W Vishny (3)
26 Rebecca S Demsetz (1) 46 Yong-Cheol Kim (1) 24 S Viswanathan (4)
26 Rohan Williamson (1) 47 Tim Opler (2) 24 Stephen H Thomas (3)
26 Sally M Davies (1) 49 Lee Pinkowitz (1) 24 Sudip Datta (3)
26 Seth D Bonime (1) 48 Rohan Williamson (1) 24 Tarun Chordia (3)
26 Takeshi Yamada (1) 50 Bong-Chan Kho (1) 24 Vincent A Warther (3)
26 Thomas Hellmann (1) 51 Hyuk Choe (1) 24 Vojislav Maksimovic (4)
26 Viral V Acharya (1) 52 Jennifer E Bethel (1) 24 William G Christie (2)
26 Yong-Cheol Kim (1) 53 Julia Porter Liebeskind (1) 78 A Craig Mackinlay (2)
78 Aigbe Akhigbe (3)
78 Ajay Khorana (2)
Notes: Table lists top researchers in the network in terms of betweenness centrality, eigenvector centraliy and degree
(neighbor count). Betweenness centrality of a researcher in the social network of informal collaboration is the probability
that she is on the shortest path between any two other nodes (equation 7). Eigenvector centrality of a researcher in the
social network of informal collaboration is the weighted count of her network neighbors, where the weights correspond to
the neighbors’ eigenvector centrality (equation 9). Both centralities were calculated using the largest connected network
component. Numbers in parentheses indicate the number of papers written in our dataset.
46
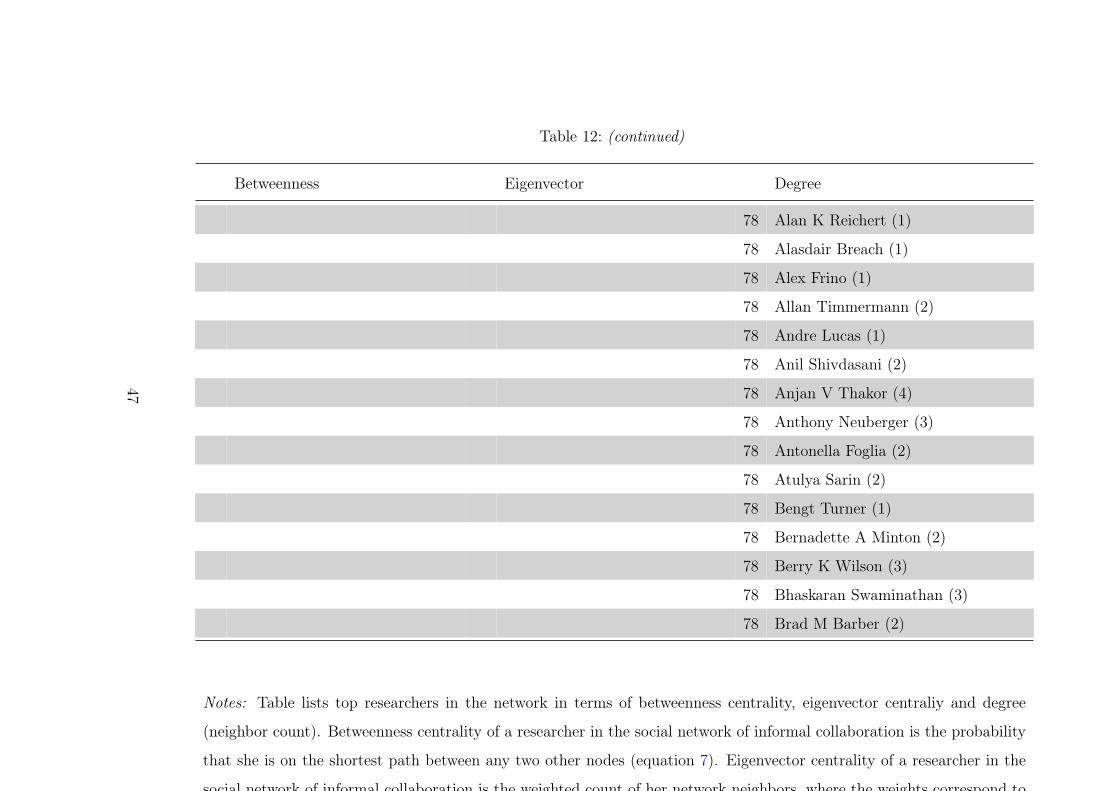
Table 12: (continued)
Betweenness Eigenvector Degree
78 Alan K Reichert (1)
78 Alasdair Breach (1)
78 Alex Frino (1)
78 Allan Timmermann (2)
78 Andre Lucas (1)
78 Anil Shivdasani (2)
78 Anjan V Thakor (4)
78 Anthony Neuberger (3)
78 Antonella Foglia (2)
78 Atulya Sarin (2)
78 Bengt Turner (1)
78 Bernadette A Minton (2)
78 Berry K Wilson (3)
78 Bhaskaran Swaminathan (3)
78 Brad M Barber (2)
Notes: Table lists top researchers in the network in terms of betweenness centrality, eigenvector centraliy and degree
(neighbor count). Betweenness centrality of a researcher in the social network of informal collaboration is the probability
that she is on the shortest path between any two other nodes (equation 7). Eigenvector centrality of a researcher in the
social network of informal collaboration is the weighted count of her network neighbors, where the weights correspond to
the neighbors’ eigenvector centrality (equation 9). Both centralities were calculated using the largest connected network
component. Numbers in parentheses indicate the number of papers written in our dataset.
47
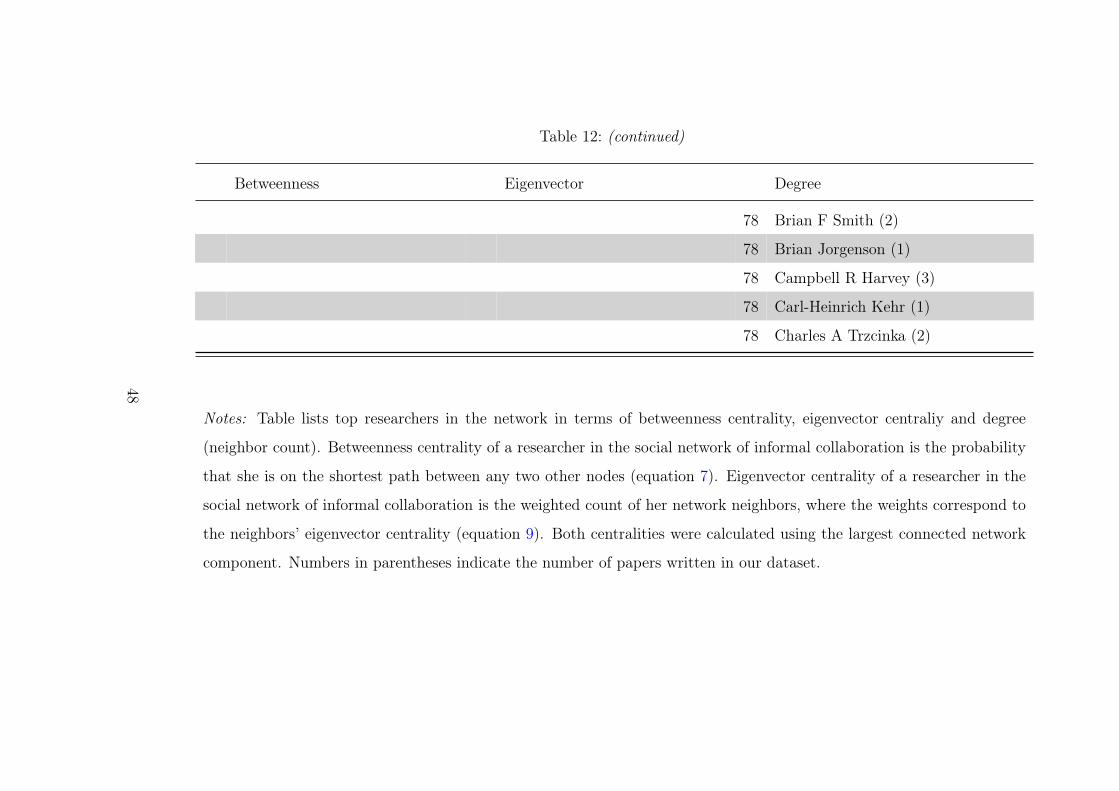
Table 12: (continued)
Betweenness Eigenvector Degree
78 Brian F Smith (2)
78 Brian Jorgenson (1)
78 Campbell R Harvey (3)
78 Carl-Heinrich Kehr (1)
78 Charles A Trzcinka (2)
Notes: Table lists top researchers in the network in terms of betweenness centrality, eigenvector centraliy and degree
(neighbor count). Betweenness centrality of a researcher in the social network of informal collaboration is the probability
that she is on the shortest path between any two other nodes (equation 7). Eigenvector centrality of a researcher in the
social network of informal collaboration is the weighted count of her network neighbors, where the weights correspond to
the neighbors’ eigenvector centrality (equation 9). Both centralities were calculated using the largest connected network
component. Numbers in parentheses indicate the number of papers written in our dataset.
48
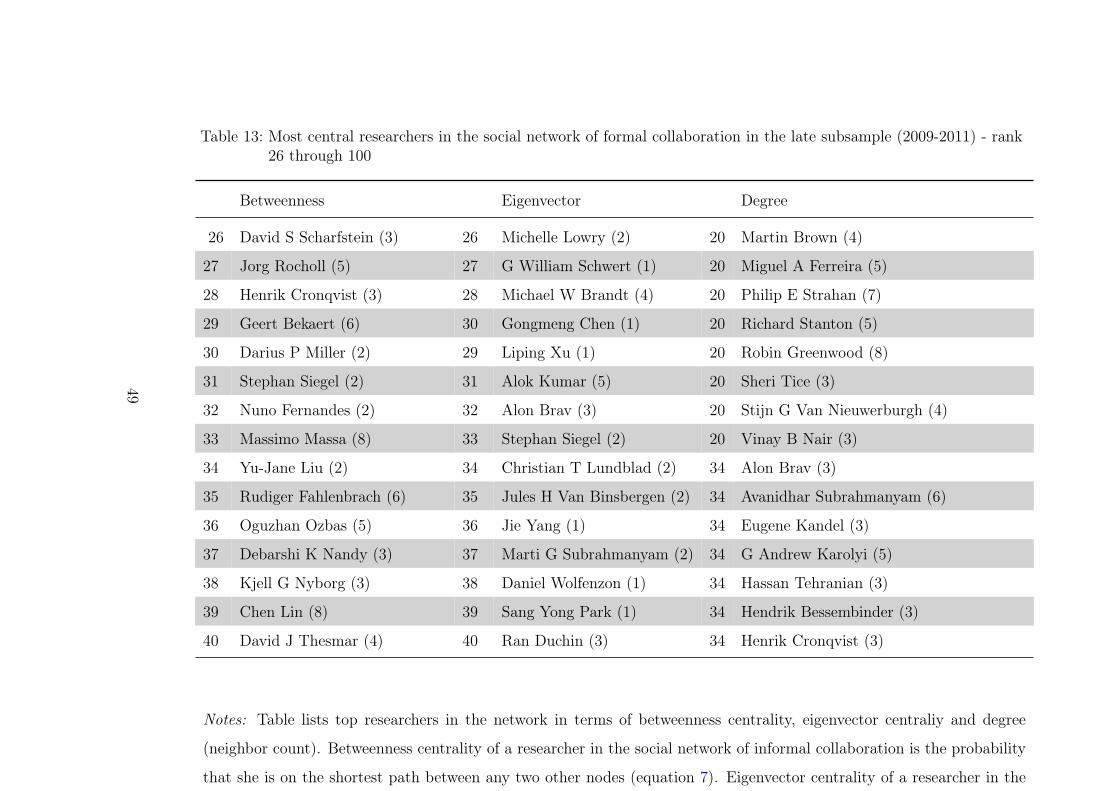
Table 13: Most central researchers in the social network of formal collaboration in the late subsample (2009-2011) - rank26 through 100
Betweenness Eigenvector Degree
26 David S Scharfstein (3) 26 Michelle Lowry (2) 20 Martin Brown (4)
27 Jorg Rocholl (5) 27 G William Schwert (1) 20 Miguel A Ferreira (5)
28 Henrik Cronqvist (3) 28 Michael W Brandt (4) 20 Philip E Strahan (7)
29 Geert Bekaert (6) 30 Gongmeng Chen (1) 20 Richard Stanton (5)
30 Darius P Miller (2) 29 Liping Xu (1) 20 Robin Greenwood (8)
31 Stephan Siegel (2) 31 Alok Kumar (5) 20 Sheri Tice (3)
32 Nuno Fernandes (2) 32 Alon Brav (3) 20 Stijn G Van Nieuwerburgh (4)
33 Massimo Massa (8) 33 Stephan Siegel (2) 20 Vinay B Nair (3)
34 Yu-Jane Liu (2) 34 Christian T Lundblad (2) 34 Alon Brav (3)
35 Rudiger Fahlenbrach (6) 35 Jules H Van Binsbergen (2) 34 Avanidhar Subrahmanyam (6)
36 Oguzhan Ozbas (5) 36 Jie Yang (1) 34 Eugene Kandel (3)
37 Debarshi K Nandy (3) 37 Marti G Subrahmanyam (2) 34 G Andrew Karolyi (5)
38 Kjell G Nyborg (3) 38 Daniel Wolfenzon (1) 34 Hassan Tehranian (3)
39 Chen Lin (8) 39 Sang Yong Park (1) 34 Hendrik Bessembinder (3)
40 David J Thesmar (4) 40 Ran Duchin (3) 34 Henrik Cronqvist (3)
Notes: Table lists top researchers in the network in terms of betweenness centrality, eigenvector centraliy and degree
(neighbor count). Betweenness centrality of a researcher in the social network of informal collaboration is the probability
that she is on the shortest path between any two other nodes (equation 7). Eigenvector centrality of a researcher in the
social network of informal collaboration is the weighted count of her network neighbors, where the weights correspond to
the neighbors’ eigenvector centrality (equation 9). Both centralities were calculated using the largest connected network
component. Numbers in parentheses indicate the number of papers written in our dataset.
49

Table 13: (continued)
Betweenness Eigenvector Degree
41 Sascha Steffen (3) 41 Xiaoyan Zhang (4) 34 Itay Goldstein (4)
42 Timothy C Johnson (2) 42 Robert J Hodrick (3) 34 John M Griffin (4)
43 Alex Edmans (8) 43 Joseph Golec (1) 34 Jun-Koo Kang (3)
44 Prachi Deuskar (2) 44 Alessandro Beber (3) 34 Kai Li (3)
45 Wei Jiang (3) 45 Kenneth A Kavajecz (2) 34 Kj Martijn Cremers (4)
46 Ilya A Strebulaev (5) 46 Yuhang Xing (3) 34 Lucian A Bebchuk (5)
47 Kai Li (3) 47 Levent Guntay (1) 34 Michael W Brandt (4)
48 Yaniv Grinstein (2) 48 John G Matsusaka (1) 34 Michel Beine (3)
49 Anna Kovner (3) 49 Per Stromberg (3) 34 Peter Bossaerts (3)
50 Robin Greenwood (8) 50 Steven N Kaplan (2) 34 Philip Molyneux (4)
51 Vidhi Chhaochharia (3) 51 Andrew Ang (3) 34 Richard Roll (8)
52 Jules H Van Binsbergen (2) 52 David S Scharfstein (3) 34 Ronald W Masulis (5)
53 Thomas J Chemmanur (9) 53 Itay Goldstein (4) 34 Sheridan Titman (4)
54 Philip Bond (3) 54 Wei Jiang (3) 34 Sumit Agarwal (3)
55 Ralph Sj Koijen (3) 55 Eric Engstrom (1) 34 Takeshi Nishikawa (3)
Notes: Table lists top researchers in the network in terms of betweenness centrality, eigenvector centraliy and degree
(neighbor count). Betweenness centrality of a researcher in the social network of informal collaboration is the probability
that she is on the shortest path between any two other nodes (equation 7). Eigenvector centrality of a researcher in the
social network of informal collaboration is the weighted count of her network neighbors, where the weights correspond to
the neighbors’ eigenvector centrality (equation 9). Both centralities were calculated using the largest connected network
component. Numbers in parentheses indicate the number of papers written in our dataset.
50

Table 13: (continued)
Betweenness Eigenvector Degree
56 Xiaoyan Zhang (4) 56 Lior Menzly (1) 34 Victoria Ivashina (6)
57 W Scott Frame (3) 57 Ola Bengtsson (1) 34 Yue Ma (5)
58 Bernadette A Minton (2) 58 Antonio Moreno (1) 58 Adair Morse (5)
59 Vikram K Nanda (4) 59 Koen Inghelbrecht (1) 58 Ajai K Singh (2)
60 David K Musto (2) 61 Lieven Baele (1) 58 Alexander W Butler (4)
61 Lu Zheng (3) 60 Seonghoon Cho (1) 58 Amit Seru (3)
62 Luc Laeven (3) 62 Michael D Bradley (1) 58 Andrew Ang (3)
63 G Andrew Karolyi (5) 63 Rossen Valkanov (2) 58 Andrew Metrick (3)
64 Eugene Kandel (3) 64 Pedro Santa-Clara (2) 58 Anna Kovner (3)
65 Adam V Reed (2) 65 G David Haushalter (2) 58 Berk A Sensoy (5)
Notes: Table lists top researchers in the network in terms of betweenness centrality, eigenvector centraliy and degree
(neighbor count). Betweenness centrality of a researcher in the social network of informal collaboration is the probability
that she is on the shortest path between any two other nodes (equation 7). Eigenvector centrality of a researcher in the
social network of informal collaboration is the weighted count of her network neighbors, where the weights correspond to
the neighbors’ eigenvector centrality (equation 9). Both centralities were calculated using the largest connected network
component. Numbers in parentheses indicate the number of papers written in our dataset.
51

Table 13: (continued)
Betweenness Eigenvector Degree
66 Andrew Metrick (3) 66 Warren Bailey (2) 58 Campbell R Harvey (3)
67 Paul Wachtel (2) 67 Henrik Cronqvist (3) 58 Christopher J Malloy (3)
68 Steven Ongena (6) 68 Oliver G Spalt (2) 58 Cnv Krishnan (2)
69 Hyun Song Shin (3) 69 David Ng (1) 58 Dan Li (3)
70 Paul A Gompers (2) 70 Jeremy K Page (1) 58 Darius P Miller (2)
71 Haitao Li (4) 71 Amir Barnea (1) 58 Debarshi K Nandy (3)
72 Adam B Ashcraft (2) 72 Andrew Ellul (1) 58 Doron Avramov (2)
72 Harjoat S Bhamra (3) 73 Chotibhak Jotikasthira (1) 58 Douglas D Evanoff (2)
72 Soehnke M Bartram (2) 74 George M Korniotis (1) 58 Guofu Zhou (4)
75 Joshua Lerner (3) 75 Richmond D Mathews (1) 58 Hans Degryse (3)
76 Gustavo Manso (4) 76 Haitao Li (4) 58 Hao Zhou (4)
77 Geraldo Cerqueiro (2) 77 Ralph Sj Koijen (3) 58 Heitor W Almeida (3)
78 Raman Uppal (3) 78 Amrut Nashikkar (2) 58 Hsuan-Chi Chen (4)
79 Adair Morse (5) 79 Rainer Jankowitsch (1) 58 Jeong-Bon Kim (4)
80 Craig Doidge (4) 80 Chunchi Wu (6) 58 John M Bizjak (3)
Notes: Table lists top researchers in the network in terms of betweenness centrality, eigenvector centraliy and degree
(neighbor count). Betweenness centrality of a researcher in the social network of informal collaboration is the probability
that she is on the shortest path between any two other nodes (equation 7). Eigenvector centrality of a researcher in the
social network of informal collaboration is the weighted count of her network neighbors, where the weights correspond to
the neighbors’ eigenvector centrality (equation 9). Both centralities were calculated using the largest connected network
component. Numbers in parentheses indicate the number of papers written in our dataset.
52
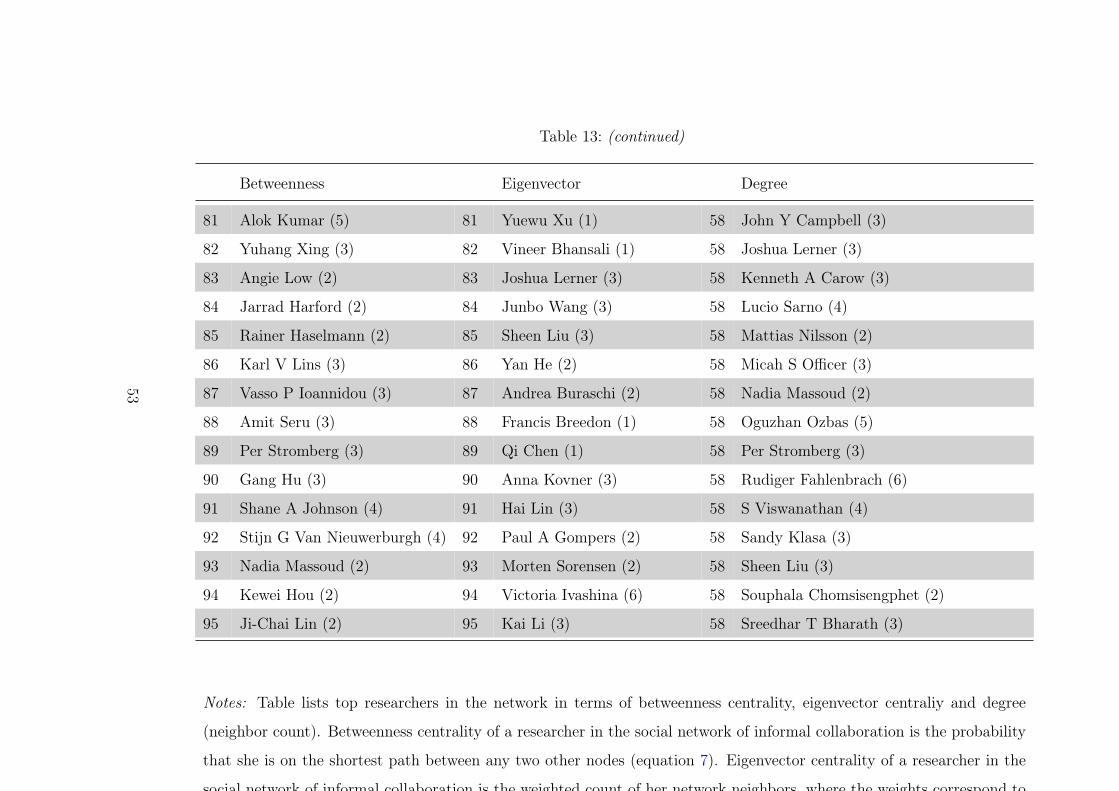
Table 13: (continued)
Betweenness Eigenvector Degree
81 Alok Kumar (5) 81 Yuewu Xu (1) 58 John Y Campbell (3)
82 Yuhang Xing (3) 82 Vineer Bhansali (1) 58 Joshua Lerner (3)
83 Angie Low (2) 83 Joshua Lerner (3) 58 Kenneth A Carow (3)
84 Jarrad Harford (2) 84 Junbo Wang (3) 58 Lucio Sarno (4)
85 Rainer Haselmann (2) 85 Sheen Liu (3) 58 Mattias Nilsson (2)
86 Karl V Lins (3) 86 Yan He (2) 58 Micah S Officer (3)
87 Vasso P Ioannidou (3) 87 Andrea Buraschi (2) 58 Nadia Massoud (2)
88 Amit Seru (3) 88 Francis Breedon (1) 58 Oguzhan Ozbas (5)
89 Per Stromberg (3) 89 Qi Chen (1) 58 Per Stromberg (3)
90 Gang Hu (3) 90 Anna Kovner (3) 58 Rudiger Fahlenbrach (6)
91 Shane A Johnson (4) 91 Hai Lin (3) 58 S Viswanathan (4)
92 Stijn G Van Nieuwerburgh (4) 92 Paul A Gompers (2) 58 Sandy Klasa (3)
93 Nadia Massoud (2) 93 Morten Sorensen (2) 58 Sheen Liu (3)
94 Kewei Hou (2) 94 Victoria Ivashina (6) 58 Souphala Chomsisengphet (2)
95 Ji-Chai Lin (2) 95 Kai Li (3) 58 Sreedhar T Bharath (3)
Notes: Table lists top researchers in the network in terms of betweenness centrality, eigenvector centraliy and degree
(neighbor count). Betweenness centrality of a researcher in the social network of informal collaboration is the probability
that she is on the shortest path between any two other nodes (equation 7). Eigenvector centrality of a researcher in the
social network of informal collaboration is the weighted count of her network neighbors, where the weights correspond to
the neighbors’ eigenvector centrality (equation 9). Both centralities were calculated using the largest connected network
component. Numbers in parentheses indicate the number of papers written in our dataset.
53

Table 13: (continued)
Betweenness Eigenvector Degree
95 Kevin Aretz (2) 96 Ulf Axelson (2) 58 Tarun Chordia (3)
95 Meghana Ayyagari (2) 97 Michael S Weisbach (1) 58 Terrance Odean (3)
98 Sandy Klasa (3) 98 Yan Leung Cheung (3) 58 Vikram K Nanda (4)
99 Isil Erel (3) 99 Rudiger Fahlenbrach (6) 58 W Scott Frame (3)
99 Reena Aggarwal (2) 100 Gregory B Van Inwegen (1) 58 Wei Jiang (3)
Notes: Table lists top researchers in the network in terms of betweenness centrality, eigenvector centraliy and degree
(neighbor count). Betweenness centrality of a researcher in the social network of informal collaboration is the probability
that she is on the shortest path between any two other nodes (equation 7). Eigenvector centrality of a researcher in the
social network of informal collaboration is the weighted count of her network neighbors, where the weights correspond to
the neighbors’ eigenvector centrality (equation 9). Both centralities were calculated using the largest connected network
component. Numbers in parentheses indicate the number of papers written in our dataset.
54

Table 14: Most central researchers in the social network of informal collaboration in the early subsample (1998-200) -rank 26 through 100
Betweenness Eigenvector Degree
26 Jeff Fleming (2) 26 Henri Servaes (11) 25 Kenneth R French (18)
27 Charles Cao (2) 27 Vojislav Maksimovic (6) 27 Kent L Womack (4)
28 Steven L Jones (2) 28 Tim Loughran (13) 28 Jeremy C Stein (20)
29 Robert C Nash (2) 29 Franklin Allen (21) 28 Maureen O’Hara (13)
30 Gregory F Udell (15) 30 Stewart C Myers (9) 28 Robert W Vishny (16)
31 Ivo Welch (8) 31 Mark Mitchell (13) 28 Tim Opler (14)
32 B Espen Eckbo (4) 32 Manju Puri (7) 32 D Bruce Johnsen (1)
33 Hamid Mehran (4) 33 Kent Daniel (11) 32 Edward J Kane (17)
34 John R Graham (7) 34 Michael S Weisbach (10) 32 Narayan Y Naik (3)
35 Peter Bossaerts (8) 35 Ernst Maug (12) 35 Alon Brav (9)
36 Denis Gromb (9) 36 John Mr Chalmers (10) 36 Hamid Mehran (4)
37 Charles W Calomiris (15) 37 Jeffrey Wurgler (0) 37 Manju Puri (7)
38 Edward J Kane (17) 38 Eugene Kandel (6) 37 Philip E Strahan (9)
39 Yakov Amihud (24) 39 Roni Michaely (8) 37 Tim Loughran (13)
40 Franklin Allen (21) 40 Peter B Henry (1) 37 Yakov Amihud (24)
Notes: Table lists top researchers in the network in terms of betweenness centrality, eigenvector centraliy and degree
(neighbor count). Betweenness centrality of a researcher in the social network of informal collaboration is the probability
that she is on the shortest path between any two other nodes (equation 7). Eigenvector centrality of a researcher in the
social network of informal collaboration is the weighted count of her network neighbors, where the weights correspond to
the neighbors’ eigenvector centrality (equation 9). Both centralities were calculated using the largest connected network
component. Numbers in parentheses indicate the number of thanks in our dataset.
55
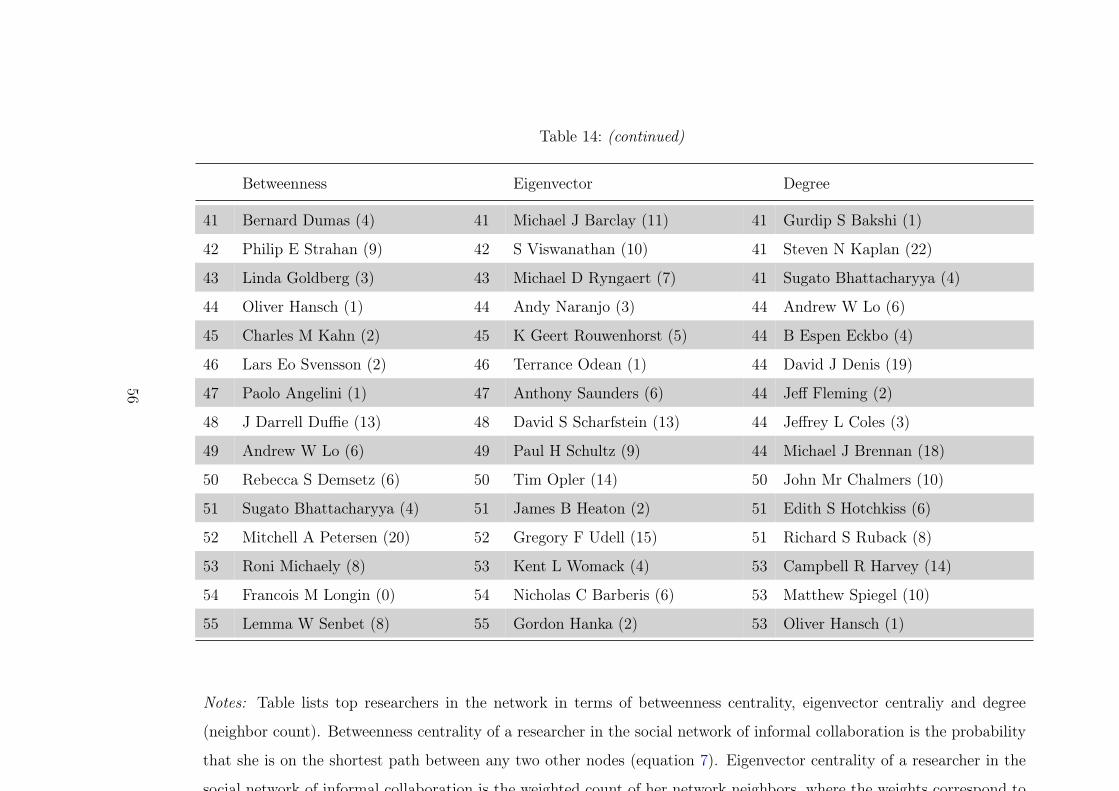
Table 14: (continued)
Betweenness Eigenvector Degree
41 Bernard Dumas (4) 41 Michael J Barclay (11) 41 Gurdip S Bakshi (1)
42 Philip E Strahan (9) 42 S Viswanathan (10) 41 Steven N Kaplan (22)
43 Linda Goldberg (3) 43 Michael D Ryngaert (7) 41 Sugato Bhattacharyya (4)
44 Oliver Hansch (1) 44 Andy Naranjo (3) 44 Andrew W Lo (6)
45 Charles M Kahn (2) 45 K Geert Rouwenhorst (5) 44 B Espen Eckbo (4)
46 Lars Eo Svensson (2) 46 Terrance Odean (1) 44 David J Denis (19)
47 Paolo Angelini (1) 47 Anthony Saunders (6) 44 Jeff Fleming (2)
48 J Darrell Duffie (13) 48 David S Scharfstein (13) 44 Jeffrey L Coles (3)
49 Andrew W Lo (6) 49 Paul H Schultz (9) 44 Michael J Brennan (18)
50 Rebecca S Demsetz (6) 50 Tim Opler (14) 50 John Mr Chalmers (10)
51 Sugato Bhattacharyya (4) 51 James B Heaton (2) 51 Edith S Hotchkiss (6)
52 Mitchell A Petersen (20) 52 Gregory F Udell (15) 51 Richard S Ruback (8)
53 Roni Michaely (8) 53 Kent L Womack (4) 53 Campbell R Harvey (14)
54 Francois M Longin (0) 54 Nicholas C Barberis (6) 53 Matthew Spiegel (10)
55 Lemma W Senbet (8) 55 Gordon Hanka (2) 53 Oliver Hansch (1)
Notes: Table lists top researchers in the network in terms of betweenness centrality, eigenvector centraliy and degree
(neighbor count). Betweenness centrality of a researcher in the social network of informal collaboration is the probability
that she is on the shortest path between any two other nodes (equation 7). Eigenvector centrality of a researcher in the
social network of informal collaboration is the weighted count of her network neighbors, where the weights correspond to
the neighbors’ eigenvector centrality (equation 9). Both centralities were calculated using the largest connected network
component. Numbers in parentheses indicate the number of thanks in our dataset.
56
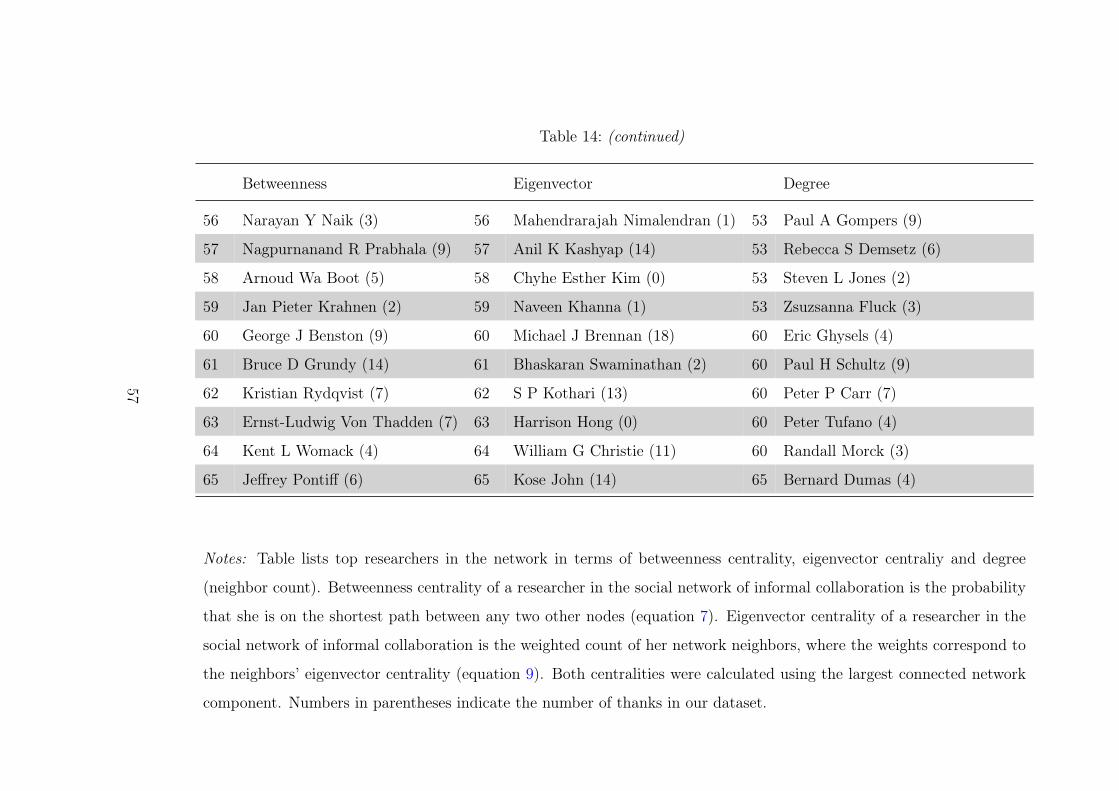
Table 14: (continued)
Betweenness Eigenvector Degree
56 Narayan Y Naik (3) 56 Mahendrarajah Nimalendran (1) 53 Paul A Gompers (9)
57 Nagpurnanand R Prabhala (9) 57 Anil K Kashyap (14) 53 Rebecca S Demsetz (6)
58 Arnoud Wa Boot (5) 58 Chyhe Esther Kim (0) 53 Steven L Jones (2)
59 Jan Pieter Krahnen (2) 59 Naveen Khanna (1) 53 Zsuzsanna Fluck (3)
60 George J Benston (9) 60 Michael J Brennan (18) 60 Eric Ghysels (4)
61 Bruce D Grundy (14) 61 Bhaskaran Swaminathan (2) 60 Paul H Schultz (9)
62 Kristian Rydqvist (7) 62 S P Kothari (13) 60 Peter P Carr (7)
63 Ernst-Ludwig Von Thadden (7) 63 Harrison Hong (0) 60 Peter Tufano (4)
64 Kent L Womack (4) 64 William G Christie (11) 60 Randall Morck (3)
65 Jeffrey Pontiff (6) 65 Kose John (14) 65 Bernard Dumas (4)
Notes: Table lists top researchers in the network in terms of betweenness centrality, eigenvector centraliy and degree
(neighbor count). Betweenness centrality of a researcher in the social network of informal collaboration is the probability
that she is on the shortest path between any two other nodes (equation 7). Eigenvector centrality of a researcher in the
social network of informal collaboration is the weighted count of her network neighbors, where the weights correspond to
the neighbors’ eigenvector centrality (equation 9). Both centralities were calculated using the largest connected network
component. Numbers in parentheses indicate the number of thanks in our dataset.
57
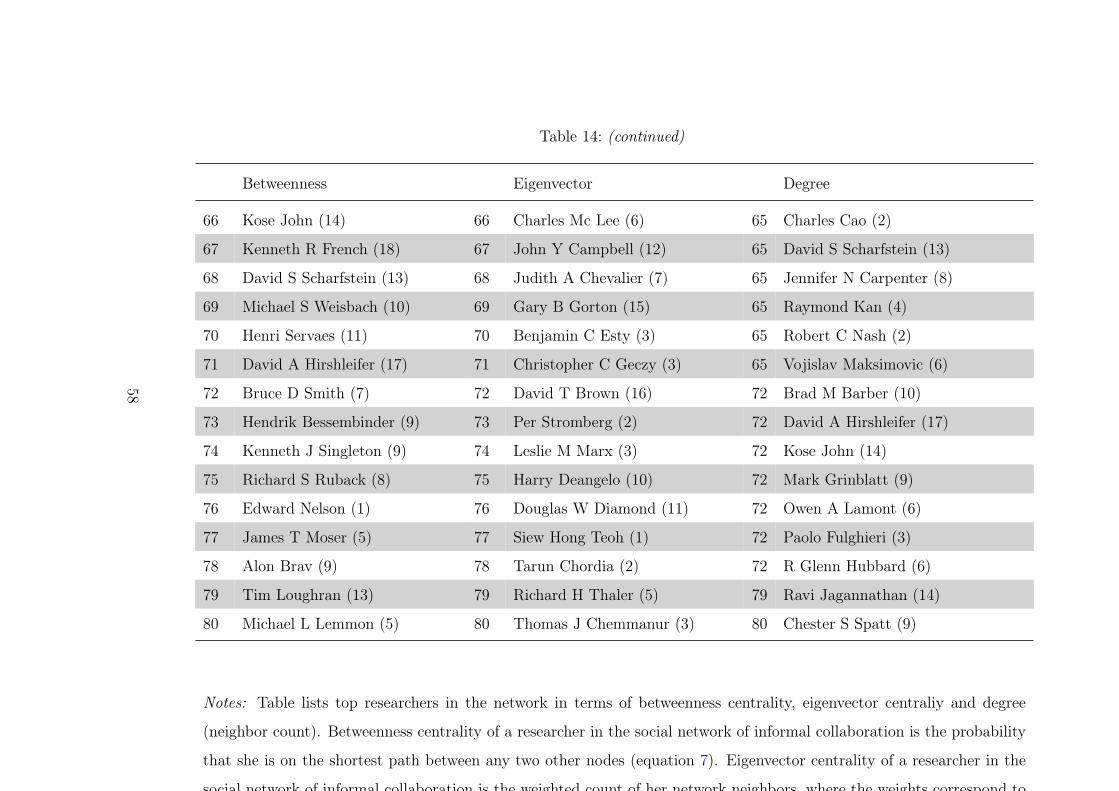
Table 14: (continued)
Betweenness Eigenvector Degree
66 Kose John (14) 66 Charles Mc Lee (6) 65 Charles Cao (2)
67 Kenneth R French (18) 67 John Y Campbell (12) 65 David S Scharfstein (13)
68 David S Scharfstein (13) 68 Judith A Chevalier (7) 65 Jennifer N Carpenter (8)
69 Michael S Weisbach (10) 69 Gary B Gorton (15) 65 Raymond Kan (4)
70 Henri Servaes (11) 70 Benjamin C Esty (3) 65 Robert C Nash (2)
71 David A Hirshleifer (17) 71 Christopher C Geczy (3) 65 Vojislav Maksimovic (6)
72 Bruce D Smith (7) 72 David T Brown (16) 72 Brad M Barber (10)
73 Hendrik Bessembinder (9) 73 Per Stromberg (2) 72 David A Hirshleifer (17)
74 Kenneth J Singleton (9) 74 Leslie M Marx (3) 72 Kose John (14)
75 Richard S Ruback (8) 75 Harry Deangelo (10) 72 Mark Grinblatt (9)
76 Edward Nelson (1) 76 Douglas W Diamond (11) 72 Owen A Lamont (6)
77 James T Moser (5) 77 Siew Hong Teoh (1) 72 Paolo Fulghieri (3)
78 Alon Brav (9) 78 Tarun Chordia (2) 72 R Glenn Hubbard (6)
79 Tim Loughran (13) 79 Richard H Thaler (5) 79 Ravi Jagannathan (14)
80 Michael L Lemmon (5) 80 Thomas J Chemmanur (3) 80 Chester S Spatt (9)
Notes: Table lists top researchers in the network in terms of betweenness centrality, eigenvector centraliy and degree
(neighbor count). Betweenness centrality of a researcher in the social network of informal collaboration is the probability
that she is on the shortest path between any two other nodes (equation 7). Eigenvector centrality of a researcher in the
social network of informal collaboration is the weighted count of her network neighbors, where the weights correspond to
the neighbors’ eigenvector centrality (equation 9). Both centralities were calculated using the largest connected network
component. Numbers in parentheses indicate the number of thanks in our dataset.
58

Table 14: (continued)
Betweenness Eigenvector Degree
81 Campbell R Harvey (14) 81 Campbell R Harvey (14) 80 Jeffrey Pontiff (6)
82 Gurdip S Bakshi (1) 82 Mark Grinblatt (9) 80 Joshua Lerner (9)
83 Hyuk Choe (1) 83 Oliver Hart (9) 80 Robert E Whaley (3)
84 George Selgin (3) 84 Wayne E Ferson (25) 80 Russ Wermers (3)
85 Bruno Biais (8) 85 Matthew Spiegel (10) 80 Siew Hong Teoh (1)
86 Kees G Koedijk (0) 86 Todd C Pulvino (6) 80 Stuart C Gilson (8)
86 Mark D Flood (0) 87 Michel A Habib (6) 80 Venkat Subramaniam (1)
86 Ronald Huisman (0) 88 Michael L Lemmon (5) 88 Bhaskaran Swaminathan (2)
86 Ronald J Mahieu (0) 89 Joel F Houston (4) 88 Christopher M James (15)
90 Paul A Gompers (9) 90 Donald B Keim (4) 88 Ernst Maug (12)
91 Robert R Grauer (0) 91 Tj Wong (0) 88 Harry Deangelo (10)
92 Michael J Barclay (11) 92 Ravi Jagannathan (14) 88 Michael J Barclay (11)
93 D Bruce Johnsen (1) 93 Ananth Madhavan (17) 88 Suresh M Sundaresan (6)
94 Richard J Sweeney (0) 94 Theo Vermaelen (4) 88 Tj Wong (0)
95 Bert Scholtens (0) 95 Peter Tufano (4) 95 Carlos P Maquieira (0)
Notes: Table lists top researchers in the network in terms of betweenness centrality, eigenvector centraliy and degree
(neighbor count). Betweenness centrality of a researcher in the social network of informal collaboration is the probability
that she is on the shortest path between any two other nodes (equation 7). Eigenvector centrality of a researcher in the
social network of informal collaboration is the weighted count of her network neighbors, where the weights correspond to
the neighbors’ eigenvector centrality (equation 9). Both centralities were calculated using the largest connected network
component. Numbers in parentheses indicate the number of thanks in our dataset.
59
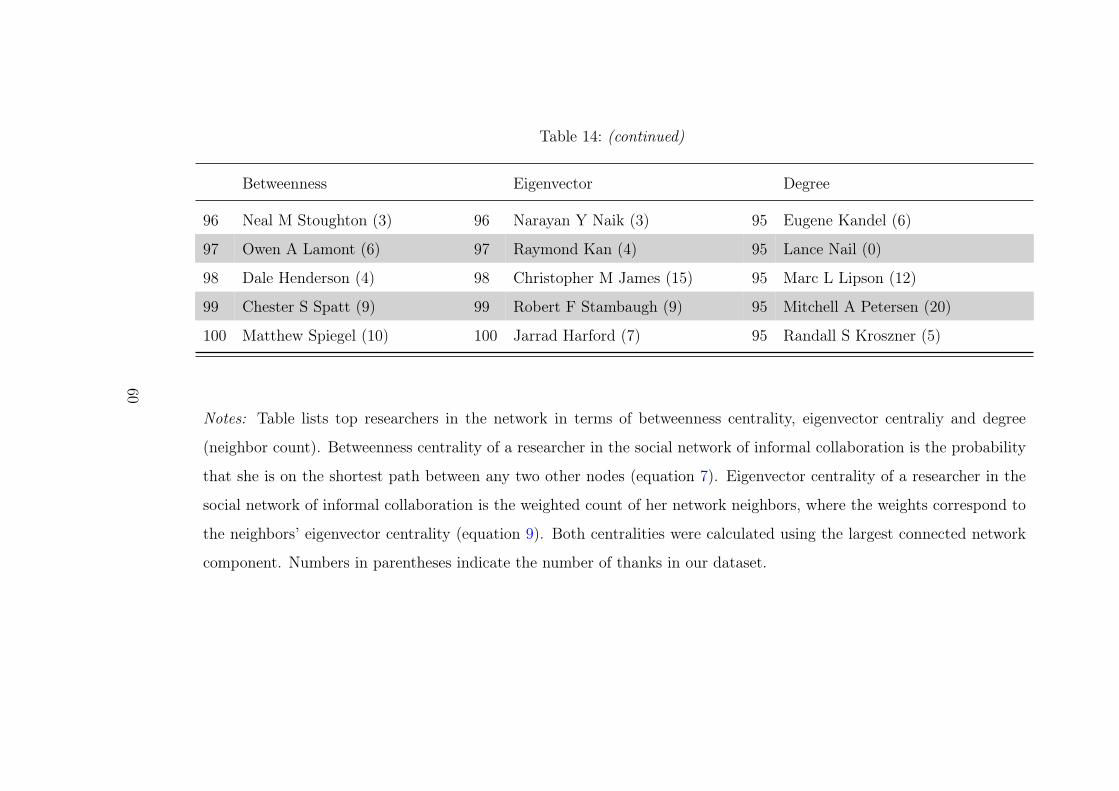
Table 14: (continued)
Betweenness Eigenvector Degree
96 Neal M Stoughton (3) 96 Narayan Y Naik (3) 95 Eugene Kandel (6)
97 Owen A Lamont (6) 97 Raymond Kan (4) 95 Lance Nail (0)
98 Dale Henderson (4) 98 Christopher M James (15) 95 Marc L Lipson (12)
99 Chester S Spatt (9) 99 Robert F Stambaugh (9) 95 Mitchell A Petersen (20)
100 Matthew Spiegel (10) 100 Jarrad Harford (7) 95 Randall S Kroszner (5)
Notes: Table lists top researchers in the network in terms of betweenness centrality, eigenvector centraliy and degree
(neighbor count). Betweenness centrality of a researcher in the social network of informal collaboration is the probability
that she is on the shortest path between any two other nodes (equation 7). Eigenvector centrality of a researcher in the
social network of informal collaboration is the weighted count of her network neighbors, where the weights correspond to
the neighbors’ eigenvector centrality (equation 9). Both centralities were calculated using the largest connected network
component. Numbers in parentheses indicate the number of thanks in our dataset.
60

Table 15: Most central researchers in the social network of informal collaboration in the late subsample (2009-2011) -rank 26 through 100
Betweenness Eigenvector Degree
26 Ronald W Masulis (23) 26 Isil Erel (3) 26 Stijn G Van Nieuwerburgh (9)
27 Kai Li (12) 27 S Viswanathan (20) 27 Kj Martijn Cremers (11)
28 Tarun Chordia (11) 28 Alok Kumar (5) 27 Kose John (21)
29 Andrew Metrick (23) 29 Stewart C Myers (21) 29 Bernard Dumas (29)
30 Steven Ongena (22) 30 Lauren H Cohen (17) 29 Campbell R Harvey (29)
31 Martin F Grace (6) 31 Jeffrey Wurgler (21) 31 John Y Campbell (41)
32 Henrik Cronqvist (9) 32 J Darrell Duffie (40) 32 Amiyatosh K Purnanandam (12)
33 William L Megginson (13) 33 Massimo Massa (12) 32 Ralph Sj Koijen (7)
34 Holger Spamann (3) 34 Sreedhar T Bharath (18) 32 Zhi Da (6)
35 Andrei Shleifer (42) 35 Murillo Campello (18) 35 Alok Kumar (5)
36 Richard Roll (8) 36 Alon Brav (15) 35 David A Hirshleifer (22)
37 Philip E Strahan (30) 37 Raghuram G Rajan (18) 35 Rudiger Fahlenbrach (10)
38 Sheridan Titman (37) 38 Antoinette Schoar (31) 38 Robin Greenwood (12)
39 W Scott Frame (4) 39 Yakov Amihud (39) 39 Jay R Ritter (33)
40 Murray Carlson (8) 40 David S Scharfstein (24) 39 Mitchell A Petersen (43)
Notes: Table lists top researchers in the network in terms of betweenness centrality, eigenvector centraliy and degree
(neighbor count). Betweenness centrality of a researcher in the social network of informal collaboration is the probability
that she is on the shortest path between any two other nodes (equation 7). Eigenvector centrality of a researcher in the
social network of informal collaboration is the weighted count of her network neighbors, where the weights correspond to
the neighbors’ eigenvector centrality (equation 9). Both centralities were calculated using the largest connected network
component. Numbers in parentheses indicate the number of thanks in our dataset.
61

Table 15: (continued)
Betweenness Eigenvector Degree
41 Jeremy C Stein (67) 41 Luigi Zingales (26) 41 Amir Sufi (21)
42 Lucio Sarno (3) 42 Adriano A Rampini (18) 42 Per Stromberg (24)
43 Vladimir Atanasov (4) 43 Tobias J Moskowitz (20) 43 John R Graham (21)
44 Bernard S Black (11) 44 Andrew Metrick (23) 43 Murray Carlson (8)
45 Fabio Panetta (6) 45 G Andrew Karolyi (28) 45 Jie Cai (4)
46 Chen Lin (0) 46 Augustin Landier (8) 46 Dimitry Livdan (9)
47 Xavier Gabaix (27) 47 David A Matsa (4) 46 Heitor W Almeida (24)
48 Kj Martijn Cremers (11) 48 Juhani T Linnainmaa (7) 46 Ilya A Strebulaev (15)
49 Jie Cai (4) 49 Dimitry Livdan (9) 49 Henrik Cronqvist (9)
50 Jeffrey H Harris (0) 50 Campbell R Harvey (29) 49 Malcolm P Baker (30)
51 Stefano Neri (1) 51 Lubos Pastor (33) 49 Michael W Brandt (22)
52 Jordi Gali (9) 52 Morten Sorensen (18) 49 Patrick Bolton (29)
53 Sumit Agarwal (5) 53 Jack Bao (3) 53 Bruce I Carlin (6)
54 Rajesh K Aggarwal (8) 54 Ilya A Strebulaev (15) 53 Kai Li (12)
55 Adrian Pagan (6) 55 Nittai K Bergman (6) 53 Victoria Ivashina (14)
Notes: Table lists top researchers in the network in terms of betweenness centrality, eigenvector centraliy and degree
(neighbor count). Betweenness centrality of a researcher in the social network of informal collaboration is the probability
that she is on the shortest path between any two other nodes (equation 7). Eigenvector centrality of a researcher in the
social network of informal collaboration is the weighted count of her network neighbors, where the weights correspond to
the neighbors’ eigenvector centrality (equation 9). Both centralities were calculated using the largest connected network
component. Numbers in parentheses indicate the number of thanks in our dataset.
62

Table 15: (continued)
Betweenness Eigenvector Degree
56 Christian T Lundblad (9) 56 John H Cochrane (30) 56 Franklin Allen (36)
57 S Viswanathan (20) 57 Rudiger Fahlenbrach (10) 56 Lu Zhang (12)
58 Murillo Campello (18) 58 Todd A Gormley (11) 56 Mara Faccio (18)
59 David A Hirshleifer (22) 59 Per Stromberg (24) 56 Murillo Campello (18)
60 Gregory F Udell (14) 60 Michael Faulkender (16) 56 Steven N Kaplan (30)
61 Tim Bollerslev (11) 61 Avanidhar Subrahmanyam (21) 61 Haitao Li (3)
62 Amit Seru (14) 62 Patrick Bolton (29) 61 Sudheer Chava (6)
63 Heitor W Almeida (24) 63 Michael S Weisbach (31) 63 Alexander W Butler (11)
64 Mark S Seasholes (16) 64 Toni M Whited (20) 63 Henri Servaes (15)
65 Wei Jiang (15) 65 Clifford G Holderness (12) 63 Lubos Pastor (33)
Notes: Table lists top researchers in the network in terms of betweenness centrality, eigenvector centraliy and degree
(neighbor count). Betweenness centrality of a researcher in the social network of informal collaboration is the probability
that she is on the shortest path between any two other nodes (equation 7). Eigenvector centrality of a researcher in the
social network of informal collaboration is the weighted count of her network neighbors, where the weights correspond to
the neighbors’ eigenvector centrality (equation 9). Both centralities were calculated using the largest connected network
component. Numbers in parentheses indicate the number of thanks in our dataset.
63
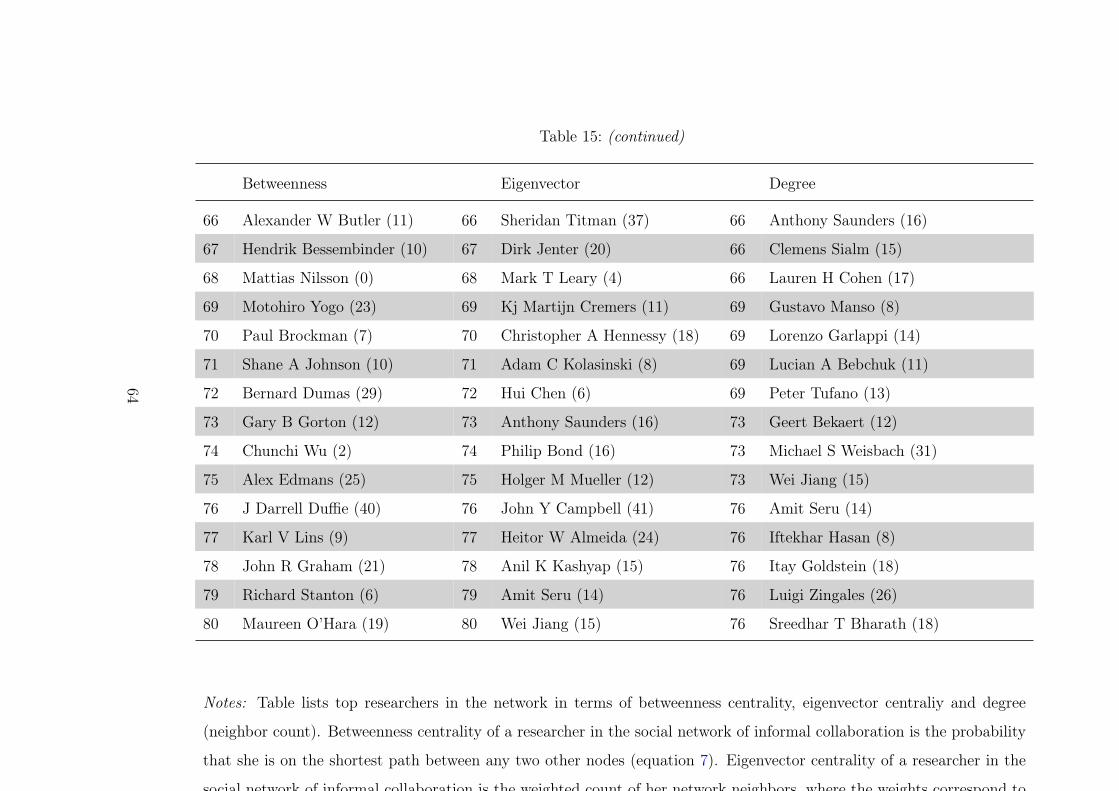
Table 15: (continued)
Betweenness Eigenvector Degree
66 Alexander W Butler (11) 66 Sheridan Titman (37) 66 Anthony Saunders (16)
67 Hendrik Bessembinder (10) 67 Dirk Jenter (20) 66 Clemens Sialm (15)
68 Mattias Nilsson (0) 68 Mark T Leary (4) 66 Lauren H Cohen (17)
69 Motohiro Yogo (23) 69 Kj Martijn Cremers (11) 69 Gustavo Manso (8)
70 Paul Brockman (7) 70 Christopher A Hennessy (18) 69 Lorenzo Garlappi (14)
71 Shane A Johnson (10) 71 Adam C Kolasinski (8) 69 Lucian A Bebchuk (11)
72 Bernard Dumas (29) 72 Hui Chen (6) 69 Peter Tufano (13)
73 Gary B Gorton (12) 73 Anthony Saunders (16) 73 Geert Bekaert (12)
74 Chunchi Wu (2) 74 Philip Bond (16) 73 Michael S Weisbach (31)
75 Alex Edmans (25) 75 Holger M Mueller (12) 73 Wei Jiang (15)
76 J Darrell Duffie (40) 76 John Y Campbell (41) 76 Amit Seru (14)
77 Karl V Lins (9) 77 Heitor W Almeida (24) 76 Iftekhar Hasan (8)
78 John R Graham (21) 78 Anil K Kashyap (15) 76 Itay Goldstein (18)
79 Richard Stanton (6) 79 Amit Seru (14) 76 Luigi Zingales (26)
80 Maureen O’Hara (19) 80 Wei Jiang (15) 76 Sreedhar T Bharath (18)
Notes: Table lists top researchers in the network in terms of betweenness centrality, eigenvector centraliy and degree
(neighbor count). Betweenness centrality of a researcher in the social network of informal collaboration is the probability
that she is on the shortest path between any two other nodes (equation 7). Eigenvector centrality of a researcher in the
social network of informal collaboration is the weighted count of her network neighbors, where the weights correspond to
the neighbors’ eigenvector centrality (equation 9). Both centralities were calculated using the largest connected network
component. Numbers in parentheses indicate the number of thanks in our dataset.
64

Table 15: (continued)
Betweenness Eigenvector Degree
81 Eduardo S Schwartz (8) 81 Jiang Wang (16) 76 Toni M Whited (20)
82 Sreedhar T Bharath (18) 82 Ralph Sj Koijen (7) 82 Maureen O’Hara (19)
83 Mark J Flannery (22) 83 Peter M Demarzo (26) 83 Berk A Sensoy (9)
84 Per Stromberg (24) 84 Philip E Strahan (30) 83 Jorg Rocholl (6)
85 Lucian A Bebchuk (11) 85 Kose John (21) 85 Eduardo S Schwartz (8)
86 Souphala Chomsisengphet (1) 86 Richard Roll (8) 85 Guofu Zhou (5)
87 Alok Kumar (5) 87 Michael W Brandt (22) 85 Hendrik Bessembinder (10)
88 Hong Liu (6) 88 Yuhai Xuan (3) 85 Jacob S Sagi (25)
89 Bas Jm Werker (12) 89 Harry Deangelo (18) 85 Josef Zechner (16)
90 Geraldo Cerqueiro (2) 90 David A Hirshleifer (22) 85 Jules H Van Binsbergen (5)
91 R David Mclean (6) 91 Simon Gervais (13) 85 Philip E Strahan (30)
92 Javier Suarez (14) 92 Uday Rajan (15) 85 Richard Stanton (6)
93 Luc Renneboog (2) 93 David J Thesmar (5) 85 Tobias J Moskowitz (20)
94 Warren Bailey (12) 94 Pietro Veronesi (12) 85 Wayne E Ferson (28)
95 Alexander Michaelides (1) 95 Jeffrey Zwiebel (16) 95 Narayan Y Naik (8)
Notes: Table lists top researchers in the network in terms of betweenness centrality, eigenvector centraliy and degree
(neighbor count). Betweenness centrality of a researcher in the social network of informal collaboration is the probability
that she is on the shortest path between any two other nodes (equation 7). Eigenvector centrality of a researcher in the
social network of informal collaboration is the weighted count of her network neighbors, where the weights correspond to
the neighbors’ eigenvector centrality (equation 9). Both centralities were calculated using the largest connected network
component. Numbers in parentheses indicate the number of thanks in our dataset.
65

Table 15: (continued)
Betweenness Eigenvector Degree
96 Laura T Starks (27) 96 Gordon M Phillips (17) 95 Naveen D Daniel (6)
97 Adlai J Fisher (9) 97 Henrik Cronqvist (9) 95 Vikas Agarwal (9)
98 Robert Deyoung (18) 98 Christa Hs Bouwman (2) 98 David J Thesmar (5)
99 Zhi Da (6) 99 Atif R Mian (12) 98 Jeffrey Wurgler (21)
100 Randall Morck (18) 100 Greg Nini (4) 100 Efraim Benmelech (7)
Notes: Table lists top researchers in the network in terms of betweenness centrality, eigenvector centraliy and degree
(neighbor count). Betweenness centrality of a researcher in the social network of informal collaboration is the probability
that she is on the shortest path between any two other nodes (equation 7). Eigenvector centrality of a researcher in the
social network of informal collaboration is the weighted count of her network neighbors, where the weights correspond to
the neighbors’ eigenvector centrality (equation 9). Both centralities were calculated using the largest connected network
component. Numbers in parentheses indicate the number of thanks in our dataset.
66