Embed Size (px)
Citation preview
5/1/2013
1
MISO BA Integration Update
NERC Resources Subcommittee
April 2013
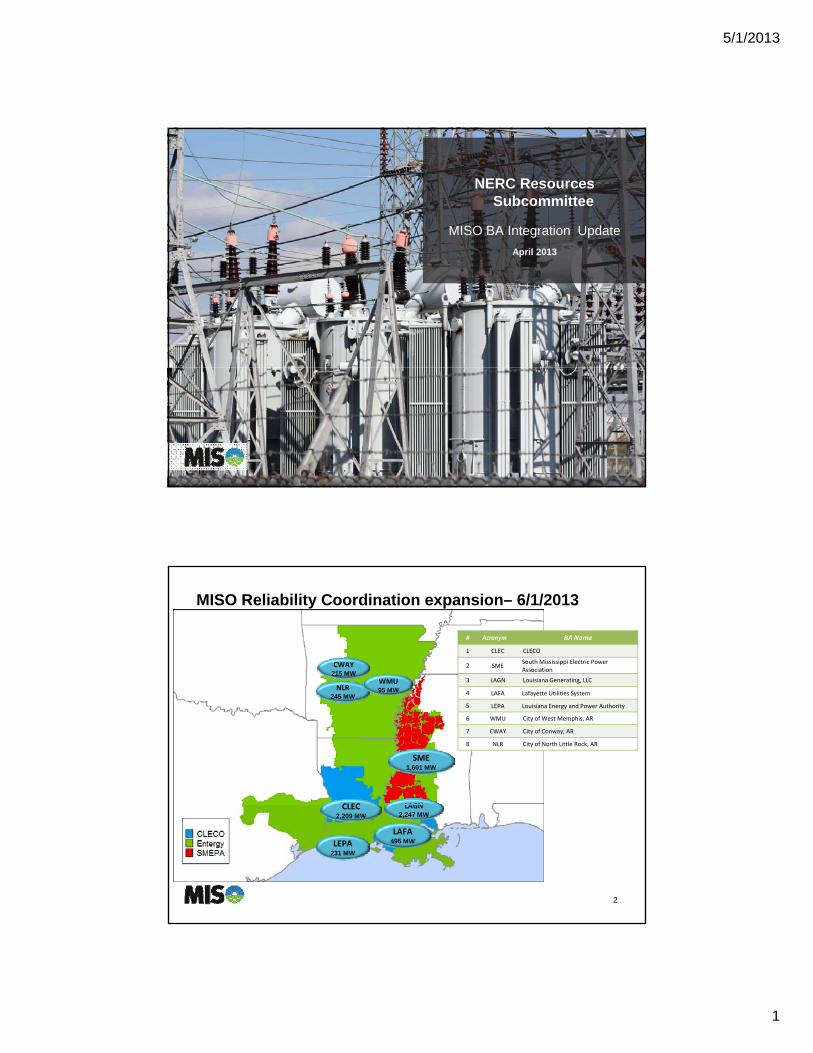
MISO Reliability Coordination expansion– 6/1/2013
CWAY215 MW
NLRWMU
# Acronym BA Name
1 CLEC CLECO
2 SMESouth Mississippi Electric Power Association
3 LAGN Louisiana Generating, LLC
SME1,601 MW
CLEC
NLR245 MW
95 MW
LAGN
4 LAFA Lafayette Utilities System
5 LEPA Louisiana Energy and Power Authority
6 WMU City of West Memphis, AR
7 CWAY City of Conway, AR
8 NLR City of North Little Rock, AR
2
LEPA231 MW
CLEC2,209 MW
LAFA495 MW
LAGN2,247 MW
5/1/2013
2
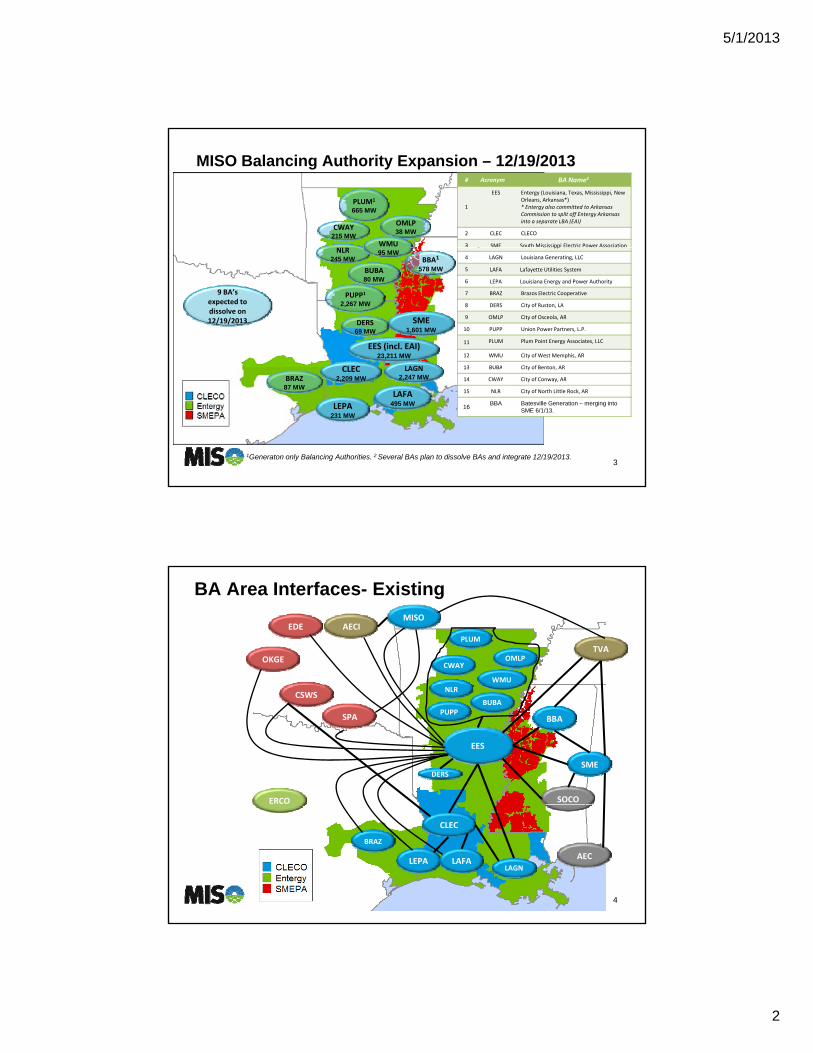
MISO Balancing Authority Expansion – 12/19/2013
OMLP38 MW
CWAY215 MW
NLRWMU
PLUM1
665 MW
# Acronym BA Name2
1
EES Entergy (Louisiana, Texas, Mississippi, New Orleans, Arkansas*)* Entergy also committed to Arkansas Commission to split off Entergy Arkansas into a separate LBA (EAI)
2 CLEC CLECO
3 SME South Mississippi Electric Power Association
SME1,601 MW
CLEC
BUBA80 MW
NLR245 MW
DERS69 MW
95 MW
PUPP1
2,267 MW
LAGN
BBA1
578 MW
EES (incl. EAI)23,211 MW
pp
4 LAGN Louisiana Generating, LLC
5 LAFA Lafayette Utilities System
6 LEPA Louisiana Energy and Power Authority
7 BRAZ Brazos Electric Cooperative
8 DERS City of Ruston, LA
9 OMLP City of Osceola, AR
10 PUPP Union Power Partners, L.P.
11 PLUM Plum Point Energy Associates, LLC
12 WMU City of West Memphis, AR
13 BUBA City of Benton AR
9 BA’s expected to dissolve on 12/19/2013
3
LEPA231 MW
CLEC2,209 MW
LAFA495 MW
LAGN2,247 MWBRAZ
87 MW
13 BUBA City of Benton, AR
14 CWAY City of Conway, AR
15 NLR City of North Little Rock, AR
16BBA Batesville Generation – merging into
SME 6/1/13.
1Generaton only Balancing Authorities. 2 Several BAs plan to dissolve BAs and integrate 12/19/2013.
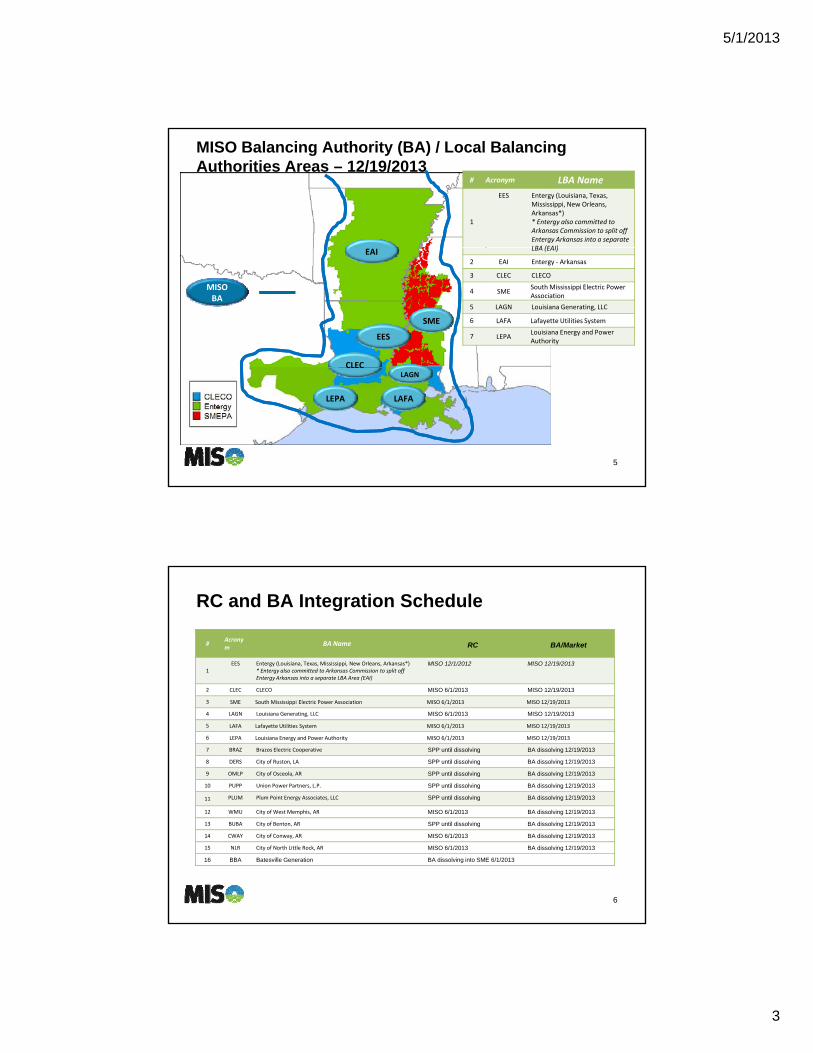
BA Area Interfaces- Existing
AECI
TVAOKGE
EDEMISO
OMLPCWAY
WMU
PLUM
BBA
SME
SOCO
CSWS
ERCO
SPA
BUBA
NLR
DERS
PUPP
EES
4
LEPA
CLEC
LAFALAGN
BRAZ
AEC
5/1/2013
3
MISO Balancing Authority (BA) / Local Balancing Authorities Areas – 12/19/2013
# Acronym LBA Name
1
EES Entergy (Louisiana, Texas, Mississippi, New Orleans, Arkansas*)* Entergy also committed to Arkansas Commission to split off Entergy Arkansas into a separate LBA (EAI)
SME
CLEC
EES
EAI
MISOBA
LBA (EAI)
2 EAI Entergy ‐ Arkansas
3 CLEC CLECO
4 SMESouth Mississippi Electric Power Association
5 LAGN Louisiana Generating, LLC
6 LAFA Lafayette Utilities System
7 LEPALouisiana Energy and Power Authority
5
LEPA
CLEC
LAFA
LAGN
RC and BA Integration Schedule
#Acronym
BA Name RC BA/Market
1EES Entergy (Louisiana, Texas, Mississippi, New Orleans, Arkansas*)
* Entergy also committed to Arkansas Commission to split off Entergy Arkansas into a separate LBA Area (EAI)
MISO 12/1/2012 MISO 12/19/2013
2 CLEC CLECO MISO 6/1/2013 MISO 12/19/2013
3 SME South Mississippi Electric Power Association MISO 6/1/2013 MISO 12/19/2013
4 LAGN Louisiana Generating, LLC MISO 6/1/2013 MISO 12/19/2013
5 LAFA Lafayette Utilities System MISO 6/1/2013 MISO 12/19/2013
6 LEPA Louisiana Energy and Power Authority MISO 6/1/2013 MISO 12/19/2013
7 BRAZ Brazos Electric Cooperative SPP until dissolving BA dissolving 12/19/2013
8 DERS City of Ruston, LA SPP until dissolving BA dissolving 12/19/2013
9 OMLP City of Osceola, AR SPP until dissolving BA dissolving 12/19/2013
10 PUPP Union Power Partners, L.P. SPP until dissolving BA dissolving 12/19/2013
11 PLUM Plum Point Energy Associates, LLC SPP until dissolving BA dissolving 12/19/2013
6
12 WMU City of West Memphis, AR MISO 6/1/2013 BA dissolving 12/19/2013
13 BUBA City of Benton, AR SPP until dissolving BA dissolving 12/19/2013
14 CWAY City of Conway, AR MISO 6/1/2013 BA dissolving 12/19/2013
15 NLR City of North Little Rock, AR MISO 6/1/2013 BA dissolving 12/19/2013
16 BBA Batesville Generation BA dissolving into SME 6/1/2013

5/1/2013
4
Summary
• MISO is merging a number of BA Areas into its BA Area. Several BAs are dissolving.
• Certification Team will verify MISO will have necessary tools, procedures and training to perform RC and BA functions for theprocedures, and training to perform RC and BA functions for the expanded footprint. There will be separate certifications for the RC footprint expansion and the BA Area expansion.
• Working with Certification Team on NERC’s Housekeeping Tasks for New, Reconfigured or Retiring Balancing Authorities that need to be done if there is a change in Balancing Authority footprints or names.
• Coordinated Functional Registration (CFR ID#: *JRO00001) detailsCoordinated Functional Registration (CFR ID#: JRO00001) details division of responsibilities detween MISO BA and Local BAs- No gaps in coverage – will be updated to reflect new Local BAs
7

5/1/2013
1
Wind Generators Providing Primary and Secondary Control
Resources Subcommittee
April 24 and 25, 2013
Sydney Niemeyer
Wind Generators and Primary Frequency Response
• 6465 MW of Wind Generation capacity has Primary Frequency Response active.– Present maximum dead‐band of +/‐0.036 Hz.
• Reduces to +/‐0.017 Hz under BAL‐001‐TRE‐1.
– Droop at 5% of Real Time Pmax based on available wind.– Approximately ‐200 MW/0.1 Hz from fleet when full wind is available.
– No requirement to hold spinning reserve.
• 2409 MW of Wind Generation capacity has been• 2409 MW of Wind Generation capacity has been granted a PFR requirement waiver.
• 2200 MW of Wind Generation capacity has unknown PFR status.
5/1/2013
2
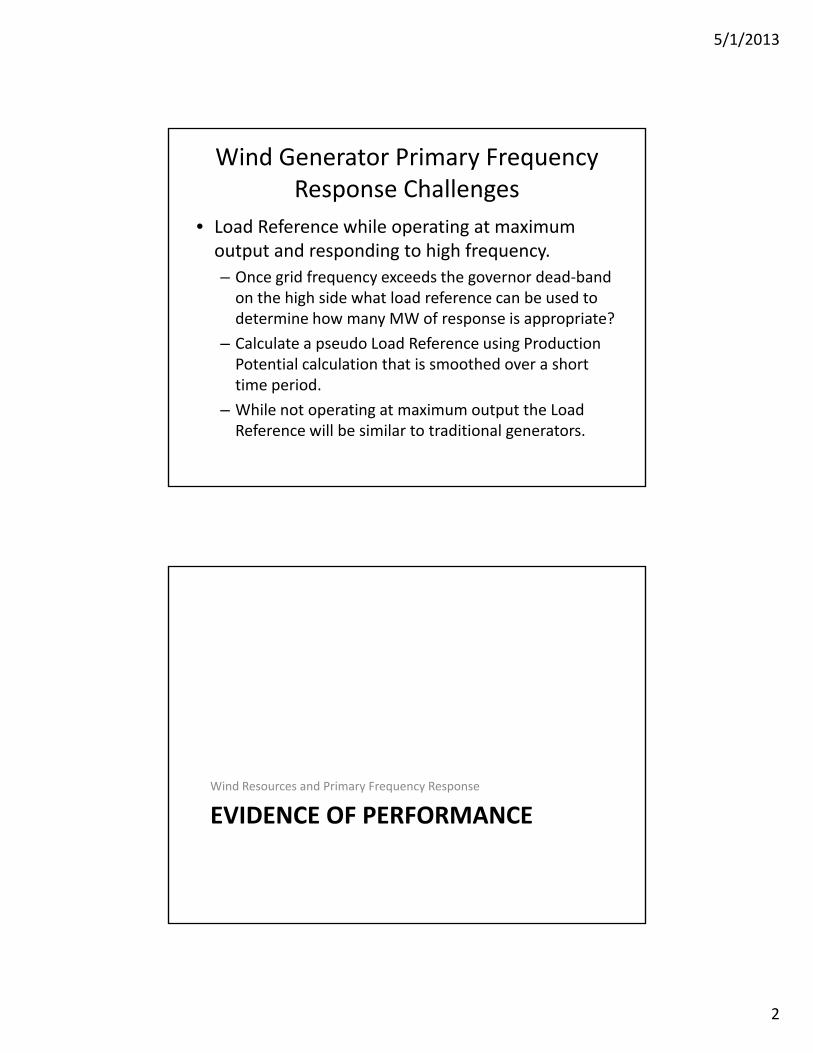
Wind Generator Primary Frequency Response Challenges
• Load Reference while operating at maximum output and responding to high frequencyoutput and responding to high frequency.
– Once grid frequency exceeds the governor dead‐band on the high side what load reference can be used to determine how many MW of response is appropriate?
– Calculate a pseudo Load Reference using Production Potential calculation that is smoothed over a shortPotential calculation that is smoothed over a short time period.
– While not operating at maximum output the Load Reference will be similar to traditional generators.
Wind Resources and Primary Frequency Response
EVIDENCE OF PERFORMANCE
5/1/2013
3
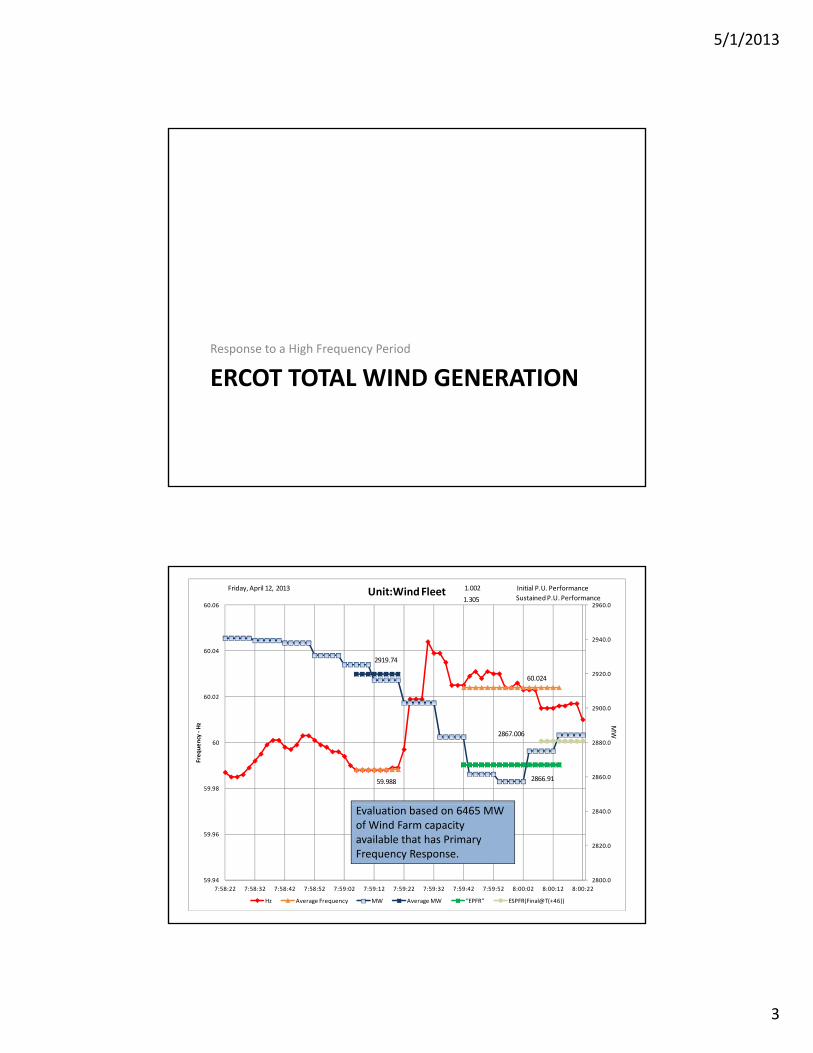
Response to a High Frequency Period
ERCOT TOTAL WIND GENERATION
2920.0
2940.0
2960.0
60.04
60.06
Unit:Wind Fleet
60.024
2919.74
1.002 Initial P.U. PerformanceFriday, April 12, 2013
1.305 Sustained P.U. Performance
2860.0
2880.0
2900.0
59.98
60
60.02
Frequency ‐Hz
2866.91
MW
59.988
2867.006
2800.0
2820.0
2840.0
59.94
59.96
7:58:22 7:58:32 7:58:42 7:58:52 7:59:02 7:59:12 7:59:22 7:59:32 7:59:42 7:59:52 8:00:02 8:00:12 8:00:22
Hz Average Frequency MW Average MW "EPFR" ESPFR(Final@T(+46))
Evaluation based on 6465 MW of Wind Farm capacity available that has Primary Frequency Response.
5/1/2013
4
2900.0
3000.0
3100.0
60.02
60.04
60.06
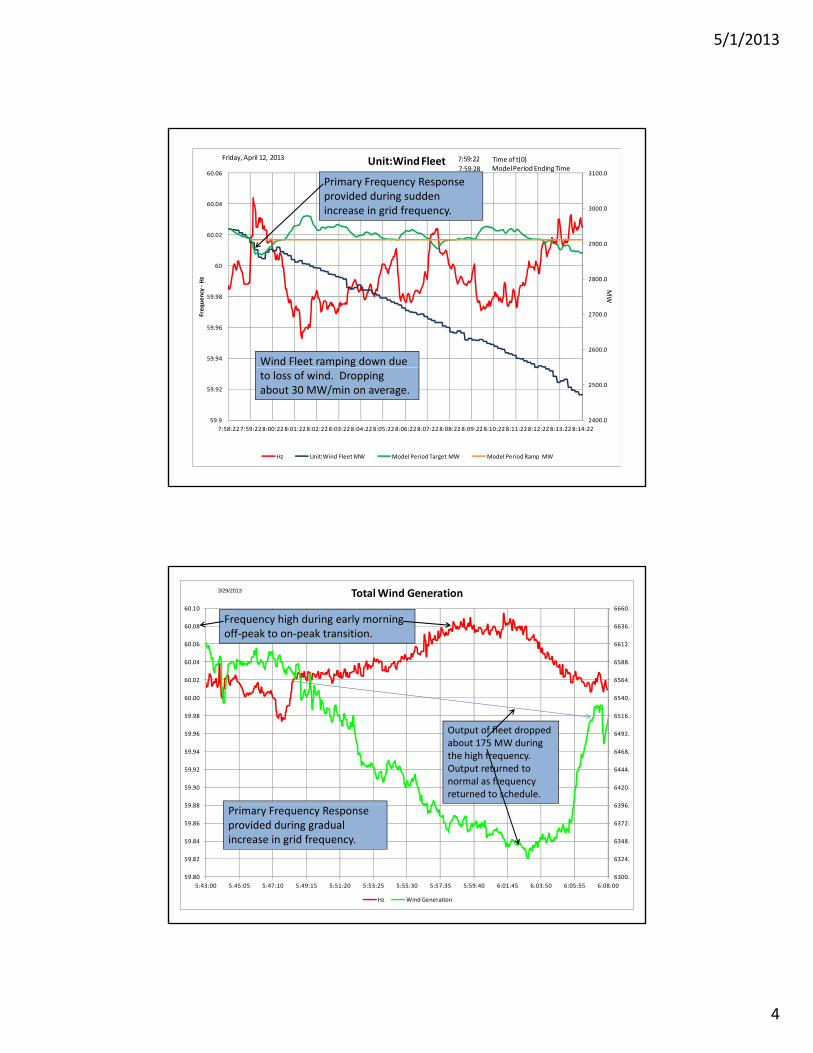
Unit:Wind FleetFriday, April 12, 2013
7:59:28 Model Period Ending Time
7:59:22 Time of t(0)
Primary Frequency Response provided during sudden increase in grid frequency.
2600.0
2700.0
2800.0
59.94
59.96
59.98
60
Frequency ‐Hz
MW
Wind Fleet ramping down due
2400.0
2500.0
59.9
59.92
7:58:227:59:228:00:228:01:228:02:228:03:228:04:228:05:228:06:228:07:228:08:228:09:228:10:228:11:228:12:228:13:228:14:22
Hz Unit:Wind Fleet MW Model Period Target MW Model Period Ramp MW
to loss of wind. Dropping about 30 MW/min on average.
6564.
6588.
6612.
6636.
6660.
60.02
60.04
60.06
60.08
60.10
Total Wind Generation3/29/2013
Frequency high during early morning off‐peak to on‐peak transition.
6396
6420.
6444.
6468.
6492.
6516.
6540.
59 88
59.90
59.92
59.94
59.96
59.98
60.00
Output of fleet dropped about 175 MW during the high frequency. Output returned to normal as frequency returned to schedule.
6300.
6324.
6348.
6372.
6396.
59.80
59.82
59.84
59.86
59.88
5:43:00 5:45:05 5:47:10 5:49:15 5:51:20 5:53:25 5:55:30 5:57:35 5:59:40 6:01:45 6:03:50 6:05:55 6:08:00
Hz Wind Generation
Primary Frequency Response provided during gradual increase in grid frequency.
5/1/2013
5
6051.
6092.
6133.
6174.
6215.
60.02
60.04
60.06
60.08
60.10
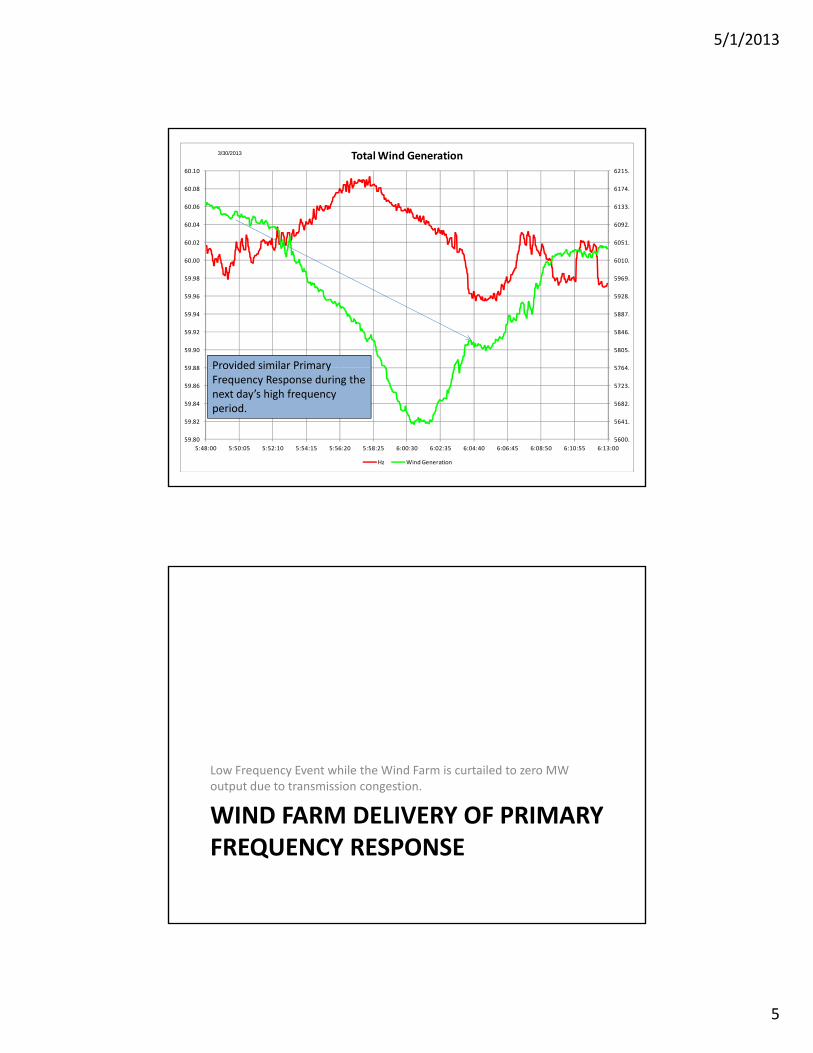
Total Wind Generation3/30/2013
5764
5805.
5846.
5887.
5928.
5969.
6010.
59 88
59.90
59.92
59.94
59.96
59.98
60.00
Provided similar Primary
5600.
5641.
5682.
5723.
5764.
59.80
59.82
59.84
59.86
59.88
5:48:00 5:50:05 5:52:10 5:54:15 5:56:20 5:58:25 6:00:30 6:02:35 6:04:40 6:06:45 6:08:50 6:10:55 6:13:00
Hz Wind Generation
Provided similar Primary Frequency Response during the next day’s high frequency period.
Low Frequency Event while the Wind Farm is curtailed to zero MW output due to transmission congestion.
WIND FARM DELIVERY OF PRIMARY FREQUENCY RESPONSE
5/1/2013
6
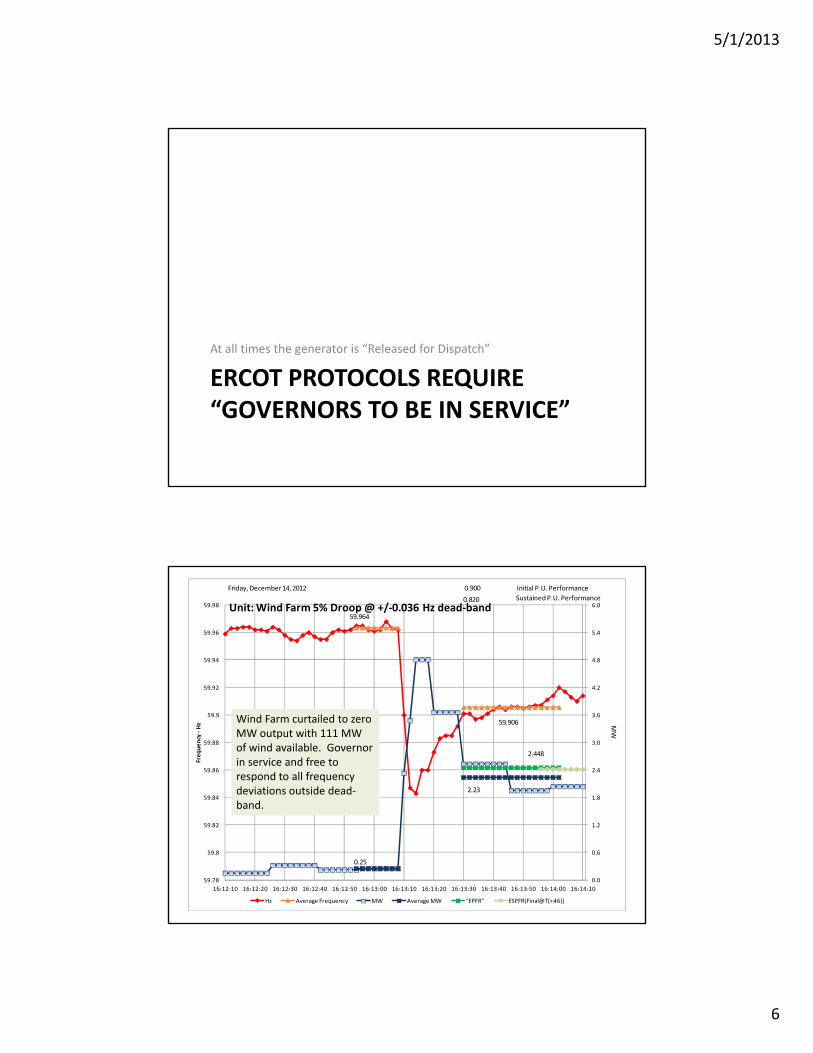
At all times the generator is “Released for Dispatch”
ERCOT PROTOCOLS REQUIRE “GOVERNORS TO BE IN SERVICE”
4.8
5.4
6.0
59.94
59.96
59.98 Unit: Wind Farm 5% Droop @ +/‐0.036 Hz dead‐band
0.900 Initial P.U. PerformanceFriday, December 14, 2012
0.820 Sustained P.U. Performance
59.964
1.8
2.4
3.0
3.6
4.2
59.84
59.86
59.88
59.9
59.92
Frequency ‐Hz
2.23
59.906 MW
2.448
Wind Farm curtailed to zero MW output with 111 MW of wind available. Governor in service and free to respond to all frequency deviations outside dead‐band
0.0
0.6
1.2
59.78
59.8
59.82
16:12:10 16:12:20 16:12:30 16:12:40 16:12:50 16:13:00 16:13:10 16:13:20 16:13:30 16:13:40 16:13:50 16:14:00 16:14:10
Hz Average Frequency MW Average MW "EPFR" ESPFR(Final@T(+46))
0.25
band.
5/1/2013
7
4.0
5.0
6.0
59.98
60
60.02
60.04
60.06
60.08
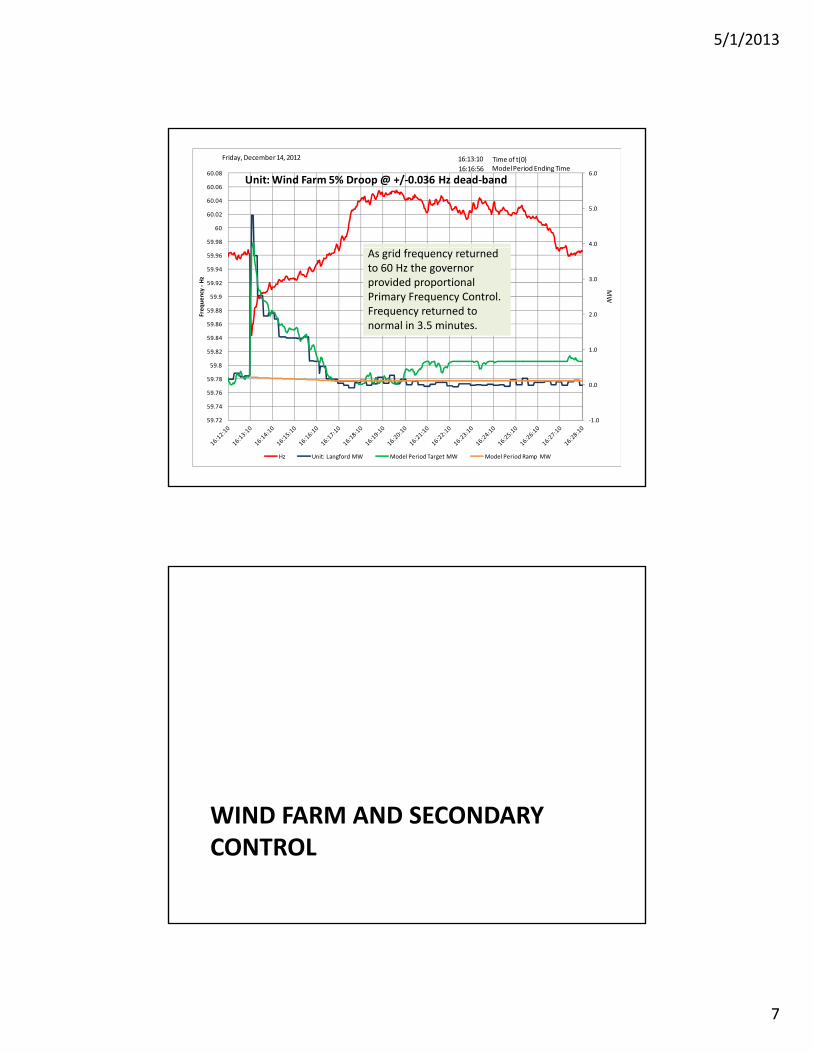
Unit: Wind Farm 5% Droop @ +/‐0.036 Hz dead‐band
Friday, December 14, 2012
16:16:56 Model Period Ending Time
16:13:10 Time of t(0)
1.0
2.0
3.0
59.8
59.82
59.84
59.86
59.88
59.9
59.92
59.94
59.96
Frequency ‐Hz
MW
As grid frequency returned to 60 Hz the governor provided proportional Primary Frequency Control. Frequency returned to normal in 3.5 minutes.
‐1.0
0.0
59.72
59.74
59.76
59.78
59.8
Hz Unit: Langford MW Model Period Target MW Model Period Ramp MW
WIND FARM AND SECONDARY CONTROL
5/1/2013
8
155 MW Wind Farm
60.06
60.08
60.1
120
135
150
-0.117
0.128
0.293
0.014
-3.482
-3.190
-6.963
-6.504
-5.317
-5.280
1.375
1.016
-1.516
-1.299
-2.420
-2.435
1.483
1.281
6.003
5.548
6.521
6.566
2.785
3.087
UDBP
Output ROCMW/min avg
17-FEB-13 00:15:00
59.96
59.98
60
60.02
60.04
Fre
qu
ency
Hz
60
75
90
105
MW
59.9
59.92
59.94
59.96
0:15:00 0:20:00 0:25:00 0:30:00 0:35:00 0:40:00 0:45:00 0:50:00 0:55:00 1:00:00 1:05:00 1:10:00 1:15:00
0
15
30
45
Frequency BP UDBP Target MW
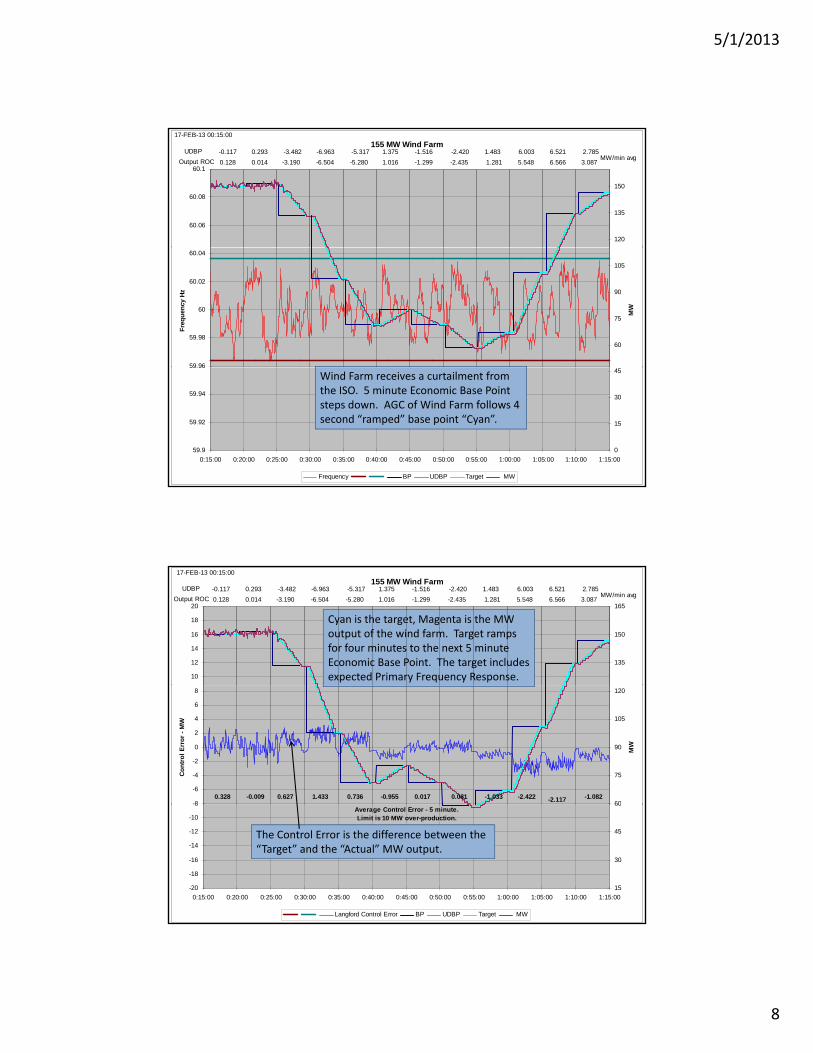
Wind Farm receives a curtailment from the ISO. 5 minute Economic Base Point steps down. AGC of Wind Farm follows 4 second “ramped” base point “Cyan”.
155 MW Wind Farm
10
12
14
16
18
20
135
150
165
-0.117
0.128
0.293
0.014
-3.482
-3.190
-6.963
-6.504
-5.317
-5.280
1.375
1.016
-1.516
-1.299
-2.420
-2.435
1.483
1.281
6.003
5.548
6.521
6.566
2.785
3.087
UDBP
Output ROCMW/min avg
17-FEB-13 00:15:00
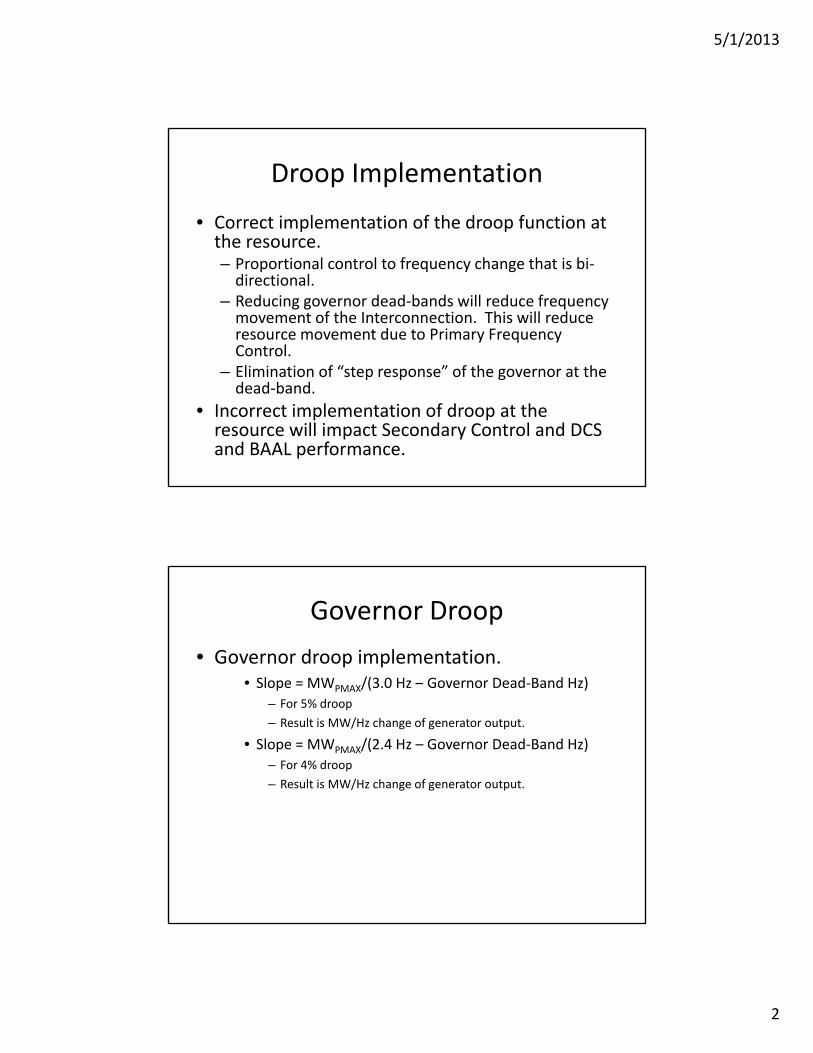
Cyan is the target, Magenta is the MW output of the wind farm. Target ramps for four minutes to the next 5 minute Economic Base Point. The target includes expected Primary Frequency Response.
-8
-6
-4
-2
0
2
4
6
8
Co
ntr
ol
Err
or
- M
W
60
75
90
105
120
MW
0.328 -0.009 0.627 1.433 0.736 -0.955 0.017 0.081 -1.033 -2.422 -2.117 -1.082
-20
-18
-16
-14
-12
-10
8
0:15:00 0:20:00 0:25:00 0:30:00 0:35:00 0:40:00 0:45:00 0:50:00 0:55:00 1:00:00 1:05:00 1:10:00 1:15:00
15
30
45
60
Langford Control Error BP UDBP Target MW
Average Control Error - 5 minute. Limit is 10 MW over-production.
The Control Error is the difference between the “Target” and the “Actual” MW output.

5/1/2013
9
Questions?

5/1/2013
1
Primary and Secondary Control Interaction
Resources Subcommittee
April 24 & 25, 2013
Sydney Niemeyer
Primary and Secondary Control Interaction
• Concern that if a resource is providing Primary Frequency Control it could impact the BA’s Frequency Control it could impact the A sperformance and recovery during a DCS or BAAL event.– Valid concern when ACE Bias setting does not match actual Primary Frequency Response of the BA.
– BAL‐003‐1 allows for a gradual reduction of the “over‐bias” of the Interconnections and also allows for the
f V i bl Bi S iuse of a Variable Bias Setting.
• Bias setting in the ACE equation that closely matches actual Primary Frequency Response minimizes interaction of Control.
5/1/2013
2
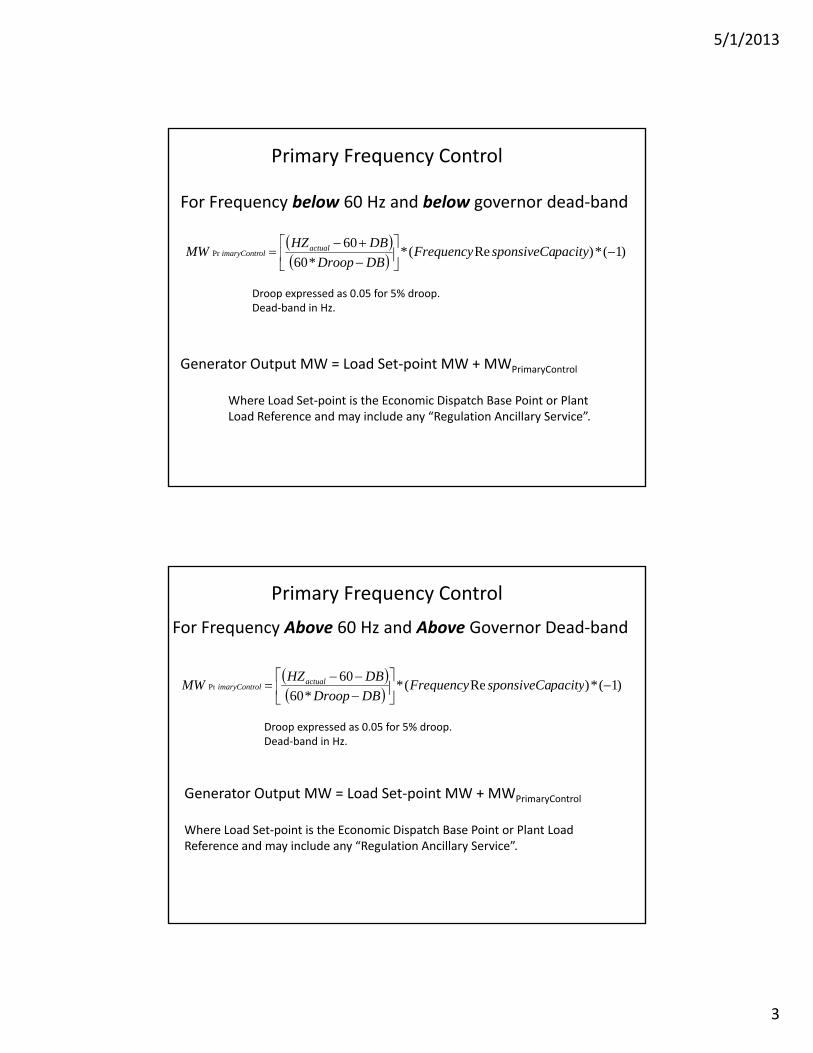
Droop Implementation
• Correct implementation of the droop function at the resource.the resource.– Proportional control to frequency change that is bi‐directional.
– Reducing governor dead‐bands will reduce frequency movement of the Interconnection. This will reduce resource movement due to Primary Frequency Control.Eli i ti f “ t ” f th t th– Elimination of “step response” of the governor at the dead‐band.
• Incorrect implementation of droop at the resource will impact Secondary Control and DCS and BAAL performance.
Governor Droop
• Governor droop implementation.• Slope = MWPMAX/(3 0 Hz – Governor Dead‐Band Hz)Slope = MWPMAX/(3.0 Hz Governor Dead Band Hz)
– For 5% droop
– Result is MW/Hz change of generator output.
• Slope = MWPMAX/(2.4 Hz – Governor Dead‐Band Hz)– For 4% droop
– Result is MW/Hz change of generator output.
5/1/2013
3
)1(*)R(*
60
ii CFDBHZ
MW actual
For Frequency below 60 Hz and below governor dead‐band
Primary Frequency Control
)1(*)Re(*
*60Pr
pacitysponsiveCaFrequencyDBDroop
MW actualolimaryContr
Droop expressed as 0.05 for 5% droop.Dead‐band in Hz.
Generator Output MW = Load Set‐point MW + MWP i C t lGenerator Output MW Load Set point MW + MWPrimaryControl
Where Load Set‐point is the Economic Dispatch Base Point or Plant Load Reference and may include any “Regulation Ancillary Service”.
)1(*)Re(*
60P
pacitysponsiveCaFrequencyDBHZ
MW actualli C t
For Frequency Above 60 Hz and Above Governor Dead‐band
Primary Frequency Control
)1(*)Re(**60
Pr
pacitysponsiveCaFrequencyDBDroop
MW olimaryContr
Droop expressed as 0.05 for 5% droop.Dead‐band in Hz.
Generator Output MW = Load Set‐point MW + MWPrimaryControl
Where Load Set‐point is the Economic Dispatch Base Point or Plant Load Reference and may include any “Regulation Ancillary Service”.
5/1/2013
4
231.00
242.00
253.00
264.00
275.00
60
60.02
60.04
60.06
60.08
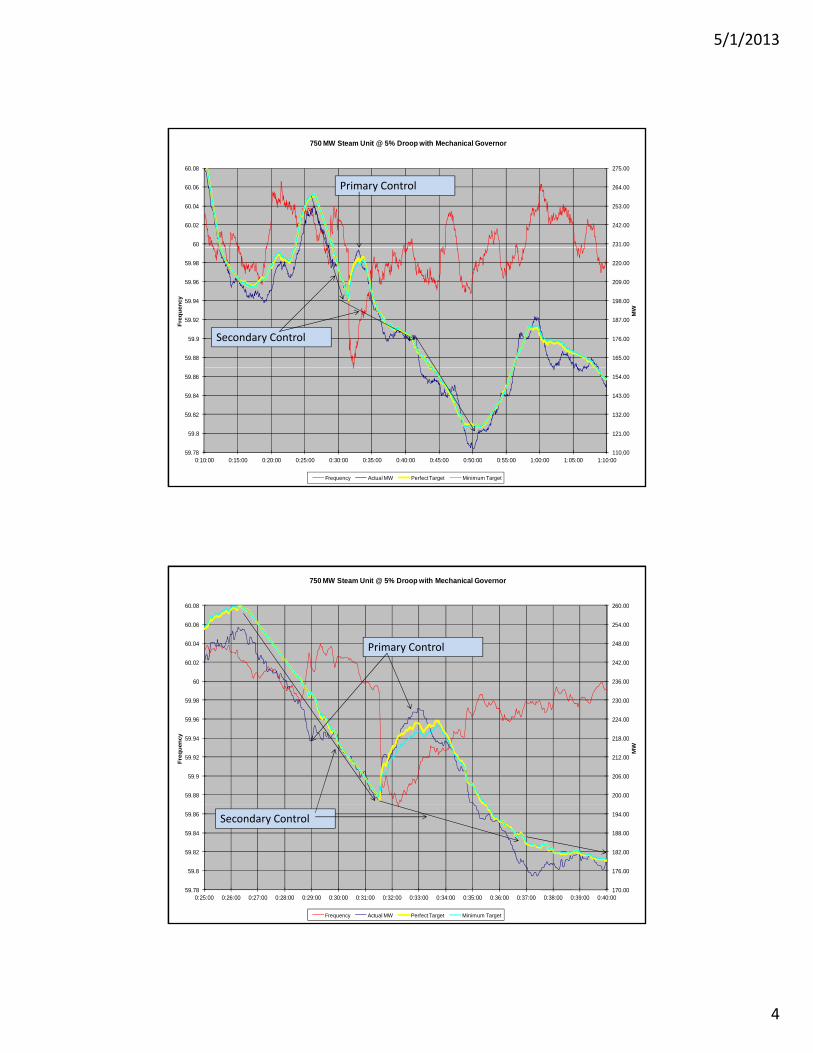
750 MW Steam Unit @ 5% Droop with Mechanical Governor
Primary Control
165.00
176.00
187.00
198.00
209.00
220.00
59.88
59.9
59.92
59.94
59.96
59.98
MW
Fre
qu
en
cy
Secondary Control
110.00
121.00
132.00
143.00
154.00
59.78
59.8
59.82
59.84
59.86
0:10:00 0:15:00 0:20:00 0:25:00 0:30:00 0:35:00 0:40:00 0:45:00 0:50:00 0:55:00 1:00:00 1:05:00 1:10:00
Frequency Actual MW Perfect Target Minimum Target
236.00
242.00
248.00
254.00
260.00
60
60.02
60.04
60.06
60.08
750 MW Steam Unit @ 5% Droop with Mechanical Governor
Primary Control
200.00
206.00
212.00
218.00
224.00
230.00
59.88
59.9
59.92
59.94
59.96
59.98
MW
Fre
qu
en
cy
170.00
176.00
182.00
188.00
194.00
59.78
59.8
59.82
59.84
59.86
0:25:00 0:26:00 0:27:00 0:28:00 0:29:00 0:30:00 0:31:00 0:32:00 0:33:00 0:34:00 0:35:00 0:36:00 0:37:00 0:38:00 0:39:00 0:40:00
Frequency Actual MW Perfect Target Minimum Target
Secondary Control
5/1/2013
1
Consortium forElectric ReliabilityTechnologySolutions
NERC Applications
StatusSolutions
NERC Applications Status for
Resources Subcommittee
Gil Tam
San Diego, CA
April 24-25, 2013
Agenda
NERC Application Status Summary
– Implemented 2013 CPS 2 Bounds Report values in all NERC applications
2012 ARR Yearly Report Highlights
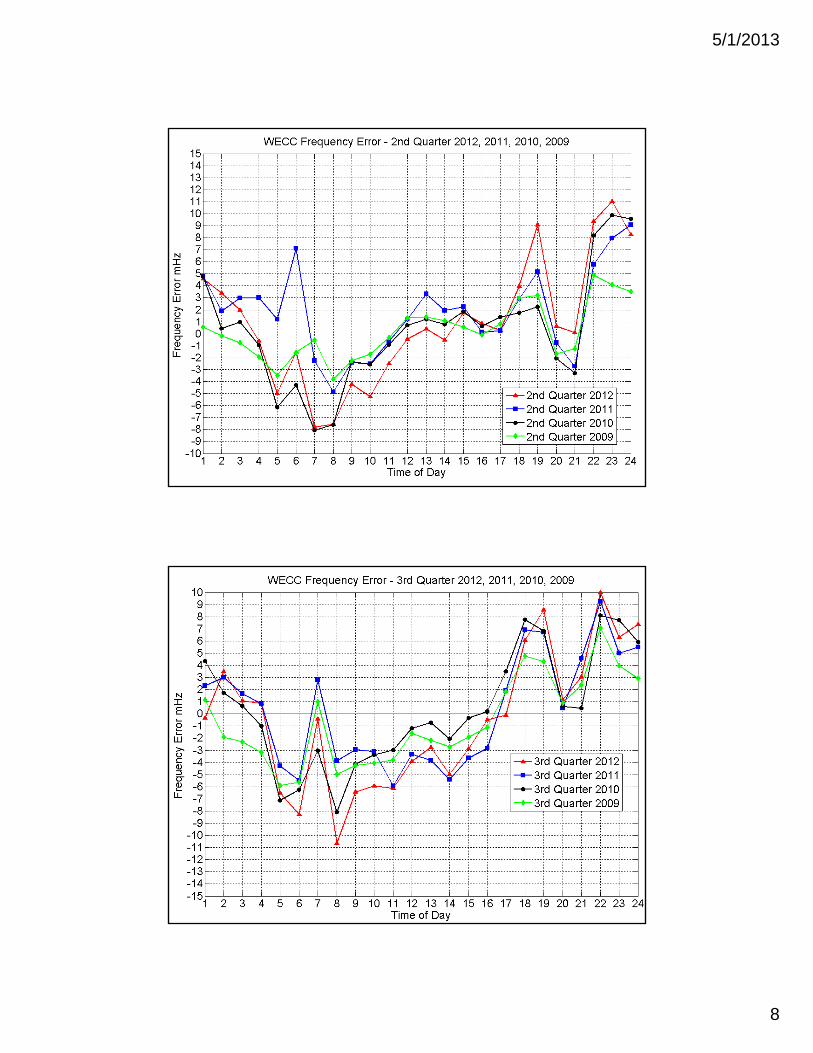
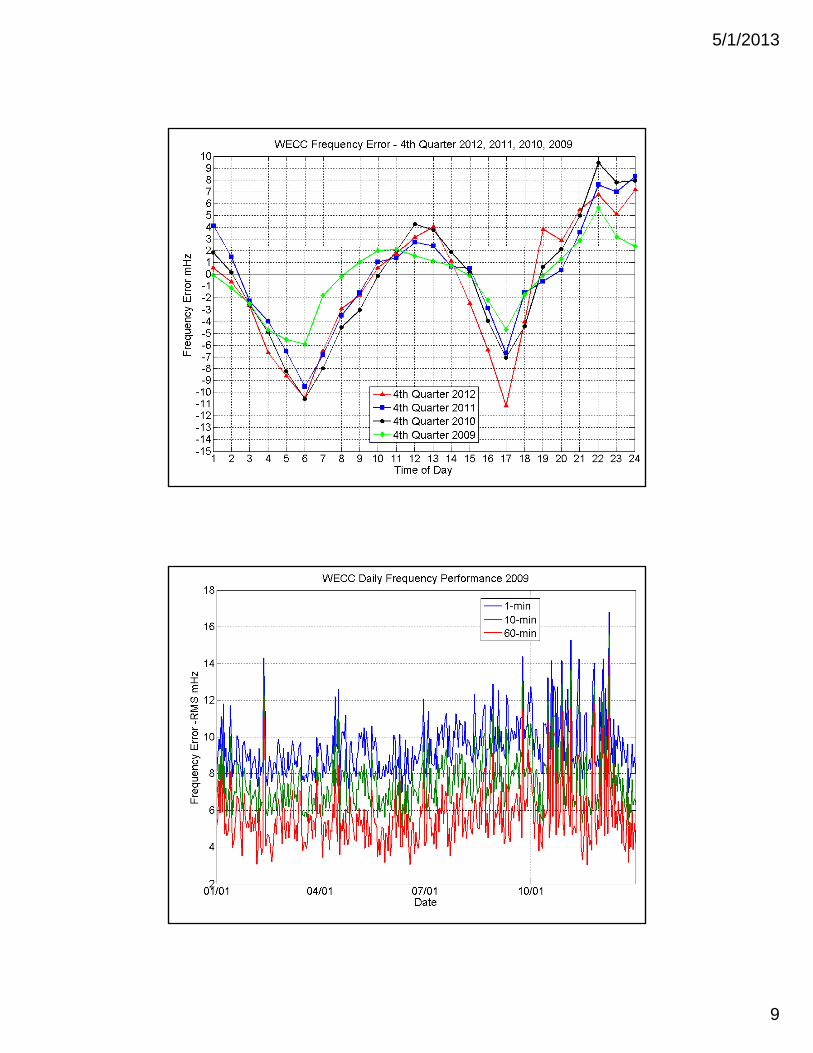
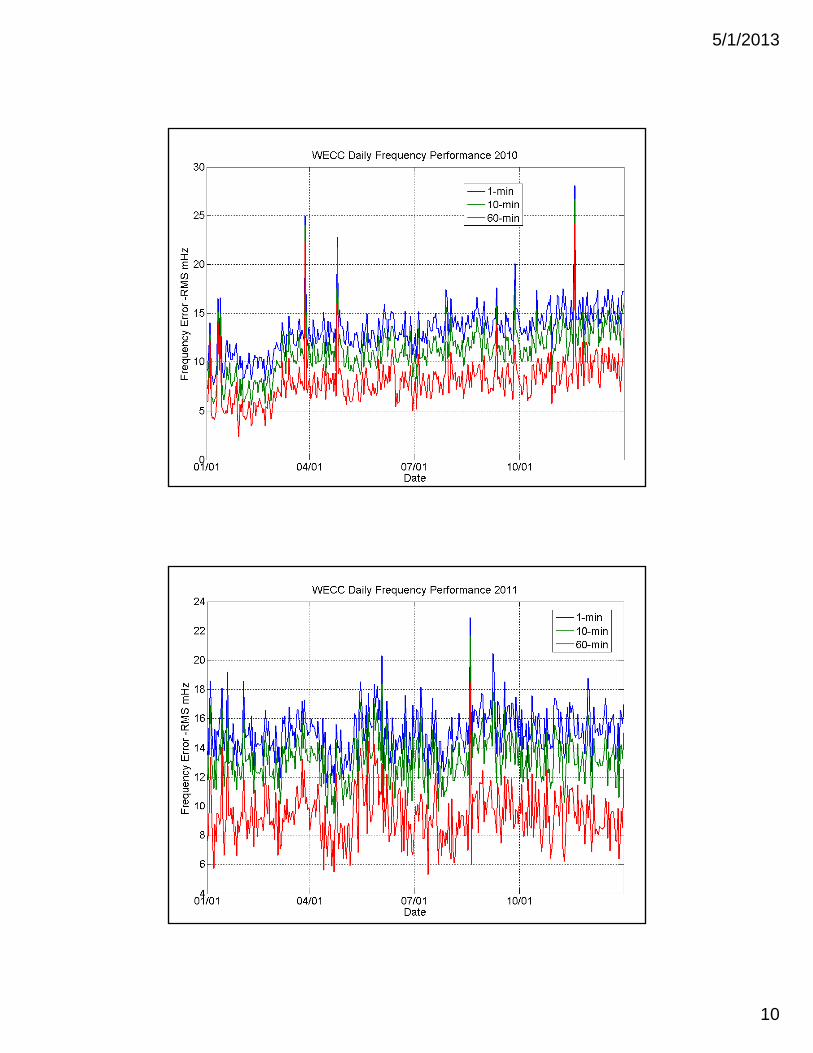
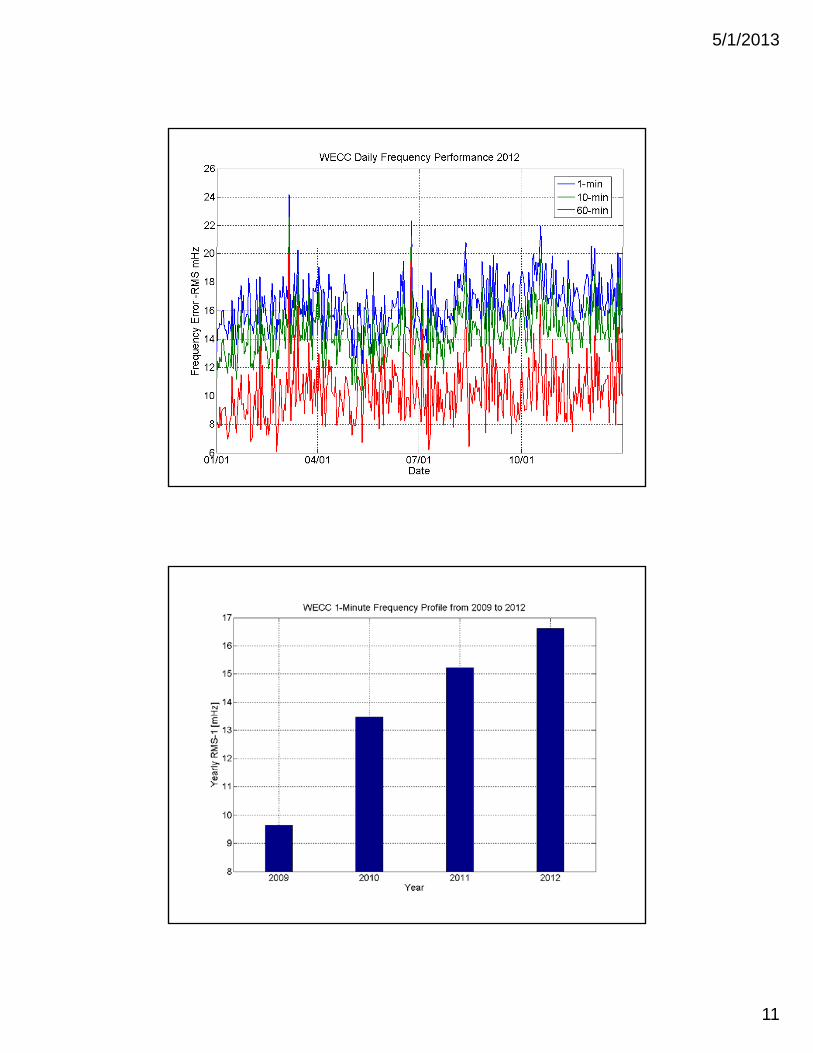
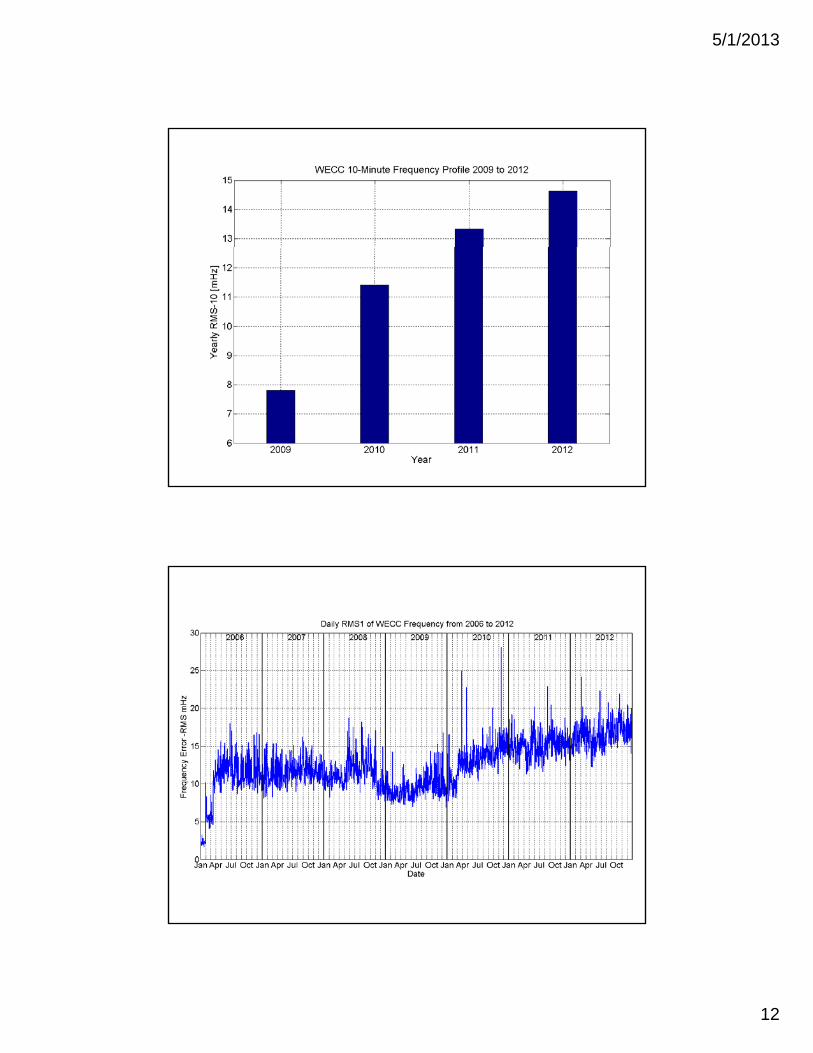
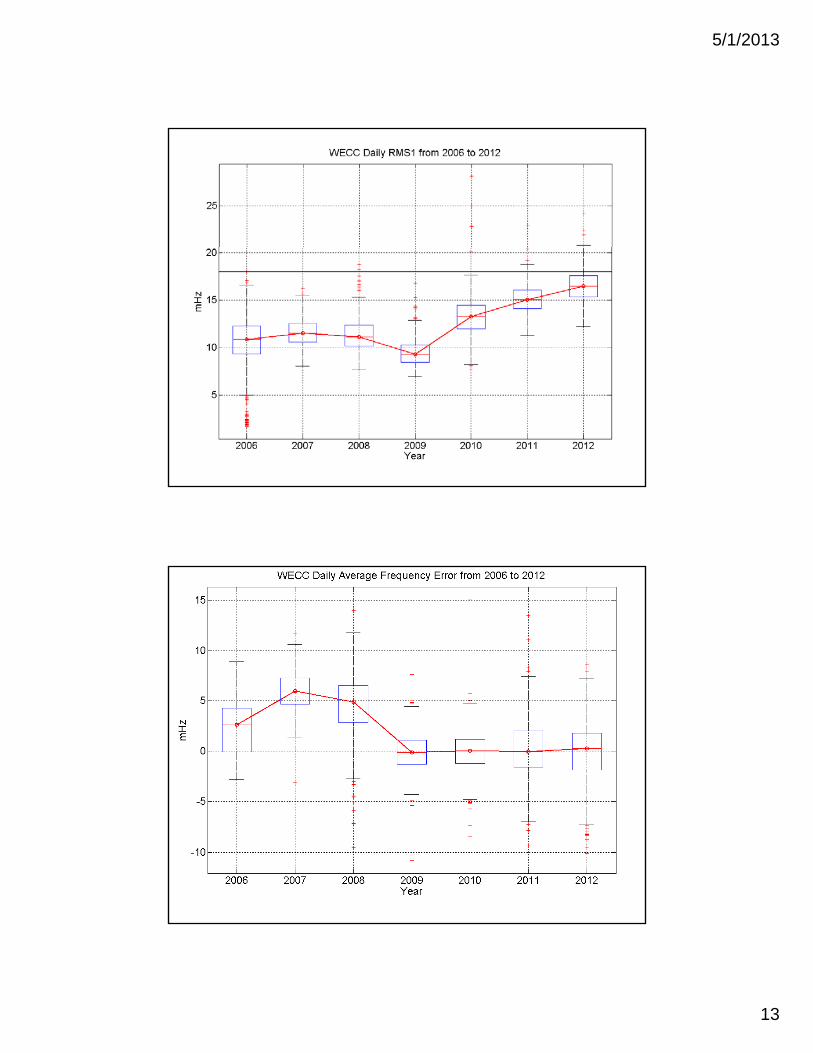
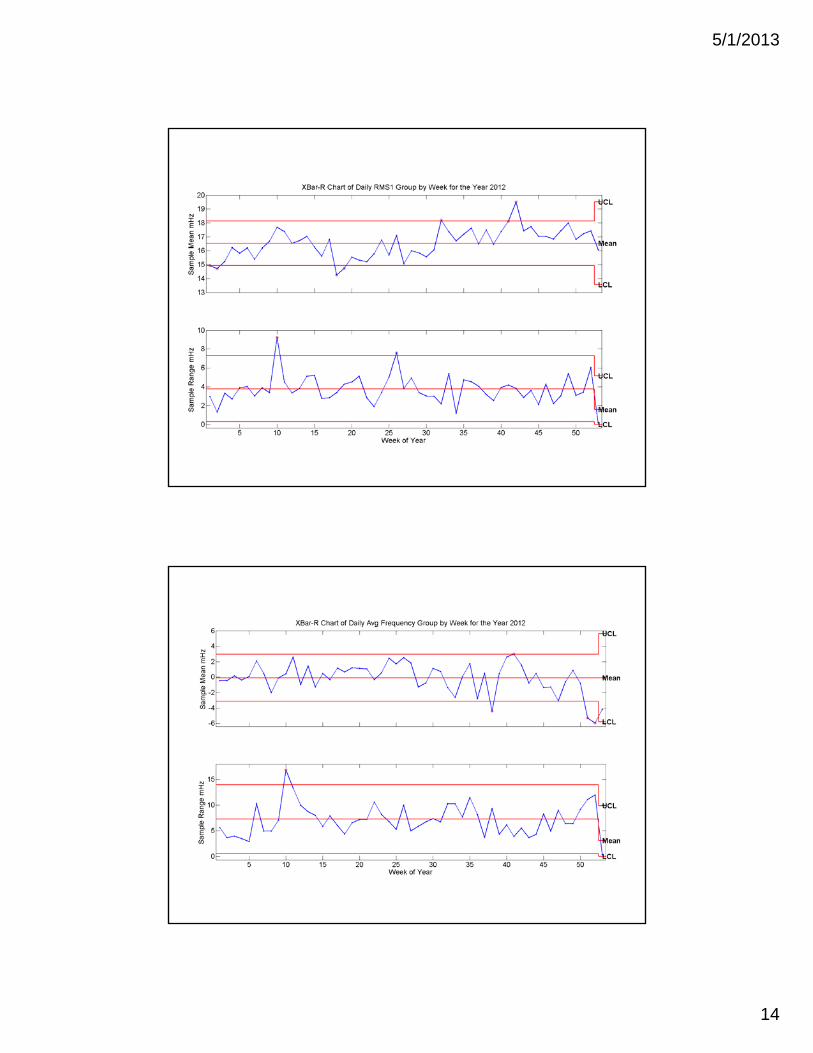
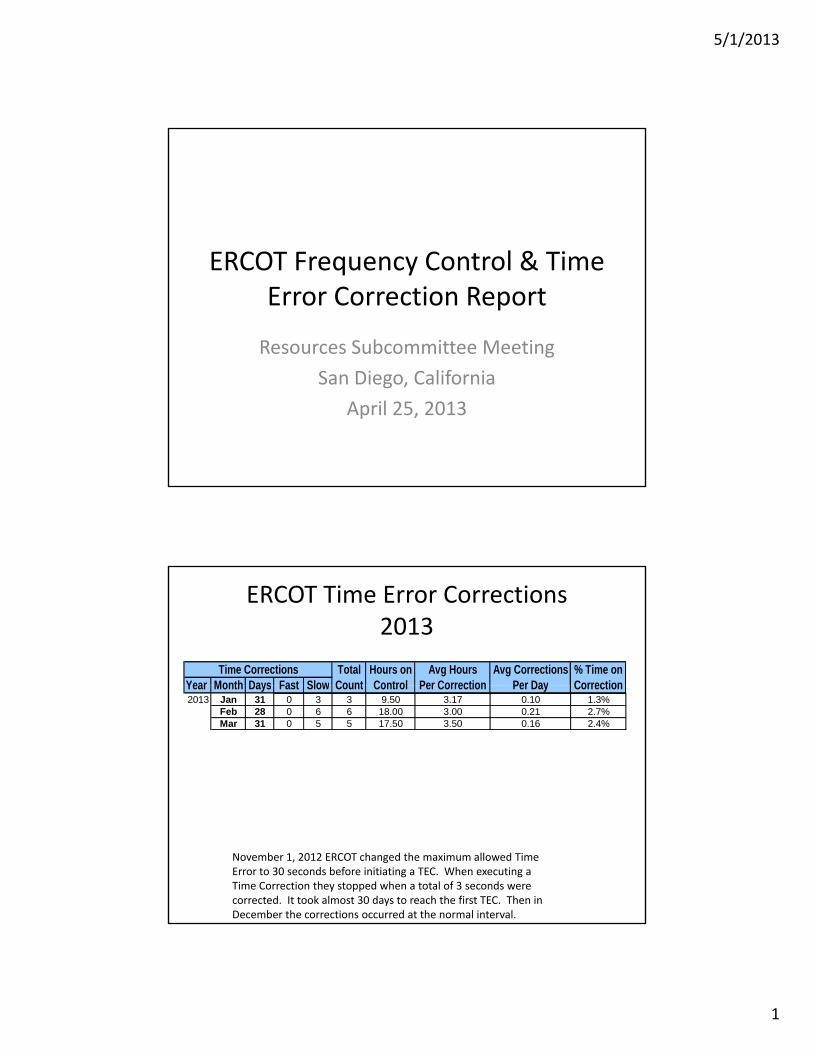
Review Draft WECC Interconnection Frequency Performance Report for Year 2012 per RS
Page 1
Performance Report for Year 2012 per RS Request at Last Meeting.
Apr 2013
5/1/2013
2
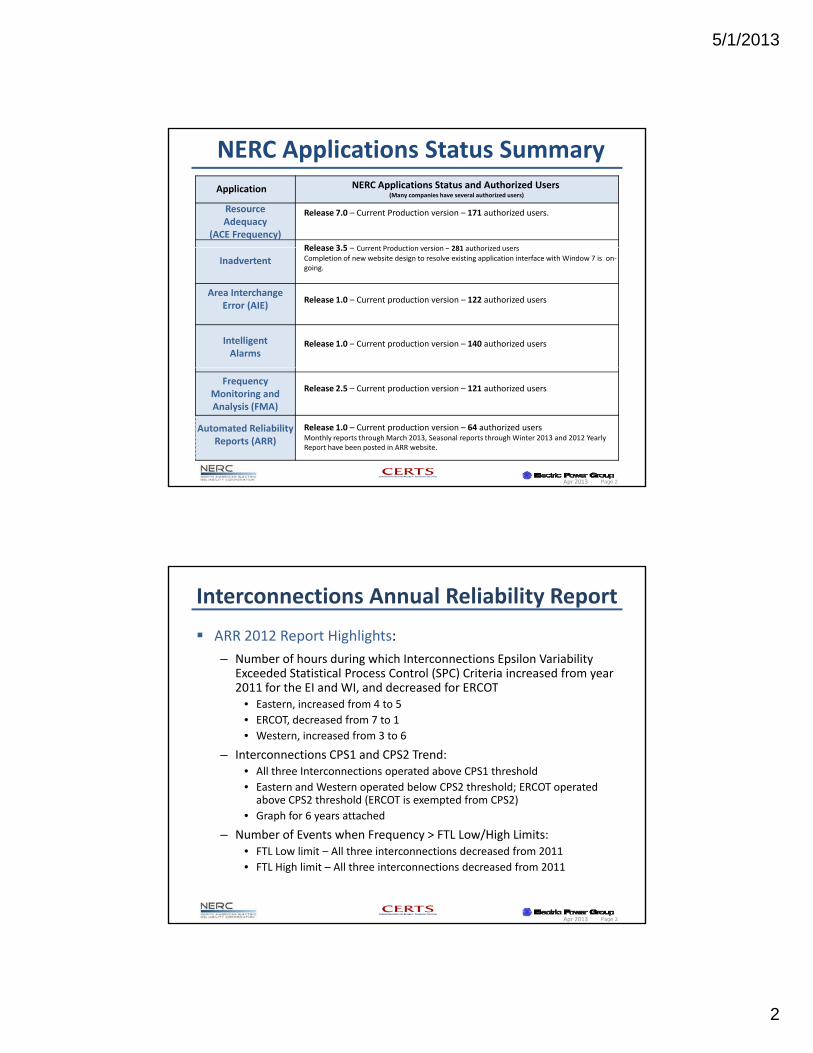
NERC Applications Status Summary
Application NERC Applications Status and Authorized Users(Many companies have several authorized users)
ResourceAdequacy
(ACE Frequency)
Release 7.0 – Current Production version – 171 authorized users.
Release 3 5 Current Production version 281 authorized users
Inadvertent
Area InterchangeError (AIE)
IntelligentAlarms
Release 3.5 – Current Production version – 281 authorized usersCompletion of new website design to resolve existing application interface with Window 7 is on‐going.
Release 1.0 – Current production version – 122 authorized users
Release 1.0 – Current production version – 140 authorized users
Page 2
FrequencyMonitoring andAnalysis (FMA)
Release 2.5 – Current production version – 121 authorized users
Automated ReliabilityReports (ARR)
Release 1.0 – Current production version – 64 authorized usersMonthly reports through March 2013, Seasonal reports through Winter 2013 and 2012 Yearly Report have been posted in ARR website.
Apr 2013
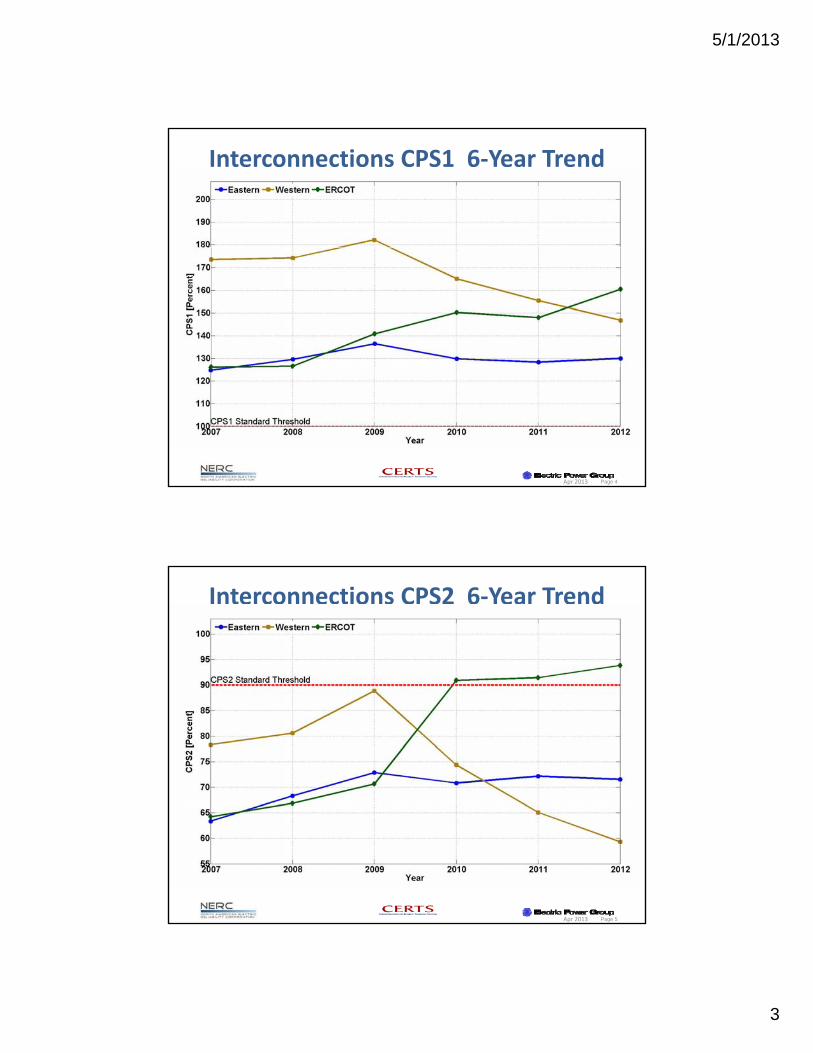
Interconnections Annual Reliability Report
ARR 2012 Report Highlights:
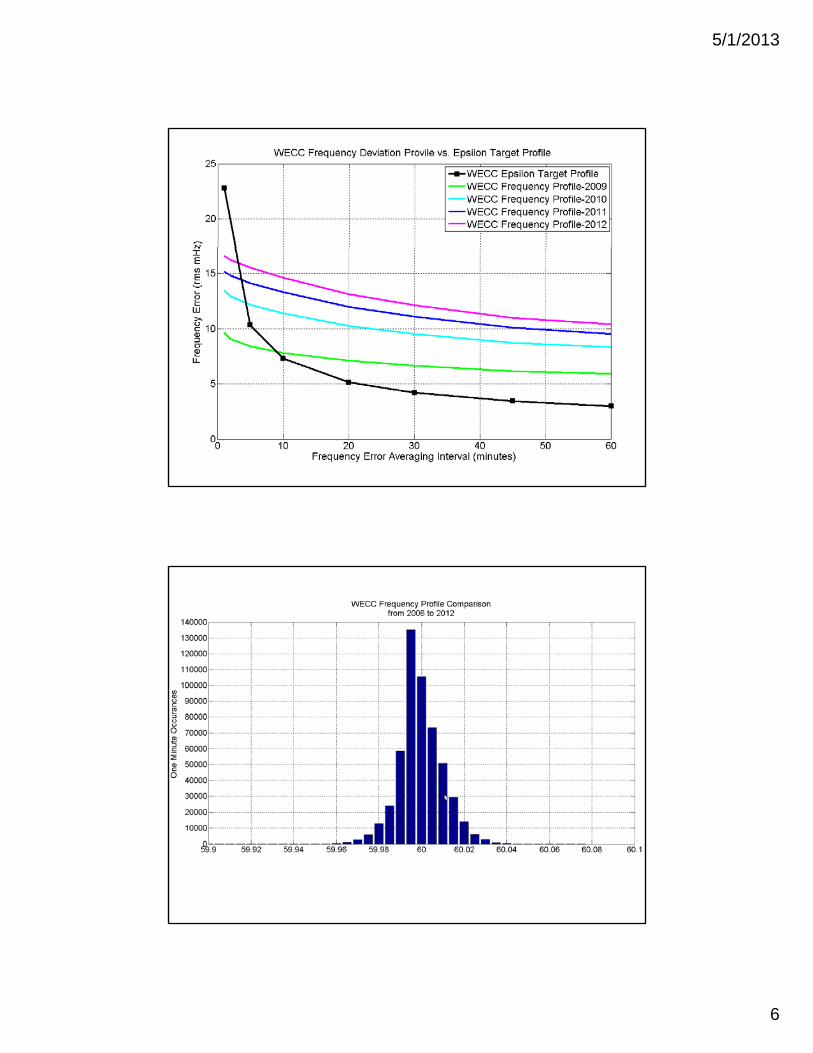
– Number of hours during which Interconnections Epsilon Variability Exceeded Statistical Process Control (SPC) Criteria increased from year 2011 f th EI d WI d d d f ERCOT2011 for the EI and WI, and decreased for ERCOT
• Eastern, increased from 4 to 5
• ERCOT, decreased from 7 to 1
• Western, increased from 3 to 6
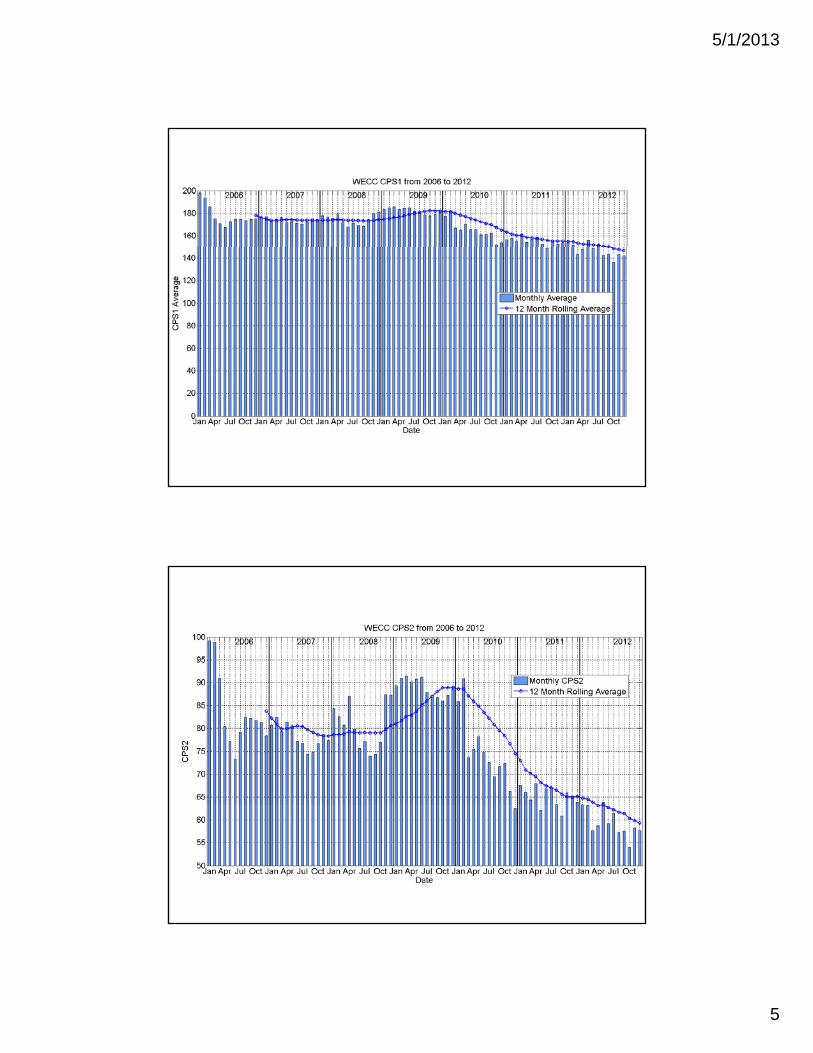
– Interconnections CPS1 and CPS2 Trend: • All three Interconnections operated above CPS1 threshold
• Eastern and Western operated below CPS2 threshold; ERCOT operated above CPS2 threshold (ERCOT is exempted from CPS2)
Page 3
( p )
• Graph for 6 years attached
– Number of Events when Frequency > FTL Low/High Limits:• FTL Low limit – All three interconnections decreased from 2011
• FTL High limit – All three interconnections decreased from 2011
Apr 2013
5/1/2013
3
Interconnections CPS1 6‐Year Trend
Page 4Apr 2013
Interconnections CPS2 6‐Year Trend
Page 5Apr 2013
5/1/2013
4
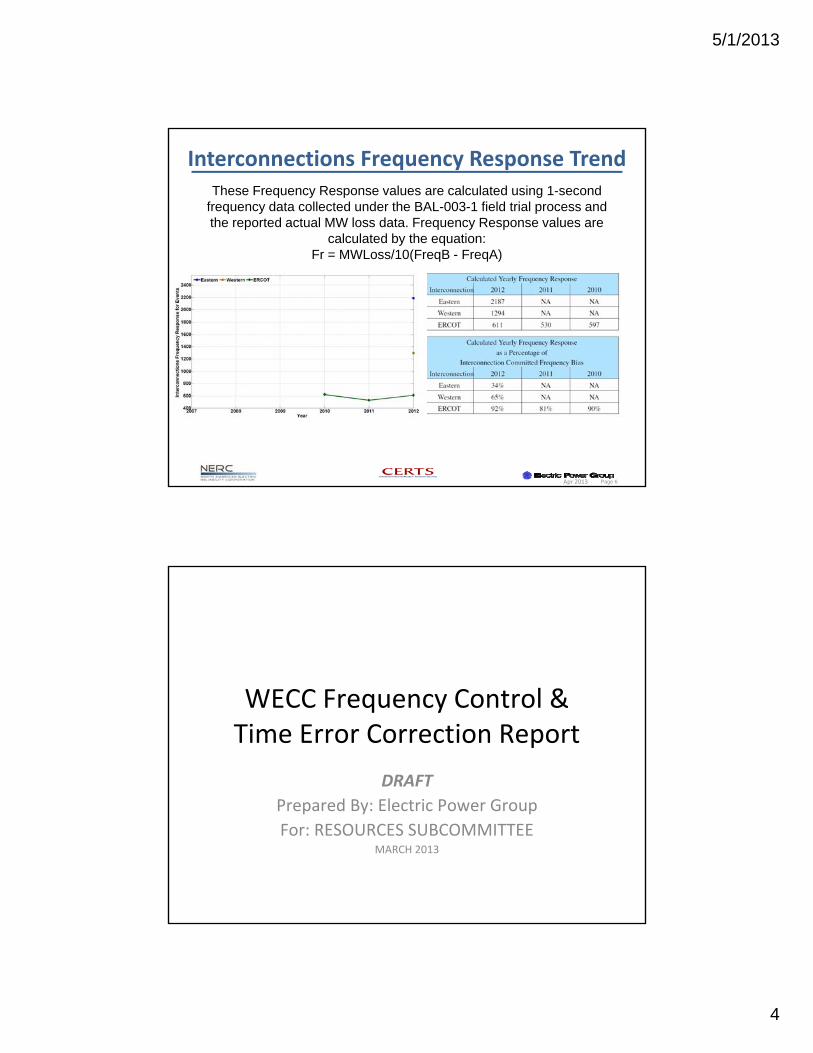
Interconnections Frequency Response TrendThese Frequency Response values are calculated using 1-second
frequency data collected under the BAL-003-1 field trial process and the reported actual MW loss data. Frequency Response values are
calculated by the equation: Fr = MWLoss/10(FreqB - FreqA)
Page 6Apr 2013
WECC Frequency Control & Time Error Correction Report
DRAFT
Prepared By: Electric Power GroupPrepared By: Electric Power Group
For: RESOURCES SUBCOMMITTEEMARCH 2013
5/1/2013
5
5/1/2013
6
5/1/2013
7
5/1/2013
8
5/1/2013
9
5/1/2013
10
5/1/2013
11
5/1/2013
12
5/1/2013
13
5/1/2013
14

5/1/2013
15
THANK YOU.
Gil Tam – [email protected]
201 South Lake Avenue, Ste 400
Page 28
Pasadena, CA 91101
626‐685‐2015
www.ElectricPowerGroup.com
Apr 2013
5/1/2013
1
ERCOT Frequency Control & Time Error Correction Report
Resources Subcommittee Meeting
San Diego, California
April 25, 2013
ERCOT Time Error Corrections2013
Total Hours on Avg Hours Avg Corrections % Time onYear Month Days Fast Slow Count Control Per Correction Per Day Correction
Time CorrectionsYear Month Days Fast Slow Count Control Per Correction Per Day Correction2013 Jan 31 0 3 3 9.50 3.17 0.10 1.3%
Feb 28 0 6 6 18.00 3.00 0.21 2.7%Mar 31 0 5 5 17.50 3.50 0.16 2.4%
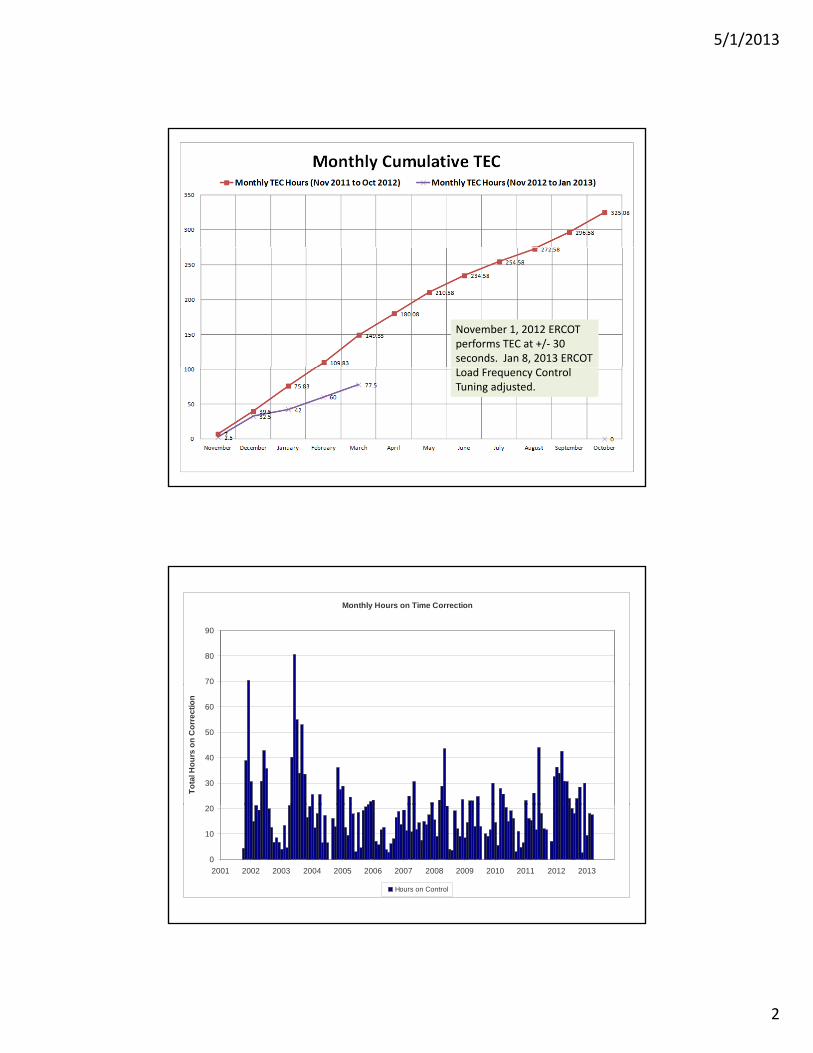
November 1, 2012 ERCOT changed the maximum allowed Time Error to 30 seconds before initiating a TEC. When executing a Time Correction they stopped when a total of 3 seconds were corrected. It took almost 30 days to reach the first TEC. Then in December the corrections occurred at the normal interval.
5/1/2013
2
November 1, 2012 ERCOT performs TEC at +/‐ 30 seconds. Jan 8, 2013 ERCOT Load Frequency Control Tuning adjusted.
Monthly Hours on Time Correction
70
80
90
30
40
50
60
To
tal H
ou
rs o
n C
orr
ec
tio
n
0
10
20
2001 2002 2003 2004 2005 2006 2007 2008 2009 2010 2011 2012 2013
Hours on Control
5/1/2013
3
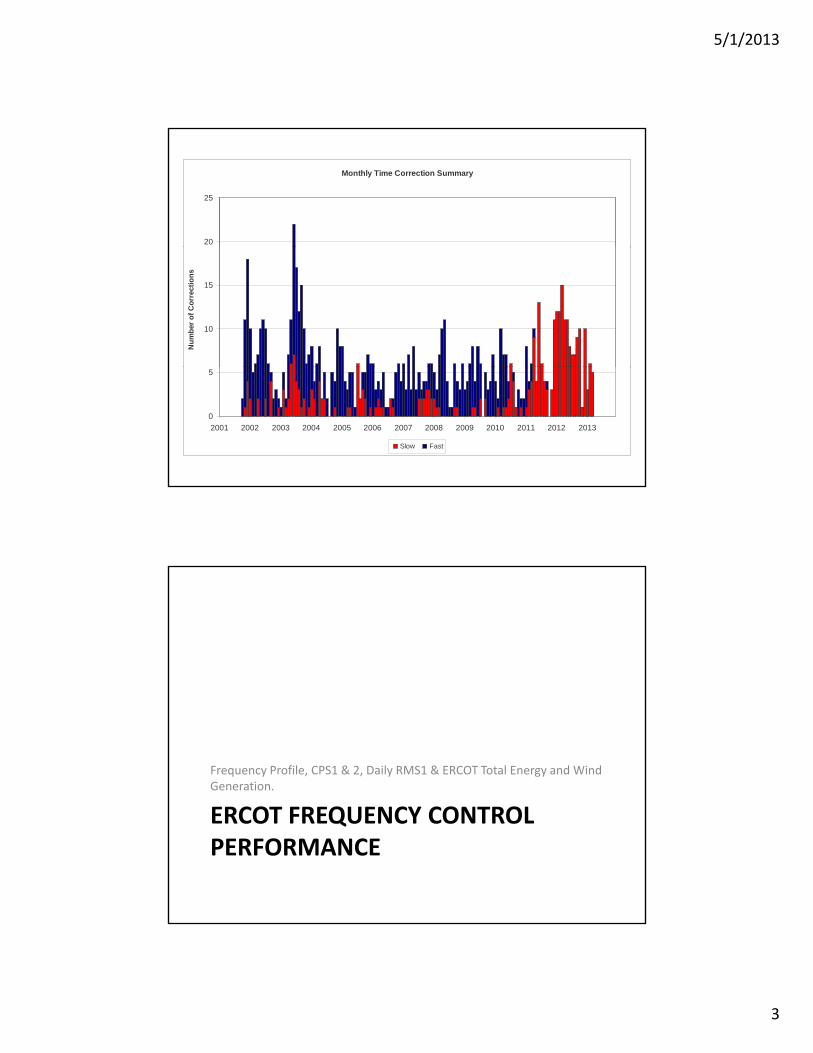
Monthly Time Correction Summary
20
25
10
15
Nu
mb
er o
f C
orr
ecti
on
s
0
5
2001 2002 2003 2004 2005 2006 2007 2008 2009 2010 2011 2012 2013
Slow Fast
Frequency Profile, CPS1 & 2, Daily RMS1 & ERCOT Total Energy and Wind Generation.
ERCOT FREQUENCY CONTROL PERFORMANCE
5/1/2013
4
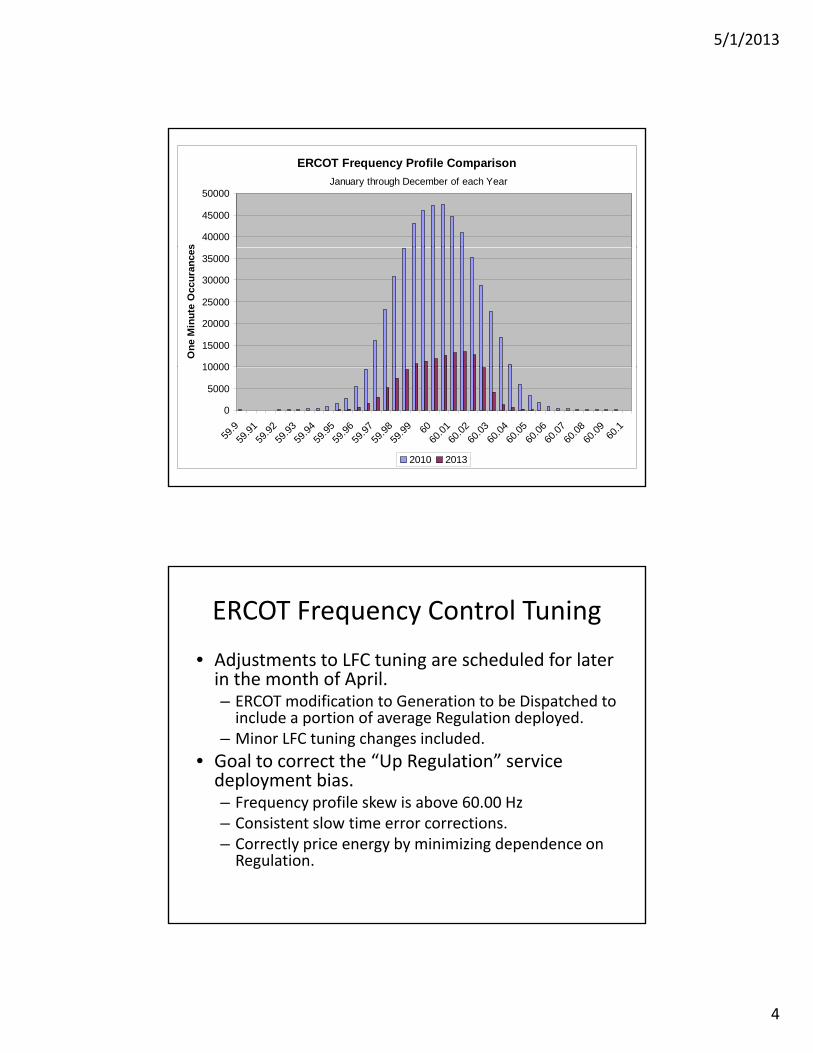
ERCOT Frequency Profile Comparison
40000
45000
50000s
January through December of each Year
10000
15000
20000
25000
30000
35000
On
e M
inu
te O
ccu
ran
ces
0
5000
10000
59.9
59.9
159
.92
59.9
359
.94
59.9
559
.96
59.9
759
.9859
.99 60
60.0
160
.02
60.0
360
.0460
.05
60.0
660
.07
60.0
860
.09
60.1
2010 2013
ERCOT Frequency Control Tuning
• Adjustments to LFC tuning are scheduled for later in the month of April.in the month of April.– ERCOT modification to Generation to be Dispatched to include a portion of average Regulation deployed.
– Minor LFC tuning changes included.
• Goal to correct the “Up Regulation” service deployment bias.– Frequency profile skew is above 60 00 HzFrequency profile skew is above 60.00 Hz– Consistent slow time error corrections.– Correctly price energy by minimizing dependence on Regulation.
5/1/2013
5
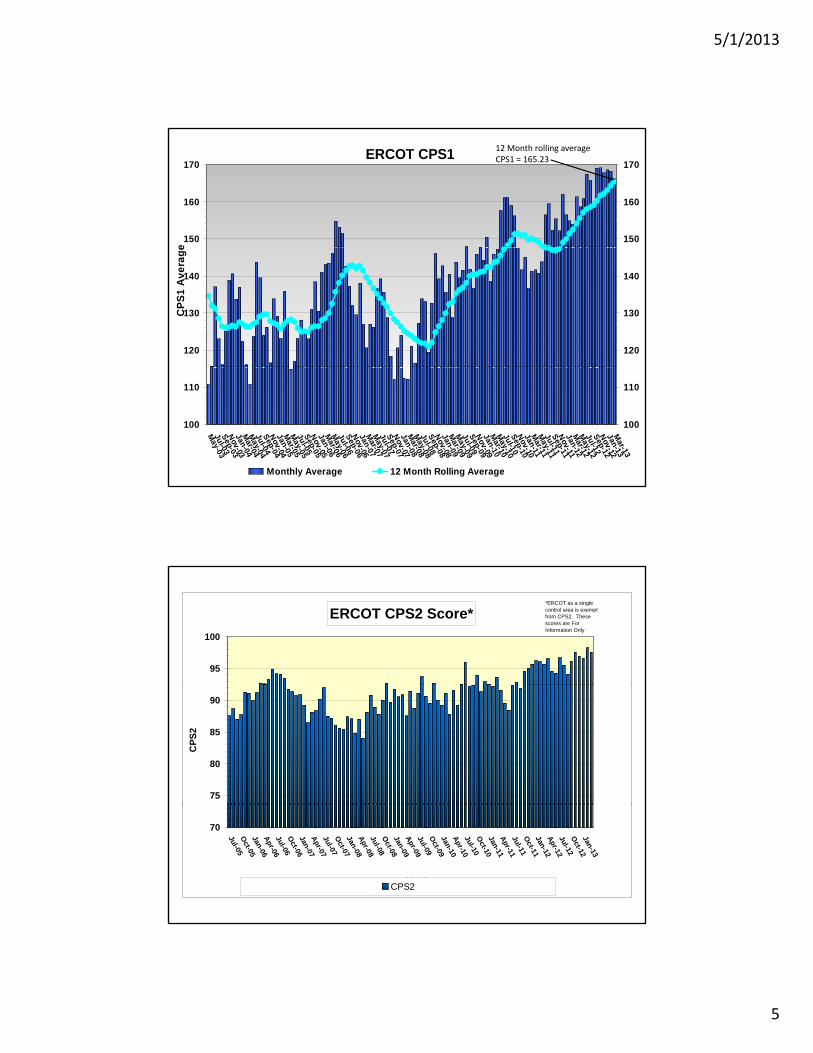
ERCOT CPS1
150
160
170
e
150
160
170
12 Month rolling average CPS1 = 165.23
120
130
140
CP
S1
Av
era
ge
120
130
140
100
110
May-03
Jul-03S
ep-03N
ov-03Jan-04M
ar-04M
ay-04Jul-04S
ep-04N
ov-04Jan-05M
ar-05M
ay-05Jul-05S
ep-05N
ov-05Jan-06M
ar-06M
ay-06Jul-06S
ep-06N
ov-06Jan-07M
ar-07M
ay-07Jul-07S
ep-07N
ov-07Jan-08M
ar-08M
ay-08Jul-08S
ep-08N
ov-08Jan-09M
ar-09M
ay-09Jul-09S
ep-09N
ov-09Jan-10M
ar-10M
ay-10Jul-10S
ep-10N
ov-10Jan-11M
ar-11M
ay-11Jul-11S
ep-11N
ov-11Jan-12M
ar-12M
ay-12Jul-12S
ep-12N
ov-12Jan-13M
ar-13
100
110
Monthly Average 12 Month Rolling Average
ERCOT CPS2 Score*
95
100
*ERCOT as a single control area is exempt from CPS2. These scores are For Information Only
75
80
85
90
CP
S2
70
Jul-05O
ct-05Jan-06A
pr-06Jul-06O
ct-06Jan-07A
pr-07Jul-07O
ct-07Jan-08A
pr-08Jul-08O
ct-08Jan-09A
pr-09Jul-09O
ct-09Jan-10A
pr-10Jul-10O
ct-10Jan-11A
pr-11Jul-11O
ct-11Jan-12A
pr-12Jul-12O
ct-12Jan-13
MonthCPS2
5/1/2013
6
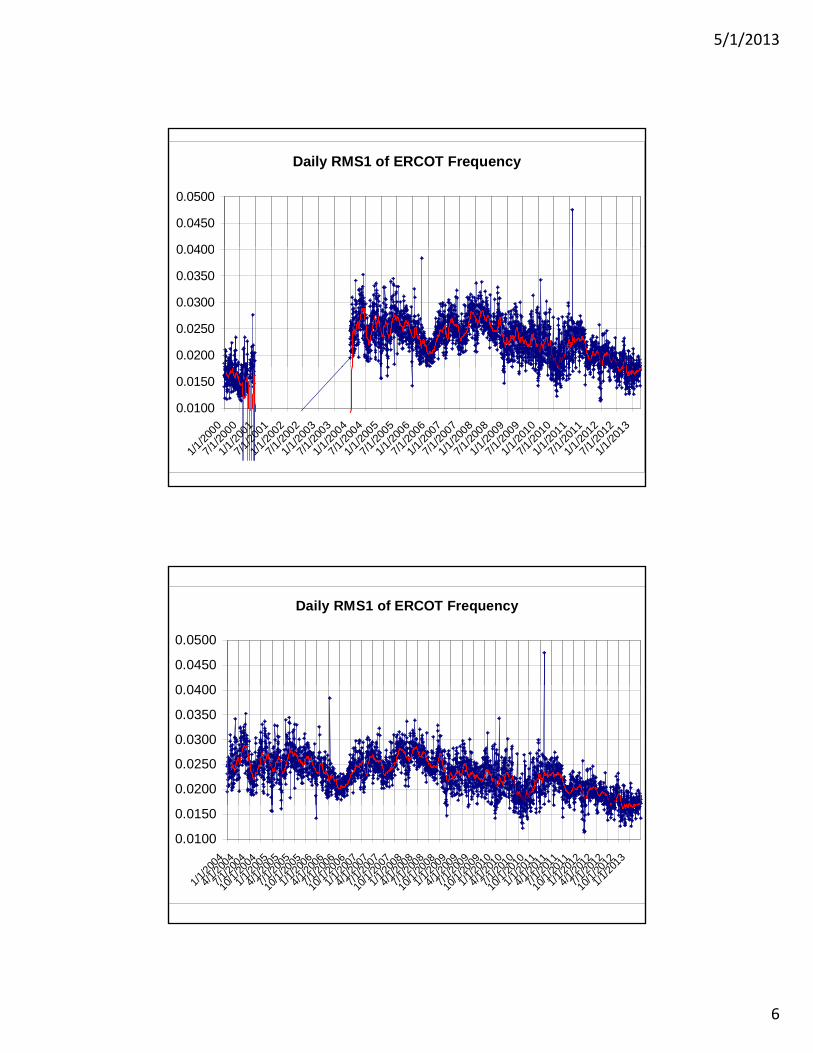
Daily RMS1 of ERCOT Frequency
0 0400
0.0450
0.0500
0.0200
0.0250
0.0300
0.0350
0.0400
0.0100
0.0150
1/1/
2000
7/1/
2000
1/1/2
001
7/1/2
001
1/1/
2002
7/1/
2002
1/1/
2003
7/1/2
003
1/1/2
004
7/1/
2004
1/1/
2005
7/1/2
005
1/1/2
006
7/1/
2006
1/1/
2007
7/1/
2007
1/1/
2008
7/1/2
008
1/1/2
009
7/1/
2009
1/1/
2010
7/1/2
010
1/1/2
011
7/1/
2011
1/1/
2012
7/1/
2012
1/1/2
013
Daily RMS1 of ERCOT Frequency
0 0400
0.0450
0.0500
0.0200
0.0250
0.0300
0.0350
0.0400
0.0100
0.0150
1/1/
2004
4/1/
2004
7/1/
2004
10/1
/200
4
1/1/
2005
4/1/
2005
7/1/
2005
10/1
/200
5
1/1/
2006
4/1/
2006
7/1/
2006
10/1
/200
6
1/1/
2007
4/1/
2007
7/1/
2007
10/1
/200
7
1/1/
2008
4/1/
2008
7/1/
2008
10/1
/200
8
1/1/
2009
4/1/
2009
7/1/
2009
10/1
/200
9
1/1/
2010
4/1/
2010
7/1/
2010
10/1
/201
0
1/1/
2011
4/1/
2011
7/1/
2011
10/1
/201
1
1/1/
2012
4/1/
2012
7/1/
2012
10/1
/201
2
1/1/
2013
5/1/2013
7
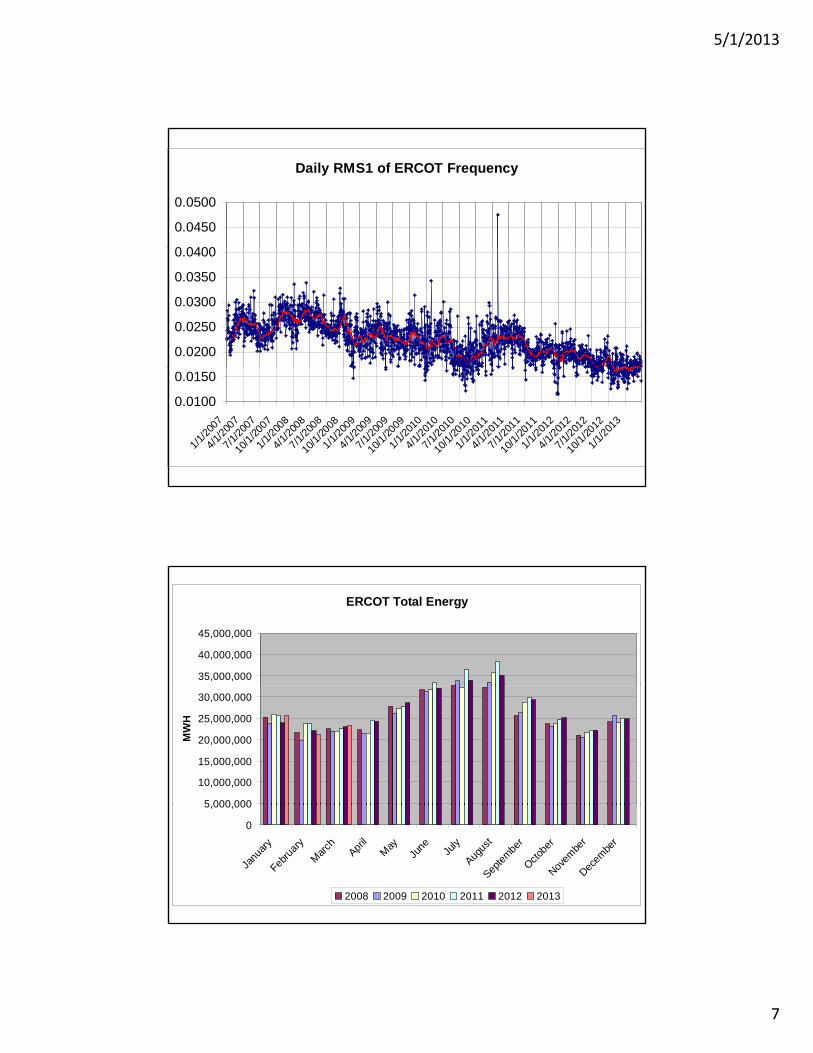
Daily RMS1 of ERCOT Frequency
0 0400
0.0450
0.0500
0.0200
0.0250
0.0300
0.0350
0.0400
0.0100
0.0150
1/1/
2007
4/1/
2007
7/1/
2007
10/1
/200
7
1/1/
2008
4/1/
2008
7/1/
2008
10/1
/200
8
1/1/
2009
4/1/
2009
7/1/
2009
10/1
/200
9
1/1/
2010
4/1/
2010
7/1/
2010
10/1
/201
0
1/1/
2011
4/1/
2011
7/1/
2011
10/1
/201
1
1/1/
2012
4/1/
2012
7/1/
2012
10/1
/201
2
1/1/
2013
ERCOT Total Energy
35,000,000
40,000,000
45,000,000
5 000 000
10,000,000
15,000,000
20,000,000
25,000,000
30,000,000
MW
H
0
5,000,000
Janu
ary
Febru
ary
Mar
chApr
ilM
ayJu
ne July
Augus
t
Septe
mbe
r
Octob
er
Novem
ber
Decem
ber
2008 2009 2010 2011 2012 2013
5/1/2013
8
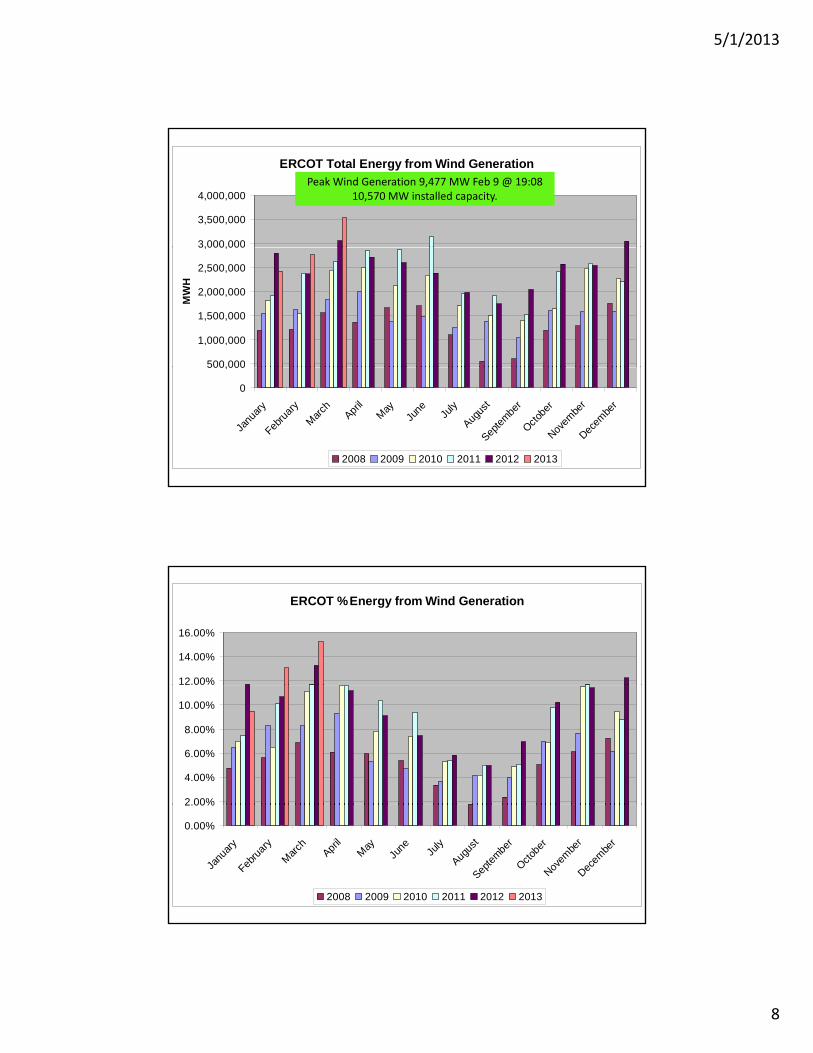
ERCOT Total Energy from Wind Generation
3,000,000
3,500,000
4,000,000Peak Wind Generation 9,477 MW Feb 9 @ 19:08
10,570 MW installed capacity.
500,000
1,000,000
1,500,000
2,000,000
2,500,000
3,000,000
MW
H
0
500,000
Janu
ary
Febru
ary
Mar
chApr
ilM
ayJu
ne July
Augus
t
Septe
mbe
r
Octob
er
Novem
ber
Decem
ber
2008 2009 2010 2011 2012 2013
ERCOT % Energy from Wind Generation
12.00%
14.00%
16.00%
2.00%
4.00%
6.00%
8.00%
10.00%
0.00%
2.00%
Janu
ary
Febru
ary
Mar
chApr
ilM
ayJu
ne July
Augus
t
Septe
mbe
r
Octob
er
Novem
ber
Decem
ber
2008 2009 2010 2011 2012 2013

5/1/2013
9
Questions?