Embed Size (px)
Citation preview

4/4/2017
1
Vision 2020 Performance
Measures
Using VFA & Other Projects to Measure Strategic Plan
Julie Melnick, Director of Institutional Research
KPI’sEstablished Benchmarks
Measure Strategic
Plan Goals
Quality Improvement Formula
Mission: Northeast Community College is dedicated to the success of students and the region it serves
KPI = Key Performance Indicator (measure)
Mission
Constituent Satisfaction
Student Success
Mission Layers Vision 2020 Strategic Goals
• Increase student success
• Increase student access
• Provide a globally competitive workforce
• Develop and maximize resources
https://northeast.edu/About-Us/pdfs/Vision-2020.pdf
Vision 2020 Objectives
• Measurable statement identifying what must be achieved to accomplish a goal
• Goal: Increase student success
• Objective: Increase the success of underprepared students
Vision 2020 Action Projects
• Incremental methods and tasks necessary to achieve objectives
• Objective: Increase student retention
• Action Project: Strengthen student advising

4/4/2017
2
Vision 2020 Performance Measures
• Standards or indicators of the desired change in the objective
• Quantitative: numerical measurement against a baseline
• Qualitative: expectation for completing an initiative in an established timeline and at a high level of quality
Vision 2020 Performance Measures Scorecard
• 20 measures
• Each measures consists of:
– Measure statement*
– Current and/or Baseline percentage/s (if quantitative)
– Target percentage/s (or milestones/s met)
– Bubble
– Score* Student Success Taskforce 2014 approved student success measure
Dashboard Ideas
* I attended the Benchmarking conference at JCCC in 2011, which gave me many great ideas towards measuring our strategic plan!
Dashboard Ideas
Vision 2020 Performance Measures Bubbles
• Five colors measuring amount of success towards reaching target
• Based off of “stoplight” colors
– Red: needs attention
– Yellow: needs improvement
– Light green: nearing expectations (target)
– Green: meeting expectations (target)
– Gray: if qualitative project, completed
Vision 2020 Performance Measures Scores
• Four scores designed to measure success
• Based off of “GPA” values
– Red: 1.0
– Yellow: 2.0 (average)
– Light green: 3.0
– Green, and then Gray: 4.0
* I got the idea of using GPA values when one of our HR staff used this method to describe our Climate survey outcomes People relate easily to these scores!!

4/4/2017
3
Vision 2020 Performance Measures Movement
• Four directions designed to measure success over time
• Direction– : up from last year
– : down from last year
–: stayed the same
– B: baseline year* (first year for collecting data) or percentage circles back to baseline value
* Baseline year or percentage is automatically yellow (or average)
Vision 2020 Performance Measures Movement & Color
• Where directions will appear
– : if up from last year and same color, appear in bubble; otherwise, next to score if color change occurred
– : down from last year, same as above
–: stayed the same, in bubble
– B: if percentage circles back to baseline value, appear in bubble, and arrow will display where appropriate
Vision 2020 Performance Measures Incremental Scores
• Direction
– : up from last year and same color + 0.1
– : down from last year and same color – 0.1 (never to go below current color score)
• Example
– Last year, a score was 3.0 (light green). This year, the color is still light green, but the percentage improved. The new score is 3.1
Quantitative Measures
Benchmarking Sources
Institutional KPI’s
(Student Success &
Constituents)
NCCBP (Year 4)
VFA (ongoing)
WTBP (Year 4)
IPEDS (ongoing)
NACUBO (develop baseline)
VFA = Voluntary Framework of AccountabilityIPEDS = Integrated Postsecondary Education Data SystemNCCBP = National Community College Benchmarking ProjectWTBP = Workforce Training Benchmarking ProjectNACUBO = used for financial indicators (no data submission)
Benchmarking Sources
• Measures based on:
– Numerical measurements against a baseline value
– Some kind of benchmarking source*, such as IPEDS or VFA, for baseline and/or target calculations and values
– A history, if one exists and is relevant
* While only one benchmarking source was eventually chosen per measure, all relevant ones were taken into consideration when establishing baselines & benchmarks for that measure. For example, VFA was chosen as the BEST source to measure remedial outcomes, even though others measured it as well (like NCCBP)

4/4/2017
4
BIG Aha Moment using VFA!!
• We began submitting VFA in Fall 2013 using “course placement.” Students were doing relatively fine in comparison to other schools
• The next year, we used “referred,” and it was then we discovered only about half of students required to take foundational coursework were indeed doing that over a 6-year cohort period!! Once there, they did relatively fine; but if they didn’t, they missed out on being able to get a degree, altogether!!
Vision 2020 Performance Measure example
• Goal: Increase student success
• Objective: Increase the success of underprepared students
• *Performance Measure 1: Increase the success of underprepared students attempting foundational coursework
* Student Success Taskforce 2014 approved student success measure
Note: Performance measures are not in any particular priority order
Raw Data Input
• We started inputting VFA data in 2013 using “online input method”—very labor intensive (about six full, dedicated weeks)
• After doing that for two years, we used the “bulk upload method,” which was a little bit easier (still a lot of data work on our end – about two weeks)
• We began using the “raw data upload” last year which decreased our workload by about 80%!! Not only that, but we had two cohorts now, not just one (6-yr) cohort for remedial coursework. Because this was our latest and best submission, we chose to make that year our “baseline” year (VFA 2016)
Vision 2020 Performance Measures Scorecard 2015-16
• *Measure 1: Increase the success of underprepared students attempting foundational coursework
– Baseline: 55%
– Current: 55% (baseline year)
– Target: 75%
– Score: 2.0
* Student Success Taskforce 2014 approved student success measure
B
Vision 2020 Performance Measures Baseline w Source
• A calculation developed by Institutional Research and approved by Cabinet and Strategic Enrollment Management team
• Example– *Measure 1: Increase the success of
underprepared students attempting foundational coursework• Baseline: Average of 2-yr (54.2%) and 6-yr (55.3%)
2009 cohorts 55%• Source: VFA 2016; 2- & 6-yr cohorts; fulltime; first
time in college, developmental need any; referred and then attempted
* Student Success Taskforce 2014 approved student success measure
Vision 2020 Performance Measures Target
• A value decided upon by Cabinet, Institutional Research, and Strategic Enrollment Management team
• Example– *Measure 1: Increase the success of
underprepared students attempting foundational coursework• Target: 75% of first-time, full-time, degree-seeking
any developmental subject referred students will attempt foundational coursework (increase baseline by 20%)
* Student Success Taskforce 2014 approved student success measure
4/4/2017
5
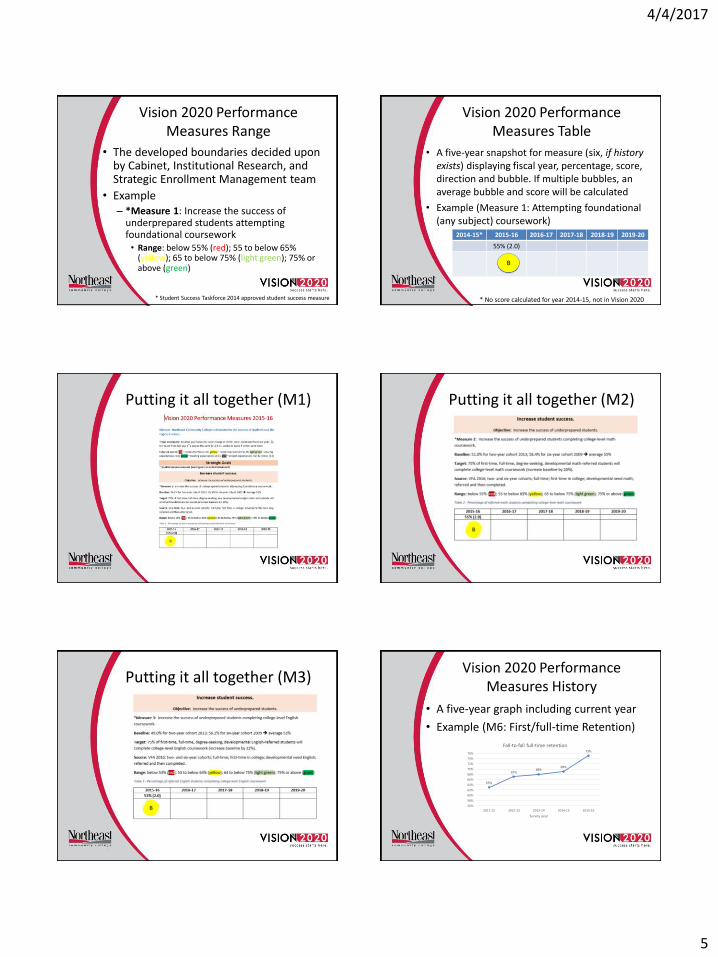
Vision 2020 Performance Measures Range
• The developed boundaries decided upon by Cabinet, Institutional Research, and Strategic Enrollment Management team
• Example– *Measure 1: Increase the success of
underprepared students attempting foundational coursework • Range: below 55% (red); 55 to below 65%
(yellow); 65 to below 75% (light green); 75% or above (green)
* Student Success Taskforce 2014 approved student success measure
Vision 2020 Performance Measures Table
• A five-year snapshot for measure (six, if history exists) displaying fiscal year, percentage, score, direction and bubble. If multiple bubbles, an average bubble and score will be calculated
• Example (Measure 1: Attempting foundational (any subject) coursework)
2014-15* 2015-16 2016-17 2017-18 2018-19 2019-20
55% (2.0)
B
* No score calculated for year 2014-15, not in Vision 2020
Putting it all together (M1) Putting it all together (M2)
Putting it all together (M3)Vision 2020 Performance
Measures History
• A five-year graph including current year
• Example (M6: First/full-time Retention)
63%
67%68%
69%
75%
56%
58%
60%
62%
64%
66%
68%
70%
72%
74%
76%
2011-12 2012-13 2013-14 2014-15 2015-16
Survey year
Fall-to-fall full-time retention

4/4/2017
6
Vision 2020 Performance Measures Scorecard 2015-16
• *Measure 6: Increase the fall-to-fall retention rate of first-time, full-time, degree-seeking students
– Baseline: 68%
– Current: 75%
– Target: 73%
– Score: 4.0
* Student Success Taskforce 2014 approved student success measure
Putting it all together (M6)
VFA Comes Through Again!!
• We wanted to include our transfer rate, in addition to completion rate, as a measure of student success, but not to sacrifice one for the other
• We originally toyed with using a TRIO measure that combines the two (18%), but this group was too small to describe the larger Northeast population
• I then remembered VFA had such a measure (6-yr cohort) and it became our source for M9!!
Putting it all together (M9)
20 Measures Tallies
• VFA – 4 (heavy on developmental ed.)
• CCSSE (student engagement) – 1
• Noel-Levitz (student satisfaction) – 1
• IPEDS (completion, retention…) – 4
• WTBP (companies served) – 1
• NACUBO/HLC (financial KPI’s) – 1
• Internal project/goal/survey - 8
Qualitative Measures

4/4/2017
7
Qualitative measures
• Measures based on:
– Methods or tasks such as those outlined in Action Projects
– Percent, milestones, phases or items met
– Approved index/es such as Composite Financial Index from NACUBO (Business Officers organization)
Vision 2020 Performance Measures Scorecard 2015-16
• Measure 18: Implement an integrated planning, evaluation, and resource allocation system
– Percent met: 50%
– Milestones met: below 33% (red); 33 to below 66% (yellow); 66 to nearly completed (light green); completed/retired (green /gray)
– Score: 2.0
DASHBOARD
Vision 2020 Performance Measures 2015-16
Average overall
bubble & score for 2015-16
For years after 2015-16, an average score per measure will be calculated and appear in column to right of yearly score.
Student Success Measures
Goal Attainment
Outcomes
Momentum & Milestones
Student Engagement
Measure 6: Fall-to-fall retention is an example of momentum…
KPI Methodology
Simple & straightfoward
Manageable & measurable
Actionable (ambitious yet achievable)
Repeatable
Transparent

4/4/2017
8
• Julie Melnick
• Director of Institutional Research, Northeast Community College
• 402-844-7123
• 801 E. Benjamin Ave., PO Box 469
• Norfolk, NE 68702
Contact Information Questions?