Embed Size (px)
Citation preview


MissionStatement
To be successful and responsible while satisfying customers,suppliers, employees and shareholders.
.
.
.
Contents
2ANNUAL REPORT 20
16
Notice of Meeting . . . . . . . . . . . . . . . . . . . . . . . . . . . . . . . . . . . . . . . . . . . . . . . . . . . .3
Corporate Information . . . . . . . . . . . . . . . . . . . . . . . . . . . . . . . . . . . . . . . . . . . . . . .4
Financial Highlights . . . . . . . . . . . . . . . . . . . . . . . . . . . . . . . . . . . . . . . . . . . . . .5 – 7
Board of Directors . . . . . . . . . . . . . . . . . . . . . . . . . . . . . . . . . . . . . . . . . . . . . . .8 – 9
Directors’ Report . . . . . . . . . . . . . . . . . . . . . . . . . . . . . . . . . . . . . . . . . . . . . . .10 – 33
Analysis of Common Shareholders . . . . . . . . . . . . . . . . . . . . . . . . . . . . . . . . . . .35
Additional Information Required in Accordance with the Barbados Stock Exchange Listing Agreement . . . . . . . . . . . . . . .36
Goddard Enterprises Limited Subsidiary Companies . . . . . . . . . . . . .37 – 39
Goddard Enterprises Limited Associated Companies . . . . . . . . . . . . . . . . .40
Auditors’ Report . . . . . . . . . . . . . . . . . . . . . . . . . . . . . . . . . . . . . . . . . . . . . . . . . . . .42
Consolidated Statement of Financial Position . . . . . . . . . . . . . . . . . . . . . . . .43
Consolidated Statement of Changes in Equity . . . . . . . . . . . . . . . . . . . . . . .44
Consolidated Statement of Income . . . . . . . . . . . . . . . . . . . . . . . . . . . . . . . . . .45
Consolidated Statement of Comprehensive Income . . . . . . . . . . . . . . . . . .46
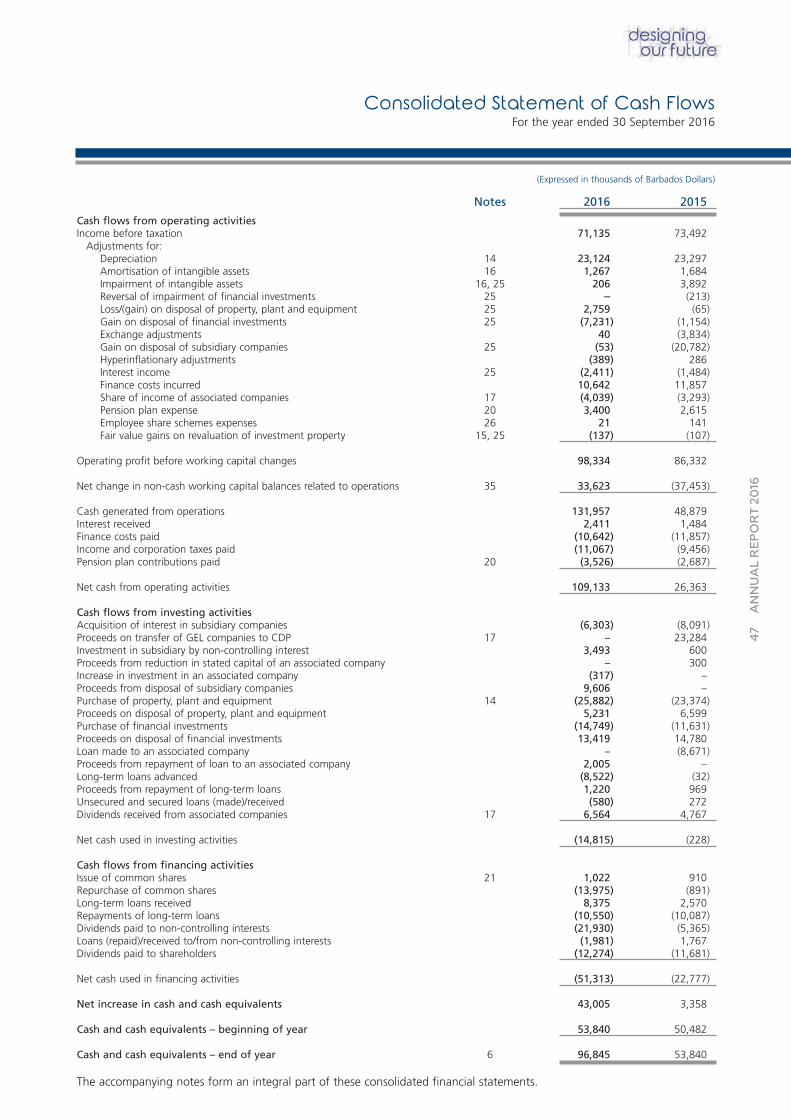
Consolidated Statement of Cash Flows . . . . . . . . . . . . . . . . . . . . . . . . . . . . . .47
Notes to the Consolidated Financial Statements . . . . . . . . . . . . . . .49 – 109
Management Proxy Circular . . . . . . . . . . . . . . . . . . . . . . . . . . . . . . . . . . . .110 – 111
Schedule of Board and Committee Meeting Attendance– Appendix A . . . . . . . . . . . . . . . . . . . . . . . . . . . . . . . . . . . . . . . . . . . . . . . . . . . . . .112
Form of Proxy . . . . . . . . . . . . . . . . . . . . . . . . . . . . . . . . . . . . . . . . . . . . . . . . . . . . . .113
.
.
.
3ANNUAL REPORT 20
16
NOTICE IS HEREBY GIVEN that the SEVENTY-EIGHTH Annual Meeting of the shareholders of Goddard EnterprisesLimited (the “Company”) will be held at the Walcott Warner Theatre, Errol Barrow Centre for Creative Imagination, TheUniversity of the West Indies, Cave Hill Campus, St. Michael, on Friday, 27 January 2017 at 5.30 p.m. for the followingpurposes:-
1. To receive Opening Remarks from Mr. A. Charles Herbert, Chairman of the Company.
2. To receive a Presentation from Mrs. C. Natasha Small, Chief Financial Officer of the Company, on the Overview ofthe Company’s Financial Performance for the year ended 30 September 2016.
3. To receive a Presentation from Mr. Anthony H. Ali, Managing Director of the Company, on the Strategic Outlookfor the Company for 2017.
4. To receive and consider the Consolidated Financial Statements of the Company for the year ended 30 September2016, together with the Reports of the Directors and Auditors thereon.
5. To elect Directors.
6. To appoint Auditors for the ensuing year and to authorise the Directors to fix their remuneration.
7. To transact any other business which may properly come before the Meeting.
By Order of the Board of Directors
Kathy-Ann L. Scantlebury Corporate Secretary
The notes to the enclosed proxy form are incorporated in this Notice.
Top FloorThe Goddard BuildingHaggatt HallSt. Michael BB11059BARBADOS
6 December 2016
Notice of Meeting
.
.
.
Board of DirectorsMr. A. Charles Herbert, B.Sc. (Hons.), F.I.A. – ChairmanMr. William P. Putnam, B.Sc. – Deputy ChairmanMr. Anthony H. Ali, B.Sc. (Hons.), M.B.A. – Managing DirectorMs. Vere P. Brathwaite, B.Sc. (Hons.), LL.B. (Hons.) – Non-Executive DirectorMr. Ian K. D. Castilho, B.A. (Hons.) – Non-Executive DirectorMr. J. Dereck Foster – Non-Executive DirectorMr. Christopher G. Rogers – Non-Executive DirectorMr. Stephen T. Worme, B.E.Sc., M.B.A. – Non-Executive Director
Management CommitteeMr. Anthony H. Ali, B.Sc. (Hons.), M.B.A. – Managing DirectorMr. Ian A. Alleyne, F.C.C.A. – Divisional General ManagerMrs. Jennifer Y. Bradshaw-Wood, B.A. (Hons.), M.B.A. – Divisional General ManagerMr. J. G. Stewart Massiah – Divisional General ManagerMrs. C. Natasha Small, B.Sc. (Hons.), F.C.C.A. – Chief Financial Officer Mr. John S. Taylor – Divisional General Manager
Corporate Governance Committee Audit & Risk CommitteeMs. Vere P. Brathwaite – Chairman Mr. William P. Putnam – ChairmanMr. A. Charles Herbert Mr. A. Charles HerbertMr. Christopher G. Rogers Mr. Stephen T. Worme
Compensation & Human Resources CommitteeMr. Ian K. D. Castilho – ChairmanMs. Vere P. BrathwaiteMr. A. Charles HerbertMr. Stephen T. Worme
Company Secretary AuditorsMiss K. L. Scantlebury, LL.B. (Hons.), LL.M. (Dist.) Ernst & Young
Attorneys-At-Law BankersClarke Gittens Farmer CIBC FirstCaribbean International Bank
(Barbados) Limited
Registered OfficeTop FloorThe Goddard BuildingHaggatt HallSt. Michael, BB11059Barbados
4ANNUAL REPORT 20
16
Corporate Information
.
.
.
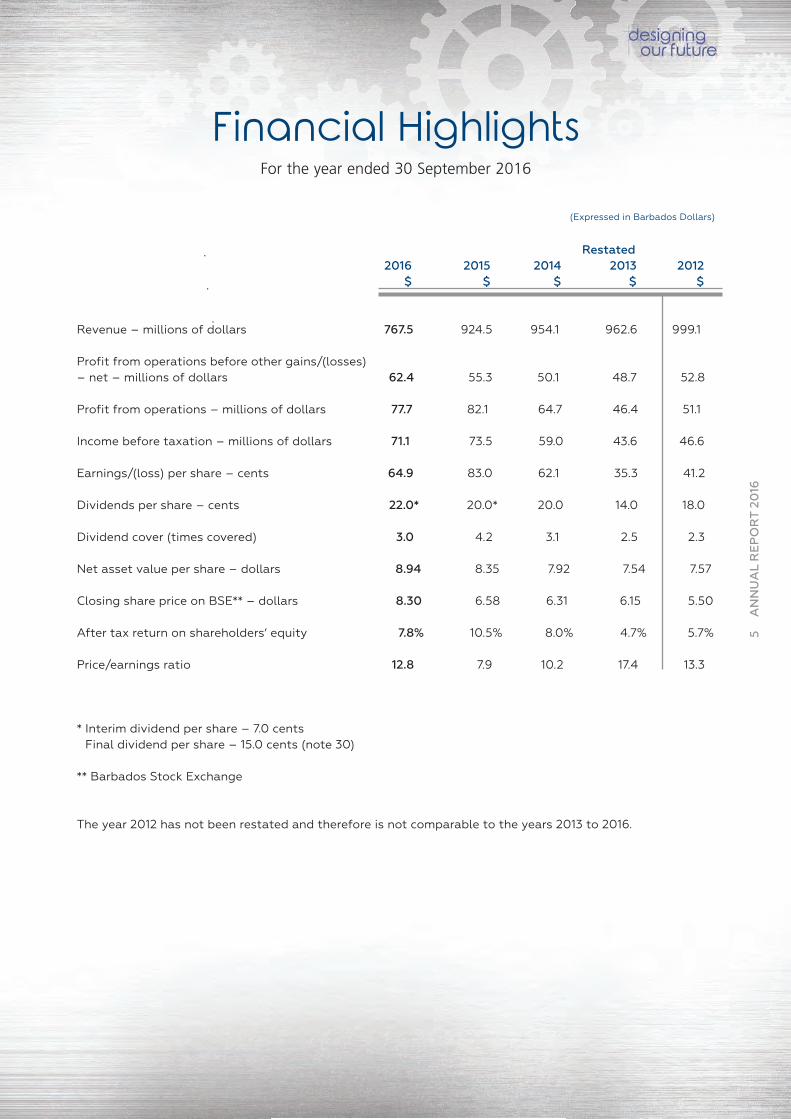
Financial HighlightsFor the year ended 30 September 2016
Restated2016 2015 2014 2013 2012
$ $ $ $ $
Revenue – millions of dollars 767.5 924.5 954.1 962.6 999.1
Profit from operations before other gains/(losses)– net – millions of dollars 62.4 55.3 50.1 48.7 52.8
Profit from operations – millions of dollars 77.7 82.1 64.7 46.4 51.1
Income before taxation – millions of dollars 71.1 73.5 59.0 43.6 46.6
Earnings/(loss) per share – cents 64.9 83.0 62.1 35.3 41.2
Dividends per share – cents 22.0* 20.0* 20.0 14.0 18.0
Dividend cover (times covered) 3.0 4.2 3.1 2.5 2.3
Net asset value per share – dollars 8.94 8.35 7.92 7.54 7.57
Closing share price on BSE** – dollars 8.30 6.58 6.31 6.15 5.50
After tax return on shareholders’ equity 7.8% 10.5% 8.0% 4.7% 5.7%
Price/earnings ratio 12.8 7.9 10.2 17.4 13.3
* Interim dividend per share – 7.0 centsFinal dividend per share – 15.0 cents (note 30)
** Barbados Stock Exchange
The year 2012 has not been restated and therefore is not comparable to the years 2013 to 2016.
(Expressed in Barbados Dollars)
5ANNUAL REPORT 20
16
.
.
.
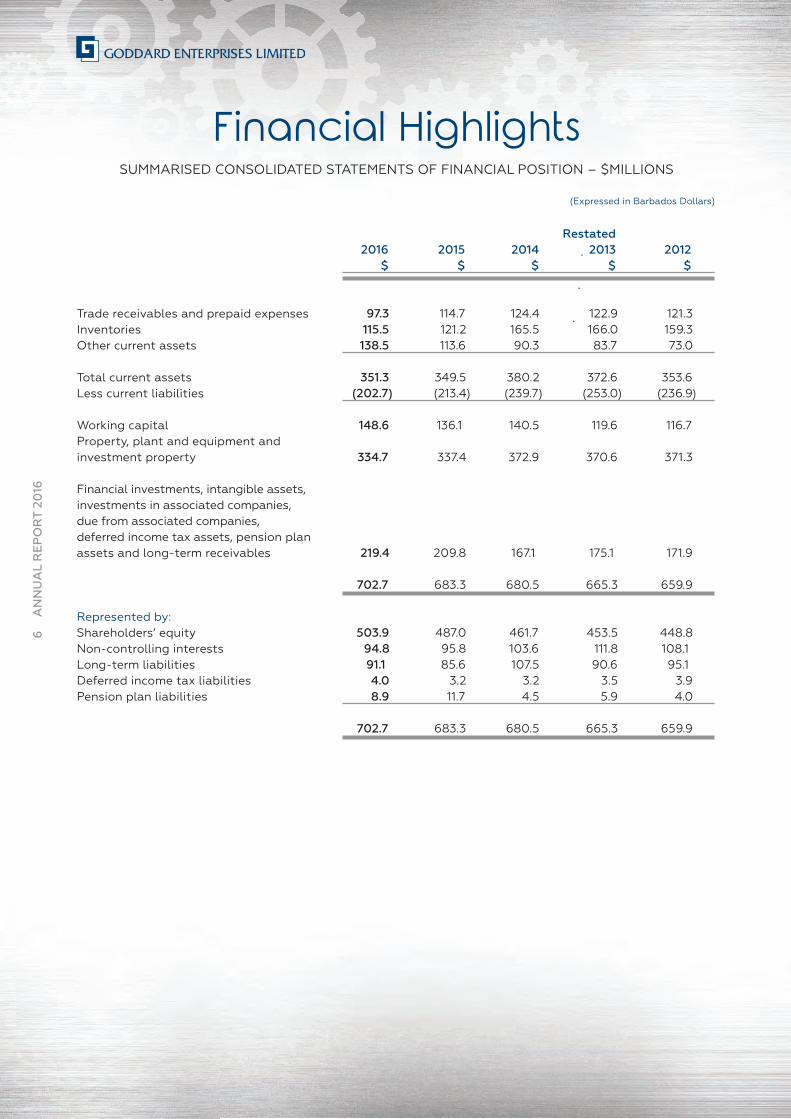
Financial HighlightsSUMMARISED CONSOLIDATED STATEMENTS OF FINANCIAL POSITION – $MILLIONS
Restated2016 2015 2014 2013 2012
$ $ $ $ $
Trade receivables and prepaid expenses 97.3 114.7 124.4 122.9 121.3Inventories 115.5 121.2 165.5 166.0 159.3Other current assets 138.5 113.6 90.3 83.7 73.0
Total current assets 351.3 349.5 380.2 372.6 353.6Less current liabilities (202.7) (213.4) (239.7) (253.0) (236.9)
Working capital 148.6 136.1 140.5 119.6 116.7Property, plant and equipment and investment property 334.7 337.4 372.9 370.6 371.3
Financial investments, intangible assets,investments in associated companies, due from associated companies,deferred income tax assets, pension planassets and long-term receivables 219.4 209.8 167.1 175.1 171.9
702.7 683.3 680.5 665.3 659.9
Represented by:Shareholders’ equity 503.9 487.0 461.7 453.5 448.8Non-controlling interests 94.8 95.8 103.6 111.8 108.1Long-term liabilities 91.1 85.6 107.5 90.6 95.1Deferred income tax liabilities 4.0 3.2 3.2 3.5 3.9Pension plan liabilities 8.9 11.7 4.5 5.9 4.0
702.7 683.3 680.5 665.3 659.9
(Expressed in Barbados Dollars)
6ANNUAL REPORT 20
16
.
.
.
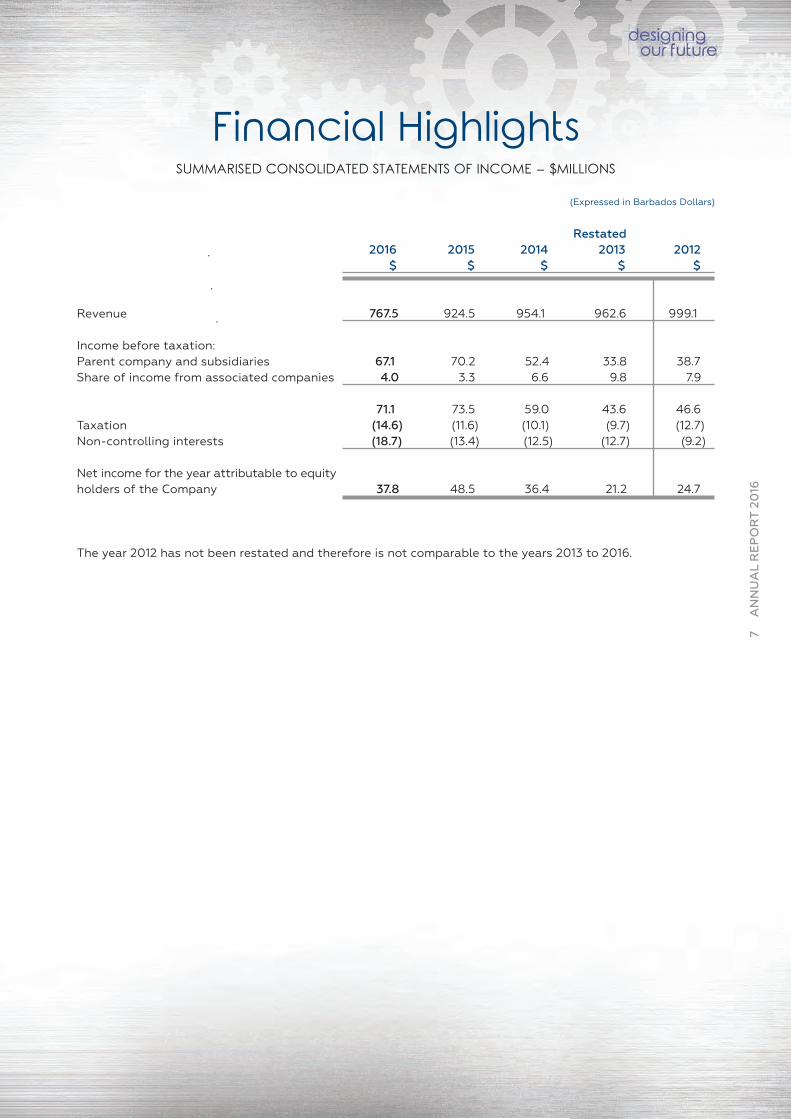
Financial HighlightsSUMMARISED CONSOLIDATED STATEMENTS OF INCOME – $MILLIONS
Restated2016 2015 2014 2013 2012
$ $ $ $ $
Revenue 767.5 924.5 954.1 962.6 999.1
Income before taxation:Parent company and subsidiaries 67.1 70.2 52.4 33.8 38.7Share of income from associated companies 4.0 3.3 6.6 9.8 7.9
71.1 73.5 59.0 43.6 46.6Taxation (14.6) (11.6) (10.1) (9.7) (12.7)Non-controlling interests (18.7) (13.4) (12.5) (12.7) (9.2)
Net income for the year attributable to equityholders of the Company 37.8 48.5 36.4 21.2 24.7
The year 2012 has not been restated and therefore is not comparable to the years 2013 to 2016.
(Expressed in Barbados Dollars)
7ANNUAL REPORT 20
16

.
.
.
Board of Directors
8ANNUAL REPORT 20
16
WILLIAM P. PUTNAMDEPUTY CHAIRMAN
VERE P. BRATHWAITENON-EXECUTIVE DIRECTOR
A. CHARLES HERBERTCHAIRMAN
A. CHARLES HERBERT, B.Sc. (Hons.), F.I.A.
Charles Herbert became Chairman of the Goddard Group of Companies on 5 February 2013, following the retirement of Mr. Joseph N. Goddard. Mr. Herbert spent 15 years of his professional career with The Barbados Mutual Life AssuranceSociety, now Sagicor Life Inc. (“Sagicor”), and at the time of his resignation fromSagicor, was a member of its Senior Management team responsible for the Actuarial,Group Insurance and Pension Departments. A Barbadian by birth, Mr. Herbert, aBarbados Exhibition Winner in 1974, achieved First Class Honours in his B.Sc. inMathematics from the University of Edinburgh. He also holds a Diploma in Educationfrom the University of the West Indies and is a Fellow of the Institute of Actuaries. Priorto joining Sagicor, and on his return to Barbados from Edinburgh, Mr. Herbert servedhis alma mater, Harrison College, as an Assistant Master. Following his sojourn atSagicor, he joined the firm of Watson Wyatt Worldwide as a Consulting Actuary beforeestablishing the Barbados Branch of Eckler Limited in 1996, where he is currently thePrincipal. Mr. Herbert has worked closely with the Barbados Employers’ Confederation,the Supervisor of Insurance, and more recently, the Financial Services Commission, onthe drafting and implementation of the new Pension legislation. Mr. Herbert is theChairman of the Barbados Private Sector Association.
IAN K. D. CASTILHONON-EXECUTIVE DIRECTOR

.
.
.
9ANNUAL REPORT 20
16
KATHY-ANN L. SCANTLEBURYCORPORATE SECRETARY
STEPHEN T. WORMENON-EXECUTIVE DIRECTOR
ANTHONY H. ALIMANAGING DIRECTOR
ANTHONY H. ALI, B.Sc. (Hons.), M.B.A.
Anthony Ali spent most of his career in Canada, where he worked in the areas ofOperations, Sales, Marketing, Customer Allegiance and Strategic Planning for a number of Canadian and United States of America Fortune 500 companies. Beforejoining Goddard Enterprises Limited in 2013 as Managing Director, Mr. Ali workedwith SM Jaleel & Co. Ltd. in Trinidad and Tobago where he served as General Managerfrom 2010-2013. Upon graduating from the University of Toronto in 1988 with aB.Sc. Honours Degree in Chemistry, Mr. Ali worked at National Silicates as a ResearchChemist, and later as its Business Development Manager. He completed a post graduate degree in Executive Marketing at the University of Western Ontario in 1992and several other Leadership and Management programmes. In 1993, Mr. Ali wasselected from 6,000 employees of Abitibi-Price Inc. to participate in a fellowship atMcKinsey & Co. In 2005, he joined Thermo Fisher Scientific as Global Director ofOperations and Customer Allegiance before moving to Enerworks Inc. where heserved as Vice President of Sales, Marketing and Customer Allegiance. Mr. Ali hasserved on several Boards in the Energy field and is the co-author of several publications.
CHRISTOPHER G. ROGERSNON-EXECUTIVE DIRECTOR
J. DERECK FOSTERNON-EXECUTIVE DIRECTOR
10ANNUAL REPORT 20
16
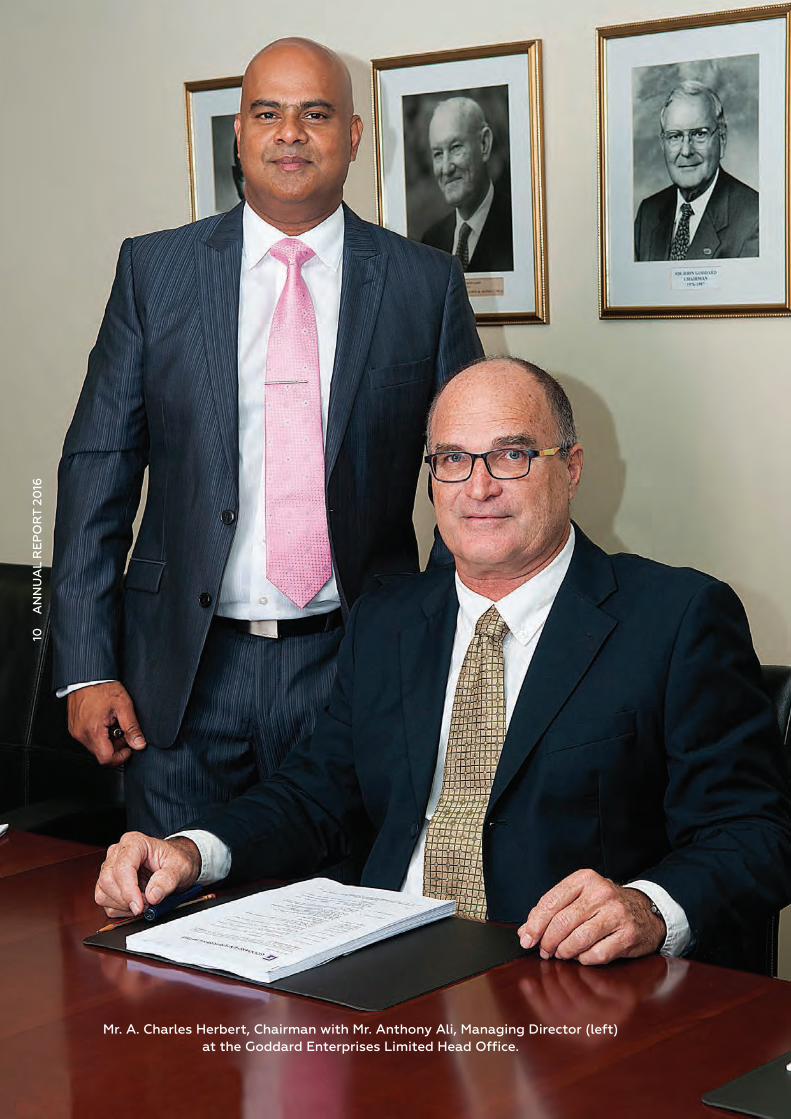
Mr. A. Charles Herbert, Chairman with Mr. Anthony Ali, Managing Director (left) at the Goddard Enterprises Limited Head Office.
Consolidated Financial Overview 2015/2016
The Board of Directors of Goddard Enterprises Limited (“GEL”) is pleased to present the Group’s Consolidated Financial Reviewfor the year ended 30 September 2016.
Consolidated Group sales and profits for the year ended 30 September 2016 amounted to $767.5 million and $56.5 million,compared with $924.5 million and $61.9 million in the previous year, respectively. Earnings per share was 64.9 centscompared to 83.0 cents in 2015.
Global growth has been progressively weaker for the third consecutive year. This year in particular has seen the slowest growthsince the Global Financial Crisis in 2008-2009 which continues to afflict countries in the Caribbean. The InternationalMonetary Fund has projected a 3.1% growth rate for 2016, with an expected 1.4% growth in the Caribbean’s tourism basedeconomies. This represents a dramatic increase from the 0.8% growth that was observed in these countries in 2015. Countrieslike Trinidad and Tobago have seen the largest decline in Gross Domestic Product since 1992, while continued contraction inSuriname is predicted. The fate of the Caribbean continues to be in the hands of economic factors beyond its control and external circumstances including the still unknown impact of Brexit and the recent elections in the United Statesof America. The World Bank’s Ease of Doing Business Index shows deterioration across all Caribbean countries except forGuyana and Jamaica. For the financial year ended 30 September 2016, Group revenue decreased by 17.0% below the prioryear to $767.5 million. This decrease is attributed to the transfer of six of our Group’s subsidiaries in the Food and ConsumerGoods Distribution (“FCGD”) sector to our 50:50 joint venture company Caribbean Distribution Partners Limited (“CDP”). Theresults of these companies which we previously reported for the first nine months in the Group’s consolidated numbers lastyear, are now accounted for in the Group’s share of income in associated companies. Revenue was also impacted by thedivestment of O. D. Brisbane and Sons (Trading) Limited in Saint Kitts and Hutchinson (Antigua) Limited in Antigua. Thedecrease generated a Gross Profit of $44.5 million, which was up over the prior year by 17.7%. This increase was a result, inpart, of the improvements achieved through the re-organization of some of our businesses into vertical lines rather than bygeography as previously done and the implementation of a new reporting structure. Our selling, marketing and administra-tive expenses were 36.7% of revenue compared to 32.2% in 2015, mainly due to the exclusion of the revenue associatedwith the aforementioned FCGD companies from the Group’s results.
Other gains/(losses) – net decreased by $11.4 million or 42.6% compared to the prior year. This negative impact was due tothe one time gain associated with the transfer of the six subsidiaries into CDP in the prior year.
Our share of income of associated companies rose by $0.7 million as a result of an improved performance from CDP. The over-all increase in taxation was as a result of an increase in the Group’s taxable operating profit. Net income for the year of $56.5million represents a decrease of 8.7% below the prior year.
Looking at the Group’s consolidated balance sheet, our working capital ratio at 1.73 reflected adequate control over the number of days of inventories and trade receivables. The total assets of the Group’s business was financed by 33.9% debt.Our net asset value per share now stands at $8.94 compared to $8.35 in 2015, an increase of $0.59 per share and our shareprice moved from $6.58 per share as of 30 September 2015 to $8.30 per share as of 30 September 2016.
Appreciation to Mrs. Jennifer Bradshaw-Wood, Divisional General Manager, Human Resources and CommunityRelations
Subsequent to the year-end, a change to GEL’s Head Office structure was effected when the position of Divisional GeneralManager, Human Resources and Community Relations was made redundant. As a result, we bade farewell to Mrs. Jennifer Bradshaw-Wood, who served in that position for the past three years. Mrs. Bradshaw-Wood joined the GEL Group in 1997 and served as Human Resources Manager of Hanschell Inniss Limited prior to joining GEL’s Head Office in1999 as Group Human Resources Manager. We wish to place on record our sincerest appreciation to Mrs. Bradshaw-Woodfor her service to the Group over the past 19 years and extend to her best wishes in her future endeavours.
Retirement of Mr. John S. Taylor, Divisional General Manager, Manufacturing and Services Division
Mr. John S. Taylor, Divisional General Manager, Manufacturing and Services Division, will retire from his position with theCompany with effect from 31 December 2016. He joined the GEL Group in 1995 as General Manager of McBride (Caribbean)
Directors’ Report
11ANNUAL REPORT 20
16
12ANNUAL REPORT 20
16
Limited. In 1998, he was appointed as Managing Director of The West Indies Rum Distillery Limited, before becoming DivisionalGeneral Manager in 2000. Mr. Taylor has rendered dedicated service to the Company, the Board, having served on it from 1 April 2008 until 31 January 2012, and the Group as a whole. The Board places on record its sincerest appreciation to Mr. Taylor for his contribution to the Group over the past 21 years and wishes him a healthy and happy retirement.
Managing Director’s Outlook
2016 has been a pivotal year for the Group. We began to shift our focus from one of introspection to one of being externallyfocused. We were able to crystalize our overall Corporate Strategy into 3 Rs: “Re-Organize, Reduce and Replicate”. Over thelast two years we focused internally on Re-Organizing into vertical industry channels and moved away from local country man-agement. As a result, we now have business lines such as Automotive, Building Supplies, Food & Beverage (“CDP”),Manufacturing, Catering and Financial Services. We also Re-Organized the Catering Division into three new sections: LatinAmerica, the Caribbean and Ground Handling. Regional Managers have been appointed for each section of the Division. Theintent is to have Management concentrate on narrow lines of business to accelerate growth and attain synergies. We arepleased to indicate that this strategy is already bearing fruit. The second phase of the strategy – Reduce – is geared at eliminating waste, duplicated effort and layers of complexity while pushing decision-making down to the appropriate operational level. With this approach, we would then be able to determine which business lines represent opportunities forus to Replicate – the third step in our strategy. During 2016, a significant amount of time was spent preparing the subsidiariesso that we are now in a position to target accelerated growth.
On the Organizational Development side, we continued to conduct 360 degree Leadership Behavioural Analysis on theManagement team during the year. This analysis will assist us in developing the right type of leader that the Group needs inorder to continue to deliver excellent service, drive innovation and push the strategic planning process down further into theorganization. We recognize that our number one asset is PEOPLE and in order to maximize our return on this asset, we needthe right leadership that cultivates an environment of employee engagement.
In 2015, we embarked on a programme of Energy Management and we have continued to invest in the process and equipment, including photovoltaic (“PV”) systems, as we seek to manage our costs and to enhance our environmental con-sciousness.
We remain committed to creating a culture of Innovation and Entrepreneurship with a sense of Urgency. We will continually strive for Excellence while instilling a Passion for Customer Service to further enhance shareholder value.
Directors’ Report... continued

13ANNUAL REPORT 20
16
| A
NN
UA
L R
EP
OR
T 2
01
6

14ANNUAL REPORT 20
16
Mr. John Taylor, Divisional General Manager
15ANNUAL REPORT 20
16
The Division recorded sales marginally below last year but saw an improvement in profit. This improved profit was due mainly to increased operational efficiencies and the stabilisation of energy and raw material costs in our rum, food and house-hold products businesses. In addition, our building supplies associate company was able to significantly expand sales whichalso led to improved profit.
Our printing and packaging operations had a better year in comparison to last year as demand increased, while Managementwas able to settle operations and increase throughput. Our new label printing plant in Jamaica exceeded expectations as manyproducers there sought to upgrade their packaging and presentation.
The Division’s rum operations continued to experience significant competition from subsidised United States of America producers in that market during the year. However, our United Kingdom and Barbados sales of branded product continued togrow. Market conditions through the Caribbean continued to be challenging and our sales of food and household products were largely flat. However, our sales of FARMER’S CHOICE premium meat products were up 3.7% for the year inBarbados and the Eastern Caribbean. During 2016, two new FARMER’S CHOICE products, pork nuggets and a premium lineof canned cocktail sausages, were successfully launched. Through sales promotion efforts and product innovation, we continue to promote the sales of locally produced pork and chicken.
Our sales of PURITY and WONDER products increased in 2016, aided by the introduction of our new cassava bread under the WONDER brand. We also launched a cassava great cake. These products are completely new to the local market and aredesigned to encourage the local production of cassava as well as to provide a low gluten option for consumers. We also intro-duced a new line of PURITY sweet and savoury pastry products which have been well received.
With the threat of the Zika virus this year, sales of our insecticide aerosol products maintained their momentum from 2015,when sales increased significantly due to the chikungunya outbreak.
Although the year was a successful one for the Division, there are many challenges ahead. The Division will continue to workhard to increase efficiencies and reduce waste through the improvement of management information systems and the imple-mentation of better operating practices.
Manufacturing and Services Division

16ANNUAL REPORT 20
16
Mr. Ian Alleyne, Divisional General Manager
17ANNUAL REPORT 20
16
Automotive, Building Supplies and
Services Division
The Automotive, Building Supplies and Services Division performed admirably compared to the prior year with an increase inoperating profit of 14.5%.
In the Automotive department, Courtesy Garage Limited in Barbados recorded an excellent performance with increases inboth revenue and profitability compared to the prior year. The company increased its vehicle unit sales as well as its marketshare. It also achieved its sales and profit targets with respect to the arrangement it entered into in the previous year withZhengzhou Nissan Automobile Company Limited, a company based in China. Fidelity Motors Limited in Jamaica had another year of steady improvement with an overall increase in revenue as well as in sales of vehicle units.
The Building Supplies department produced a year of impressive growth in profitability. Both Coreas Hazells Inc. in SaintVincent and the Grenadines and M&C Home Depot Limited in Saint Lucia benefitted from joint purchasing and operating synergies resulting from the re-organization of the Division along business lines.
The Shipping department also had a good year. Goddards Shipping (Barbados) Limited (formerly Goddards Shipping & ToursLimited) and Sea Freight Agencies & Stevedoring Limited, both in Barbados, as well as the shipping division of Minvielle &Chastanet Limited in Saint Lucia, all recorded significant increases in both revenue and operating profit.
We also recorded positive improvement in revenue and profitability at our pharmacies in Saint Lucia and in Saint Vincent andthe Grenadines.
The re-organization of the Division along business lines at the beginning of the financial year, as mentioned earlier, has hada positive effect on the operations and the profitability of the Division. Our focus during the coming financial year will be ongrowth facilitated by taking advantage of the opportunities that will be on offer.

18ANNUAL REPORT 20
16
Mr. J.G. Stewart Massiah,Divisional General Manager
The Catering and Ground Handling Division posted satisfactory results in 2016 despite continued challenges in several of ourmarkets. The overall performance was impacted by competitive pressures, lower oil prices in Trinidad and Tobago with theresultant pressure on margins and by the adverse market conditions in Venezuela. Our results in Venezuela are now beingtranslated at the DICOM rate of Bolivars 658.89 to US$1.00 compared with the SIMADI rate of Bolivars 199.42 to US$1.00in the prior year. Operations in Caracas and Isla Margarita continue to be adversely impacted by the scarcity of raw materials.Our team is doing an excellent job in keeping the operations going under these conditions.
The Division, which is geographically spread across 21 countries in the Caribbean and Latin America, employs 3,800 associates and prepared in excess of 23,000,000 meals across its businesses in the year. In addition, it serviced over 110,000flights for the year.
During the year, the Goddard Catering Group (“GCG”) team at the Division’s Head Office in Florida was further strengthenedwith the addition of three new positions: Regional Managers for the Catering Operations of each of Latin America and theCaribbean and a Manager of Ground Handling Operations. In addition, a Lean Manufacturing Specialist based in Colombia,who will work to improve our productivity and streamline our processes, was also added to our team.
We continue our efforts to reduce our energy costs and plan to further invest in PV systems in the Group in the coming year.In addition, we have dedicated attention and allocated resources to increase our focus on the environment and sustainability.
The Group was recognized by several customers during 2016 for outstanding quality and service. GCG Honduras, S.A. won theCrystal Award for 2015 from United Airlines at the 2015 Quality 1st Awards Dinner, while GCG Bogota Ltda. and GCG (Jamaica)Limited won the Silver and Bronze Awards respectively. Virgin Atlantic Airways presented GCG (Barbados) Limited with the pres-tigious Passenger Recognition Award and GCG (Antigua) Limited with the Culinary Excellence Award. The review of KeyPerformance Indicators (“KPIs”) continues to be a key element in driving improvement in quality and customer service.
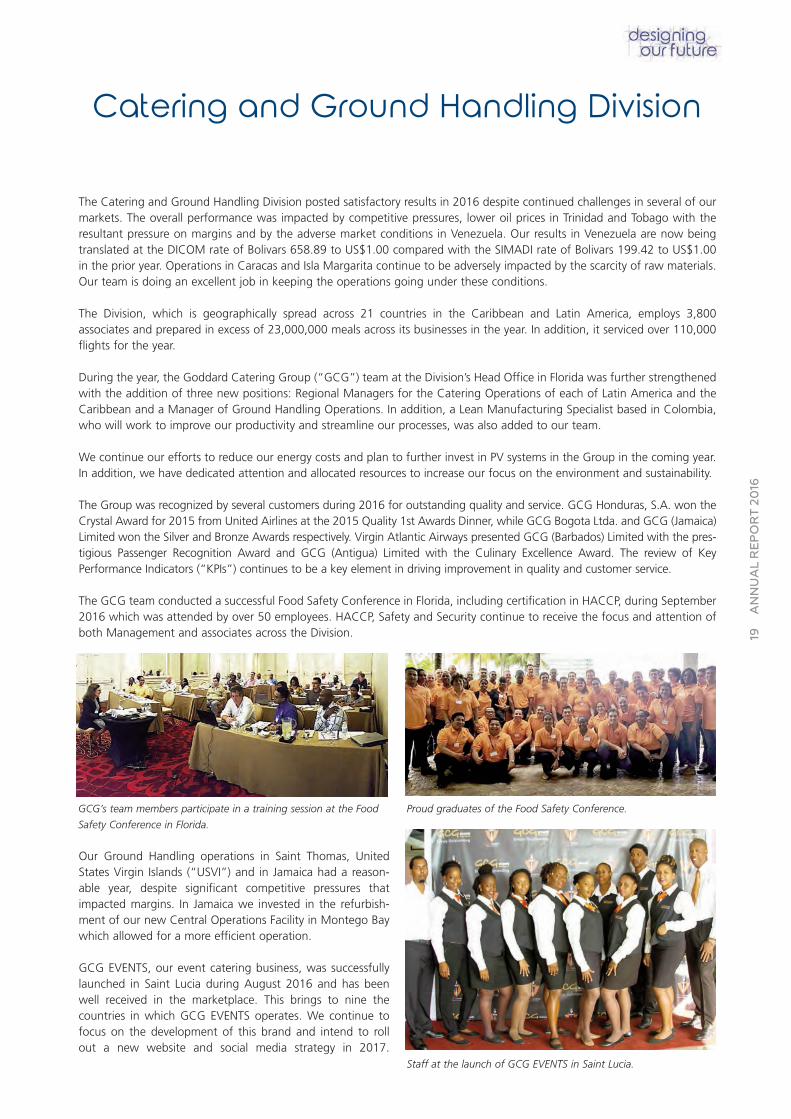
The GCG team conducted a successful Food Safety Conference in Florida, including certification in HACCP, during September2016 which was attended by over 50 employees. HACCP, Safety and Security continue to receive the focus and attention ofboth Management and associates across the Division.
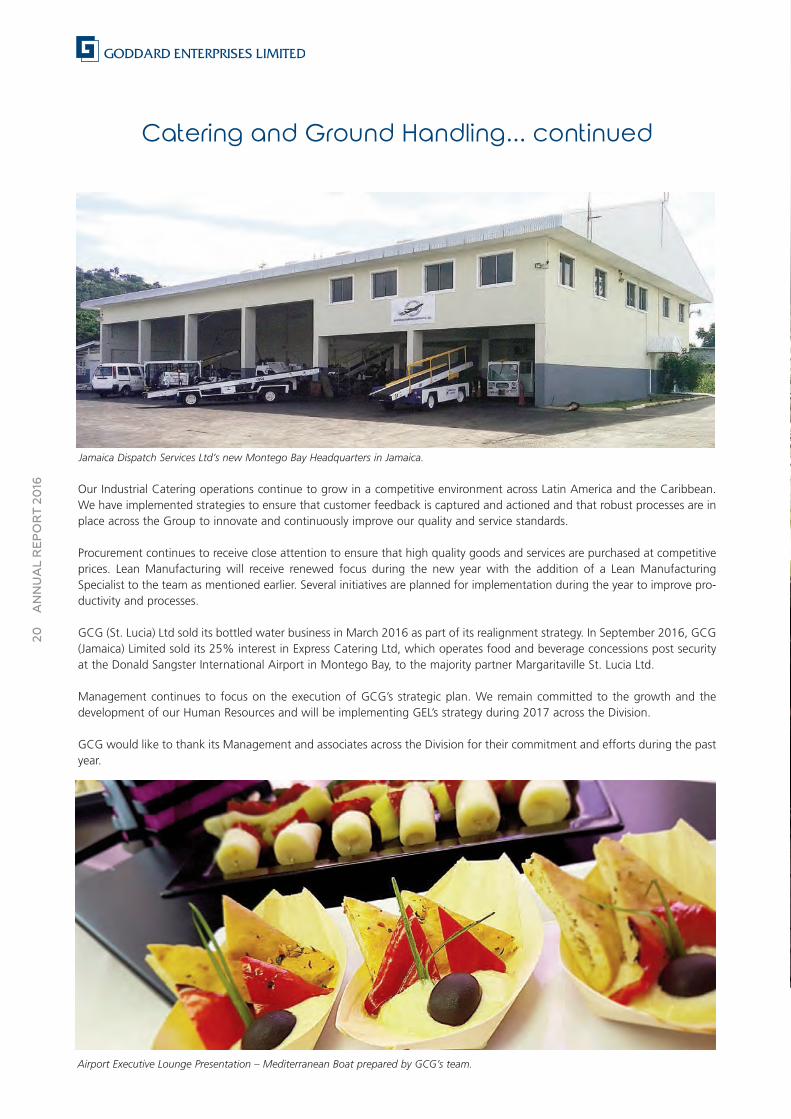
Our Ground Handling operations in Saint Thomas, UnitedStates Virgin Islands (“USVI”) and in Jamaica had a reason-able year, despite significant competitive pressures thatimpacted margins. In Jamaica we invested in the refurbish-ment of our new Central Operations Facility in Montego Baywhich allowed for a more efficient operation.
GCG EVENTS, our event catering business, was successfullylaunched in Saint Lucia during August 2016 and has beenwell received in the marketplace. This brings to nine thecountries in which GCG EVENTS operates. We continue tofocus on the development of this brand and intend to roll out a new website and social media strategy in 2017.
Catering and Ground Handling Division
19ANNUAL REPORT 20
16
GCG’s team members participate in a training session at the Food
Safety Conference in Florida.
Proud graduates of the Food Safety Conference.
Staff at the launch of GCG EVENTS in Saint Lucia.
Catering and Ground Handling... continued
20ANNUAL REPORT 20
16 Our Industrial Catering operations continue to grow in a competitive environment across Latin America and the Caribbean.We have implemented strategies to ensure that customer feedback is captured and actioned and that robust processes are inplace across the Group to innovate and continuously improve our quality and service standards.
Procurement continues to receive close attention to ensure that high quality goods and services are purchased at competitiveprices. Lean Manufacturing will receive renewed focus during the new year with the addition of a Lean ManufacturingSpecialist to the team as mentioned earlier. Several initiatives are planned for implementation during the year to improve pro-ductivity and processes.
GCG (St. Lucia) Ltd sold its bottled water business in March 2016 as part of its realignment strategy. In September 2016, GCG(Jamaica) Limited sold its 25% interest in Express Catering Ltd, which operates food and beverage concessions post securityat the Donald Sangster International Airport in Montego Bay, to the majority partner Margaritaville St. Lucia Ltd.
Management continues to focus on the execution of GCG’s strategic plan. We remain committed to the growth and the development of our Human Resources and will be implementing GEL’s strategy during 2017 across the Division.
GCG would like to thank its Management and associates across the Division for their commitment and efforts during the pastyear.
Airport Executive Lounge Presentation – Mediterranean Boat prepared by GCG’s team.
Jamaica Dispatch Services Ltd’s new Montego Bay Headquarters in Jamaica.


22ANNUAL REPORT 20
16
Ms Tracey D. Shuffler, Chief Executive Officer, CDP
23ANNUAL REPORT 20
16
Caribbean Distribution Partners Limited
Caribbean Distribution Partners Limited (“CDP”), our joint venture with Agostini’s Limited, completed its first financial yearwith mixed results across the companies. Many of our countries of operation continue to have challenging economies.Barbados’ economy is languishing under a heavy debt burden with little growth, despite improved tourism. There was amarked downturn in Trinidad and Tobago, occasioned by the falling price of oil to which its economy is closely aligned.Consumer spending was impacted by gradual devaluation of the Trinidad and Tobago dollar and concern over impacts at anational level. The markets of the Organisation of Eastern Caribbean States have showed some small gains with marginalgrowth returning to some of the economies and the return of cautious optimism.
Against this background, the CDP companies have performed below what we had budgeted for the year but with animproved sales and profit performance on last year. Better margin management mitigated against the shortfall in sales against budget with almost all of the companies reporting improved gross profit percentages.
Hand Arnold Trinidad Limited, based in Trinidad and Tobago, delivered a strong result for the year due to much improved mar-gin management and strong sales, despite the effects of the economy and currency slide in the last several months of thefinancial year. The team must be commended for their efforts in a difficult market. The ongoing development and expansionof the CDP owned MOO! brand of liquid milks against international rivals by the team has been encouraging.
Barbados based Hanschell Inniss Limited has shown some improvement in the fundamentals of the business but will have tocontinue to build sales, improve efficiencies and strengthen talent in order to realize the latent potential of the business in acompetitive market. During the latter half of the year, the EVE brand, principally managed out of Barbados for a number ofour markets, has shown good recovery. A major expansion of the warehouse, located at Fontabelle, is planned to facilitate theexpansion of major brands being marketed and distributed by the company.
Peter & Company Limited, based in Saint Lucia, completed its merger of operations into one expanded distribution location based at Cul De Sac. This move will allow for more efficient warehousing and distribution operations and is expected to improve operating expenses which for the last year were too high for the sales base of the organization.
Coreas Distribution Limited, in Saint Vincent and the Grenadines, delivered a commendable result, particularly considering the unfortunate absence of their Food Mart retail operation, which was destroyed by fire just before the start of the financial year. Despite this, its sales and profits held well during the year as the company strengthened its position as market leader in the FCGD sector.
Grenada based Independence Agencies Limited, operating in a stagnant economy, struggled with the impact of the loss of asignificant agency early in the second quarter of the financial year. The acquisition of distribution rights for the CDP ownedSWISS brand of pastas and condiments has shown promise since coming into its portfolio of brands. In anticipation of expanded operations, an extension is being constructed at its warehouse facilities.
Desinco Limited, based in Guyana, in which we have a minority interest, has had a good year as the company expands andgrows with the addition of CDP owned, managed and associated brands. This operation too, will eventually need additionalwarehouse space on its premises at Eccles.
CDP made two acquisitions towards the end of the financial year: Vemco Limited and Pepsi-Cola Trinidad Bottling CompanyLimited. The former is the owner and manufacturer of one of the strongest and fastest growing regional brands, SWISS. Theexport potential of this brand is significant and we aim to continue to build sales on this front. The latter, purchased in earlyNovember 2016, has the rights to distribute the PEPSI, MOUNTAIN DEW, OCEAN SPRAY and 7-UP brands in Trinidad andTobago as well as in Barbados. In addition to these brands, CDP owns the rights to distribute PEARDRAX and CYDRAX in thesemarkets as well. The development of this beverage distribution company will grow as new beverage brands are added in thecoming months.

Mrs. C. Natasha Small, Chief Financial Officer
24ANNUAL REPORT 20
16
25ANNUAL REPORT 20
16
Sagicor General Insurance Inc., our associated company in which we have a 45% shareholding, has shown a commendable5% increase in gross written premiums up to September 2016 over the same period in 2015, although the market continuesto be extremely aggressive. With the introduction of several new initiatives such as DrivePal Plus, Classic Car, and recently Safer PSVs, the company has realized some increased profitability in spite of the reduced rates and increased competition throughout the market. Investment income has also increased slightly compared to the previous year. There hasbeen a reduction in net claims incurred for the period, and as a result, the overall loss ratio at 30 September 2016 hasdecreased to 43.85% as compared to 47.25% recorded at 30 September 2015.
Globe Finance Inc. continued to exercise a cautious and conservative approach to new business development during 2016.The overall economic environment continues to present challenges in all sectors and loan impairments continue to receiveattention. The company’s focus on growth is being maintained on our foreign exchange, credit card and corporate vehicleleasing product lines.
Bridgetown Cruise Terminals Inc. (“BCTI”) increased its revenue during the year by 4.2% due to a 4% increase in cruise passenger arrivals. However, profit before tax fell by 14.3% to $1.5 million due mainly to an increase in administrative expenses. The lease for the cruise facility with the Barbados Port Inc. (“BPI”) is due to expire on 31 December 2016. BCTI hassignalled its intention to obtain an extension of the lease and is in discussion with the BPI in this regard.
Financial Services Division
Information Technology
Update on new system implementations
Work continues on the implementation of a new application system at Courtesy Garage Limited. Initial plans to roll out thesystem, which is currently used in Jamaica, proved unworkable due to the specific needs of the Barbadian subsidiary. The business has changed course and is instead preparing to implement an alternative application in the coming calendar year. A major upgrade is also planned for Purity Bakeries in the Manufacturing and Services Division. This will be a re-implementa-tion of existing software which will improve the current transactional processes that have become inefficient over time. Thebakery is more than half-way through a detailed process re-engineering exercise in preparation for the implementation in thecoming year.
Establishing Information Technology (“IT”) Governance
In keeping with our strategy to establish best practice standards at GEL, Group IT has completed a comprehensive review andrevision of IT disaster recovery procedures and the revised policies have been deployed across the Group. In addition, a systemfor reporting to check compliance in the subsidiaries is being rolled out. The next steps on the roadmap are to focus on IT riskand to develop a framework based on industry standards for the Group.
Progress towards Digital Media
Work is underway on a digital strategy in the Hardware and Building Supplies sectors with projects aimed at improving customer loyalty. After considering a Group wide strategy, we settled on a plan to pilot a digital project in one Division that,if successful, could be replicated across the other subsidiaries. The focus will be on improving customer intimacy through socialmedia and a customer loyalty platform.
Creating value through IT
Group IT is working with our Manufacturing and Services Division to derive more value out of the data we collect. With theintroduction of business intelligence dashboards at Purity Bakeries and Wonder Bakery Limited in Saint Lucia, we are able tomonitor key KPIs on a daily basis, allowing the subsidiaries to react quickly to issues that arise in their production pipeline, andto measure efforts at improving efficiency. The process has highlighted areas where mobile technology can further improve logistics. This technology is to be developed in the coming year.
Group IT has reaped benefits of improved efficiency from internal changes. A pilot of a Lean IT system in Barbados has helpedthe team improve performance yielding an over 40% increase in the number of IT jobs completed and halving the number ofjobs outstanding for over 30 days. Given the positive benefits of this technique, Group IT is working on a roadmap to roll outthis change across the rest of the Group.
26ANNUAL REPORT 20
16


28
28ANNUAL REPORT 20
16
Mrs. Jennifer Bradshaw-Wood, Divisional General Managerwith members of the Human Resources Department
29ANNUAL REPORT 20
16
Human Resources &
Community Relations
For the period under review the new company strategy was rolled out to the leaders, with a focus in the area of People on:Re-tooling our management, Re-engaging our associates and Rewarding excellent performance. In aligning with this strategywe rolled out the 360 degree Leadership Behavioural Evaluations to the Executives in the Group for a second year with a viewto identifying areas of high performance and acting towards growth, improvement and development as we worked to re-toolour Leadership. Additionally, 18 leaders from across the Group recently participated in an impactful and practical one day train-ing session on negotiation skills.
We have also placed a renewed focus on employee engagement. We view this as the key driver of our Company’s success aswe see ourselves as investing in people, not just businesses. To this end we are working towards assessing engagement levels through a second survey and will be implementing initiatives that will drive a culture of engagement across our Group.Our employees’ success is our Company’s success!
Training & Development
We facilitated on-line and face-to-face developmental programmes across the Group for Management and staff during theyear in review. A number of training sessions in both technical and non-technical areas were hosted. These included theManagement Skills Certificate which targeted Supervisory and Middle Management staff, done in conjunction with the CaveHill School of Business and the Technical and Vocational Education and Training Council. For this cohort, participants will beeligible to attain their Caribbean Vocational Qualifications and their National Vocational Qualifications following on-the-jobassessments. During the year we also conducted programme assessments by attaining feedback from the participants andtheir managers on their post training performance.
With a view to offering consistency and ease of access of learning across the Group we offered two on-line leadership development courses in the areas of motivation and coaching. Participants from Aruba, Jamaica, Saint Lucia, Trinidad andTobago and Barbados attended the training via a private GEL on-line training room with the international provider.
With a view to equipping our Human Resources (“HR”) professionals across the Group with the skills to more effectively andstrategically support the business in attaining its goals, 25 HR managers, officers and co-ordinators participated in one weekof training in the areas of conflict resolution, negotiation skills as well as change management.
Performance Management
Performance Management continues to be a priority for the Group with the current system being used as the tool for two-way performance discussions between employees and managers, including identifying areas for improvement, future goal set-ting and developmental planning. Performance Appraisal training was conducted throughout the Group for bothManagement and staff during the course of the year.
HR Audit
An HR audit was completed at McBride (Caribbean) Limited in Barbados during 2016. The HR audits examine the organi-zational climate, as well as current HR practices and programmes. In addition, implementation plans are developed throughcollaboration with Group HR to address any gaps identified. Results are also communicated to the Management and staff ofthe company.
Industrial Relations (“IR”)
Our IR climate across the Group remained sound and relationships with workers’ representatives continued to be cordial.
Health & Safety
We tracked accidents and incidents across the Group on a monthly basis with a view to understanding the health and safetylandscape, and developing a Safety Culture which will mean a more proactive approach to incident prevention.
30ANNUAL REPORT 20
16
CORPORATE SOCIAL RESPONSIBILITY
Charity, Youth and Sports, Community Development, Education and Culture – these are the five areas on which GEL’sCorporate Social Responsibility programme remains focused.It is these five areas where there is a perceived need in ourmany communities and we continue to assist where possible.
Following are some of the charitable donations and sponsor-ships that have been undertaken in the past year:
CHARITY
GCG Saint Lucia reaches out to fire and flood victimsGCG (St. Lucia) Ltd gave some much needed assistance tofamilies who were displaced by a fire that razed their homesin the town of Soufriere. The company donated 50 cases ofwater to affected families.
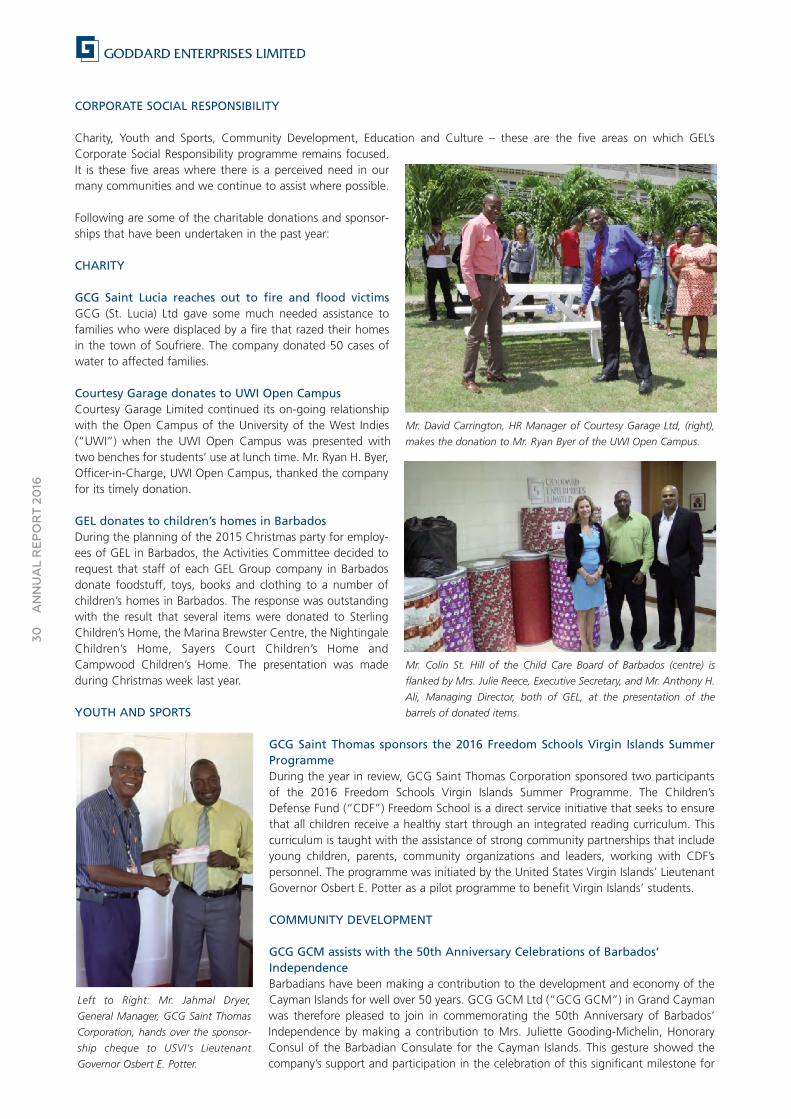
Courtesy Garage donates to UWI Open Campus Courtesy Garage Limited continued its on-going relationshipwith the Open Campus of the University of the West Indies(“UWI”) when the UWI Open Campus was presented withtwo benches for students’ use at lunch time. Mr. Ryan H. Byer,Officer-in-Charge, UWI Open Campus, thanked the companyfor its timely donation.
GEL donates to children’s homes in BarbadosDuring the planning of the 2015 Christmas party for employ-ees of GEL in Barbados, the Activities Committee decided torequest that staff of each GEL Group company in Barbadosdonate foodstuff, toys, books and clothing to a number ofchildren’s homes in Barbados. The response was outstandingwith the result that several items were donated to SterlingChildren’s Home, the Marina Brewster Centre, the NightingaleChildren’s Home, Sayers Court Children’s Home andCampwood Children’s Home. The presentation was madeduring Christmas week last year.
YOUTH AND SPORTS
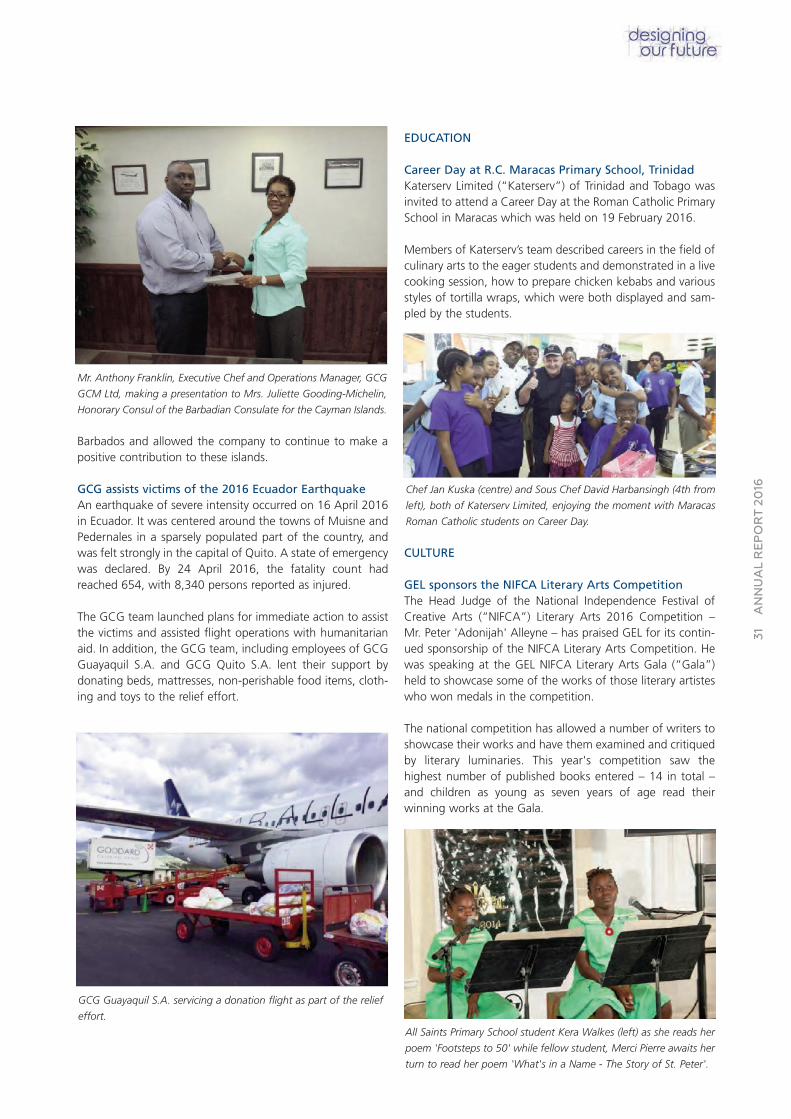
GCG Saint Thomas sponsors the 2016 Freedom Schools Virgin Islands SummerProgrammeDuring the year in review, GCG Saint Thomas Corporation sponsored two participantsof the 2016 Freedom Schools Virgin Islands Summer Programme. The Children’sDefense Fund (“CDF”) Freedom School is a direct service initiative that seeks to ensurethat all children receive a healthy start through an integrated reading curriculum. Thiscurriculum is taught with the assistance of strong community partnerships that includeyoung children, parents, community organizations and leaders, working with CDF’s personnel. The programme was initiated by the United States Virgin Islands’ LieutenantGovernor Osbert E. Potter as a pilot programme to benefit Virgin Islands’ students.
COMMUNITY DEVELOPMENT
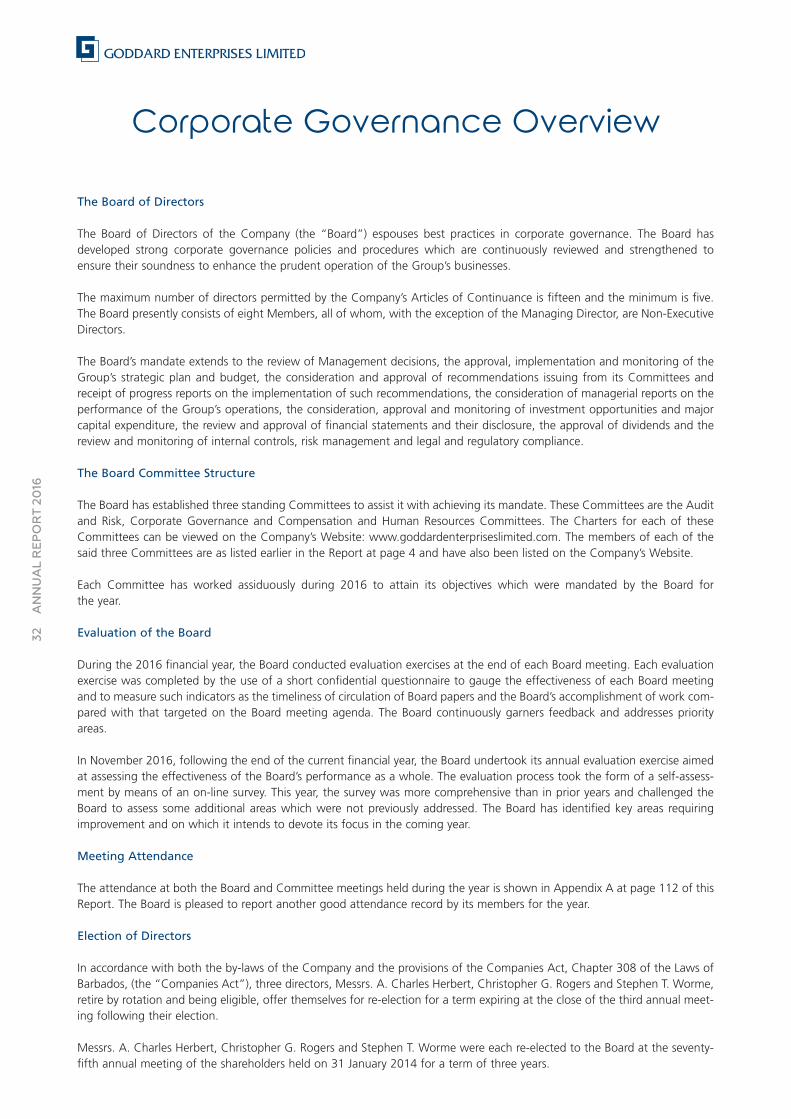
GCG GCM assists with the 50th Anniversary Celebrations of Barbados’IndependenceBarbadians have been making a contribution to the development and economy of theCayman Islands for well over 50 years. GCG GCM Ltd (“GCG GCM”) in Grand Caymanwas therefore pleased to join in commemorating the 50th Anniversary of Barbados’Independence by making a contribution to Mrs. Juliette Gooding-Michelin, HonoraryConsul of the Barbadian Consulate for the Cayman Islands. This gesture showed thecompany’s support and participation in the celebration of this significant milestone for
Mr. David Carrington, HR Manager of Courtesy Garage Ltd, (right),
makes the donation to Mr. Ryan Byer of the UWI Open Campus.
Mr. Colin St. Hill of the Child Care Board of Barbados (centre) is
flanked by Mrs. Julie Reece, Executive Secretary, and Mr. Anthony H.
Ali, Managing Director, both of GEL, at the presentation of the
barrels of donated items.
Left to Right: Mr. Jahmal Dryer,
General Manager, GCG Saint Thomas
Corporation, hands over the sponsor-
ship cheque to USVI’s Lieutenant
Governor Osbert E. Potter.
31ANNUAL REPORT 20
16
Barbados and allowed the company to continue to make apositive contribution to these islands.
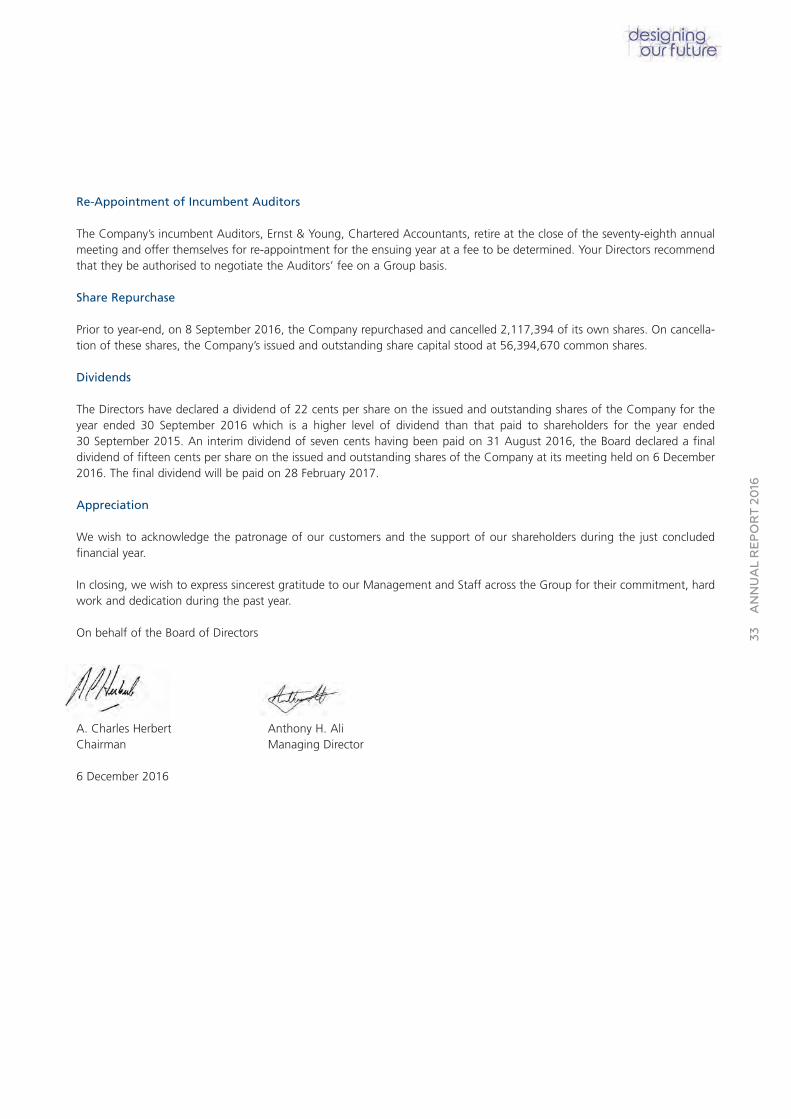
GCG assists victims of the 2016 Ecuador EarthquakeAn earthquake of severe intensity occurred on 16 April 2016in Ecuador. It was centered around the towns of Muisne andPedernales in a sparsely populated part of the country, andwas felt strongly in the capital of Quito. A state of emergencywas declared. By 24 April 2016, the fatality count hadreached 654, with 8,340 persons reported as injured.
The GCG team launched plans for immediate action to assistthe victims and assisted flight operations with humanitarianaid. In addition, the GCG team, including employees of GCGGuayaquil S.A. and GCG Quito S.A. lent their support bydonating beds, mattresses, non-perishable food items, cloth-ing and toys to the relief effort.
EDUCATION
Career Day at R.C. Maracas Primary School, TrinidadKaterserv Limited (“Katerserv”) of Trinidad and Tobago wasinvited to attend a Career Day at the Roman Catholic PrimarySchool in Maracas which was held on 19 February 2016.
Members of Katerserv’s team described careers in the field ofculinary arts to the eager students and demonstrated in a livecooking session, how to prepare chicken kebabs and variousstyles of tortilla wraps, which were both displayed and sam-pled by the students.
CULTURE
GEL sponsors the NIFCA Literary Arts CompetitionThe Head Judge of the National Independence Festival ofCreative Arts (“NIFCA”) Literary Arts 2016 Competition –Mr. Peter 'Adonijah' Alleyne – has praised GEL for its contin-ued sponsorship of the NIFCA Literary Arts Competition. Hewas speaking at the GEL NIFCA Literary Arts Gala (“Gala”)held to showcase some of the works of those literary artisteswho won medals in the competition.
The national competition has allowed a number of writers toshowcase their works and have them examined and critiquedby literary luminaries. This year's competition saw the highest number of published books entered – 14 in total –and children as young as seven years of age read their winning works at the Gala.
Mr. Anthony Franklin, Executive Chef and Operations Manager, GCG
GCM Ltd, making a presentation to Mrs. Juliette Gooding-Michelin,
Honorary Consul of the Barbadian Consulate for the Cayman Islands.
GCG Guayaquil S.A. servicing a donation flight as part of the relief
effort.
Chef Jan Kuska (centre) and Sous Chef David Harbansingh (4th from
left), both of Katerserv Limited, enjoying the moment with Maracas
Roman Catholic students on Career Day.
All Saints Primary School student Kera Walkes (left) as she reads her
poem 'Footsteps to 50' while fellow student, Merci Pierre awaits her
turn to read her poem 'What's in a Name - The Story of St. Peter'.
Corporate Governance Overview
32ANNUAL REPORT 20
16
The Board of Directors
The Board of Directors of the Company (the “Board”) espouses best practices in corporate governance. The Board has developed strong corporate governance policies and procedures which are continuously reviewed and strengthened to ensure their soundness to enhance the prudent operation of the Group’s businesses.
The maximum number of directors permitted by the Company’s Articles of Continuance is fifteen and the minimum is five.The Board presently consists of eight Members, all of whom, with the exception of the Managing Director, are Non-ExecutiveDirectors.
The Board’s mandate extends to the review of Management decisions, the approval, implementation and monitoring of theGroup’s strategic plan and budget, the consideration and approval of recommendations issuing from its Committees andreceipt of progress reports on the implementation of such recommendations, the consideration of managerial reports on theperformance of the Group’s operations, the consideration, approval and monitoring of investment opportunities and majorcapital expenditure, the review and approval of financial statements and their disclosure, the approval of dividends and thereview and monitoring of internal controls, risk management and legal and regulatory compliance.
The Board Committee Structure
The Board has established three standing Committees to assist it with achieving its mandate. These Committees are the Auditand Risk, Corporate Governance and Compensation and Human Resources Committees. The Charters for each of theseCommittees can be viewed on the Company’s Website: www.goddardenterpriseslimited.com. The members of each of thesaid three Committees are as listed earlier in the Report at page 4 and have also been listed on the Company’s Website.
Each Committee has worked assiduously during 2016 to attain its objectives which were mandated by the Board for the year.
Evaluation of the Board
During the 2016 financial year, the Board conducted evaluation exercises at the end of each Board meeting. Each evaluationexercise was completed by the use of a short confidential questionnaire to gauge the effectiveness of each Board meetingand to measure such indicators as the timeliness of circulation of Board papers and the Board’s accomplishment of work com-pared with that targeted on the Board meeting agenda. The Board continuously garners feedback and addresses priorityareas.
In November 2016, following the end of the current financial year, the Board undertook its annual evaluation exercise aimedat assessing the effectiveness of the Board’s performance as a whole. The evaluation process took the form of a self-assess-ment by means of an on-line survey. This year, the survey was more comprehensive than in prior years and challenged theBoard to assess some additional areas which were not previously addressed. The Board has identified key areas requiringimprovement and on which it intends to devote its focus in the coming year.
Meeting Attendance
The attendance at both the Board and Committee meetings held during the year is shown in Appendix A at page 112 of thisReport. The Board is pleased to report another good attendance record by its members for the year.
Election of Directors
In accordance with both the by-laws of the Company and the provisions of the Companies Act, Chapter 308 of the Laws ofBarbados, (the “Companies Act”), three directors, Messrs. A. Charles Herbert, Christopher G. Rogers and Stephen T. Worme,retire by rotation and being eligible, offer themselves for re-election for a term expiring at the close of the third annual meet-ing following their election.
Messrs. A. Charles Herbert, Christopher G. Rogers and Stephen T. Worme were each re-elected to the Board at the seventy-fifth annual meeting of the shareholders held on 31 January 2014 for a term of three years.
Re-Appointment of Incumbent Auditors
The Company’s incumbent Auditors, Ernst & Young, Chartered Accountants, retire at the close of the seventy-eighth annualmeeting and offer themselves for re-appointment for the ensuing year at a fee to be determined. Your Directors recommendthat they be authorised to negotiate the Auditors’ fee on a Group basis.
Share Repurchase
Prior to year-end, on 8 September 2016, the Company repurchased and cancelled 2,117,394 of its own shares. On cancella-tion of these shares, the Company’s issued and outstanding share capital stood at 56,394,670 common shares.
Dividends
The Directors have declared a dividend of 22 cents per share on the issued and outstanding shares of the Company for theyear ended 30 September 2016 which is a higher level of dividend than that paid to shareholders for the year ended 30 September 2015. An interim dividend of seven cents having been paid on 31 August 2016, the Board declared a final dividend of fifteen cents per share on the issued and outstanding shares of the Company at its meeting held on 6 December2016. The final dividend will be paid on 28 February 2017.
Appreciation
We wish to acknowledge the patronage of our customers and the support of our shareholders during the just concludedfinancial year.
In closing, we wish to express sincerest gratitude to our Management and Staff across the Group for their commitment, hardwork and dedication during the past year.
On behalf of the Board of Directors
A. Charles Herbert Anthony H. AliChairman Managing Director
6 December 2016
33ANNUAL REPORT 20
16

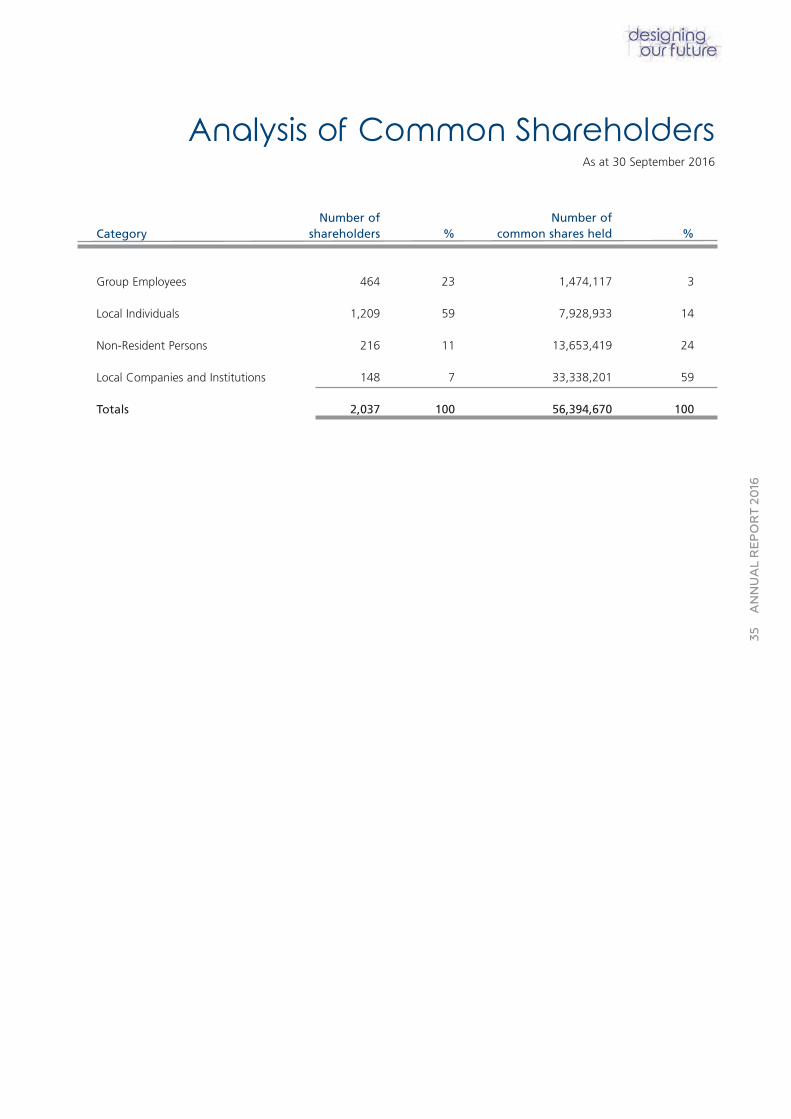
Analysis of Common ShareholdersAs at 30 September 2016
Number of Number ofCategory shareholders % common shares held %
Group Employees 464 23 1,474,117 3
Local Individuals 1,209 59 7,928,933 14
Non-Resident Persons 216 11 13,653,419 24
Local Companies and Institutions 148 7 33,338,201 59
Totals 2,037 100 56,394,670 100
35ANNUAL REPORT 20
16
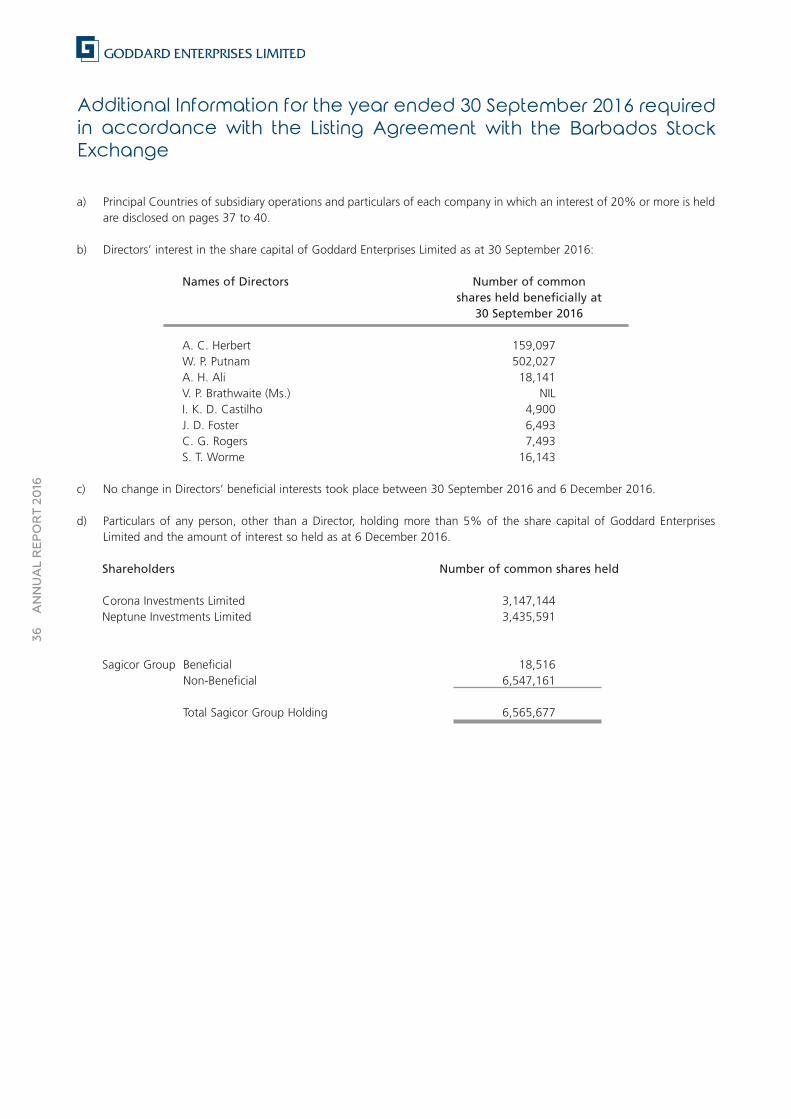
Additional Information for the year ended 30 September 2016 requiredin accordance with the Listing Agreement with the Barbados StockExchange
36ANNUAL REPORT 20
16
a) Principal Countries of subsidiary operations and particulars of each company in which an interest of 20% or more is heldare disclosed on pages 37 to 40.
b) Directors’ interest in the share capital of Goddard Enterprises Limited as at 30 September 2016:
Names of Directors Number of commonshares held beneficially at
30 September 2016
A. C. Herbert 159,097W. P. Putnam 502,027A. H. Ali 18,141V. P. Brathwaite (Ms.) NILI. K. D. Castilho 4,900J. D. Foster 6,493C. G. Rogers 7,493S. T. Worme 16,143
c) No change in Directors’ beneficial interests took place between 30 September 2016 and 6 December 2016.
d) Particulars of any person, other than a Director, holding more than 5% of the share capital of Goddard EnterprisesLimited and the amount of interest so held as at 6 December 2016.
Shareholders Number of common shares held
Corona Investments Limited 3,147,144Neptune Investments Limited 3,435,591
Sagicor Group Beneficial 18,516Non-Beneficial 6,547,161
Total Sagicor Group Holding 6,565,677
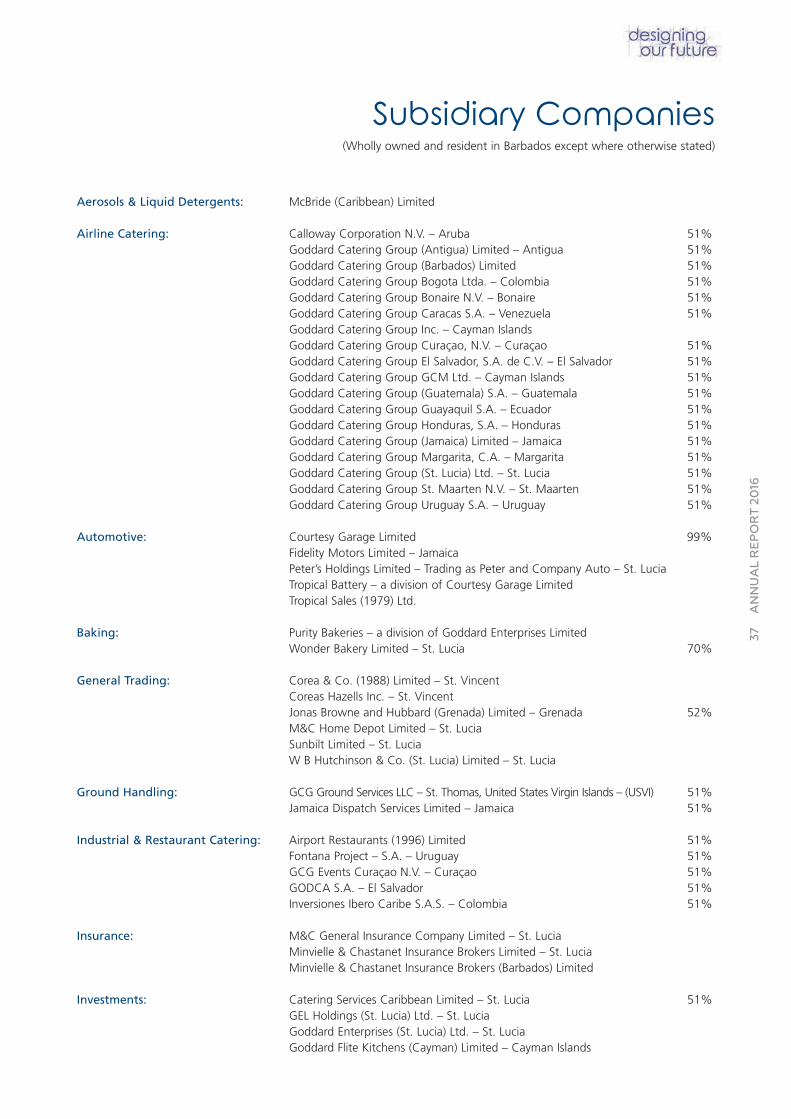
Subsidiary Companies(Wholly owned and resident in Barbados except where otherwise stated)
37ANNUAL REPORT 20
16
Aerosols & Liquid Detergents: McBride (Caribbean) Limited
Airline Catering: Calloway Corporation N.V. – Aruba 51%Goddard Catering Group (Antigua) Limited – Antigua 51%Goddard Catering Group (Barbados) Limited 51%Goddard Catering Group Bogota Ltda. – Colombia 51%Goddard Catering Group Bonaire N.V. – Bonaire 51%Goddard Catering Group Caracas S.A. – Venezuela 51%Goddard Catering Group Inc. – Cayman IslandsGoddard Catering Group Curaçao, N.V. – Curaçao 51%Goddard Catering Group El Salvador, S.A. de C.V. – El Salvador 51%Goddard Catering Group GCM Ltd. – Cayman Islands 51%Goddard Catering Group (Guatemala) S.A. – Guatemala 51%Goddard Catering Group Guayaquil S.A. – Ecuador 51%Goddard Catering Group Honduras, S.A. – Honduras 51%Goddard Catering Group (Jamaica) Limited – Jamaica 51%Goddard Catering Group Margarita, C.A. – Margarita 51%Goddard Catering Group (St. Lucia) Ltd. – St. Lucia 51%Goddard Catering Group St. Maarten N.V. – St. Maarten 51%Goddard Catering Group Uruguay S.A. – Uruguay 51%
Automotive: Courtesy Garage Limited 99%Fidelity Motors Limited – Jamaica Peter’s Holdings Limited – Trading as Peter and Company Auto – St. LuciaTropical Battery – a division of Courtesy Garage Limited Tropical Sales (1979) Ltd.
Baking: Purity Bakeries – a division of Goddard Enterprises Limited Wonder Bakery Limited – St. Lucia 70%
General Trading: Corea & Co. (1988) Limited – St. Vincent Coreas Hazells Inc. – St. Vincent Jonas Browne and Hubbard (Grenada) Limited – Grenada 52%M&C Home Depot Limited – St. LuciaSunbilt Limited – St. LuciaW B Hutchinson & Co. (St. Lucia) Limited – St. Lucia
Ground Handling: GCG Ground Services LLC – St. Thomas, United States Virgin Islands – (USVI) 51%Jamaica Dispatch Services Limited – Jamaica 51%
Industrial & Restaurant Catering: Airport Restaurants (1996) Limited 51%Fontana Project – S.A. – Uruguay 51%GCG Events Curaçao N.V. – Curaçao 51%GODCA S.A. – El Salvador 51%Inversiones Ibero Caribe S.A.S. – Colombia 51%
Insurance: M&C General Insurance Company Limited – St. LuciaMinvielle & Chastanet Insurance Brokers Limited – St. LuciaMinvielle & Chastanet Insurance Brokers (Barbados) Limited
Investments: Catering Services Caribbean Limited – St. Lucia 51%GEL Holdings (St. Lucia) Ltd. – St. LuciaGoddard Enterprises (St. Lucia) Ltd. – St. Lucia Goddard Flite Kitchens (Cayman) Limited – Cayman Islands
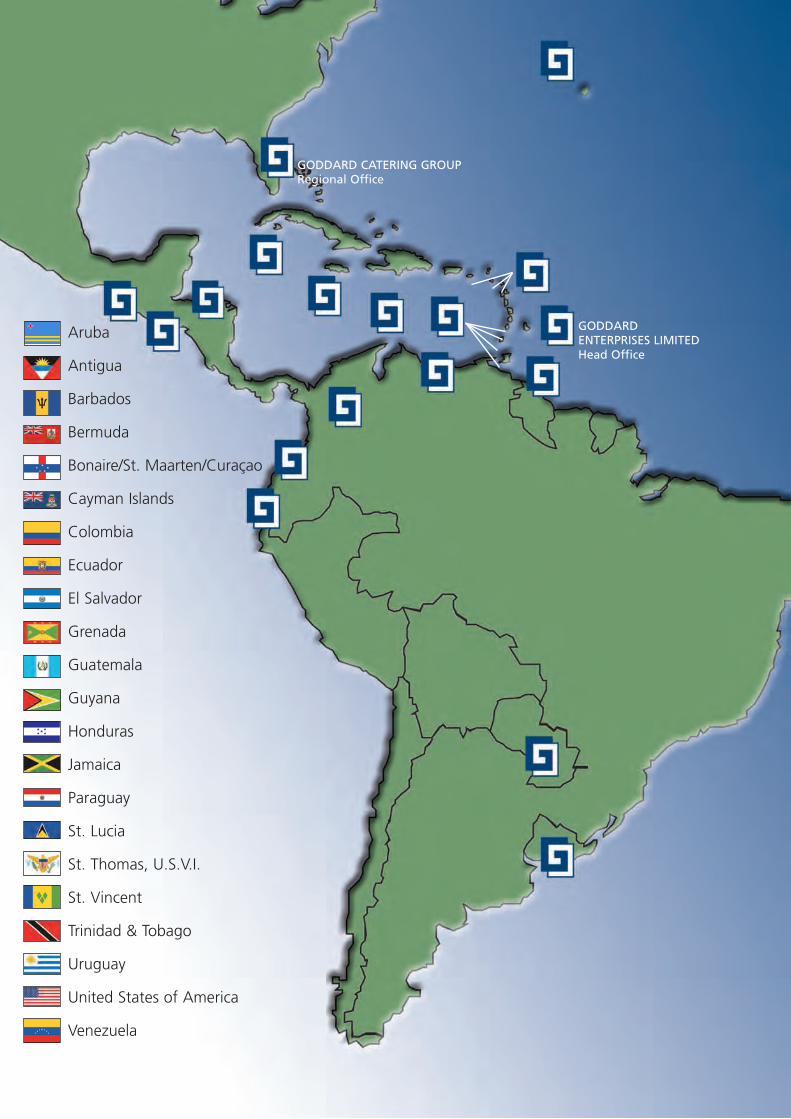
Aruba
Antigua
Barbados
Bermuda
Bonaire/St. Maarten/Curaçao
Cayman Islands
Colombia
Ecuador
El Salvador
Grenada
Guatemala
Guyana
Honduras
Jamaica
Paraguay
St. Lucia
St. Thomas, U.S.V.I.
St. Vincent
Trinidad & Tobago
Uruguay
United States of America
Venezuela
GODDARDENTERPRISES LIMITEDHead Office
GODDARD CATERING GROUPRegional Office
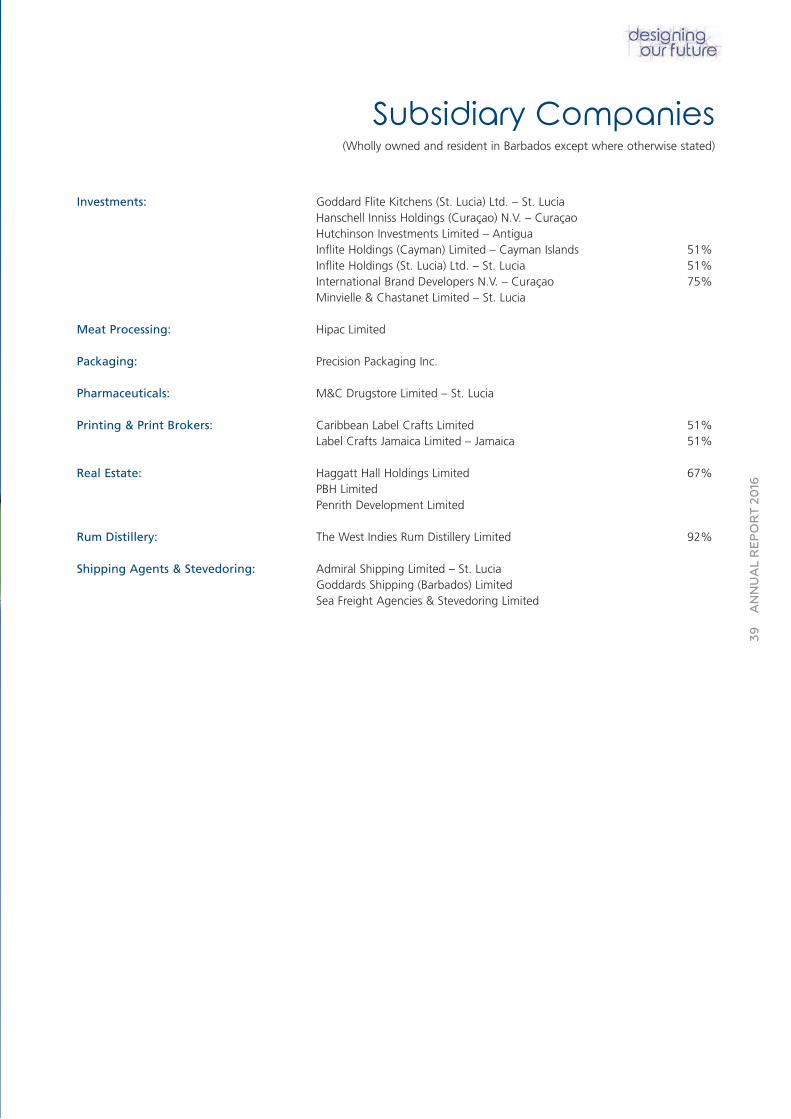
Subsidiary Companies(Wholly owned and resident in Barbados except where otherwise stated)
39ANNUAL REPORT 20
16
Investments: Goddard Flite Kitchens (St. Lucia) Ltd. – St. Lucia Hanschell Inniss Holdings (Curaçao) N.V. – Curaçao Hutchinson Investments Limited – Antigua Inflite Holdings (Cayman) Limited – Cayman Islands 51%Inflite Holdings (St. Lucia) Ltd. – St. Lucia 51%International Brand Developers N.V. – Curaçao 75%Minvielle & Chastanet Limited – St. Lucia
Meat Processing: Hipac Limited
Packaging: Precision Packaging Inc.
Pharmaceuticals: M&C Drugstore Limited – St. Lucia
Printing & Print Brokers: Caribbean Label Crafts Limited 51%Label Crafts Jamaica Limited – Jamaica 51%
Real Estate: Haggatt Hall Holdings Limited 67%PBH Limited Penrith Development Limited
Rum Distillery: The West Indies Rum Distillery Limited 92%
Shipping Agents & Stevedoring: Admiral Shipping Limited – St. LuciaGoddards Shipping (Barbados) LimitedSea Freight Agencies & Stevedoring Limited
40
ANNUAL REPORT 20
16
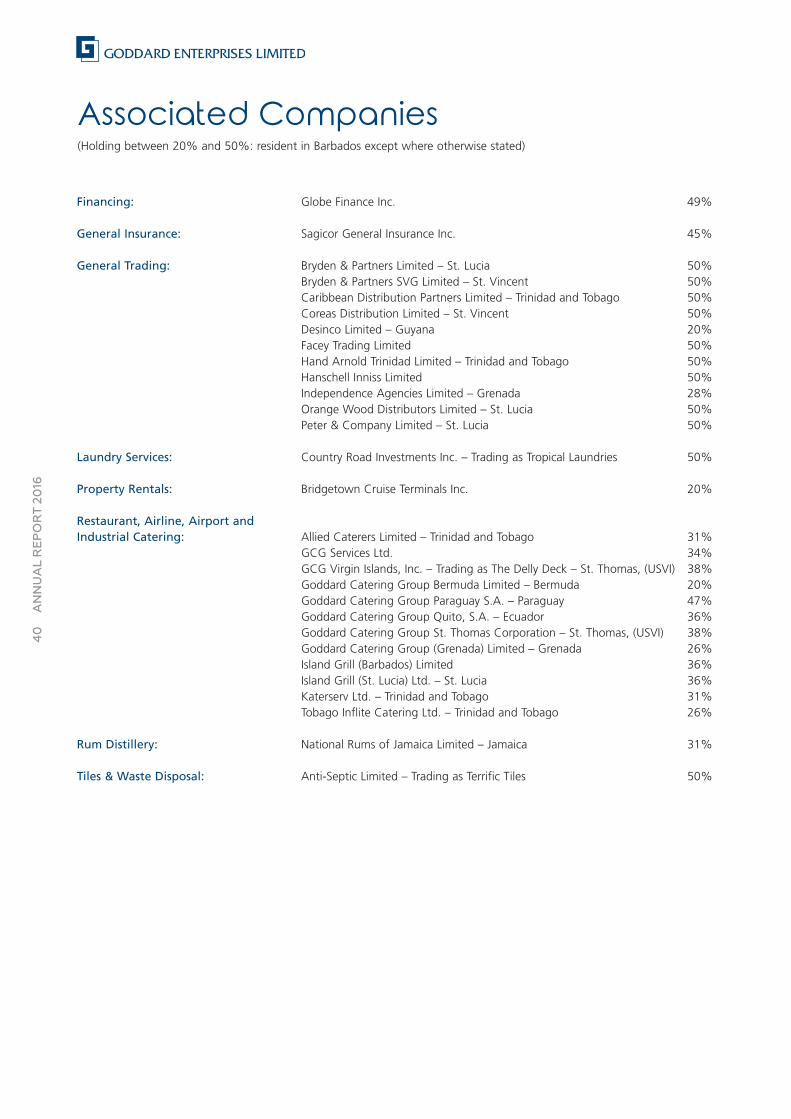
Financing: Globe Finance Inc. 49%
General Insurance: Sagicor General Insurance Inc. 45%
General Trading: Bryden & Partners Limited – St. Lucia 50%Bryden & Partners SVG Limited – St. Vincent 50%Caribbean Distribution Partners Limited – Trinidad and Tobago 50%Coreas Distribution Limited – St. Vincent 50%Desinco Limited – Guyana 20%Facey Trading Limited 50%Hand Arnold Trinidad Limited – Trinidad and Tobago 50%Hanschell Inniss Limited 50%Independence Agencies Limited – Grenada 28%Orange Wood Distributors Limited – St. Lucia 50%Peter & Company Limited – St. Lucia 50%
Laundry Services: Country Road Investments Inc. – Trading as Tropical Laundries 50%
Property Rentals: Bridgetown Cruise Terminals Inc. 20%
Restaurant, Airline, Airport and Industrial Catering: Allied Caterers Limited – Trinidad and Tobago 31%
GCG Services Ltd. 34%GCG Virgin Islands, Inc. – Trading as The Delly Deck – St. Thomas, (USVI) 38%Goddard Catering Group Bermuda Limited – Bermuda 20%Goddard Catering Group Paraguay S.A. – Paraguay 47%Goddard Catering Group Quito, S.A. – Ecuador 36%Goddard Catering Group St. Thomas Corporation – St. Thomas, (USVI) 38%Goddard Catering Group (Grenada) Limited – Grenada 26%Island Grill (Barbados) Limited 36%Island Grill (St. Lucia) Ltd. – St. Lucia 36%Katerserv Ltd. – Trinidad and Tobago 31%Tobago Inflite Catering Ltd. – Trinidad and Tobago 26%
Rum Distillery: National Rums of Jamaica Limited – Jamaica 31%
Tiles & Waste Disposal: Anti-Septic Limited – Trading as Terrific Tiles 50%
Associated Companies(Holding between 20% and 50%: resident in Barbados except where otherwise stated)
EXPANDING OUR UNIVERSE
ConsolidatedFinancial
Statements
42
ANNUAL REPORT 20
16
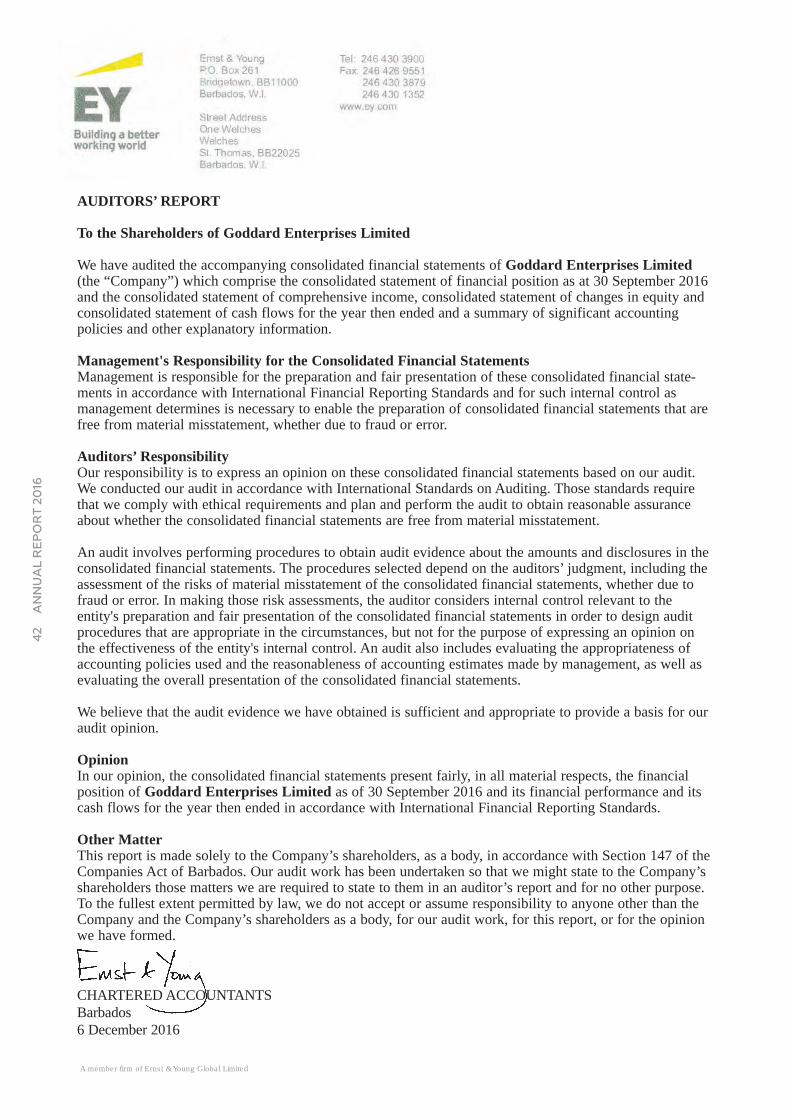
AUDITORS’ REPORT
To the Shareholders of Goddard Enterprises Limited
We have audited the accompanying consolidated financial statements of Goddard Enterprises Limited(the “Company”) which comprise the consolidated statement of financial position as at 30 September 2016and the consolidated statement of comprehensive income, consolidated statement of changes in equity andconsolidated statement of cash flows for the year then ended and a summary of significant accounting policies and other explanatory information.
Management's Responsibility for the Consolidated Financial StatementsManagement is responsible for the preparation and fair presentation of these consolidated financial state-ments in accordance with International Financial Reporting Standards and for such internal control as management determines is necessary to enable the preparation of consolidated financial statements that arefree from material misstatement, whether due to fraud or error.
Auditors’ ResponsibilityOur responsibility is to express an opinion on these consolidated financial statements based on our audit.We conducted our audit in accordance with International Standards on Auditing. Those standards requirethat we comply with ethical requirements and plan and perform the audit to obtain reasonable assuranceabout whether the consolidated financial statements are free from material misstatement.
An audit involves performing procedures to obtain audit evidence about the amounts and disclosures in theconsolidated financial statements. The procedures selected depend on the auditors’ judgment, including theassessment of the risks of material misstatement of the consolidated financial statements, whether due tofraud or error. In making those risk assessments, the auditor considers internal control relevant to the entity's preparation and fair presentation of the consolidated financial statements in order to design auditprocedures that are appropriate in the circumstances, but not for the purpose of expressing an opinion onthe effectiveness of the entity's internal control. An audit also includes evaluating the appropriateness ofaccounting policies used and the reasonableness of accounting estimates made by management, as well asevaluating the overall presentation of the consolidated financial statements.
We believe that the audit evidence we have obtained is sufficient and appropriate to provide a basis for ouraudit opinion.
OpinionIn our opinion, the consolidated financial statements present fairly, in all material respects, the financialposition of Goddard Enterprises Limited as of 30 September 2016 and its financial performance and itscash flows for the year then ended in accordance with International Financial Reporting Standards.
Other MatterThis report is made solely to the Company’s shareholders, as a body, in accordance with Section 147 of theCompanies Act of Barbados. Our audit work has been undertaken so that we might state to the Company’sshareholders those matters we are required to state to them in an auditor’s report and for no other purpose.To the fullest extent permitted by law, we do not accept or assume responsibility to anyone other than theCompany and the Company’s shareholders as a body, for our audit work, for this report, or for the opinionwe have formed.
CHARTERED ACCOUNTANTSBarbados6 December 2016
A member firm of Ernst & Young Global Limited
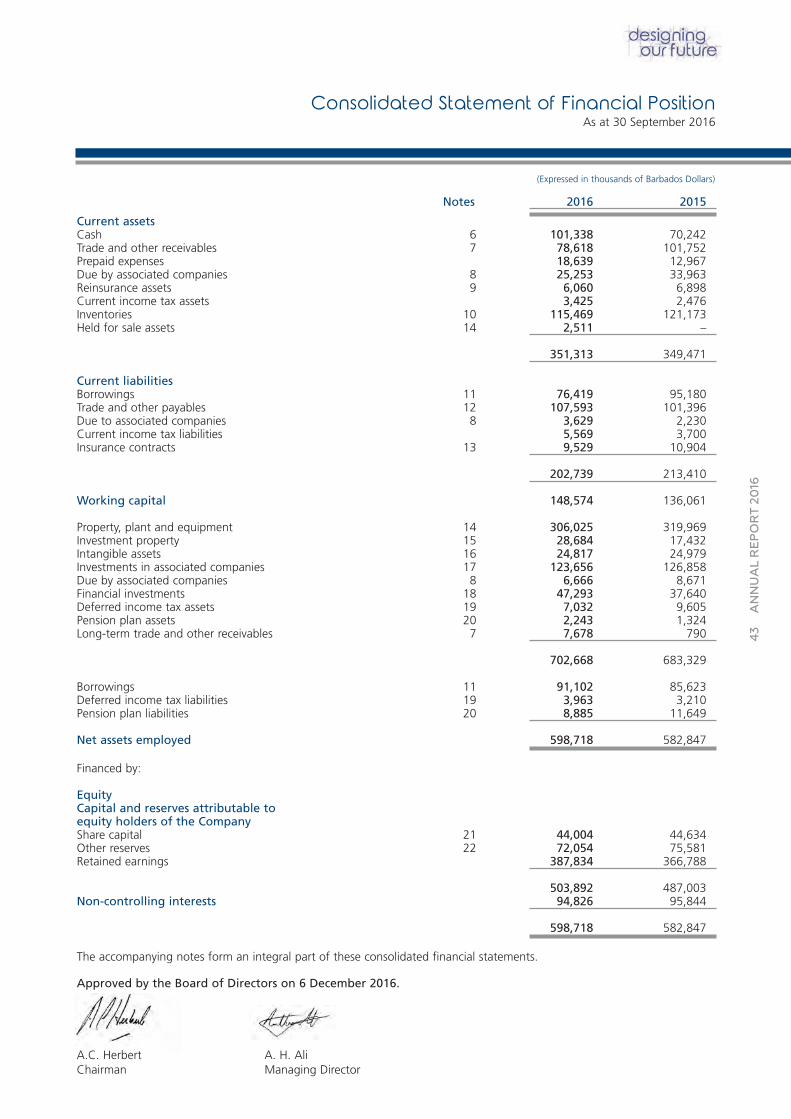
Notes 2016 2015
Current assetsCash 6 101,338 70,242Trade and other receivables 7 78,618 101,752Prepaid expenses 18,639 12,967Due by associated companies 8 25,253 33,963Reinsurance assets 9 6,060 6,898Current income tax assets 3,425 2,476Inventories 10 115,469 121,173Held for sale assets 14 2,511 –
351,313 349,471
Current liabilitiesBorrowings 11 76,419 95,180Trade and other payables 12 107,593 101,396Due to associated companies 8 3,629 2,230Current income tax liabilities 5,569 3,700Insurance contracts 13 9,529 10,904
202,739 213,410
Working capital 148,574 136,061
Property, plant and equipment 14 306,025 319,969Investment property 15 28,684 17,432Intangible assets 16 24,817 24,979Investments in associated companies 17 123,656 126,858Due by associated companies 8 6,666 8,671Financial investments 18 47,293 37,640Deferred income tax assets 19 7,032 9,605Pension plan assets 20 2,243 1,324Long-term trade and other receivables 7 7,678 790
702,668 683,329
Borrowings 11 91,102 85,623Deferred income tax liabilities 19 3,963 3,210Pension plan liabilities 20 8,885 11,649
Net assets employed 598,718 582,847
Financed by:
EquityCapital and reserves attributable toequity holders of the CompanyShare capital 21 44,004 44,634Other reserves 22 72,054 75,581Retained earnings 387,834 366,788
503,892 487,003Non-controlling interests 94,826 95,844
598,718 582,847
The accompanying notes form an integral part of these consolidated financial statements.
Approved by the Board of Directors on 6 December 2016.
A.C. Herbert A. H. AliChairman Managing Director
43
ANNUAL REPORT 20
16
Consolidated Statement of Financial PositionAs at 30 September 2016
(Expressed in thousands of Barbados Dollars)
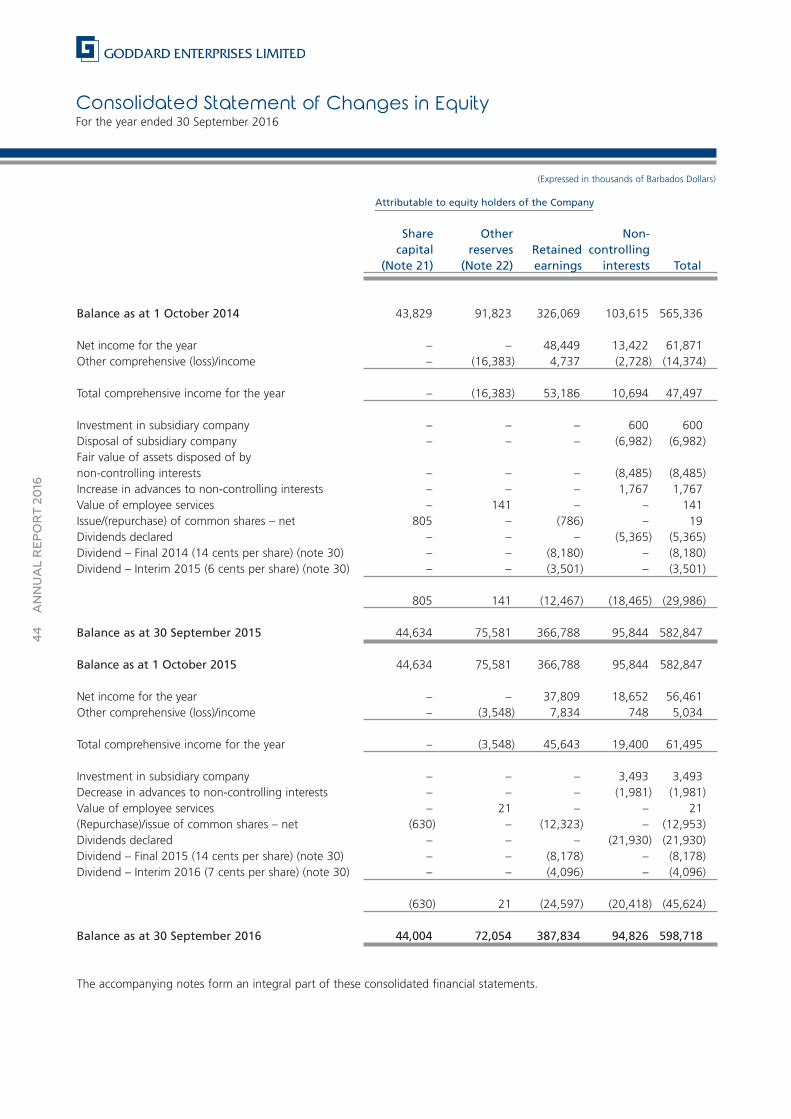
Consolidated Statement of Changes in EquityFor the year ended 30 September 2016
44
ANNUAL REPORT 20
16
Attributable to equity holders of the Company
Share Other Non-capital reserves Retained controlling
(Note 21) (Note 22) earnings interests Total
Balance as at 1 October 2014 43,829 91,823 326,069 103,615 565,336
Net income for the year – – 48,449 13,422 61,871Other comprehensive (loss)/income – (16,383) 4,737 (2,728) (14,374)
Total comprehensive income for the year – (16,383) 53,186 10,694 47,497
Investment in subsidiary company – – – 600 600Disposal of subsidiary company – – – (6,982) (6,982)Fair value of assets disposed of bynon-controlling interests – – – (8,485) (8,485)Increase in advances to non-controlling interests – – – 1,767 1,767Value of employee services – 141 – – 141Issue/(repurchase) of common shares – net 805 – (786) – 19Dividends declared – – – (5,365) (5,365)Dividend – Final 2014 (14 cents per share) (note 30) – – (8,180) – (8,180)Dividend – Interim 2015 (6 cents per share) (note 30) – – (3,501) – (3,501)
805 141 (12,467) (18,465) (29,986)
Balance as at 30 September 2015 44,634 75,581 366,788 95,844 582,847
Balance as at 1 October 2015 44,634 75,581 366,788 95,844 582,847
Net income for the year – – 37,809 18,652 56,461Other comprehensive (loss)/income – (3,548) 7,834 748 5,034
Total comprehensive income for the year – (3,548) 45,643 19,400 61,495
Investment in subsidiary company – – – 3,493 3,493Decrease in advances to non-controlling interests – – – (1,981) (1,981)Value of employee services – 21 – – 21(Repurchase)/issue of common shares – net (630) – (12,323) – (12,953)Dividends declared – – – (21,930) (21,930)Dividend – Final 2015 (14 cents per share) (note 30) – – (8,178) – (8,178)Dividend – Interim 2016 (7 cents per share) (note 30) – – (4,096) – (4,096)
(630) 21 (24,597) (20,418) (45,624)
Balance as at 30 September 2016 44,004 72,054 387,834 94,826 598,718
The accompanying notes form an integral part of these consolidated financial statements.
(Expressed in thousands of Barbados Dollars)
45
ANNUAL REPORT 20
16
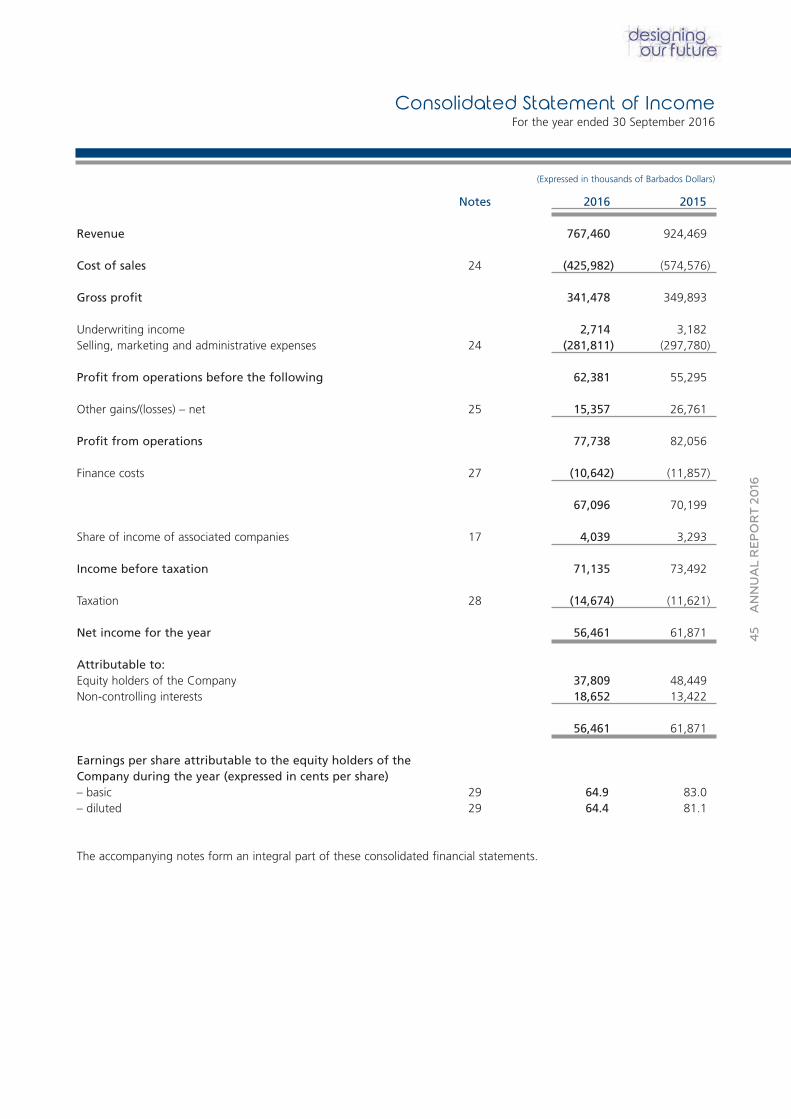
Notes 2016 2015
Revenue 767,460 924,469
Cost of sales 24 (425,982) (574,576)
Gross profit 341,478 349,893
Underwriting income 2,714 3,182Selling, marketing and administrative expenses 24 (281,811) (297,780)
Profit from operations before the following 62,381 55,295
Other gains/(losses) – net 25 15,357 26,761
Profit from operations 77,738 82,056
Finance costs 27 (10,642) (11,857)
67,096 70,199
Share of income of associated companies 17 4,039 3,293
Income before taxation 71,135 73,492
Taxation 28 (14,674) (11,621)
Net income for the year 56,461 61,871
Attributable to:Equity holders of the Company 37,809 48,449Non-controlling interests 18,652 13,422
56,461 61,871
Earnings per share attributable to the equity holders of theCompany during the year (expressed in cents per share)– basic 29 64.9 83.0– diluted 29 64.4 81.1
The accompanying notes form an integral part of these consolidated financial statements.
Consolidated Statement of IncomeFor the year ended 30 September 2016
(Expressed in thousands of Barbados Dollars)
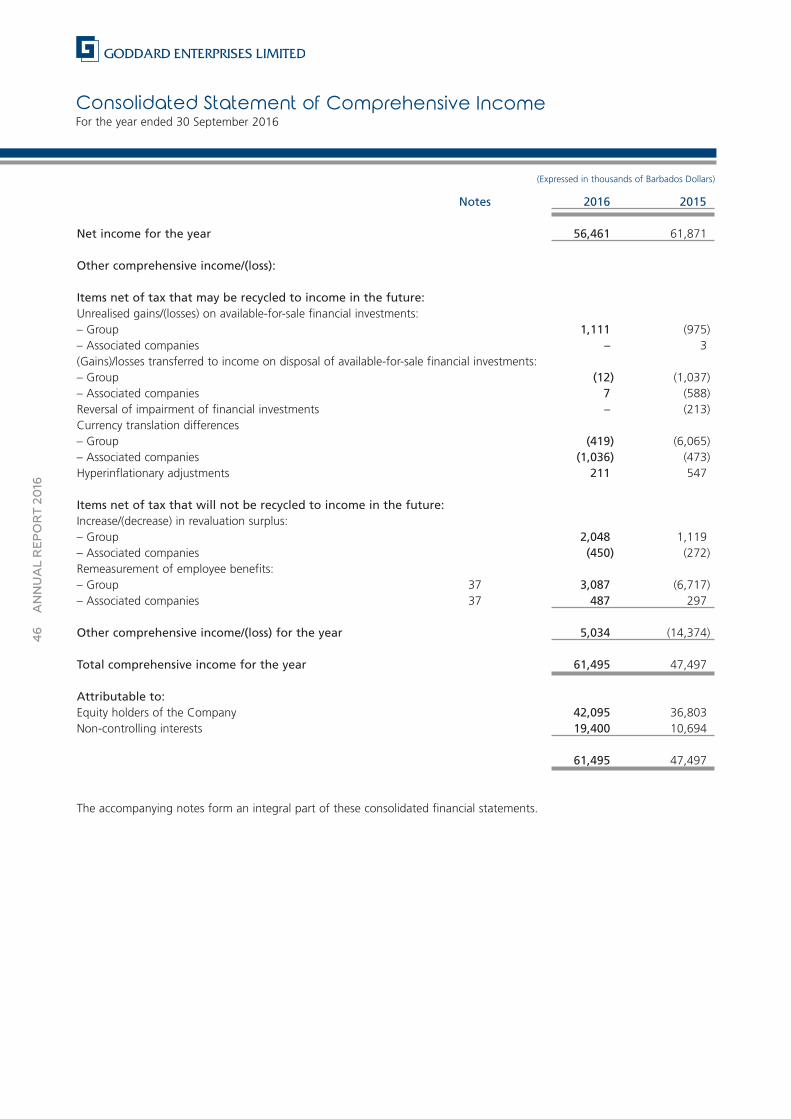
Consolidated Statement of Comprehensive IncomeFor the year ended 30 September 2016
46
ANNUAL REPORT 20
16
Notes 2016 2015
Net income for the year 56,461 61,871
Other comprehensive income/(loss):
Items net of tax that may be recycled to income in the future:Unrealised gains/(losses) on available-for-sale financial investments:– Group 1,111 (975)– Associated companies – 3(Gains)/losses transferred to income on disposal of available-for-sale financial investments:– Group (12) (1,037)– Associated companies 7 (588)Reversal of impairment of financial investments – (213)Currency translation differences– Group (419) (6,065)– Associated companies (1,036) (473)Hyperinflationary adjustments 211 547
Items net of tax that will not be recycled to income in the future:Increase/(decrease) in revaluation surplus:– Group 2,048 1,119– Associated companies (450) (272)Remeasurement of employee benefits:– Group 37 3,087 (6,717)– Associated companies 37 487 297
Other comprehensive income/(loss) for the year 5,034 (14,374)
Total comprehensive income for the year 61,495 47,497
Attributable to:Equity holders of the Company 42,095 36,803Non-controlling interests 19,400 10,694
61,495 47,497
The accompanying notes form an integral part of these consolidated financial statements.
(Expressed in thousands of Barbados Dollars)
47
ANNUAL REPORT 20
16
Notes 2016 2015
Cash flows from operating activitiesIncome before taxation 71,135 73,492Adjustments for:
Depreciation 14 23,124 23,297Amortisation of intangible assets 16 1,267 1,684Impairment of intangible assets 16, 25 206 3,892Reversal of impairment of financial investments 25 – (213)Loss/(gain) on disposal of property, plant and equipment 25 2,759 (65)Gain on disposal of financial investments 25 (7,231) (1,154)Exchange adjustments 40 (3,834)Gain on disposal of subsidiary companies 25 (53) (20,782)Hyperinflationary adjustments (389) 286Interest income 25 (2,411) (1,484)Finance costs incurred 10,642 11,857Share of income of associated companies 17 (4,039) (3,293)Pension plan expense 20 3,400 2,615Employee share schemes expenses 26 21 141Fair value gains on revaluation of investment property 15, 25 (137) (107)
Operating profit before working capital changes 98,334 86,332
Net change in non-cash working capital balances related to operations 35 33,623 (37,453)
Cash generated from operations 131,957 48,879Interest received 2,411 1,484Finance costs paid (10,642) (11,857)Income and corporation taxes paid (11,067) (9,456)Pension plan contributions paid 20 (3,526) (2,687)
Net cash from operating activities 109,133 26,363
Cash flows from investing activitiesAcquisition of interest in subsidiary companies (6,303) (8,091)Proceeds on transfer of GEL companies to CDP 17 – 23,284Investment in subsidiary by non-controlling interest 3,493 600Proceeds from reduction in stated capital of an associated company – 300Increase in investment in an associated company (317) –Proceeds from disposal of subsidiary companies 9,606 –Purchase of property, plant and equipment 14 (25,882) (23,374)Proceeds on disposal of property, plant and equipment 5,231 6,599Purchase of financial investments (14,749) (11,631)Proceeds on disposal of financial investments 13,419 14,780Loan made to an associated company – (8,671)Proceeds from repayment of loan to an associated company 2,005 –Long-term loans advanced (8,522) (32)Proceeds from repayment of long-term loans 1,220 969Unsecured and secured loans (made)/received (580) 272Dividends received from associated companies 17 6,564 4,767
Net cash used in investing activities (14,815) (228)
Cash flows from financing activitiesIssue of common shares 21 1,022 910Repurchase of common shares (13,975) (891)Long-term loans received 8,375 2,570Repayments of long-term loans (10,550) (10,087)Dividends paid to non-controlling interests (21,930) (5,365)Loans (repaid)/received to/from non-controlling interests (1,981) 1,767Dividends paid to shareholders (12,274) (11,681)
Net cash used in financing activities (51,313) (22,777)
Net increase in cash and cash equivalents 43,005 3,358
Cash and cash equivalents – beginning of year 53,840 50,482
Cash and cash equivalents – end of year 6 96,845 53,840
The accompanying notes form an integral part of these consolidated financial statements.
(Expressed in thousands of Barbados Dollars)
Consolidated Statement of Cash FlowsFor the year ended 30 September 2016
Notes to the Consolidated Financial Statements30 September 2016(Expressed in thousands of Barbados Dollars)
48
ANNUAL REPORT 20
16
Note
General Information . . . . . . . . . . . . . . . . . . . . . . . . . . . . . . . . . . . . . . . . . . . . . . . .1
Significant Accounting Policies . . . . . . . . . . . . . . . . . . . . . . . . . . . . . . . . . . . . . . .2
Risk Management . . . . . . . . . . . . . . . . . . . . . . . . . . . . . . . . . . . . . . . . . . . . . . . . . .3
Critical Accounting Estimates and Judgements . . . . . . . . . . . . . . . . . . . . . . . . .4
Segmental Reporting . . . . . . . . . . . . . . . . . . . . . . . . . . . . . . . . . . . . . . . . . . . . . . . .5
Cash and Cash Equivalents . . . . . . . . . . . . . . . . . . . . . . . . . . . . . . . . . . . . . . . . . .6
Trade and Other Receivables . . . . . . . . . . . . . . . . . . . . . . . . . . . . . . . . . . . . . . . .7
Due by/to Associated Companies . . . . . . . . . . . . . . . . . . . . . . . . . . . . . . . . . . . .8
Reinsurance Assets . . . . . . . . . . . . . . . . . . . . . . . . . . . . . . . . . . . . . . . . . . . . . . . . . .9
Inventories . . . . . . . . . . . . . . . . . . . . . . . . . . . . . . . . . . . . . . . . . . . . . . . . . . . . . . . .10
Borrowings . . . . . . . . . . . . . . . . . . . . . . . . . . . . . . . . . . . . . . . . . . . . . . . . . . . . . . . .11
Trade and Other Payables . . . . . . . . . . . . . . . . . . . . . . . . . . . . . . . . . . . . . . . . . .12
Insurance Contracts . . . . . . . . . . . . . . . . . . . . . . . . . . . . . . . . . . . . . . . . . . . . . . .13
Property, Plant and Equipment . . . . . . . . . . . . . . . . . . . . . . . . . . . . . . . . . . . . . .14
Investment Property . . . . . . . . . . . . . . . . . . . . . . . . . . . . . . . . . . . . . . . . . . . . . . . .15
Intangible Assets . . . . . . . . . . . . . . . . . . . . . . . . . . . . . . . . . . . . . . . . . . . . . . . . . . .16
Investments in Associated Companies . . . . . . . . . . . . . . . . . . . . . . . . . . . . . . . .17
Financial Investments . . . . . . . . . . . . . . . . . . . . . . . . . . . . . . . . . . . . . . . . . . . . . .18
Deferred Income Tax Assets/(Liabilities) . . . . . . . . . . . . . . . . . . . . . . . . . . . . . . .19
Pension Plans . . . . . . . . . . . . . . . . . . . . . . . . . . . . . . . . . . . . . . . . . . . . . . . . . . . . . .20
Share Capital . . . . . . . . . . . . . . . . . . . . . . . . . . . . . . . . . . . . . . . . . . . . . . . . . . . . .21
Other Reserves . . . . . . . . . . . . . . . . . . . . . . . . . . . . . . . . . . . . . . . . . . . . . . . . . . . .22
Share Option Plan . . . . . . . . . . . . . . . . . . . . . . . . . . . . . . . . . . . . . . . . . . . . . . . . .23
Expenses by Nature . . . . . . . . . . . . . . . . . . . . . . . . . . . . . . . . . . . . . . . . . . . . . . . .24
Other Gains/(Losses) – Net . . . . . . . . . . . . . . . . . . . . . . . . . . . . . . . . . . . . . . . . . .25
Employee Benefits Expense . . . . . . . . . . . . . . . . . . . . . . . . . . . . . . . . . . . . . . . . .26
Finance Costs . . . . . . . . . . . . . . . . . . . . . . . . . . . . . . . . . . . . . . . . . . . . . . . . . . . . .27
Taxation . . . . . . . . . . . . . . . . . . . . . . . . . . . . . . . . . . . . . . . . . . . . . . . . . . . . . . . . . .28
Earnings Per Share . . . . . . . . . . . . . . . . . . . . . . . . . . . . . . . . . . . . . . . . . . . . . . . . .29
Dividends Per Share . . . . . . . . . . . . . . . . . . . . . . . . . . . . . . . . . . . . . . . . . . . . . . . .30
Contingent Liabilities . . . . . . . . . . . . . . . . . . . . . . . . . . . . . . . . . . . . . . . . . . . . . . .31
Commitments . . . . . . . . . . . . . . . . . . . . . . . . . . . . . . . . . . . . . . . . . . . . . . . . . . . . .32
Business Combinations . . . . . . . . . . . . . . . . . . . . . . . . . . . . . . . . . . . . . . . . . . . . .33
Related Party Disclosures . . . . . . . . . . . . . . . . . . . . . . . . . . . . . . . . . . . . . . . . . . .34
Cash Flows . . . . . . . . . . . . . . . . . . . . . . . . . . . . . . . . . . . . . . . . . . . . . . . . . . . . . . .35
Material Partly Owned Subsidiaries . . . . . . . . . . . . . . . . . . . . . . . . . . . . . . . . . . .36
Income Tax Effects relating to Other Comprehensive Income/(Loss) . . . . . .37
Subsequent Event Disclosure . . . . . . . . . . . . . . . . . . . . . . . . . . . . . . . . . . . . . . . .38
index
Notes to the Consolidated Financial Statements30 September 2016
(Expressed in thousands of Barbados Dollars)
49
ANNUAL REPORT 20
16
1. General informationGoddard Enterprises Limited (“the Company”) is incorporated under the Laws of Barbados. The principal activities of theCompany and its subsidiaries (together “the Group”) include airline, industrial and restaurant catering, ground handlingservices, general trading, meat processing, printing and print brokers, baking, packaging, automobile and automotiveparts sales, insurance, real estate, shipping agents and stevedoring, manufacturing of aerosols and liquid detergents,investments, rum distilling, and island tours. Associated companies are involved in general trading, waste disposal, laundry services, financing, property rentals, investments and general insurance. (See pages 35-38.) The Group operatesthroughout the Caribbean and Central and South America.
The Company is a limited liability company domiciled in Barbados with its registered office located at the Top Floor, The Goddard Building, Haggatt Hall, St. Michael, BB11059, Barbados.
The Company is listed on the Barbados Stock Exchange.
These consolidated financial statements have been approved for issue by the Board of Directors on 6 December 2016.The Board of Directors has the power to amend these consolidated financial statements after issue, if required.
2. Significant accounting policiesThe principal accounting policies applied in the preparation of these consolidated financial statements are set out below.These policies have been consistently applied to all the years presented, unless otherwise stated.
a) Basis of preparationThe consolidated financial statements of Goddard Enterprises Limited have been prepared in accordance withInternational Financial Reporting Standards (“IFRS”), under the historical cost convention, as modified by the revalu-ation of land and buildings, investment property and financial investments (notes 2(e), 2(f) and 2(i)).
The preparation of consolidated financial statements in conformity with IFRS requires the use of certain criticalaccounting estimates. It also requires management to exercise its judgement in the process of applying the Group’s accounting policies. The areas involving a higher degree of judgement or complexity, or areas where assumptions and estimates are significant to the consolidated financial statements, are disclosed in note 4.
Standards, and amendments and interpretations to existing standards effective in the 2016 financial year
i) New accounting policies/improvements adoptedThe accounting policies adopted in the preparation of the consolidated financial statements are consistent withthose followed in the preparation of the Group’s annual financial statements for the year ended 30 September2015. There were no new interpretations or standards which became effective in the current year.
ii) Standards in issue not yet effectiveThe following is a list of standards and interpretations that are not yet effective up to the date of issuance of theGroup's financial statements. These standards and interpretations will be applicable to the Group at a future dateand will be adopted when they become effective. The Group is currently assessing the impact of adopting thesestandards and interpretations.
IAS 1 – Disclosure Initiative – Amendments to IAS 1 (effective 1 January 2016)The amendments to IAS 1 Presentation of Financial Statements clarify, rather than significantly change, existingIAS 1 requirements.
The amendments clarify the following:
• The materiality requirements in IAS 1• That specific line items in the statement of income and other comprehensive income (“OCI”) and the state-
ment of financial position may be disaggregated• That entities have flexibility as to the order in which they present the notes to financial statements• That the share of OCI of associates and joint ventures accounted for using the equity method must be
presented in aggregate as a single line item, and classified between those items that will or will not be subsequently reclassified to the statement of income.
Notes to the Consolidated Financial Statements30 September 2016(Expressed in thousands of Barbados Dollars)
50
ANNUAL REPORT 20
16
2. Significant accounting policies... continued
a) Basis of preparation... continued
ii) Standards in issue not yet effective... continued
IAS 1 – Disclosure Initiative – Amendments to IAS 1 (effective 1 January 2016)... continued
Furthermore, the amendments clarify the requirements that apply when additional subtotals are presented in thestatement of financial position and the statement of income and OCI.
IAS 16 and IAS 38 – Clarification of Acceptable Methods of Depreciation and Amortisation –Amendments to IAS 16 and IAS 38 (effective 1 January 2016)The amendments clarify the principle in IAS 16 Property, Plant and Equipment and IAS 38 Intangible Assets thatrevenue reflects a pattern of economic benefits that are generated from operating a business (of which the assetis part) rather than the economic benefits that are consumed through use of the asset. As a result, the ratio ofrevenue generated to total revenue expected to be generated cannot be used to depreciate property, plant andequipment and may only be used in very limited circumstances to amortise intangible assets.
IFRS 10, IFRS 12 and IAS 28 – Investment Entities: Applying the Consolidation Exception –Amendments to IFRS 10, IFRS 12 and IAS 28 (effective 1 January 2016)The amendments address issues that have arisen in applying the investment entities exception under IFRS 10.
The amendments to IFRS 10 clarify that the exemption (in IFRS 10.4) from presenting consolidated financial state-ments applies to a parent entity that is a subsidiary of an investment entity, when the investment entity measuresall of its subsidiaries at fair value.
Furthermore, the amendments to IFRS 10 clarify that only a subsidiary of an investment entity that is not an invest-ment entity itself and that provides support services to the investment entity is consolidated. All other subsidiariesof an investment entity are measured at fair value.
The amendments to IAS 28 allow the investor, when applying the equity method, to retain the fair value measurement applied by the investment entity associate or joint venture to its interests in subsidiaries.
IFRS 10 and IAS 28 Sale or Contribution of Assets between an Investor and its Associate or JointVenture – Amendments to IFRS 10 and IAS 28 (effective 1 January 2016)The amendments address the conflict between IFRS 10 and IAS 28 in dealing with the loss of control of a subsidiary that is sold or contributed to an associate or joint venture.
The amendments clarify that the gain or loss resulting from the sale or contribution of assets that constitute abusiness, as defined in IFRS 3 Business Combinations, between an investor and its associate or joint venture, isrecognised in full. Any gain or loss resulting from the sale or contribution of assets that do not constitute a busi-ness, however, is recognised only to the extent of unrelated investors’ interests in the associate or joint venture.
IFRS 11 – Accounting for Acquisitions of Interests in Joint Operations – Amendments to IFRS 11 (effective 1 January 2016)The amendments require an entity acquiring an interest in a joint operation in which the activity of the joint operation constitutes a business to apply, to the extent of its share, all of the principles in IFRS 3, and other IFRSs,that do not conflict with the requirements of IFRS 11. Furthermore, entities are required to disclose the informa-tion required in those IFRSs in relation to business combinations.
The amendments also apply to an entity on the formation of a joint operation if, and only if, an existing businessis contributed by the entity to the joint operation on its formation.
Furthermore, the amendments clarify that for the acquisition of an additional interest in a joint operation in whichthe activity of the joint operation constitutes a business, previously held interests in the joint operation must notbe remeasured if the joint operator retains joint control.
51
ANNUAL REPORT 20
16
2. Significant accounting policies... continued
a) Basis of preparation... continued
ii) Standards in issue not yet effective... continued
IAS 7 Disclosure Initiative – Amendments to IAS 7 (effective 1 January 2017)
The amendments to IAS 7 Statement of Cash Flows are part of the IASB’s Disclosure Initiative and require an entity to provide disclosures that enable users of financial statements to evaluate changes in liabilities arising fromfinancing activities, including both changes arising from cash flows and non-cash changes.
IAS 12 Recognition of Deferred Tax Assets for Unrealised Losses – Amendments to IAS 12 (effective 1 January 2017) The IASB issued the amendments to IAS 12 Income Taxes to clarify the accounting for deferred tax assets for unrealised losses on debt instruments measured at fair value.
The amendments clarify that an entity needs to consider whether tax law restricts the sources of taxable profitsagainst which it may make deductions on the reversal of that deductible temporary difference. Furthermore, theamendments provide guidance on how an entity should determine future taxable profits and explain the circum-stances in which taxable profit may include the recovery of some assets for more than their carrying amount.
IFRS 15 Revenue from Contracts with Customers (effective 1 January 2018) IFRS 15 replaces all existing revenue requirements in IFRS (IAS 11 Construction Contracts, IAS 18 Revenue, IFRIC13 Customer Loyalty Programmes, IFRIC 15 Agreements for the Construction of Real Estate, IFRIC 18 Transfers ofAssets from Customers and SIC 31 Revenue – Barter Transactions Involving Advertising Services) and applies to allrevenue arising from contracts with customers. It also provides a model for the recognition and measurement ofdisposal of certain non-financial assets including property, equipment and intangible assets.
The standard outlines the principles an entity must apply to measure and recognise revenue. The core principle isthat an entity will recognise revenue at an amount that reflects the consideration to which the entity expects tobe entitled in exchange for transferring goods or services to a customer.
The standard requires entities to exercise judgement, taking into consideration all of the relevant facts and circumstances when applying each step of the model to contracts with their customers.
The standard also specifies how to account for the incremental costs of obtaining a contract and the costs directly related to fulfilling a contract.
The standard will affect entities across all industries. Adoption will be a significant undertaking for most entitieswith potential changes to an entity’s current accounting, systems and processes.
IFRS 9 Financial Instruments (effective 1 January 2018) IFRS 9 as issued reflects the first phase of the IASB’s work on the replacement of IAS 39 and applies to classifica-tion and measurement of financial assets and liabilities as defined in IAS 39. In subsequent phases, the Board willaddress impairment and hedge accounting. The application of IFRS 9 may change the measurement and presen-tation of many financial instruments, depending on their contractual cash flows and business model under whichthey are held. The impairment requirements will generally result in earlier recognition of credit losses. The newhedging model may lead to more economic hedging strategies meeting the requirements for hedge accounting.
IFRS 2 Classification and Measurement of Share-based Payment Transactions – Amendments to IFRS 2(effective 1 January 2018)The IASB issued amendments to IFRS 2 Share-based Payment in relation to the classification and measurement ofshare-based payment transactions. The amendments address three main areas:
• The effects of vesting conditions on the measurement of a cash-settled share-based payment transaction• The classification of a share-based payment transaction with net settlement features for withholding tax obligations.
Notes to the Consolidated Financial Statements30 September 2016
(Expressed in thousands of Barbados Dollars)
Notes to the Consolidated Financial Statements30 September 2016(Expressed in thousands of Barbados Dollars)
52
ANNUAL REPORT 20
16
2. Significant accounting policies... continued
a) Basis of preparation... continued
ii) Standards in issue not yet effective... continued
IFRS 2 Classification and Measurement of Share-based Payment Transactions – Amendments to IFRS 2(effective 1 January 2018)... continued• The accounting where a modification to the terms and conditions of a share-based payment transactionchanges its classification from cash-settled to equity-settled.
IFRS 16 Leases (effective 1 January 2019) IFRS 16 requires lessees to account for all leases under a single on-balance sheet model in a similar way to financeleases under IAS 17. The standard includes two recognition exemptions for lessees – leases of ’low-value’ assets(e.g., personal computers) and short-term leases (i.e., leases with a lease term of 12 months or less). At the commencement date of a lease, a lessee will recognise a liability to make lease payments (i.e., the lease liability)and an asset representing the right to use the underlying asset during the lease term (i.e., the right-of-use asset).
Lessees will be required to separately recognise the interest expense on the lease liability and the depreciationexpense on the right-of-use asset.
Lessees will be required to remeasure the lease liability upon the occurrence of certain events (e.g., a change inthe lease term, a change in future lease payments resulting from a change in an index or rate used to determinethose payments). The lessee will generally recognise the amount of the remeasurement of the lease liability as anadjustment to the right-of-use asset.
Lessor accounting is substantially unchanged from today’s accounting under IAS 17. Lessors will continue to classify all leases using the same classification principle as in IAS 17 and distinguish between two types of leases:operating and finance leases.
iii) Improvements to International Financial Reporting StandardsThe annual improvements process of the International Accounting Standards Board deals with non-urgent but necessary clarifications and amendments to IFRS. The following amendments are applicable to annual periodsbeginning on or after 1 January 2016.
IFRS Subject of AmendmentIFRS 5 Non-current Assets Held for Sale and Discontinued Operations – Changes in methods of disposalIFRS 7 Financial Instruments: Disclosures – Servicing contractsIFRS 7 Financial Instruments: Disclosures – Applicability of the offsetting disclosures to condensed interim
financial statementsIAS 19 Employee Benefits – Discount rate: regional market issueIAS 34 Interim Financial Reporting – Disclosure of information 'elsewhere in the interim financial report'
b) Consolidation
i) SubsidiariesSubsidiaries are all entities over which the Group has control. The Group controls an entity when the Group isexposed to, or has rights to, variable returns from its involvement with the entity and has the ability to affectthose returns through its power over the entity. Subsidiaries are fully consolidated from the date on which control is transferred to the Group. They are de-consolidated from the date that control ceases.
The acquisition method of accounting is used to account for business combinations by the Group. The consider-ation transferred for the acquisition of the subsidiary is the fair values of the assets transferred, the liabilitiesincurred and the equity interests issued by the Group. The contingent consideration includes the fair value of anyasset or liability resulting from a contingent consideration arrangement. Acquisition related costs are expensed asincurred. Identifiable assets and contingent liabilities assumed in a business combination are measured initially attheir fair values at the acquisition date. On an acquisition-by-acquisition basis, the Group recognises any non-controlling interest in the acquiree either at fair value or at the non-controlling interest’s proportionate share ofthe acquiree’s net assets.
53
ANNUAL REPORT 20
16
2. Significant accounting policies... continued
b) Consolidation... continued
i) Subsidiaries... continuedThe excess of the consideration transferred, the amount of any non-controlling interest in the acquiree and theacquisition date fair value of any previous equity interest in the acquiree over the fair value of the Group’s shareof the identifiable net assets acquired is recorded as goodwill. If the total of consideration transferred, non-controlling interest recognised and previously held interest measured is less than the fair value of the net assetsof the subsidiary acquired in the case of a bargain purchase, the difference is recognised directly in the consoli-dated statement of income (note 2(g)).
Inter-company transactions, balances and unrealised gains on transactions between Group companies are eliminated. Unrealised losses are also eliminated but considered an impairment indicator of the asset transferred.Accounting policies of subsidiaries have been changed where necessary to ensure consistency with the policiesadopted by the Group.
ii) Transactions and non-controlling interests The Group treats transactions with non-controlling interests as transactions with equity owners of the Group. Forpurchases from non-controlling interests, the difference between any consideration paid and the relevant shareof the carrying value of net assets of the subsidiary acquired is recorded in equity. Gains or losses on disposals tonon-controlling interests are also recorded in equity.
iii) Associates Associates are all entities over which the Group has significant influence but not control, generally accompany-ing a shareholding of between 20% and 50% of the voting rights. Investments in associates are accounted forusing the equity method of accounting and are initially recognised at cost. The Group's investment in associatesincludes goodwill (net of any accumulated impairment losses) identified on acquisition (note 2(g)).
The Group’s share of its associates' post-acquisition profits or losses is recognised in the consolidated statementof income and its share of post-acquisition movements in reserves is recognised in other reserves. The cumulativepost-acquisition movements are adjusted against the carrying amount of the investment. When the Group's shareof losses in an associate equals or exceeds its interest in the associate, including any other unsecured receivables,the Group does not recognise further losses, unless it has incurred obligations or made payments on behalf ofthe associate.
c) Segment reporting Operating segments are reported in a manner consistent with the internal reporting provided to the chief operatingdecision-maker. The Board of Directors, which is responsible for allocating resources and assessing performance ofthe operating segments, has been identified as the chief operating decision-maker.
d) Foreign currency translation
i) Functional and presentation currencyItems included in the financial statements of each of the Group’s entities are measured using the currency of theprimary economic environment in which the entity operates (“the functional currency”). The consolidated financial statements are presented in Barbados dollars, which is the Company’s functional and presentation currency.
ii) Transactions and balancesForeign currency transactions are translated into the functional currency using the exchange rates prevailing atthe dates of the transactions. Foreign exchange gains and losses resulting from the settlement of such transac-tions and from the translation at year-end exchange rates of monetary assets and liabilities denominated in foreign currencies are recognised in the consolidated statement of income.
Translation differences on non-monetary financial assets such as equities classified as available-for-sale are included in the financial investments reserve in equity.
Goodwill and fair value adjustments arising on the acquisition of a foreign entity are treated as local currencyassets and liabilities of the foreign entity and are translated at the closing rate.
Notes to the Consolidated Financial Statements30 September 2016
(Expressed in thousands of Barbados Dollars)
Notes to the Consolidated Financial Statements30 September 2016(Expressed in thousands of Barbados Dollars)
54
ANNUAL REPORT 20
16
2. Significant accounting policies... continued
d) Foreign currency translation... continued
iii) Group companiesThe results and financial position of all the Group entities that have a functional currency different from the presentation currency are translated into the presentation currency as follows:
i) assets and liabilities for each statement of financial position presented are translated at the closing rate atthe date of that statement of financial position;
ii) income and expenses for each statement of income are translated at average exchange rates; and iii) all resulting exchange differences are recognised in translation reserve in equity.
iv) Hyperinflationary accountingThe financial statements of Group companies whose functional currency is the currency of a hyperinflationaryeconomy are adjusted for inflation in accordance with the procedure described in the following paragraph, priorto their translation into Barbados dollars. Once restated, all items of the financial statements are converted intoBarbados dollars using the closing exchange rate. Amounts shown for prior years for comparative purposes arenot modified.
To determine the existence of hyperinflation, the Group assesses the qualitative characteristics of the economicenvironment of the country, such as the trends in inflation rates over the previous three years. The financial state-ments of companies whose functional currency is the currency of a hyperinflationary economy are adjusted toreflect the changes in purchasing power of the local currency, such that all items in the statement of financial position not expressed in current terms (non-monetary items) are restated by applying a general price index at thefinancial statement closing date, and all items of income and expense, profit and loss are restated monthly byapplying appropriate adjustment factors. The difference between initial and adjusted amounts is included in othergains/(losses) – net in the consolidated statement of income. Accordingly, Venezuela was classified as a hyper-inflationary economy in 2016 and 2015. The inflation indices used to prepare the restated financial informationare those published by the Central Bank of Venezuela until September 2015. The index for 2015 was 141.53.During year 2016, the Central Bank of Venezuela has not published an official index. In this regard, the com-pany used the average index of 456.78, published in one of the most reputable economic studies of the country.
e) Property, plant and equipmentFreehold land and buildings comprise mainly manufacturing plants, retail and distribution outlets, warehouses andoffices. The Group’s freehold land and buildings, are stated at the most recent valuation less subsequent deprecia-tion for buildings. Valuations are performed every five years by independent professional valuers. Any accumulated depreciation at the date of revaluation is eliminated against the gross carrying amount of the asset, and the netamount is restated to the revalued amount of the asset. All other property, plant and equipment including leasehold buildings is stated at historical cost less depreciation. Historical cost includes expenditure that is directly attributableto the acquisition of the items.
Subsequent costs are included in the asset’s carrying amount or recognised as a separate asset, as appropriate, onlywhen it is probable that future economic benefits associated with the item will flow to the Group and the cost ofthe item can be measured reliably. All other repairs and maintenance are charged to the consolidated statement ofincome during the financial period in which they are incurred.
Increases in the carrying amount arising on revaluation of land and buildings are recognised in the consolidated statement of comprehensive income and accumulated in revaluation surplus in equity.
Decreases that offset previous increases of the same asset are recognised in the consolidated statement of compre-hensive income and reduce the revaluation surplus in equity; all other decreases are charged to the consolidated-statement of income.
Land is not depreciated. Depreciation on other assets is calculated using the straight-line method to allocate theircost or revalued amounts to their residual values over their estimated useful lives, as follows:
55
ANNUAL REPORT 20
16
2. Significant accounting policies... continued
e) Property, plant and equipment... continued
Freehold buildings – 50 yearsLeasehold buildings – 5 - 25 years based on the lease termFurniture, fittings and equipment – 3 - 20 yearsMachinery – 3 - 20 yearsVehicles – 5 years
The assets’ residual values and useful lives are reviewed, and adjusted if appropriate, at each consolidated statementof financial position date.
An asset’s carrying amount is written down immediately to its recoverable amount if the asset’s carrying amount isgreater than its estimated recoverable amount (note 2(h)).
Gains and losses on disposals are determined by comparing proceeds with the carrying amount. These are includedin the consolidated statement of income. When revalued assets are sold, the amounts included in revaluation surplusare realised and transferred to retained earnings.
Costs incurred which are directly attributable to capital projects are categorised as construction in progress and capitalised. If it is determined that capitalised costs are no longer justifiable, the related costs are written off andcharged to the consolidated statement of income.
Construction in progress is not depreciated until the asset has been completed and brought into operational activity.
f) Investment propertyInvestment property, principally comprising office buildings, is held for long-term rental yields and is not occupied bythe Group. Investment property is carried at fair value, determined annually. Valuations are performed annually byindependent professional real estate valuers. Changes in fair values are recorded in the consolidated statement ofincome.
g) Intangible assets
i) GoodwillGoodwill represents the excess of the cost of an acquisition over the fair value of the Group’s share of the netidentifiable assets of the acquiree at the date of acquisition. Goodwill on the acquisition of subsidiaries is included as ‘intangible assets’ on the consolidated statement of financial position. Goodwill on the acquisitionof associates is included in ‘investments in associates’. Separately recognised goodwill is tested annually for impair-ment and whenever there is an indication of impairment, and is carried at cost less accumulated impairment losses.Impairment losses on goodwill are not reversed. Gains and losses on the disposal of an entity include the carry-ing amount of goodwill relating to the entity sold.
Goodwill is allocated to cash-generating units for the purpose of impairment testing. The allocation is made to thecash-generating units that are expected to benefit from the business combination in which the goodwill arose.
ii) Other intangible assets Other intangible assets arising on acquisitions are recognised only if future economic benefits attributable to theasset will flow to the Group and if the fair value of the asset can be measured reliably. Such intangible assetsmust be separable from the business being acquired or must arise from contractual or legal rights. Intangibleassets acquired in a business combination are initially recognised at their fair value. Other intangible assets whichhave been acquired directly are recorded initially at cost. On acquisition the useful life of the asset is estimated.If the estimated useful life is finite, amortisation is calculated using the straight-line method to allocate the costover the estimated useful life as follows:
Notes to the Consolidated Financial Statements30 September 2016
(Expressed in thousands of Barbados Dollars)
Notes to the Consolidated Financial Statements30 September 2016(Expressed in thousands of Barbados Dollars)
56
ANNUAL REPORT 20
16
2. Significant accounting policies... continued
g) Intangible assets... continued
ii) Other intangible assets... continued
Trade names – 20 - 25 yearsCustomer relationships – 13 - 15 yearsSupplier relationships – 15 years
The amortisation charge is included in other gains/(losses) – net in the consolidated statement of income.
h) Impairment of non-financial assets Assets that have an indefinite useful life are not subject to amortisation and are tested annually for impairment.Assets that are subject to amortisation are reviewed for impairment whenever events or changes in circumstancesindicate that the carrying amount may not be recoverable. An impairment loss is recognised for the amount by whichthe asset’s carrying amount exceeds its recoverable amount. The recoverable amount is the higher of an asset’s fairvalue less costs to sell and value-in-use.
i) Financial assets The Group classifies its financial assets in the following categories:
i) Available-for-saleii) Loans and receivables
Management determines the classification of its financial assets at initial recognition. The classification depends onthe purpose for which the financial assets were acquired.
i) Available-for-saleThese financial assets are intended to be held for an indefinite period of time and hence are included in non-current assets unless management intends to dispose of the investment within 12 months of the consolidatedstatement of financial position date. They may be sold in response to needs for liquidity or changes in interest rates, exchange rates or equity prices. They are measured initially at cost and are subsequently remeasured at their fair value based on quoted bid prices. Investments without quoted prices are carried at management’s valuation based on the net assets of the entity net of any provisions made where there is an indication of impairment. Unrealised gains and losses are recorded in the consolidated statement of compre-hensive income. Either on the disposal of the asset or if the asset is determined to be impaired, the previouslyrecorded unrealised gain or loss is transferred to the consolidated statement of income.
ii) Loans and receivablesLoans and receivables are financial assets with fixed or determinable payments that are not quoted in an activemarket. These assets are carried at amortised cost less provision for impairment. The Group’s loans and receivablescomprise government bonds and fixed deposits, trade and other receivables and cash and cash equivalents in theconsolidated statement of financial position.
Purchases and sales of these investments are recognised on the trade date which is the date that the Group commitsto purchase or sell the asset. Cost of purchase includes transaction costs.
Financial assets are de-recognised when the rights to receive cash flows from the investments have expired or havebeen transferred and the Group has transferred substantially all risks and rewards of ownership.
Interest income arising on financial investments is accrued using the effective yield method and is included in othergains/(losses) – net in the consolidated statement of income. Dividends are recorded in other gains/(losses) – net whenthe right to receive payment is established.
57
ANNUAL REPORT 20
16
2. Significant accounting policies... continued
i) Financial assets... continued A financial asset is considered impaired if its carrying amount exceeds its estimated recoverable amount. The impair-ment loss for assets carried at amortised cost is calculated as the difference between the carrying amount and thepresent value of expected future cash flows discounted at the original effective interest rate. The recoverable amountfor an available-for-sale equity security is its fair value. An impairment loss for an available-for-sale equity security isrecognised in income if there has been a significant or prolonged decline in its recoverable amount below cost.Significant or prolonged declines are assessed in relation to the period of time and extent to which the fair value ofthe equity security is less than its cost.
Except for equity securities, if in a subsequent period, the amount of the impairment loss decreases and the decreasecan be related objectively to an event occurring after the impairment was recognised, the previously recognisedimpairment loss is reversed, and the amount of the reversal is recognised in income. For equity securities, any subsequent increases in fair value after an impairment has occurred are recognised in the financial investmentsreserve in equity.
j) Inventories Inventories are stated at the lower of cost and net realisable value. Cost is generally determined using the averagecost method. The cost of finished goods and work in progress comprises raw materials, direct labour, other directcosts and related production overheads (based on normal operating capacity). It excludes borrowing costs. Netrealisable value is the estimated selling price in the ordinary course of business, less applicable variable selling expenses.The valuation of aged rum includes warehousing and other indirect costs associated with the storage of rum.Provision is made for obsolete, slow-moving and defective items.
k) Trade receivables Trade receivables are recognised initially at fair value and subsequently measured at the anticipated realisable value.A provision for impairment of trade receivables is established when there is objective evidence that the Group willnot be able to collect all amounts due according to the original terms of receivables. Significant financial difficultiesof the debtor and default or delinquency in payments are considered indicators that the trade receivable is impaired.The amount of the provision is the difference between the carrying amount and the anticipated realisable value. Thecarrying amount of the asset is reduced through the use of the provision for impairment of receivables and theamount of loss is recognised in the consolidated statement of income within selling, marketing and administrative expenses. When a trade receivable is uncollectible, it is written off against the provision for impairment of receivablesand any subsequent recoveries of amounts previously written off are credited against selling, marketing and administrative expenses.
l) Cash and cash equivalents Cash and cash equivalents include cash in hand, short-term bank deposits, other short-term highly liquid investmentswith original maturities of three months or less and bank overdrafts. Bank overdrafts are shown within borrowingsin current liabilities on the consolidated statement of financial position.
Cash equivalents are subject to an insignificant risk of change in value.
m) Trade payablesTrade payables are recognised initially at fair value and subsequently measured at amortised cost using the effectiveinterest method.
n) Borrowings Borrowings are recognised initially at fair value, net of transaction costs incurred. Borrowings are subsequently statedat amortised cost and any difference between the net proceeds and the redemption value is recognised in the consoli-dated statement of income over the period of the borrowings using the effective interest method. Associated costsare classified as finance costs in the consolidated statement of income. Borrowings due within twelve months of theconsolidated statement of financial position date are classified as current liabilities. Preference shares which aremandatorily redeemable by the holder of the shares are classified as liabilities. The dividends on these preferenceshares are recognised in the consolidated statement of income within finance costs.
Notes to the Consolidated Financial Statements30 September 2016
(Expressed in thousands of Barbados Dollars)
Notes to the Consolidated Financial Statements30 September 2016(Expressed in thousands of Barbados Dollars)
58
ANNUAL REPORT 20
16
2. Significant accounting policies... continued
n) Borrowings... continued General and specific borrowing costs directly attributable to the acquisition, construction or production of qualifyingassets, which are assets that necessarily take a substantial period of time to get ready for their intended use or sale,are added to the cost of those assets, until such time as the assets are substantially ready for their intended use orsale. All other borrowing costs are recognised in the consolidated statement of income in the period in which theyare incurred.
o) Current and deferred income tax The current income tax charge is calculated on the basis of the tax laws enacted or substantively enacted at the consolidated statement of financial position date in the countries where the Group’s subsidiaries and associates operate and generate taxable income. Management periodically evaluates positions taken in tax returns with respectto situations where applicable tax regulations are subject to interpretation and establishes provisions where appro-priate on the basis of amounts expected to be paid to the tax authorities.
The Group follows the liability method of accounting for deferred tax whereby all temporary differences arisingbetween the tax bases of assets and liabilities and their carrying values for financial reporting purposes are providedfor at the corporation tax rates which are expected to apply when the related deferred income tax asset is realisedor the deferred income tax liability is settled.
Deferred tax assets are only recognised when it is probable that taxable income will be available against which theassets may be utilised.
p) Employee benefits
i) Pension obligationsThe Company and certain of its subsidiary companies operate defined benefit pension plans for their employeesunder segregated fund policies with Sagicor Life Inc. as well as with Morgan Stanley Private WealthManagement. The schemes are funded through payments from the employees and the Group, determined byannual actuarial calculations. Some of these pension plans are based on final average salary and some are basedon career average salary.
Defined benefit plans define an amount of pension benefit that an employee will receive on retirement, usuallydependent on one or more factors such as age, years of service and compensation. The liability recognised in theconsolidated statement of financial position in respect of defined benefit pension plans is the present value ofthe defined benefit obligation at the consolidated statement of financial position date less the fair value of planassets. The defined benefit obligation is calculated annually by independent actuaries using the projected unitcredit method. The present value of the defined benefit obligation is determined by discounting the estimatedfuture cash outflows using interest rates of long-term government securities that are denominated in the currency in which the benefit will be paid, and that have terms to maturity approximating the terms of the related pension liability. All actuarial gains and losses arising from experience adjustments and changes in actuarial assumptions are charged or credited to equity in other comprehensive income in the period in whichthey arise. Past service costs are recognised immediately in the consolidated statement of income.
For the defined contribution plans operated by the Group, the Group pays contributions to privately administered funds on a mandatory basis. The Group has no further payment obligations once the contributionshave been paid. The contributions are recognised as employee benefits expense when they are due. Prepaid contributions are recognised as an asset to the extent that a cash refund or a reduction in the future paymentsis available.
ii) Profit-sharing bonus planThe Group recognises a liability and an expense for profit-sharing bonuses. Senior management’s profit-sharingbonuses are based on the Company’s economic profit improvement over the prior year. Economic profit is calculated as net operating profit after tax and certain adjustments less a charge for capital employed. Profit-sharing bonuses for all other employees are based on a formula that takes into consideration the profit attributable to the Company’s shareholders after certain adjustments.
59
ANNUAL REPORT 20
16
2. Significant accounting policies... continued
q) Share-based paymentsThe Group operates various cash-settled share-based plans. In addition to an executive share option plan, there is abonus share purchase scheme which is only offered to full time employees of the Group in Barbados and a broadbased employee share purchase scheme for all full time employees.
The excess of the fair value of the options granted over the amount that management has to pay for the options isrecognised in the share-based payments expense in selling, marketing and administrative expenses and credited to the share-based payments reserve in equity. The proceeds received when the options are exercised arecredited to share capital.
Any discounts offered under the bonus share purchase scheme and the employee share purchase scheme are alsorecognised in the share-based payments expense.
r) Provisions Provisions are recognised when the Group has a present legal or constructive obligation, as a result of past events, ifit is probable that an outflow of resources will be required to settle the obligation and a reliable estimate of theamount can be made. Provisions are measured at the present value of the expenditures expected to be required tosettle the obligation.
s) Revenue recognition Revenue comprises the fair value of the consideration received or receivable for the sale of goods and services in theordinary course of the Group’s activities. Revenue is shown net of value-added tax, estimated returns, rebates anddiscounts and after eliminated sales within the Group. Revenue is recognised as follows:
i) Sales of goods – wholesale and retailSales of goods are recognised when a Group entity has delivered products to the customer, the customer hasaccepted the products and collectibility of the related receivables is reasonably assured.
ii) Sales of servicesSales of services are recognised in the accounting period in which the services are rendered.
iii) Interest incomeInterest income is recognised on an accrual basis using the effective interest method.
iv) Dividend incomeDividend income is recognised when the Group’s right to receive payment is established.
v) Royalty and rental incomeRoyalty and rental income is recognised on an accrual basis.
vi) Premium incomePremiums are recognised over the lives of the policies written. Unearned premiums represent the portion of premiums written in the current year which relate to periods of insurance subsequent to the consolidated statement of financial position date calculated using the twenty-fourths method. Unearned premiums relatingto marine cargo are deemed to be nil as such policies are generally issued for periods not exceeding one month.
t) Leases Leases in which a significant portion of the risks and rewards of ownership are retained by the lessor are classified asoperating leases. Payments made under operating leases are charged to the consolidated statement of income on astraight-line basis over the period of the lease.
Assets leased out under operating leases are included in property, plant and equipment or investment property in theconsolidated statement of financial position. They are depreciated over their expected useful lives on a basis consis-tent with similar property, plant and equipment. Rental income is recognised on a straight-line basis over the leaseterm.
Notes to the Consolidated Financial Statements30 September 2016
(Expressed in thousands of Barbados Dollars)
Notes to the Consolidated Financial Statements30 September 2016(Expressed in thousands of Barbados Dollars)
60
ANNUAL REPORT 20
16
2. Significant accounting policies... continued
u) Insurance contracts
Recognition and measurementThe Group issues contracts that transfer insurance risk. Insurance contracts are those contracts that transfer signifi-cant insurance risk. As a general guideline, the Group defines as significant insurance risk the possibility of having topay benefits on the occurrence of an insured event that are at least 10% more than the benefits payable if the insuredevent did not occur. Insurance contracts issued are classified as short-term insurance contracts. These contracts areprincipally property, accident, motor, liability and marine insurance contracts.
Property insurance contracts indemnify the Group's customers in the event of a loss from specified insured perils (suchas but not limited to fire, windstorm or earthquake) and their consequences up to the insured amount and withinthe terms of the policy conditions. These contracts are issued for both private and commercial risks.
Accident insurance contracts indemnify the Group's customers in the event of personal injury, loss and/or damage toproperty up to the insured amount and within the terms of the policy conditions.
Motor insurance contracts indemnify the Group's customers for their legal requirement under the applicable RoadTraffic Act. These contracts may be extended for additional coverage such as physical damage, theft and personal accident.
Liability insurance contracts provide coverage for liability exposures that indemnify the Group's customers againstactions from third parties subject to policy limits and conditions. The typical protection offered is designed for employers who become legally liable to pay compensation to injured employees (employers' liability) and employerswho become liable to pay compensation to third parties for bodily harm or property damage (public liability).
Marine insurance contracts indemnify the Group's customers for loss or damage to their insured cargo.
For these contracts, premiums are recognised as revenue (earned premiums) over the period of coverage. The portion of premium received on in-force contracts that relates to unexpired risks at the consolidated statement offinancial position date is reported as the unearned premium liability. Premiums are shown before the deduction ofcommission.
Claims and loss adjustment expenses are charged to the consolidated statement of income as incurred based on theestimated liability for compensation owed to contract holders or third parties damaged by contract holders. Theyinclude direct and indirect claims settlement costs and arise from events that have occurred up to the consolidatedstatement of financial position date even if they have not yet been reported to the Group. The Group does not discount its liabilities for unpaid claims.
Reinsurance contracts heldContracts entered into by the Group with reinsurers under which the Group is compensated for losses on one or morecontracts issued by the Group and that meet the classification requirements for insurance contracts are classified asreinsurance contracts held. Contracts that do not meet these classification requirements are classified as financial assets.
The benefits to which the Group is entitled under its reinsurance contracts held are recognised as reinsurance assets.These assets consist of short-term balances due from reinsurers. Amounts recoverable from or due to reinsurers aremeasured consistently with the amounts associated with the reinsured insurance contracts and in accordance with theterms of each reinsurance contract.
The Group assesses recoverability of its reinsurance assets when there is objective evidence that the reinsurance assetis impaired and reduces the carrying amount of the reinsurance asset to its estimated recoverable amount by recog-nising an impairment loss in the consolidated statement of income. The Group gathers the objective evidence that areinsurance asset is impaired using the same process adopted for financial assets held at amortised cost. The impair-ment loss is also calculated following the same method used for these financial assets.
61
ANNUAL REPORT 20
16
2. Significant accounting policies... continued
u) Insurance contracts... continued
Claims provision and related reinsurance recoveriesProvisions are made at the year end for the estimated cost of claims incurred but not yet settled at the consolidatedstatement of financial position date. The estimated cost of claims includes expenses to be incurred in settling theclaims and a deduction for the expected value of salvage and other recoveries. The Group takes all reasonable stepsto ensure that it has appropriate information regarding its claims exposures. However, given the uncertainty in estab-lishing claims provisions, it is likely that the outcome will prove to be different from the original liability established.
Receivables and payablesReceivables and payables are recognised when due. These include amounts due to and from agents, brokers andinsurance contract holders.
If there is objective evidence that the insurance receivable is impaired, the Group reduces the carrying amount of theinsurance receivable accordingly and recognises that impairment loss in the consolidated statement of income. TheGroup gathers the objective evidence that an insurance receivable is impaired using the same process adopted forreceivables. The impairment loss is also calculated under the same method used for these financial assets.
Premiums and unearned premiumsPremiums are earned over the term of the related insurance contracts in proportion to the period of risk. The reservefor unearned premiums is established for the portion of premiums written which relate to unexpired risks at the end of the period.
Premiums ceded are expensed over the term of the related insurance contracts in proportion to the period of risk,coterminous with the related gross premiums. The provision for deferred premiums is established for the portion ofpremiums ceded which relate to unexpired risks at the end of the period.
Deferred acquisition costsAcquisition costs on premiums written vary with and are directly related to the production of business. These costsare deferred and recognised over the period of the policies to which they relate.
Claims and claims expensesClaims and claims expenses are shown gross with amounts due under reinsurance contracts shown as reinsuranceassets. Reserves for claims are recorded as incurred and represent estimates of future payments of reported and unreported claims and related expenses with respect to insured events that have occurred up to the consolidated statement of financial position date. Reinsurance claims recoveries are estimated at the same time as the reserve fora claim is recorded. The provision reflects management's best estimate of the Group's ultimate liabilities and management believes that the provision is adequate.
v) Dividend distributions Dividend distributions to the Company's shareholders are recognised as a liability in the Group's consolidated financial statements in the period in which the dividends are approved by the Board of Directors.
w) Non-current assets held for sale Non-current assets classified as held for sale are measured at the lower of their carrying amounts and fair value lesscosts to sell. Non-current assets are classified as held for sale if their carrying amounts will be recovered principallythrough a sale transaction rather than through continuing use. This condition is regarded as met only when the saleis highly probable and the asset or disposal group is available for immediate sale in its present condition, manage-ment has committed to the sale, and the sale is expected to be completed within one year from the date of classifi-cation.
In the consolidated statement of comprehensive income of the reporting period, and of the comparable period ofprevious year, income and expenses from discontinued operations are reported separately from income and expenses from continuing operations, down to the level of profit after taxes, even when the Company retains a non-controlling interest in the subsidiary after the sale. The resulting profit or loss after taxes is reported separately in theconsolidated statement of comprehensive income.
Notes to the Consolidated Financial Statements30 September 2016
(Expressed in thousands of Barbados Dollars)
Notes to the Consolidated Financial Statements30 September 2016(Expressed in thousands of Barbados Dollars)
62
ANNUAL REPORT 20
16
2. Significant accounting policies... continued
w) Non-current assets held for sale... continued Property, plant and equipment and intangible assets once classified as held for sale are not depreciated or amortised.
Assets and liabilities classified as held for distribution are presented separately as current items in the statement offinancial position.
3. Risk management
a) Financial risk factors The Group’s activities expose it to a variety of financial risks: market risk (including currency risk, fair value interestrate risk, cash flow interest rate risk and price risk), credit risk and liquidity risk. The Group’s overall risk managementprogramme focuses on the unpredictability of financial markets and seeks to minimise potential adverse effects onthe Group’s financial performance. The Group has not entered into forward contracts to reduce its risk exposures.
Risk management is carried out by Head Office under policies approved by the Board of Directors. Head Office identifies, evaluates and hedges financial risks where considered appropriate in close cooperation with the Group’soperating units. The Board provides guidance for overall risk management.
i) Market risk
1) Foreign exchange risk The Group operates extra-regionally and is exposed to foreign exchange risk arising from various currencyexposures, primarily with respect to Central and South American currencies. Foreign exchange risk arisesfrom future commercial transactions and recognised assets and liabilities.
In order to manage the risk associated with movements in currency exchange rates in Central and SouthAmerica on commercial transactions, the Group trades mainly in US dollars. The Group also seeks tomaintain cash and cash equivalents in each operating currency, which are sufficient to match liabilities denominated in the same currency.
The table below illustrates the theoretical impact on equity and net income of a 5% depreciation in theJamaican dollar and Latin American currencies when compared to the Barbados dollar as at 30 September2016.
Effect of a 5% depreciation of Effect on equity Effect on net income
Jamaican dollar 138 (550)Latin American currencies (338) (585)
An appreciation of these currencies would have an equal and opposite effect on equity and net income.
2) Price risk The Group is exposed to equity securities price risk because of financial investments held by the Group and classified on the consolidated statement of financial position as available-for-sale. The Group is not exposed tocommodity price risk. To manage the price risk arising from investments in equity securities, the Group diversi-fies its portfolio.
The Group’s publicly traded equity securities are included mainly on the Barbados Stock Exchange (“BSE”)and the Cayman Islands Stock Exchange (“CSX”).
If the BSE and CSX had increased or decreased by 5% with all other variables held constant, the financialinvestments reserve within equity would increase or decrease by $483 (2015 – $431) as a result of gains orlosses on equity securities classified as available-for-sale financial assets.
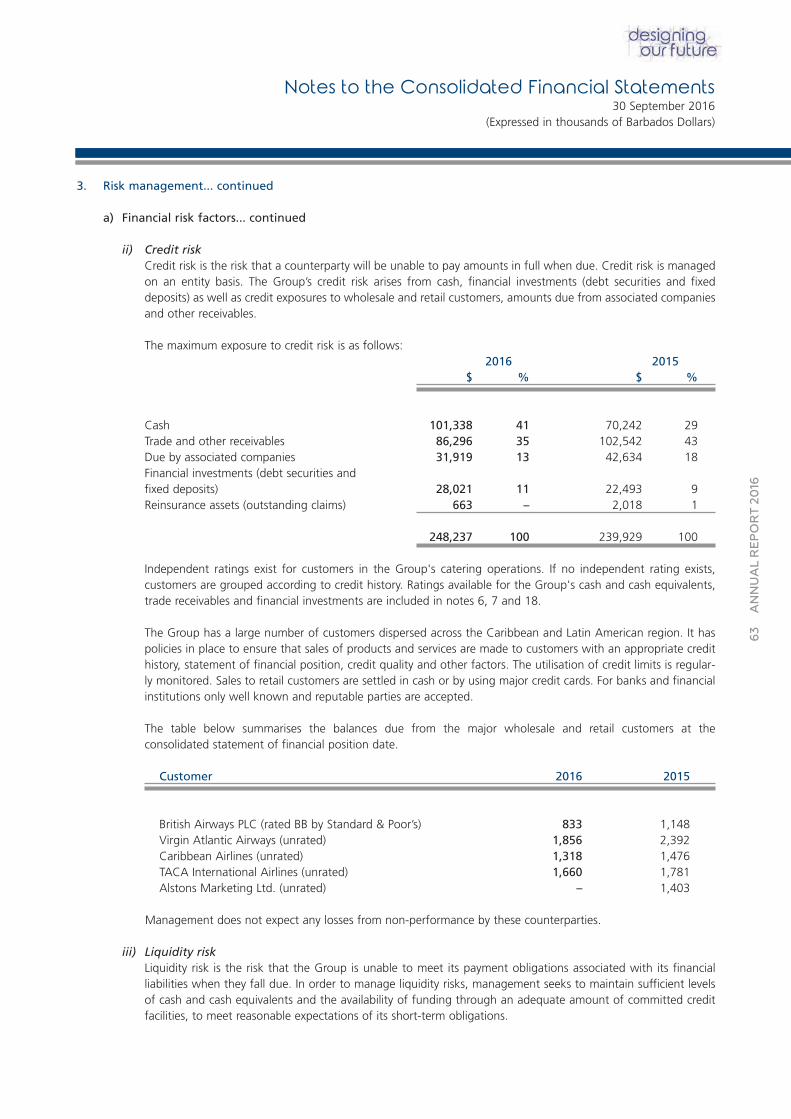
63
ANNUAL REPORT 20
16
3. Risk management... continued
a) Financial risk factors... continued
ii) Credit riskCredit risk is the risk that a counterparty will be unable to pay amounts in full when due. Credit risk is managedon an entity basis. The Group’s credit risk arises from cash, financial investments (debt securities and fixeddeposits) as well as credit exposures to wholesale and retail customers, amounts due from associated companiesand other receivables.
The maximum exposure to credit risk is as follows:2016 2015
$ % $ %
Cash 101,338 41 70,242 29Trade and other receivables 86,296 35 102,542 43Due by associated companies 31,919 13 42,634 18Financial investments (debt securities and fixed deposits) 28,021 11 22,493 9Reinsurance assets (outstanding claims) 663 – 2,018 1
248,237 100 239,929 100
Independent ratings exist for customers in the Group's catering operations. If no independent rating exists, customers are grouped according to credit history. Ratings available for the Group's cash and cash equivalents,trade receivables and financial investments are included in notes 6, 7 and 18.
The Group has a large number of customers dispersed across the Caribbean and Latin American region. It has policies in place to ensure that sales of products and services are made to customers with an appropriate credithistory, statement of financial position, credit quality and other factors. The utilisation of credit limits is regular-ly monitored. Sales to retail customers are settled in cash or by using major credit cards. For banks and financialinstitutions only well known and reputable parties are accepted.
The table below summarises the balances due from the major wholesale and retail customers at the consolidated statement of financial position date.
Customer 2016 2015
British Airways PLC (rated BB by Standard & Poor’s) 833 1,148Virgin Atlantic Airways (unrated) 1,856 2,392Caribbean Airlines (unrated) 1,318 1,476TACA International Airlines (unrated) 1,660 1,781Alstons Marketing Ltd. (unrated) – 1,403
Management does not expect any losses from non-performance by these counterparties.
iii) Liquidity risk Liquidity risk is the risk that the Group is unable to meet its payment obligations associated with its financial liabilities when they fall due. In order to manage liquidity risks, management seeks to maintain sufficient levelsof cash and cash equivalents and the availability of funding through an adequate amount of committed creditfacilities, to meet reasonable expectations of its short-term obligations.
Notes to the Consolidated Financial Statements30 September 2016
(Expressed in thousands of Barbados Dollars)
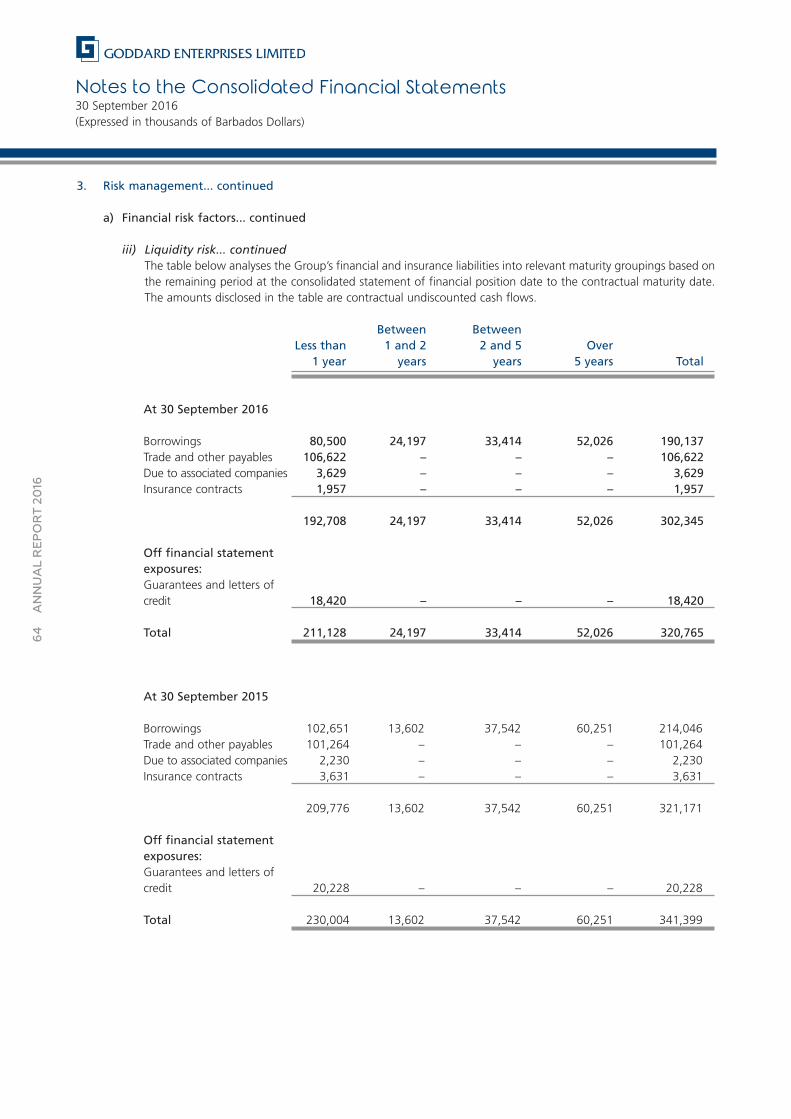
Notes to the Consolidated Financial Statements30 September 2016(Expressed in thousands of Barbados Dollars)
64
ANNUAL REPORT 20
16
3. Risk management... continued
a) Financial risk factors... continued
iii) Liquidity risk... continuedThe table below analyses the Group’s financial and insurance liabilities into relevant maturity groupings based onthe remaining period at the consolidated statement of financial position date to the contractual maturity date.The amounts disclosed in the table are contractual undiscounted cash flows.
Between BetweenLess than 1 and 2 2 and 5 Over
1 year years years 5 years Total
At 30 September 2016
Borrowings 80,500 24,197 33,414 52,026 190,137Trade and other payables 106,622 – – – 106,622Due to associated companies 3,629 – – – 3,629Insurance contracts 1,957 – – – 1,957
192,708 24,197 33,414 52,026 302,345
Off financial statementexposures:Guarantees and letters ofcredit 18,420 – – – 18,420
Total 211,128 24,197 33,414 52,026 320,765
At 30 September 2015
Borrowings 102,651 13,602 37,542 60,251 214,046Trade and other payables 101,264 – – – 101,264Due to associated companies 2,230 – – – 2,230Insurance contracts 3,631 – – – 3,631
209,776 13,602 37,542 60,251 321,171
Off financial statementexposures:Guarantees and letters ofcredit 20,228 – – – 20,228
Total 230,004 13,602 37,542 60,251 341,399
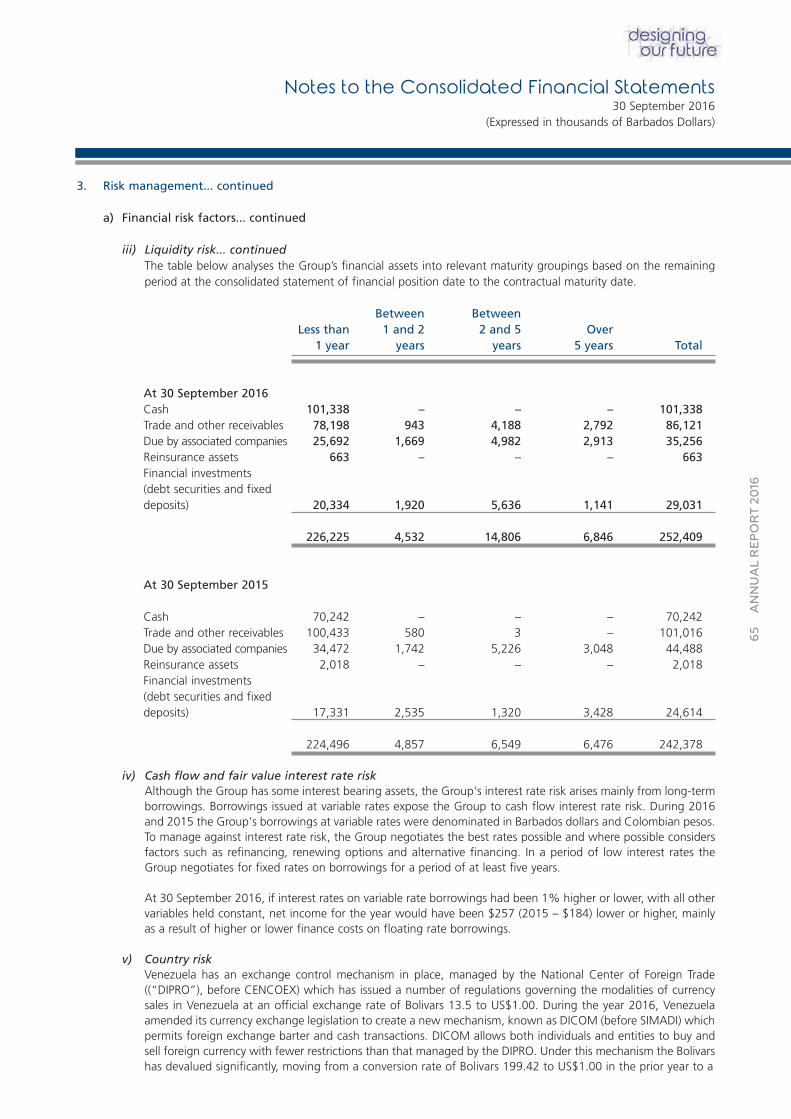
65
ANNUAL REPORT 20
16
3. Risk management... continued
a) Financial risk factors... continued
iii) Liquidity risk... continuedThe table below analyses the Group’s financial assets into relevant maturity groupings based on the remainingperiod at the consolidated statement of financial position date to the contractual maturity date.
Between BetweenLess than 1 and 2 2 and 5 Over
1 year years years 5 years Total
At 30 September 2016Cash 101,338 – – – 101,338Trade and other receivables 78,198 943 4,188 2,792 86,121Due by associated companies 25,692 1,669 4,982 2,913 35,256Reinsurance assets 663 – – – 663Financial investments(debt securities and fixeddeposits) 20,334 1,920 5,636 1,141 29,031
226,225 4,532 14,806 6,846 252,409
At 30 September 2015
Cash 70,242 – – – 70,242Trade and other receivables 100,433 580 3 – 101,016Due by associated companies 34,472 1,742 5,226 3,048 44,488Reinsurance assets 2,018 – – – 2,018Financial investments(debt securities and fixeddeposits) 17,331 2,535 1,320 3,428 24,614
224,496 4,857 6,549 6,476 242,378
iv) Cash flow and fair value interest rate risk Although the Group has some interest bearing assets, the Group's interest rate risk arises mainly from long-termborrowings. Borrowings issued at variable rates expose the Group to cash flow interest rate risk. During 2016and 2015 the Group's borrowings at variable rates were denominated in Barbados dollars and Colombian pesos.To manage against interest rate risk, the Group negotiates the best rates possible and where possible considersfactors such as refinancing, renewing options and alternative financing. In a period of low interest rates theGroup negotiates for fixed rates on borrowings for a period of at least five years.
At 30 September 2016, if interest rates on variable rate borrowings had been 1% higher or lower, with all othervariables held constant, net income for the year would have been $257 (2015 – $184) lower or higher, mainlyas a result of higher or lower finance costs on floating rate borrowings.
v) Country riskVenezuela has an exchange control mechanism in place, managed by the National Center of Foreign Trade((“DIPRO”), before CENCOEX) which has issued a number of regulations governing the modalities of currencysales in Venezuela at an official exchange rate of Bolivars 13.5 to US$1.00. During the year 2016, Venezuelaamended its currency exchange legislation to create a new mechanism, known as DICOM (before SIMADI) whichpermits foreign exchange barter and cash transactions. DICOM allows both individuals and entities to buy andsell foreign currency with fewer restrictions than that managed by the DIPRO. Under this mechanism the Bolivarshas devalued significantly, moving from a conversion rate of Bolivars 199.42 to US$1.00 in the prior year to a
Notes to the Consolidated Financial Statements30 September 2016
(Expressed in thousands of Barbados Dollars)
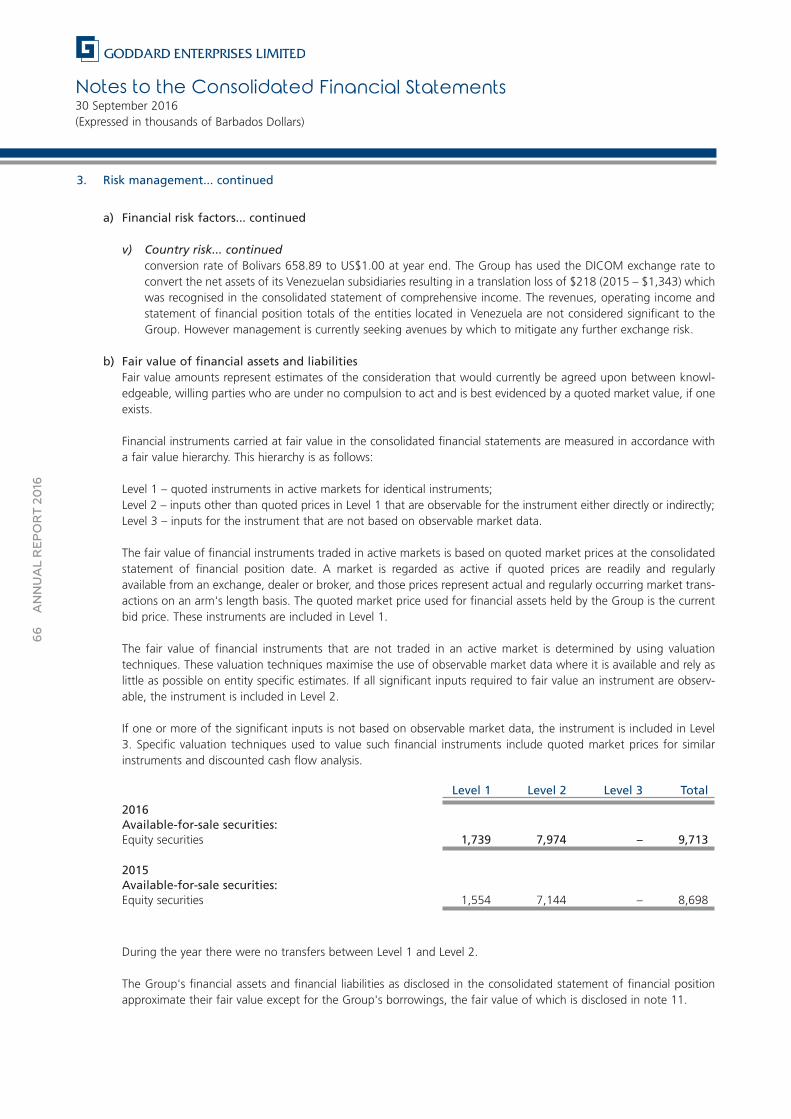
Notes to the Consolidated Financial Statements30 September 2016(Expressed in thousands of Barbados Dollars)
66
ANNUAL REPORT 20
16
3. Risk management... continued
a) Financial risk factors... continued
v) Country risk... continuedconversion rate of Bolivars 658.89 to US$1.00 at year end. The Group has used the DICOM exchange rate toconvert the net assets of its Venezuelan subsidiaries resulting in a translation loss of $218 (2015 – $1,343) whichwas recognised in the consolidated statement of comprehensive income. The revenues, operating income andstatement of financial position totals of the entities located in Venezuela are not considered significant to theGroup. However management is currently seeking avenues by which to mitigate any further exchange risk.
b) Fair value of financial assets and liabilitiesFair value amounts represent estimates of the consideration that would currently be agreed upon between knowl-edgeable, willing parties who are under no compulsion to act and is best evidenced by a quoted market value, if oneexists.
Financial instruments carried at fair value in the consolidated financial statements are measured in accordance witha fair value hierarchy. This hierarchy is as follows:
Level 1 – quoted instruments in active markets for identical instruments;Level 2 – inputs other than quoted prices in Level 1 that are observable for the instrument either directly or indirectly;Level 3 – inputs for the instrument that are not based on observable market data.
The fair value of financial instruments traded in active markets is based on quoted market prices at the consolidatedstatement of financial position date. A market is regarded as active if quoted prices are readily and regularly available from an exchange, dealer or broker, and those prices represent actual and regularly occurring market trans-actions on an arm's length basis. The quoted market price used for financial assets held by the Group is the currentbid price. These instruments are included in Level 1.
The fair value of financial instruments that are not traded in an active market is determined by using valuation techniques. These valuation techniques maximise the use of observable market data where it is available and rely aslittle as possible on entity specific estimates. If all significant inputs required to fair value an instrument are observ-able, the instrument is included in Level 2.
If one or more of the significant inputs is not based on observable market data, the instrument is included in Level3. Specific valuation techniques used to value such financial instruments include quoted market prices for similar instruments and discounted cash flow analysis.
Level 1 Level 2 Level 3 Total
2016Available-for-sale securities:Equity securities 1,739 7,974 – 9,713
2015Available-for-sale securities:Equity securities 1,554 7,144 – 8,698
During the year there were no transfers between Level 1 and Level 2.
The Group's financial assets and financial liabilities as disclosed in the consolidated statement of financial positionapproximate their fair value except for the Group's borrowings, the fair value of which is disclosed in note 11.
67
ANNUAL REPORT 20
16
3. Risk management... continued
c) Capital risk managementThe Group’s objectives when managing capital are to maximise shareholders’ returns and benefits for other stake-holders and to maintain an optimal capital structure to reduce the cost of capital.
In order to maintain or adjust the capital structure, the Group may adjust the amount of dividends paid to share-holders, issue new shares or sell assets to reduce debt.
The Group monitors capital on the basis of the debt to capital ratio. This ratio is calculated as total debt divided bytotal capital. Total debt is calculated as total liabilities as shown on the consolidated statement of financial position.Total capital is calculated as ‘equity’ as shown on the consolidated statement of financial position plus total debt.
During 2016 and 2015, the Group’s strategy was to achieve a debt to capital ratio of 33:67. The debt to capital ratiosat 30 September 2016 and 2015, are as follows:
2016 2015
Total debt 306,689 313,892Total capital 905,407 896,739
Debt to capital ratio 25:75 26:74
Statutory complianceThe Group’s insurance company, M&C General Insurance Company Limited, is regulated by the Insurance Act No. 6of 1995 (the Insurance Act) of St. Lucia.
Section 34 of the Insurance Act states that a general insurer will be deemed to be insolvent if its assets do not exceedthe sum of its liabilities by the greater of $148 or twenty percent (20%) of its premium income in respect of its general insurance business in its last preceding financial year. Premium income of a company shall be assessed as thenet amount, after deductions for any premiums paid by the company for reinsurance in that year in respect ofall general insurance business carried on by the company. The company was deemed solvent as of 30 September2016.
Section 80 of the Insurance Act requires that a general insurer (carrying on motor vehicle and insurance businessother than long-term insurance) shall deposit with the Registrar either the greater of $56 or an amount equal to 40%of its net premium income in respect of business transacted during the last preceding financial year. The companywas in compliance with this requirement as of 30 September 2016 and 2015.
Section 88 of the Insurance Act requires that the company establishes a motor vehicle insurance fund equal to its liability and contingency reserves for motor vehicle insurance business less amounts held on deposit with theRegistrar. The company was in compliance with this requirement as of 30 September 2016 and 2015.
The local insurance regulator specifies the minimum amount and type of capital that must be held by the companyin addition to their insurance liabilities. The minimum required capital must be maintained at all times throughout theyear. The company is subject to insurance solvency regulations and the company has embedded in its asset liability management framework the necessary tests to ensure the continuous and full compliance with such regulations.
Notes to the Consolidated Financial Statements30 September 2016
(Expressed in thousands of Barbados Dollars)
Notes to the Consolidated Financial Statements30 September 2016(Expressed in thousands of Barbados Dollars)
68
ANNUAL REPORT 20
16
3. Risk management... continued
c) Capital risk management... continued
Statutory compliance... continuedThe table below summarises the minimum required capital and the regulatory capital held by the company.
2016 2015
Regulatory capital held 2,370 2,370
Minimum regulatory capital 555 555
d) Insurance riskThe risk under any one insurance contract is the possibility that the insured event occurs and the uncertainty of theamount of the resulting claim. By the very nature of an insurance contract, this is random and therefore unpredictable.
The principal risk that the Group faces under its insurance contracts is that the actual claim payments exceed the carrying amount of the insurance liabilities. This could occur because the frequency or severity of claims is greaterthan estimated. Insurance events are random and the actual number and amount of claims will vary from expecta-tions from year to year.
Experience shows that the larger the portfolio of similar insurance contracts, the smaller the relative variability aboutthe expected outcome will be. The Group’s underwriting strategy promotes diversification of insurance risks accept-ed and the creation of a large population of risks in each category to reduce the variability of the expected outcome.
Factors that aggravate insurance risk include lack of risk diversification in terms of type and amount of risk, geographical location and type of industry covered.
Reinsurance arrangementsThe Group limits its exposure to insurance losses through the purchase of reinsurance. The Group's retained risk byline of business is disclosed below:
Type of Insurance Contract Retention of Insurers
Property Risks Maximum net retention of $74Maximum gross retention of $5,555 per riskMaximum net retention of $1,185 for catastrophe risk
Motor & Liability Maximum net retention of $2,370 for single riskTreaty limits for motor of $2,963Treaty limits for liability of $2,963
Miscellaneous Accident Maximum net retention of $74Treaty limits of $740 any one risk
Marine Maximum net retention of $65 per shipment and $102 per bottomMaximum gross retention of $259 for single riskMaximum retention of $185 any one bondTreaty limit of $407 any one known bottom
4. Critical accounting estimates and judgements
The development of estimates and the exercise of judgement in applying accounting policies may have a material impacton the Group’s reported assets, liabilities, revenues and expenses. The items which may have the most effect on theGroup’s financial statements are set out below.
Valuation of propertyThe Group utilises professional valuers to determine the fair value of its properties. Valuations are determined throughthe application of a variety of different valuation methods which are all sensitive to the underlying assumptions chosen.
Property, plant and equipmentManagement exercises judgement in determining whether costs incurred can accrue sufficient future economic benefitsto the Group to enable the value to be treated as a capital expense. Further judgement is used upon annual review ofthe residual values and useful lives of all capital items to determine any necessary adjustments to carrying value.
Consolidation of flight kitchen operationsFollowing the adoption of IFRS 10 Consolidated Financial Statements, management reassessed the existing businessarrangement with LSG/Sky Chefs Inc. as it relates to the operation of the flight kitchens division.
On 30 March 1997 Goddard Enterprises Limited (GEL) and SC International Services Inc. (now LSG/Sky Chefs Inc.) enteredinto a business arrangement to manage the operations of the companies within the Catering and Ground HandlingDivision at the time. On 5 November 2015 the two parties signed a Restated Master Joint Venture Agreement that hasan initial term through 30 September 2035, with an automatic ten year extension. The ownership structure is 51:49, withGEL being the majority shareholder. GEL is deemed to have control of this arrangement as GEL directs the relevant activities which include, but are not limited to:
i) The selling and purchasing of goods and services.ii) The recruitment, appointment and termination of key management.iii) Negotiation of contracts with suppliers, customers and service providers.iv) Establishment of all operating policies.v) Determination of the strategic plans.
GEL currently, through the appointment of key management who directs the relevant activities of the business arrange-ment, has the ability to affect its performance and hence influence the variable returns from the arrangement. GEL currently also receives dividends and management fees.
Recognition and measurement of intangible assetsThe recognition and measurement of intangible assets, other than goodwill, in a business combination involves the utilisation of valuation techniques which may be very sensitive to the underlying assumptions utilised. These intangiblesmay be marketing related, consumer related, contract based or technology based.
For significant amounts of intangibles arising from a business combination, the Group utilises independent professionaladvisors to assist management in determining the recognition and measurement of these assets.
Impairment of intangible assets
a) GoodwillThe assessment of goodwill impairment involves the determination of the fair value of the cash-generating units towhich the goodwill has been allocated. Determination of fair value involves the estimation of future cash flows or ofnet income from ordinary activities of these business units and the expected returns to providers of capital to thebusiness units and/or to the Group as a whole.
The Group updates its business unit financial projections annually and assesses whether there is any impairment ofgoodwill.
b) Other intangible assetsThe assessment of impairment of other intangible assets involves the determination of the intangible’s fair value orvalue in use. In the absence of an active market for an intangible, its fair value may need to be estimated. In determining an intangible asset’s value in use, estimates are required of future cash flows generated as a result of holding the asset.
Notes to the Consolidated Financial Statements30 September 2016
(Expressed in thousands of Barbados Dollars)
69
ANNUAL REPORT 20
16
Notes to the Consolidated Financial Statements30 September 2016(Expressed in thousands of Barbados Dollars)
70ANNUAL REPORT 20
16
4. Critical accounting estimates and judgements... continued
Impairment of financial assetsManagement makes judgements at each reporting date to determine whether financial assets are impaired. Financialassets are impaired when the carrying value is greater than the recoverable amount and there is objective evidence ofimpairment. The recoverable amount is the present value of the future cash flows.
Employee benefitsIn conducting valuation exercises to measure the effect of all employee benefit plans throughout the Group, manage-ment uses judgement and assumptions in determining discount rates, salary increases, NIS ceiling increases, pensionincreases, and the rate of return on the assets of the plans.
Deferred taxesIn calculating the provision for deferred taxation, management uses judgement to determine the probability that futuretaxable profits will be available to facilitate utilisation of temporary tax differences which may arise.
Property, plant and equipmentManagement exercises judgement in determining whether costs incurred can accrue sufficient future economic benefitsto the Group to enable the value to be treated as a capital expense. Further judgement is used upon annual review ofthe residual values and useful lives of all capital items to determine any necessary adjustments to carrying value.
5. Segmental reportingAs a result of restructuring within the Group, the operating segments were realigned during the year. The revised segmentsare based on the reports reviewed by the Board of Directors which are used to make strategic decisions. The Group is divided into five reporting segments based on the different types of products and services offered. These products and services are described in note 1. The operating segments derive their revenue primarily from the distribution of general merchandise, manufacturing of food and consumables, and provision of catering, ground handling and financial services.The Directors assess the performance of the operating segments on the basis of revenue and profit or loss before tax excluding some other gains/(losses) – net which are shown as adjustments. Certain comparative figures have been reclassi-fied to conform to the presentation adopted in the current year for the revised segments.
Information segmented on a geographical basis has been included in the notes to the consolidated financial statementsas the Directors believe that this information is useful to an understanding of the operations of the Group.
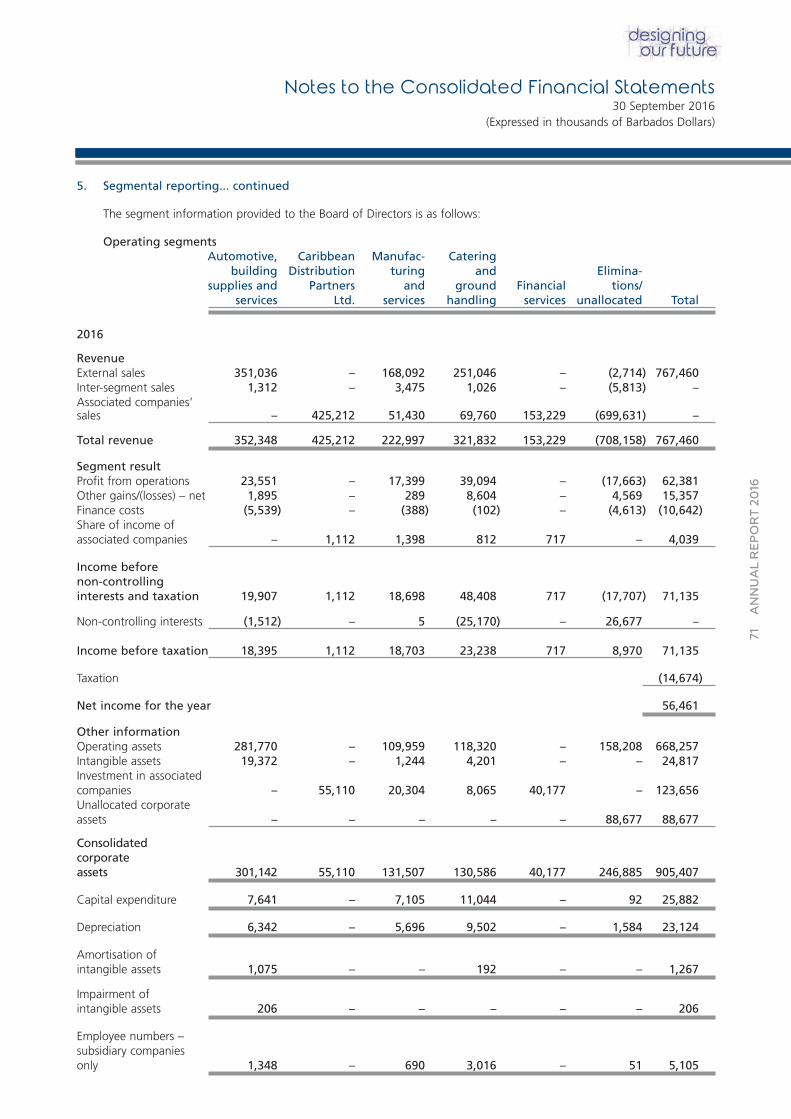
71ANNUAL REPORT 20
16
5. Segmental reporting... continued
The segment information provided to the Board of Directors is as follows:
Operating segmentsAutomotive, Caribbean Manufac- Catering
building Distribution turing and Elimina-supplies and Partners and ground Financial tions/
services Ltd. services handling services unallocated Total
2016
RevenueExternal sales 351,036 – 168,092 251,046 – (2,714) 767,460Inter-segment sales 1,312 – 3,475 1,026 – (5,813) –Associated companies’sales – 425,212 51,430 69,760 153,229 (699,631) –
Total revenue 352,348 425,212 222,997 321,832 153,229 (708,158) 767,460
Segment resultProfit from operations 23,551 – 17,399 39,094 – (17,663) 62,381Other gains/(losses) – net 1,895 – 289 8,604 – 4,569 15,357Finance costs (5,539) – (388) (102) – (4,613) (10,642)Share of income ofassociated companies – 1,112 1,398 812 717 – 4,039
Income before non-controllinginterests and taxation 19,907 1,112 18,698 48,408 717 (17,707) 71,135
Non-controlling interests (1,512) – 5 (25,170) – 26,677 –
Income before taxation 18,395 1,112 18,703 23,238 717 8,970 71,135
Taxation (14,674)
Net income for the year 56,461
Other informationOperating assets 281,770 – 109,959 118,320 – 158,208 668,257Intangible assets 19,372 – 1,244 4,201 – – 24,817Investment in associatedcompanies – 55,110 20,304 8,065 40,177 – 123,656Unallocated corporateassets – – – – – 88,677 88,677
Consolidatedcorporateassets 301,142 55,110 131,507 130,586 40,177 246,885 905,407
Capital expenditure 7,641 – 7,105 11,044 – 92 25,882
Depreciation 6,342 – 5,696 9,502 – 1,584 23,124
Amortisation ofintangible assets 1,075 – – 192 – – 1,267
Impairment ofintangible assets 206 – – – – – 206
Employee numbers –subsidiary companiesonly 1,348 – 690 3,016 – 51 5,105
Notes to the Consolidated Financial Statements30 September 2016
(Expressed in thousands of Barbados Dollars)
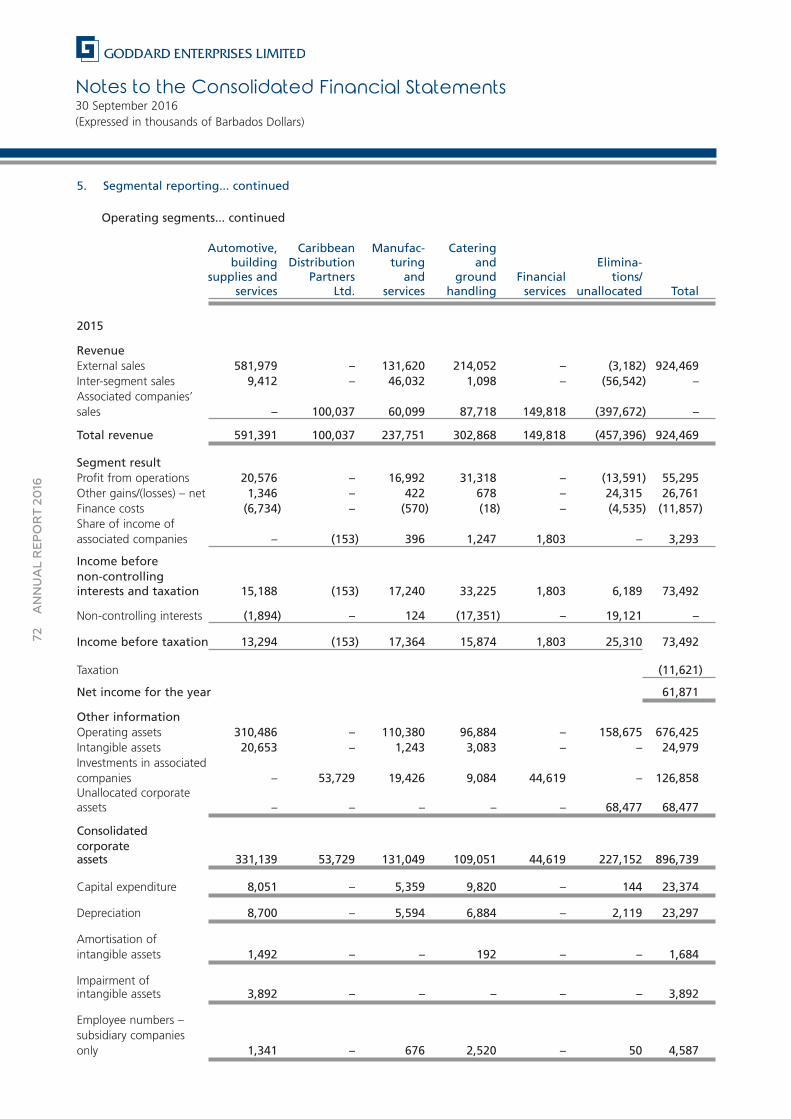
Notes to the Consolidated Financial Statements30 September 2016(Expressed in thousands of Barbados Dollars)
72ANNUAL REPORT 20
16
5. Segmental reporting... continued
Operating segments... continued
Automotive, Caribbean Manufac- Cateringbuilding Distribution turing and Elimina-
supplies and Partners and ground Financial tions/services Ltd. services handling services unallocated Total
2015
RevenueExternal sales 581,979 – 131,620 214,052 – (3,182) 924,469Inter-segment sales 9,412 – 46,032 1,098 – (56,542) –Associated companies’sales – 100,037 60,099 87,718 149,818 (397,672) –
Total revenue 591,391 100,037 237,751 302,868 149,818 (457,396) 924,469
Segment resultProfit from operations 20,576 – 16,992 31,318 – (13,591) 55,295Other gains/(losses) – net 1,346 – 422 678 – 24,315 26,761Finance costs (6,734) – (570) (18) – (4,535) (11,857)Share of income ofassociated companies – (153) 396 1,247 1,803 – 3,293
Income before non-controllinginterests and taxation 15,188 (153) 17,240 33,225 1,803 6,189 73,492
Non-controlling interests (1,894) – 124 (17,351) – 19,121 –
Income before taxation 13,294 (153) 17,364 15,874 1,803 25,310 73,492
Taxation (11,621)
Net income for the year 61,871
Other informationOperating assets 310,486 – 110,380 96,884 – 158,675 676,425Intangible assets 20,653 – 1,243 3,083 – – 24,979Investments in associatedcompanies – 53,729 19,426 9,084 44,619 – 126,858Unallocated corporateassets – – – – – 68,477 68,477
Consolidatedcorporateassets 331,139 53,729 131,049 109,051 44,619 227,152 896,739
Capital expenditure 8,051 – 5,359 9,820 – 144 23,374
Depreciation 8,700 – 5,594 6,884 – 2,119 23,297
Amortisation ofintangible assets 1,492 – – 192 – – 1,684
Impairment ofintangible assets 3,892 – – – – – 3,892
Employee numbers –subsidiary companiesonly 1,341 – 676 2,520 – 50 4,587
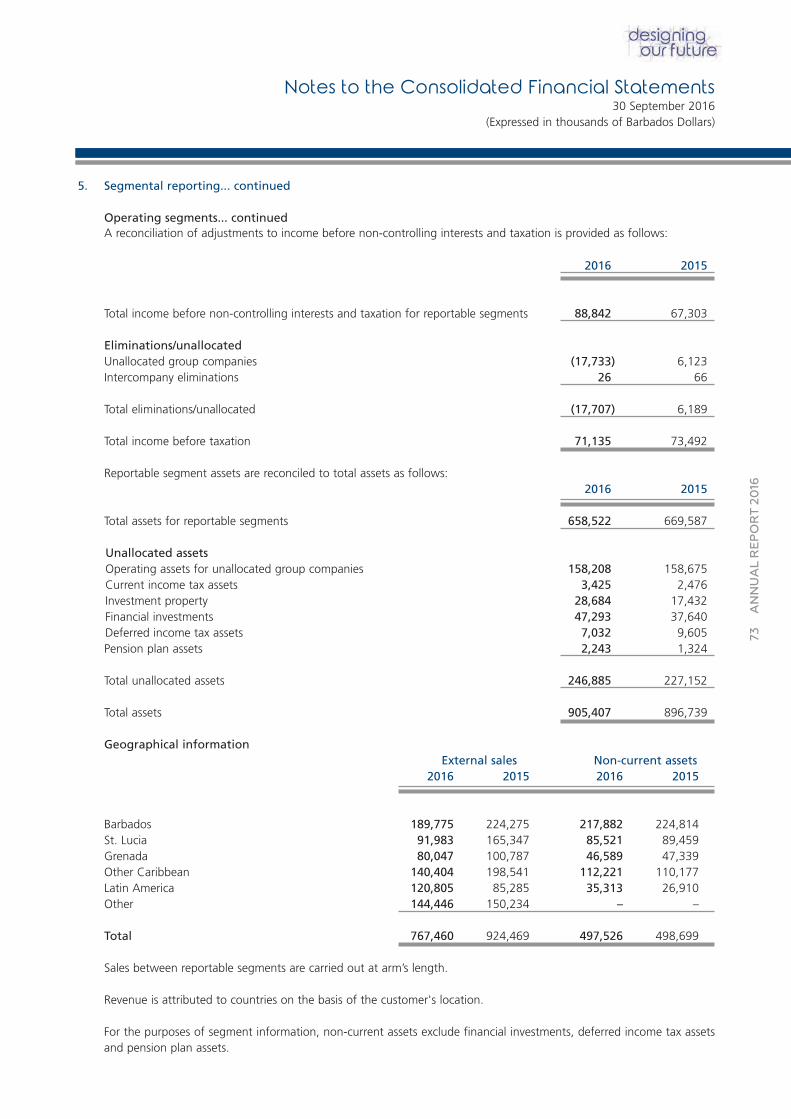
73ANNUAL REPORT 20
16
5. Segmental reporting... continued
Operating segments... continuedA reconciliation of adjustments to income before non-controlling interests and taxation is provided as follows:
2016 2015
Total income before non-controlling interests and taxation for reportable segments 88,842 67,303
Eliminations/unallocatedUnallocated group companies (17,733) 6,123Intercompany eliminations 26 66
Total eliminations/unallocated (17,707) 6,189
Total income before taxation 71,135 73,492
Reportable segment assets are reconciled to total assets as follows:2016 2015
Total assets for reportable segments 658,522 669,587
Unallocated assetsOperating assets for unallocated group companies 158,208 158,675Current income tax assets 3,425 2,476Investment property 28,684 17,432Financial investments 47,293 37,640Deferred income tax assets 7,032 9,605Pension plan assets 2,243 1,324
Total unallocated assets 246,885 227,152
Total assets 905,407 896,739
Geographical informationExternal sales Non-current assets
2016 2015 2016 2015
Barbados 189,775 224,275 217,882 224,814St. Lucia 91,983 165,347 85,521 89,459Grenada 80,047 100,787 46,589 47,339Other Caribbean 140,404 198,541 112,221 110,177Latin America 120,805 85,285 35,313 26,910Other 144,446 150,234 – –
Total 767,460 924,469 497,526 498,699
Sales between reportable segments are carried out at arm’s length.
Revenue is attributed to countries on the basis of the customer's location.
For the purposes of segment information, non-current assets exclude financial investments, deferred income tax assetsand pension plan assets.
Notes to the Consolidated Financial Statements30 September 2016
(Expressed in thousands of Barbados Dollars)
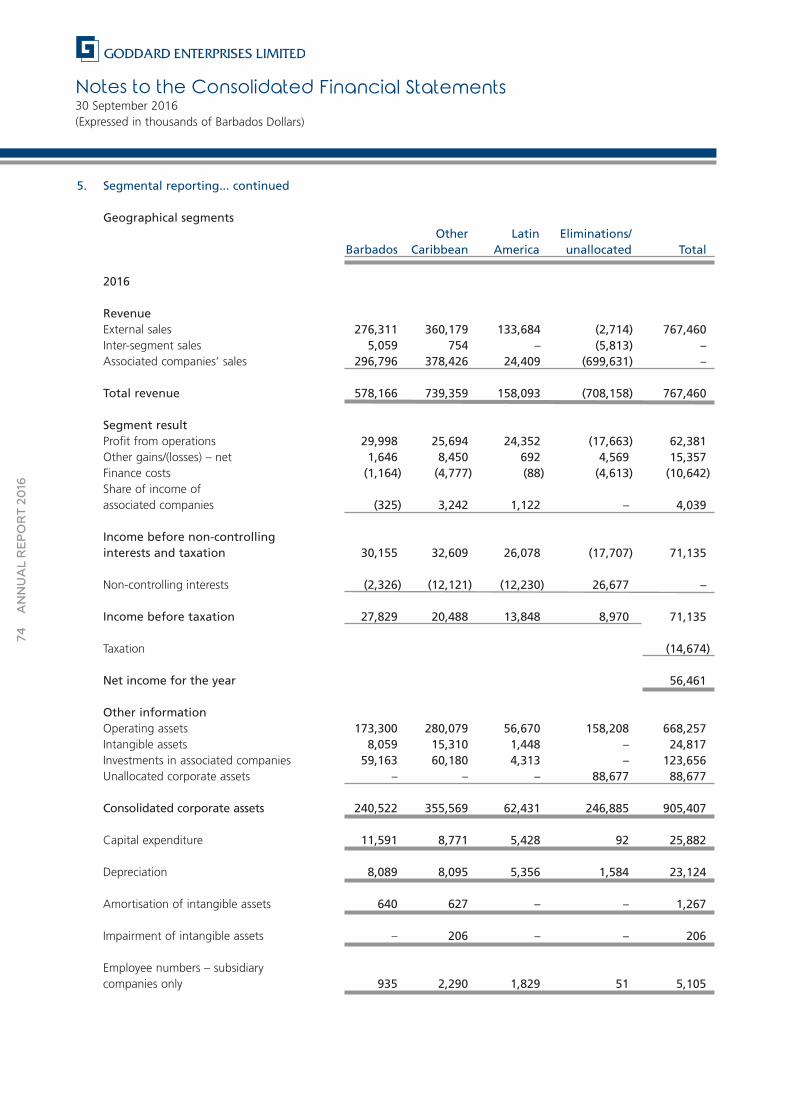
Notes to the Consolidated Financial Statements30 September 2016(Expressed in thousands of Barbados Dollars)
74ANNUAL REPORT 20
16
5. Segmental reporting... continued
Geographical segmentsOther Latin Eliminations/
Barbados Caribbean America unallocated Total
2016
RevenueExternal sales 276,311 360,179 133,684 (2,714) 767,460Inter-segment sales 5,059 754 – (5,813) –Associated companies’ sales 296,796 378,426 24,409 (699,631) –
Total revenue 578,166 739,359 158,093 (708,158) 767,460
Segment resultProfit from operations 29,998 25,694 24,352 (17,663) 62,381Other gains/(losses) – net 1,646 8,450 692 4,569 15,357Finance costs (1,164) (4,777) (88) (4,613) (10,642)Share of income ofassociated companies (325) 3,242 1,122 – 4,039
Income before non-controllinginterests and taxation 30,155 32,609 26,078 (17,707) 71,135
Non-controlling interests (2,326) (12,121) (12,230) 26,677 –
Income before taxation 27,829 20,488 13,848 8,970 71,135
Taxation (14,674)
Net income for the year 56,461
Other informationOperating assets 173,300 280,079 56,670 158,208 668,257Intangible assets 8,059 15,310 1,448 – 24,817Investments in associated companies 59,163 60,180 4,313 – 123,656Unallocated corporate assets – – – 88,677 88,677
Consolidated corporate assets 240,522 355,569 62,431 246,885 905,407
Capital expenditure 11,591 8,771 5,428 92 25,882
Depreciation 8,089 8,095 5,356 1,584 23,124
Amortisation of intangible assets 640 627 – – 1,267
Impairment of intangible assets – 206 – – 206
Employee numbers – subsidiarycompanies only 935 2,290 1,829 51 5,105
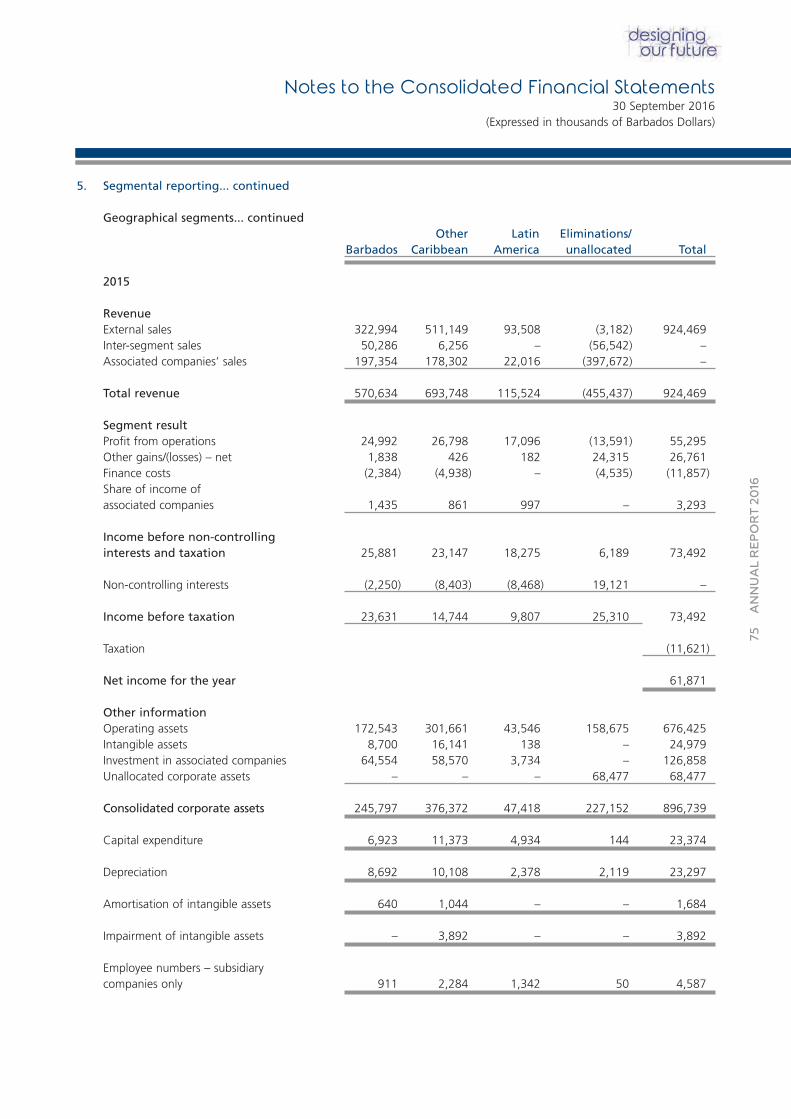
75ANNUAL REPORT 20
16
5. Segmental reporting... continued
Geographical segments... continuedOther Latin Eliminations/
Barbados Caribbean America unallocated Total
2015
RevenueExternal sales 322,994 511,149 93,508 (3,182) 924,469Inter-segment sales 50,286 6,256 – (56,542) –Associated companies’ sales 197,354 178,302 22,016 (397,672) –
Total revenue 570,634 693,748 115,524 (455,437) 924,469
Segment resultProfit from operations 24,992 26,798 17,096 (13,591) 55,295Other gains/(losses) – net 1,838 426 182 24,315 26,761Finance costs (2,384) (4,938) – (4,535) (11,857)Share of income ofassociated companies 1,435 861 997 – 3,293
Income before non-controllinginterests and taxation 25,881 23,147 18,275 6,189 73,492
Non-controlling interests (2,250) (8,403) (8,468) 19,121 –
Income before taxation 23,631 14,744 9,807 25,310 73,492
Taxation (11,621)
Net income for the year 61,871
Other informationOperating assets 172,543 301,661 43,546 158,675 676,425Intangible assets 8,700 16,141 138 – 24,979Investment in associated companies 64,554 58,570 3,734 – 126,858Unallocated corporate assets – – – 68,477 68,477
Consolidated corporate assets 245,797 376,372 47,418 227,152 896,739
Capital expenditure 6,923 11,373 4,934 144 23,374
Depreciation 8,692 10,108 2,378 2,119 23,297
Amortisation of intangible assets 640 1,044 – – 1,684
Impairment of intangible assets – 3,892 – – 3,892
Employee numbers – subsidiarycompanies only 911 2,284 1,342 50 4,587
Notes to the Consolidated Financial Statements30 September 2016
(Expressed in thousands of Barbados Dollars)
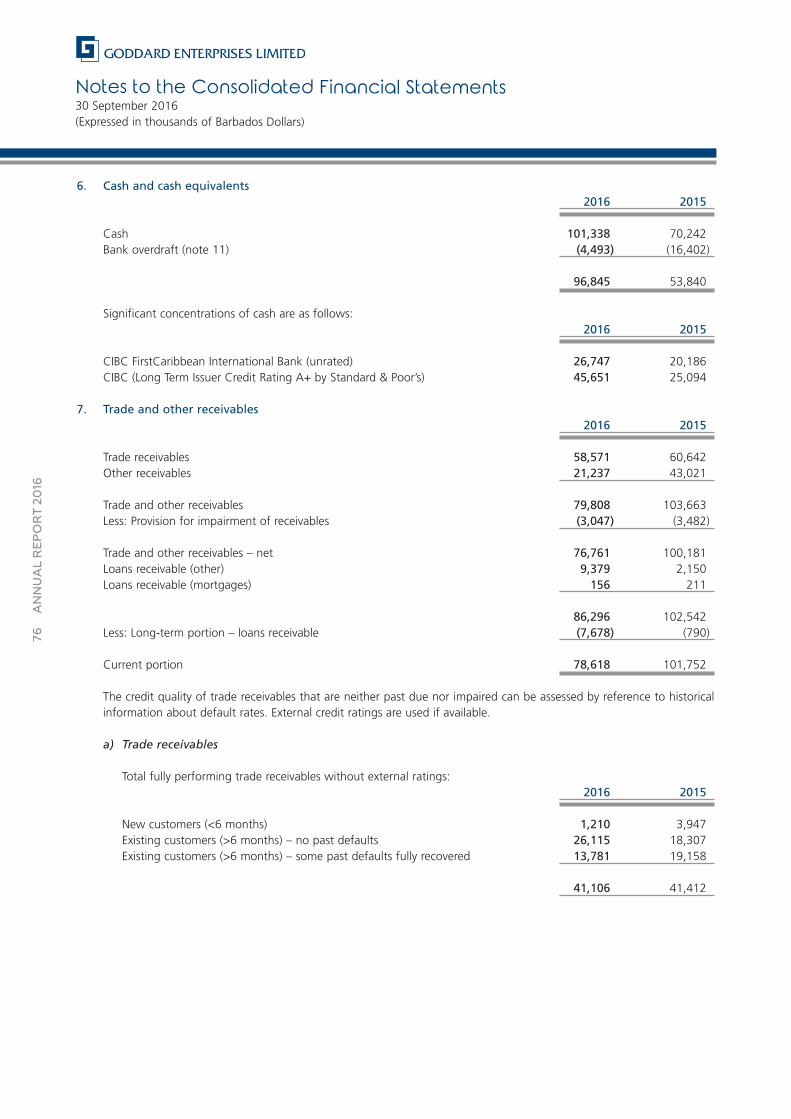
Notes to the Consolidated Financial Statements30 September 2016(Expressed in thousands of Barbados Dollars)
76ANNUAL REPORT 20
16
6. Cash and cash equivalents2016 2015
Cash 101,338 70,242Bank overdraft (note 11) (4,493) (16,402)
96,845 53,840
Significant concentrations of cash are as follows:2016 2015
CIBC FirstCaribbean International Bank (unrated) 26,747 20,186CIBC (Long Term Issuer Credit Rating A+ by Standard & Poor’s) 45,651 25,094
7. Trade and other receivables2016 2015
Trade receivables 58,571 60,642Other receivables 21,237 43,021
Trade and other receivables 79,808 103,663Less: Provision for impairment of receivables (3,047) (3,482)
Trade and other receivables – net 76,761 100,181Loans receivable (other) 9,379 2,150Loans receivable (mortgages) 156 211
86,296 102,542Less: Long-term portion – loans receivable (7,678) (790)
Current portion 78,618 101,752
The credit quality of trade receivables that are neither past due nor impaired can be assessed by reference to historicalinformation about default rates. External credit ratings are used if available.
a) Trade receivables
Total fully performing trade receivables without external ratings:2016 2015
New customers (<6 months) 1,210 3,947Existing customers (>6 months) – no past defaults 26,115 18,307Existing customers (>6 months) – some past defaults fully recovered 13,781 19,158
41,106 41,412
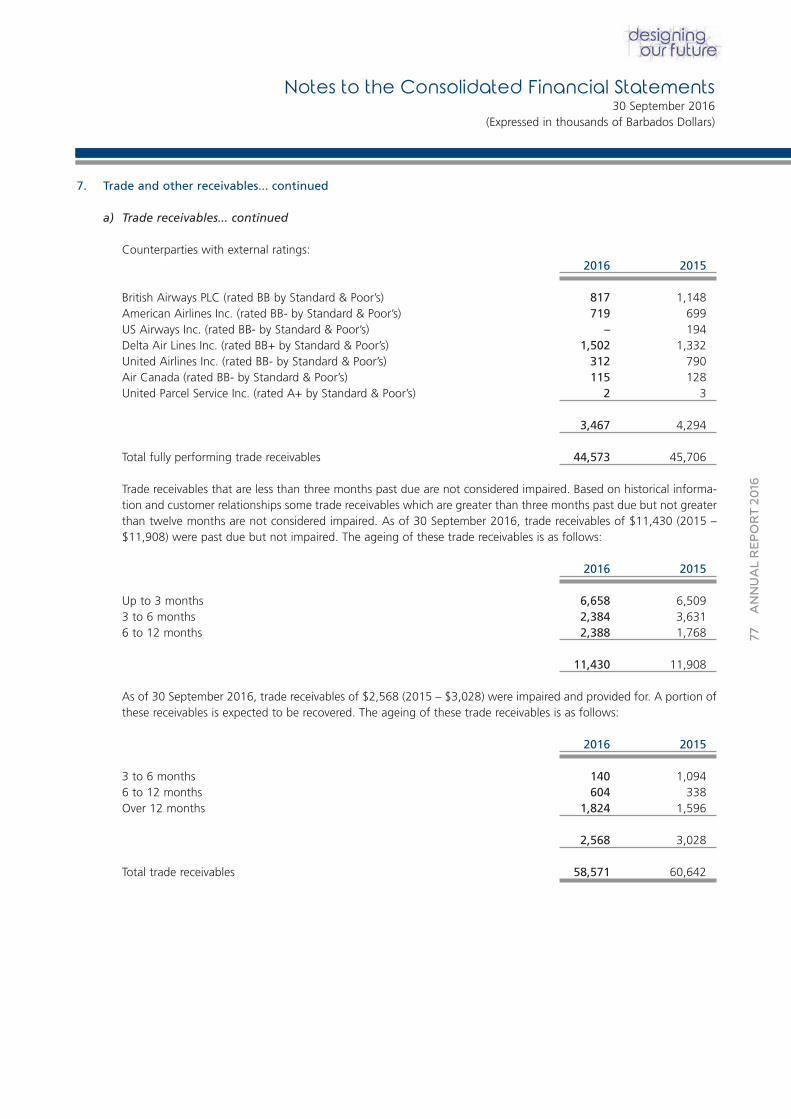
77ANNUAL REPORT 20
16
7. Trade and other receivables... continued
a) Trade receivables... continued
Counterparties with external ratings:2016 2015
British Airways PLC (rated BB by Standard & Poor’s) 817 1,148American Airlines Inc. (rated BB- by Standard & Poor’s) 719 699US Airways Inc. (rated BB- by Standard & Poor’s) – 194Delta Air Lines Inc. (rated BB+ by Standard & Poor’s) 1,502 1,332United Airlines Inc. (rated BB- by Standard & Poor’s) 312 790Air Canada (rated BB- by Standard & Poor’s) 115 128United Parcel Service Inc. (rated A+ by Standard & Poor’s) 2 3
3,467 4,294
Total fully performing trade receivables 44,573 45,706
Trade receivables that are less than three months past due are not considered impaired. Based on historical informa-tion and customer relationships some trade receivables which are greater than three months past due but not greaterthan twelve months are not considered impaired. As of 30 September 2016, trade receivables of $11,430 (2015 –$11,908) were past due but not impaired. The ageing of these trade receivables is as follows:
2016 2015
Up to 3 months 6,658 6,5093 to 6 months 2,384 3,6316 to 12 months 2,388 1,768
11,430 11,908
As of 30 September 2016, trade receivables of $2,568 (2015 – $3,028) were impaired and provided for. A portion ofthese receivables is expected to be recovered. The ageing of these trade receivables is as follows:
2016 2015
3 to 6 months 140 1,0946 to 12 months 604 338Over 12 months 1,824 1,596
2,568 3,028
Total trade receivables 58,571 60,642
Notes to the Consolidated Financial Statements30 September 2016
(Expressed in thousands of Barbados Dollars)
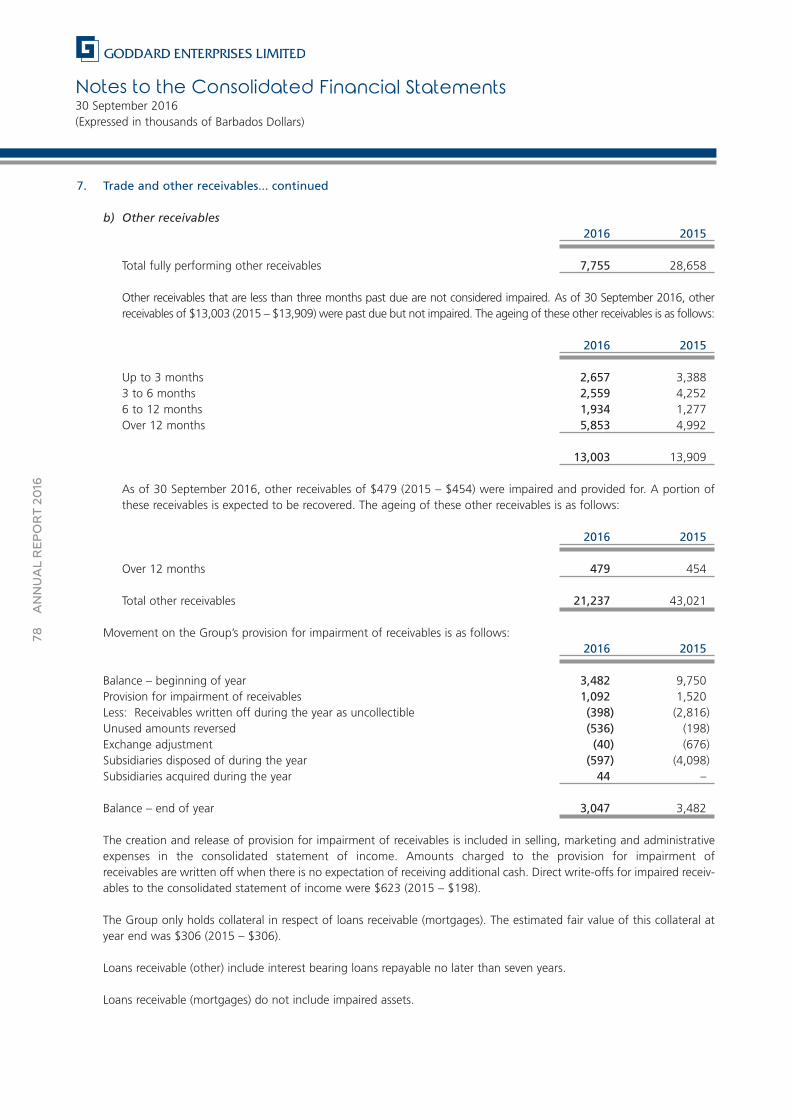
Notes to the Consolidated Financial Statements30 September 2016(Expressed in thousands of Barbados Dollars)
78ANNUAL REPORT 20
16
7. Trade and other receivables... continued
b) Other receivables2016 2015
Total fully performing other receivables 7,755 28,658
Other receivables that are less than three months past due are not considered impaired. As of 30 September 2016, otherreceivables of $13,003 (2015 – $13,909) were past due but not impaired. The ageing of these other receivables is as follows:
2016 2015
Up to 3 months 2,657 3,3883 to 6 months 2,559 4,2526 to 12 months 1,934 1,277Over 12 months 5,853 4,992
13,003 13,909
As of 30 September 2016, other receivables of $479 (2015 – $454) were impaired and provided for. A portion ofthese receivables is expected to be recovered. The ageing of these other receivables is as follows:
2016 2015
Over 12 months 479 454
Total other receivables 21,237 43,021
Movement on the Group’s provision for impairment of receivables is as follows:2016 2015
Balance – beginning of year 3,482 9,750Provision for impairment of receivables 1,092 1,520Less: Receivables written off during the year as uncollectible (398) (2,816)Unused amounts reversed (536) (198)Exchange adjustment (40) (676)Subsidiaries disposed of during the year (597) (4,098)Subsidiaries acquired during the year 44 –
Balance – end of year 3,047 3,482
The creation and release of provision for impairment of receivables is included in selling, marketing and administrativeexpenses in the consolidated statement of income. Amounts charged to the provision for impairment of receivables are written off when there is no expectation of receiving additional cash. Direct write-offs for impaired receiv-ables to the consolidated statement of income were $623 (2015 – $198).
The Group only holds collateral in respect of loans receivable (mortgages). The estimated fair value of this collateral atyear end was $306 (2015 – $306).
Loans receivable (other) include interest bearing loans repayable no later than seven years.
Loans receivable (mortgages) do not include impaired assets.
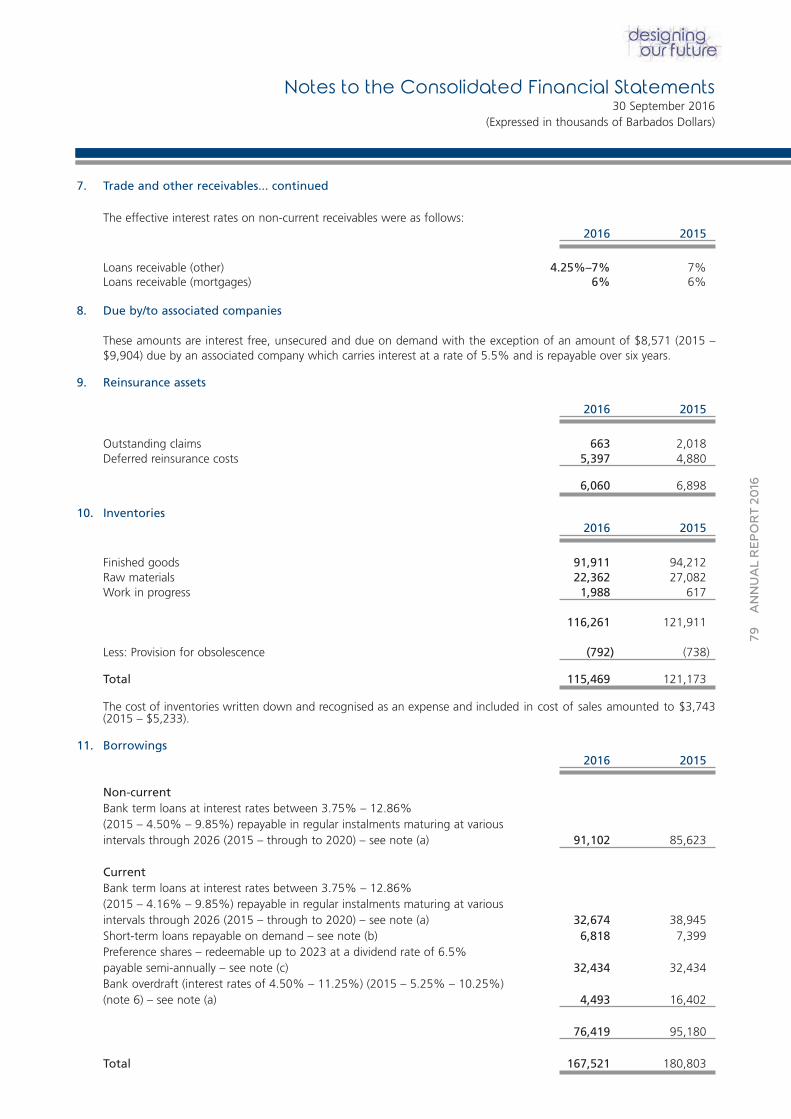
79ANNUAL REPORT 20
16
7. Trade and other receivables... continued
The effective interest rates on non-current receivables were as follows: 2016 2015
Loans receivable (other) 4.25%–7% 7%Loans receivable (mortgages) 6% 6%
8. Due by/to associated companies
These amounts are interest free, unsecured and due on demand with the exception of an amount of $8,571 (2015 –$9,904) due by an associated company which carries interest at a rate of 5.5% and is repayable over six years.
9. Reinsurance assets
2016 2015
Outstanding claims 663 2,018Deferred reinsurance costs 5,397 4,880
6,060 6,898
10. Inventories2016 2015
Finished goods 91,911 94,212Raw materials 22,362 27,082Work in progress 1,988 617
116,261 121,911
Less: Provision for obsolescence (792) (738)
Total 115,469 121,173
The cost of inventories written down and recognised as an expense and included in cost of sales amounted to $3,743(2015 – $5,233).
11. Borrowings2016 2015
Non-currentBank term loans at interest rates between 3.75% – 12.86% (2015 – 4.50% – 9.85%) repayable in regular instalments maturing at variousintervals through 2026 (2015 – through to 2020) – see note (a) 91,102 85,623
CurrentBank term loans at interest rates between 3.75% – 12.86%(2015 – 4.16% – 9.85%) repayable in regular instalments maturing at variousintervals through 2026 (2015 – through to 2020) – see note (a) 32,674 38,945Short-term loans repayable on demand – see note (b) 6,818 7,399Preference shares – redeemable up to 2023 at a dividend rate of 6.5% payable semi-annually – see note (c) 32,434 32,434Bank overdraft (interest rates of 4.50% – 11.25%) (2015 – 5.25% – 10.25%)(note 6) – see note (a) 4,493 16,402
76,419 95,180
Total 167,521 180,803
Notes to the Consolidated Financial Statements30 September 2016
(Expressed in thousands of Barbados Dollars)
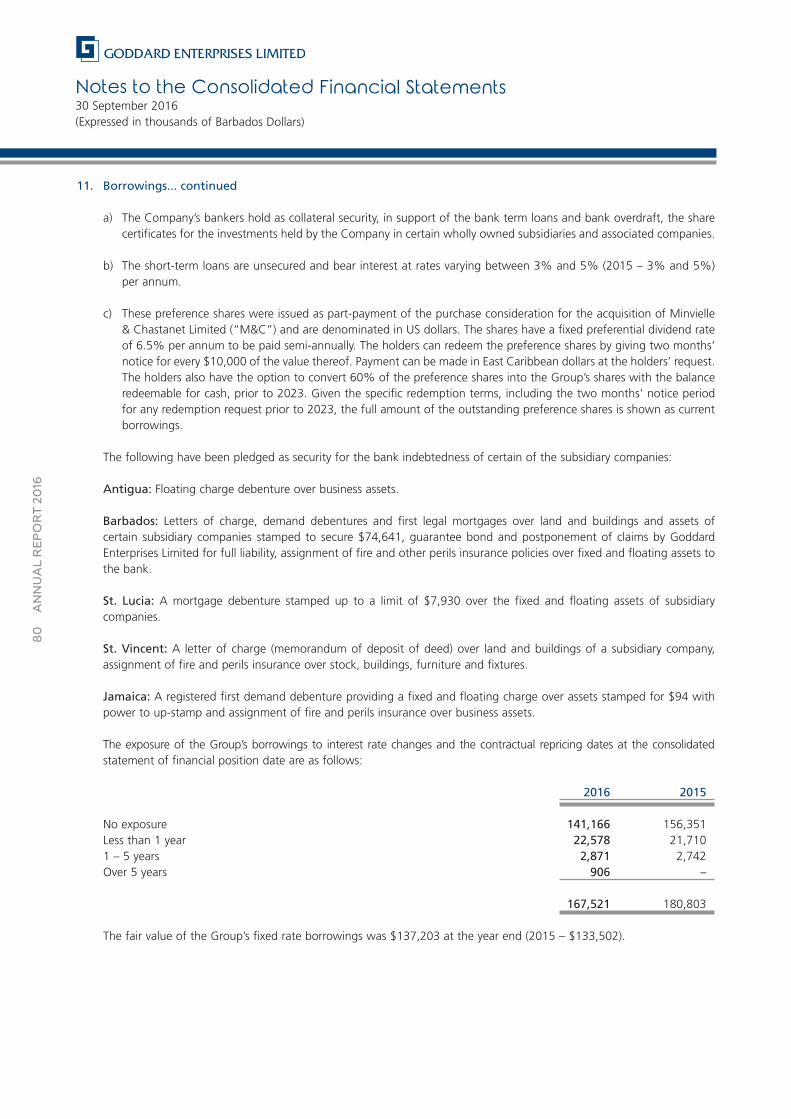
Notes to the Consolidated Financial Statements30 September 2016(Expressed in thousands of Barbados Dollars)
80
ANNUAL REPORT 20
16
11. Borrowings... continued
a) The Company’s bankers hold as collateral security, in support of the bank term loans and bank overdraft, the sharecertificates for the investments held by the Company in certain wholly owned subsidiaries and associated companies.
b) The short-term loans are unsecured and bear interest at rates varying between 3% and 5% (2015 – 3% and 5%)per annum.
c) These preference shares were issued as part-payment of the purchase consideration for the acquisition of Minvielle& Chastanet Limited (“M&C”) and are denominated in US dollars. The shares have a fixed preferential dividend rateof 6.5% per annum to be paid semi-annually. The holders can redeem the preference shares by giving two months’notice for every $10,000 of the value thereof. Payment can be made in East Caribbean dollars at the holders’ request.The holders also have the option to convert 60% of the preference shares into the Group’s shares with the balanceredeemable for cash, prior to 2023. Given the specific redemption terms, including the two months’ notice periodfor any redemption request prior to 2023, the full amount of the outstanding preference shares is shown as current borrowings.
The following have been pledged as security for the bank indebtedness of certain of the subsidiary companies:
Antigua: Floating charge debenture over business assets.
Barbados: Letters of charge, demand debentures and first legal mortgages over land and buildings and assets of certain subsidiary companies stamped to secure $74,641, guarantee bond and postponement of claims by GoddardEnterprises Limited for full liability, assignment of fire and other perils insurance policies over fixed and floating assets tothe bank.
St. Lucia: A mortgage debenture stamped up to a limit of $7,930 over the fixed and floating assets of subsidiary companies.
St. Vincent: A letter of charge (memorandum of deposit of deed) over land and buildings of a subsidiary company,assignment of fire and perils insurance over stock, buildings, furniture and fixtures.
Jamaica: A registered first demand debenture providing a fixed and floating charge over assets stamped for $94 withpower to up-stamp and assignment of fire and perils insurance over business assets.
The exposure of the Group’s borrowings to interest rate changes and the contractual repricing dates at the consolidatedstatement of financial position date are as follows:
2016 2015
No exposure 141,166 156,351Less than 1 year 22,578 21,7101 – 5 years 2,871 2,742Over 5 years 906 –
167,521 180,803
The fair value of the Group’s fixed rate borrowings was $137,203 at the year end (2015 – $133,502).
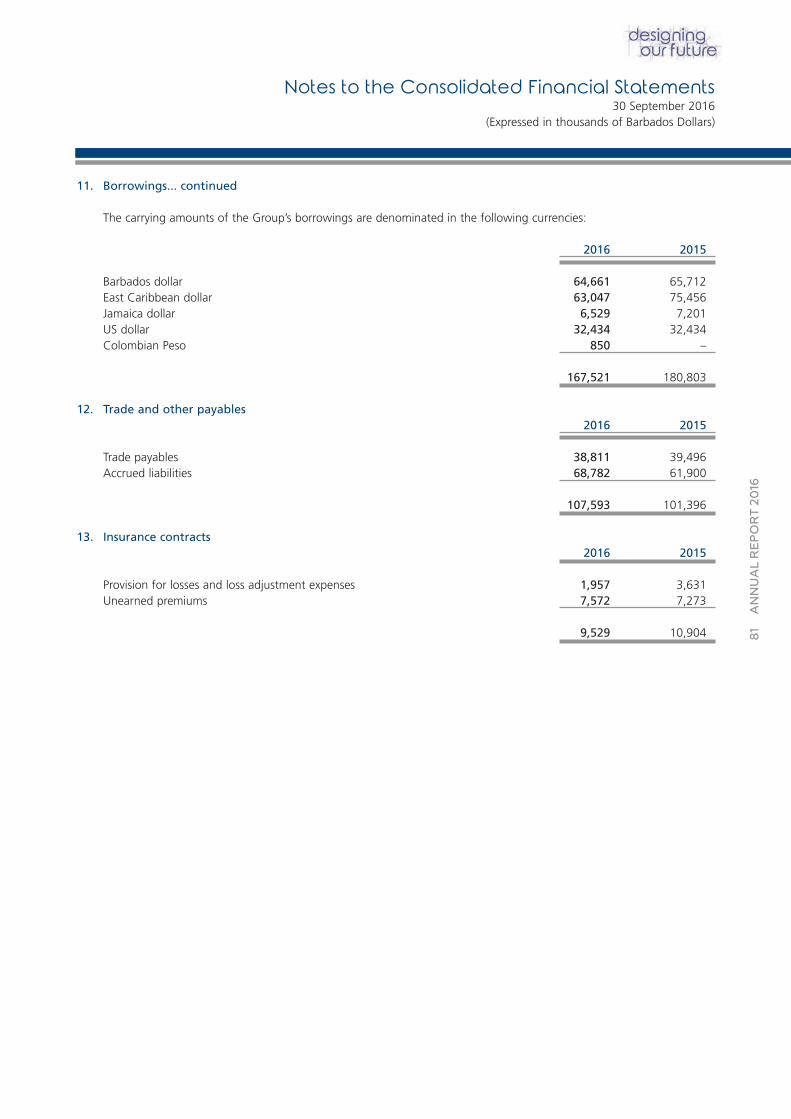
81
ANNUAL REPORT 20
16
11. Borrowings... continued
The carrying amounts of the Group’s borrowings are denominated in the following currencies:
2016 2015
Barbados dollar 64,661 65,712East Caribbean dollar 63,047 75,456Jamaica dollar 6,529 7,201US dollar 32,434 32,434Colombian Peso 850 –
167,521 180,803
12. Trade and other payables2016 2015
Trade payables 38,811 39,496Accrued liabilities 68,782 61,900
107,593 101,396
13. Insurance contracts2016 2015
Provision for losses and loss adjustment expenses 1,957 3,631Unearned premiums 7,572 7,273
9,529 10,904
Notes to the Consolidated Financial Statements30 September 2016
(Expressed in thousands of Barbados Dollars)
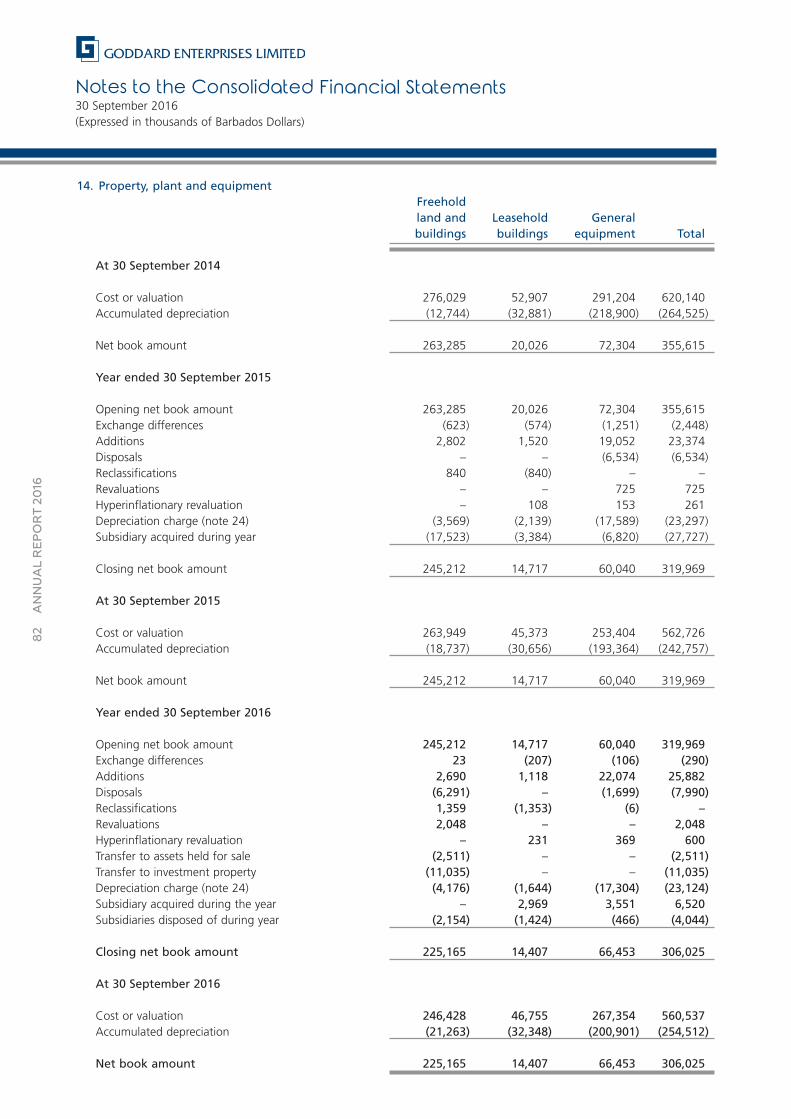
Notes to the Consolidated Financial Statements30 September 2016(Expressed in thousands of Barbados Dollars)
82
ANNUAL REPORT 20
16
14. Property, plant and equipmentFreeholdland and Leasehold Generalbuildings buildings equipment Total
At 30 September 2014
Cost or valuation 276,029 52,907 291,204 620,140Accumulated depreciation (12,744) (32,881) (218,900) (264,525)
Net book amount 263,285 20,026 72,304 355,615
Year ended 30 September 2015
Opening net book amount 263,285 20,026 72,304 355,615Exchange differences (623) (574) (1,251) (2,448)Additions 2,802 1,520 19,052 23,374Disposals – – (6,534) (6,534)Reclassifications 840 (840) – –Revaluations – – 725 725Hyperinflationary revaluation – 108 153 261Depreciation charge (note 24) (3,569) (2,139) (17,589) (23,297)Subsidiary acquired during year (17,523) (3,384) (6,820) (27,727)
Closing net book amount 245,212 14,717 60,040 319,969
At 30 September 2015
Cost or valuation 263,949 45,373 253,404 562,726Accumulated depreciation (18,737) (30,656) (193,364) (242,757)
Net book amount 245,212 14,717 60,040 319,969
Year ended 30 September 2016
Opening net book amount 245,212 14,717 60,040 319,969Exchange differences 23 (207) (106) (290)Additions 2,690 1,118 22,074 25,882Disposals (6,291) – (1,699) (7,990)Reclassifications 1,359 (1,353) (6) –Revaluations 2,048 – – 2,048Hyperinflationary revaluation – 231 369 600Transfer to assets held for sale (2,511) – – (2,511)Transfer to investment property (11,035) – – (11,035)Depreciation charge (note 24) (4,176) (1,644) (17,304) (23,124)Subsidiary acquired during the year – 2,969 3,551 6,520Subsidiaries disposed of during year (2,154) (1,424) (466) (4,044)
Closing net book amount 225,165 14,407 66,453 306,025
At 30 September 2016
Cost or valuation 246,428 46,755 267,354 560,537Accumulated depreciation (21,263) (32,348) (200,901) (254,512)
Net book amount 225,165 14,407 66,453 306,025
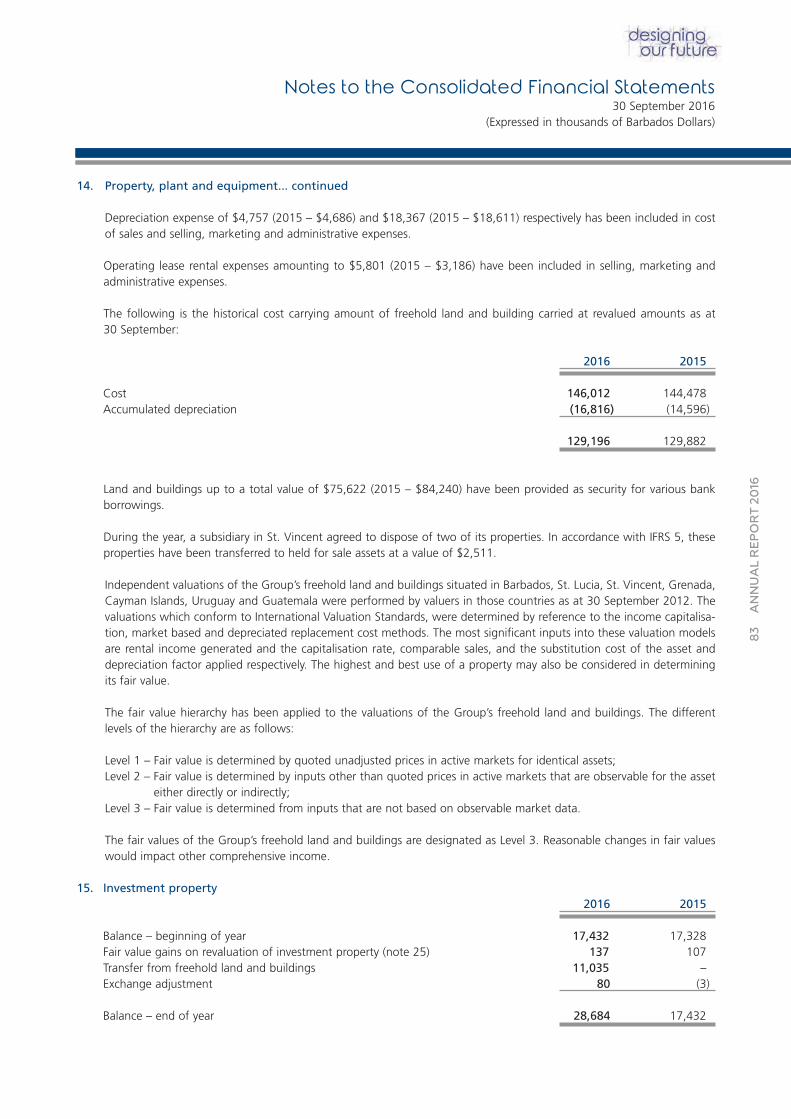
83
ANNUAL REPORT 20
16
14. Property, plant and equipment... continued
Depreciation expense of $4,757 (2015 – $4,686) and $18,367 (2015 – $18,611) respectively has been included in costof sales and selling, marketing and administrative expenses.
Operating lease rental expenses amounting to $5,801 (2015 – $3,186) have been included in selling, marketing andadministrative expenses.
The following is the historical cost carrying amount of freehold land and building carried at revalued amounts as at 30 September:
2016 2015
Cost 146,012 144,478Accumulated depreciation (16,816) (14,596)
129,196 129,882
Land and buildings up to a total value of $75,622 (2015 – $84,240) have been provided as security for various bank borrowings.
During the year, a subsidiary in St. Vincent agreed to dispose of two of its properties. In accordance with IFRS 5, theseproperties have been transferred to held for sale assets at a value of $2,511.
Independent valuations of the Group’s freehold land and buildings situated in Barbados, St. Lucia, St. Vincent, Grenada,Cayman Islands, Uruguay and Guatemala were performed by valuers in those countries as at 30 September 2012. Thevaluations which conform to International Valuation Standards, were determined by reference to the income capitalisa-tion, market based and depreciated replacement cost methods. The most significant inputs into these valuation modelsare rental income generated and the capitalisation rate, comparable sales, and the substitution cost of the asset anddepreciation factor applied respectively. The highest and best use of a property may also be considered in determiningits fair value.
The fair value hierarchy has been applied to the valuations of the Group’s freehold land and buildings. The different levels of the hierarchy are as follows:
Level 1 – Fair value is determined by quoted unadjusted prices in active markets for identical assets;Level 2 – Fair value is determined by inputs other than quoted prices in active markets that are observable for the asset
either directly or indirectly;Level 3 – Fair value is determined from inputs that are not based on observable market data.
The fair values of the Group’s freehold land and buildings are designated as Level 3. Reasonable changes in fair valueswould impact other comprehensive income.
15. Investment property2016 2015
Balance – beginning of year 17,432 17,328Fair value gains on revaluation of investment property (note 25) 137 107Transfer from freehold land and buildings 11,035 –Exchange adjustment 80 (3)
Balance – end of year 28,684 17,432
Notes to the Consolidated Financial Statements30 September 2016
(Expressed in thousands of Barbados Dollars)
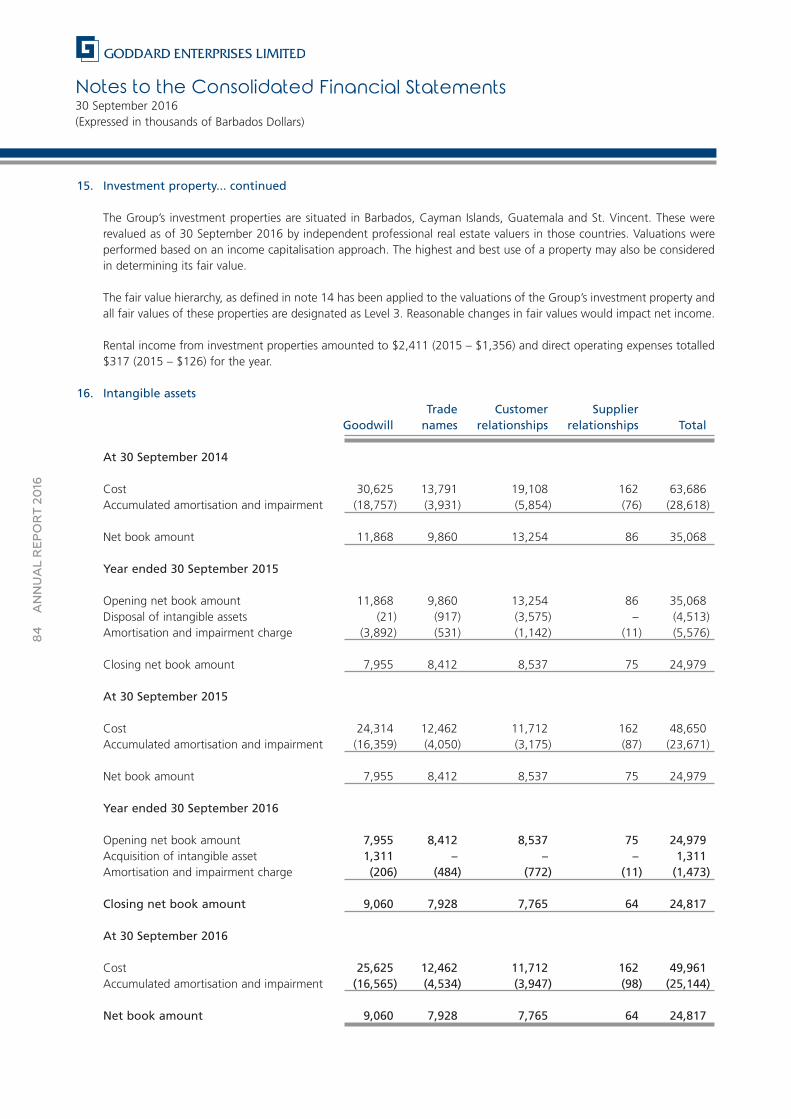
Notes to the Consolidated Financial Statements30 September 2016(Expressed in thousands of Barbados Dollars)
84
ANNUAL REPORT 20
16
15. Investment property... continued
The Group’s investment properties are situated in Barbados, Cayman Islands, Guatemala and St. Vincent. These wererevalued as of 30 September 2016 by independent professional real estate valuers in those countries. Valuations wereperformed based on an income capitalisation approach. The highest and best use of a property may also be consideredin determining its fair value.
The fair value hierarchy, as defined in note 14 has been applied to the valuations of the Group’s investment property andall fair values of these properties are designated as Level 3. Reasonable changes in fair values would impact net income.
Rental income from investment properties amounted to $2,411 (2015 – $1,356) and direct operating expenses totalled$317 (2015 – $126) for the year.
16. Intangible assetsTrade Customer Supplier
Goodwill names relationships relationships Total
At 30 September 2014
Cost 30,625 13,791 19,108 162 63,686Accumulated amortisation and impairment (18,757) (3,931) (5,854) (76) (28,618)
Net book amount 11,868 9,860 13,254 86 35,068
Year ended 30 September 2015
Opening net book amount 11,868 9,860 13,254 86 35,068Disposal of intangible assets (21) (917) (3,575) – (4,513)Amortisation and impairment charge (3,892) (531) (1,142) (11) (5,576)
Closing net book amount 7,955 8,412 8,537 75 24,979
At 30 September 2015
Cost 24,314 12,462 11,712 162 48,650Accumulated amortisation and impairment (16,359) (4,050) (3,175) (87) (23,671)
Net book amount 7,955 8,412 8,537 75 24,979
Year ended 30 September 2016
Opening net book amount 7,955 8,412 8,537 75 24,979Acquisition of intangible asset 1,311 – – – 1,311Amortisation and impairment charge (206) (484) (772) (11) (1,473)
Closing net book amount 9,060 7,928 7,765 64 24,817
At 30 September 2016
Cost 25,625 12,462 11,712 162 49,961Accumulated amortisation and impairment (16,565) (4,534) (3,947) (98) (25,144)
Net book amount 9,060 7,928 7,765 64 24,817
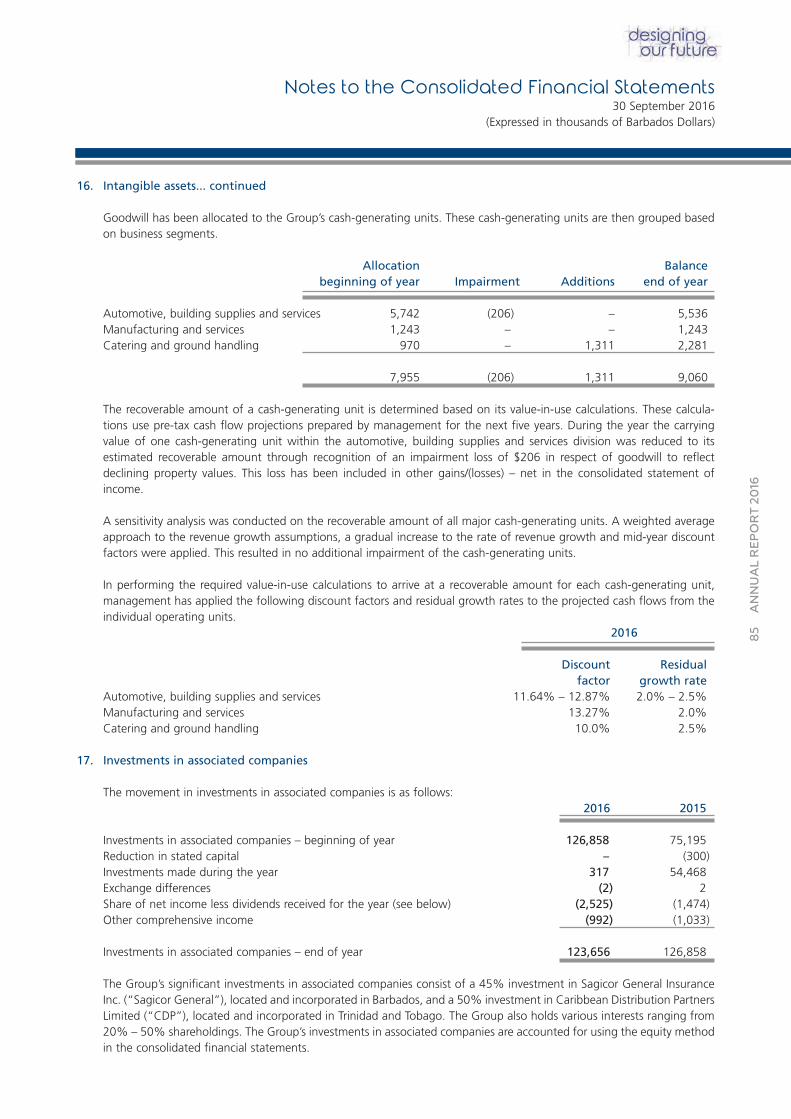
85
ANNUAL REPORT 20
16
16. Intangible assets... continued
Goodwill has been allocated to the Group’s cash-generating units. These cash-generating units are then grouped basedon business segments.
Allocation Balancebeginning of year Impairment Additions end of year
Automotive, building supplies and services 5,742 (206) – 5,536Manufacturing and services 1,243 – – 1,243Catering and ground handling 970 – 1,311 2,281
7,955 (206) 1,311 9,060
The recoverable amount of a cash-generating unit is determined based on its value-in-use calculations. These calcula-tions use pre-tax cash flow projections prepared by management for the next five years. During the year the carryingvalue of one cash-generating unit within the automotive, building supplies and services division was reduced to its estimated recoverable amount through recognition of an impairment loss of $206 in respect of goodwill to reflect declining property values. This loss has been included in other gains/(losses) – net in the consolidated statement ofincome.
A sensitivity analysis was conducted on the recoverable amount of all major cash-generating units. A weighted averageapproach to the revenue growth assumptions, a gradual increase to the rate of revenue growth and mid-year discountfactors were applied. This resulted in no additional impairment of the cash-generating units.
In performing the required value-in-use calculations to arrive at a recoverable amount for each cash-generating unit, management has applied the following discount factors and residual growth rates to the projected cash flows from the individual operating units.
2016
Discount Residualfactor growth rate
Automotive, building supplies and services 11.64% – 12.87% 2.0% – 2.5%Manufacturing and services 13.27% 2.0%Catering and ground handling 10.0% 2.5%
17. Investments in associated companies
The movement in investments in associated companies is as follows:2016 2015
Investments in associated companies – beginning of year 126,858 75,195Reduction in stated capital – (300)Investments made during the year 317 54,468Exchange differences (2) 2Share of net income less dividends received for the year (see below) (2,525) (1,474)Other comprehensive income (992) (1,033)
Investments in associated companies – end of year 123,656 126,858
The Group’s significant investments in associated companies consist of a 45% investment in Sagicor General InsuranceInc. (“Sagicor General”), located and incorporated in Barbados, and a 50% investment in Caribbean Distribution PartnersLimited (“CDP”), located and incorporated in Trinidad and Tobago. The Group also holds various interests ranging from20% – 50% shareholdings. The Group’s investments in associated companies are accounted for using the equity methodin the consolidated financial statements.
Notes to the Consolidated Financial Statements30 September 2016
(Expressed in thousands of Barbados Dollars)
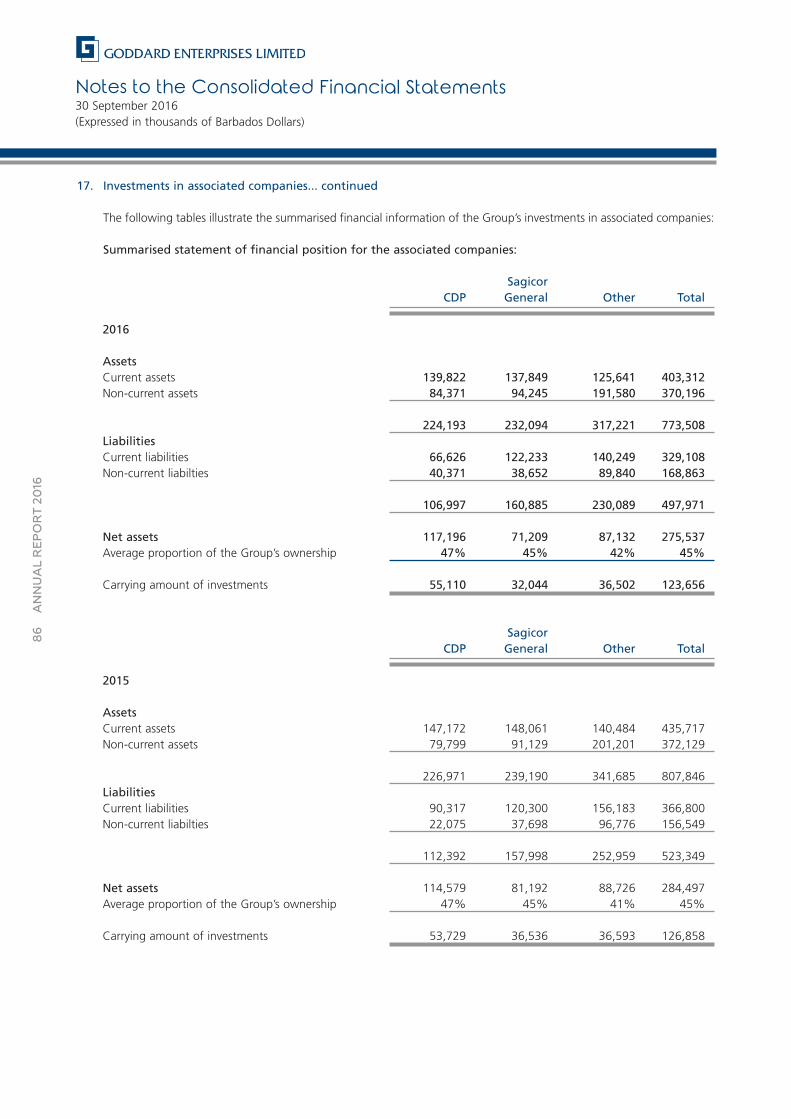
Notes to the Consolidated Financial Statements30 September 2016(Expressed in thousands of Barbados Dollars)
86
ANNUAL REPORT 20
16
17. Investments in associated companies... continued
The following tables illustrate the summarised financial information of the Group’s investments in associated companies:
Summarised statement of financial position for the associated companies:
SagicorCDP General Other Total
2016
AssetsCurrent assets 139,822 137,849 125,641 403,312Non-current assets 84,371 94,245 191,580 370,196
224,193 232,094 317,221 773,508LiabilitiesCurrent liabilities 66,626 122,233 140,249 329,108Non-current liabilties 40,371 38,652 89,840 168,863
106,997 160,885 230,089 497,971
Net assets 117,196 71,209 87,132 275,537Average proportion of the Group’s ownership 47% 45% 42% 45%
Carrying amount of investments 55,110 32,044 36,502 123,656
SagicorCDP General Other Total
2015
AssetsCurrent assets 147,172 148,061 140,484 435,717Non-current assets 79,799 91,129 201,201 372,129
226,971 239,190 341,685 807,846LiabilitiesCurrent liabilities 90,317 120,300 156,183 366,800Non-current liabilties 22,075 37,698 96,776 156,549
112,392 157,998 252,959 523,349
Net assets 114,579 81,192 88,726 284,497Average proportion of the Group’s ownership 47% 45% 41% 45%
Carrying amount of investments 53,729 36,536 36,593 126,858
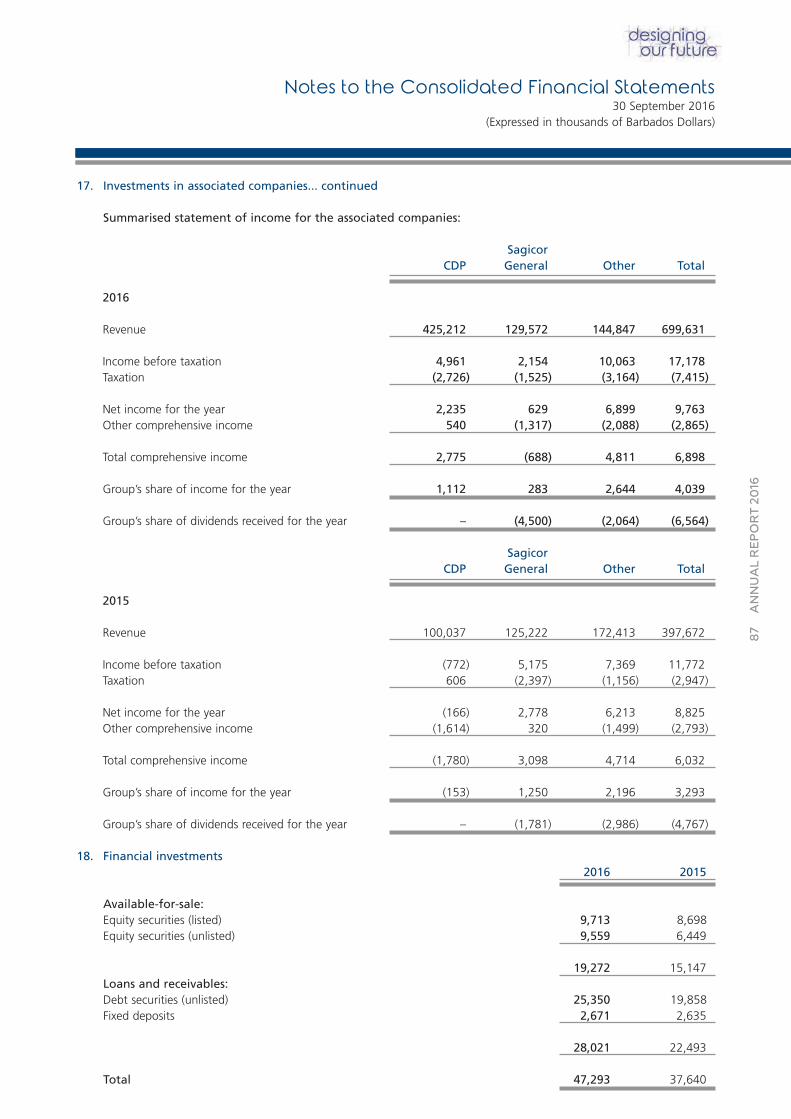
87
ANNUAL REPORT 20
16
17. Investments in associated companies... continued
Summarised statement of income for the associated companies:
SagicorCDP General Other Total
2016
Revenue 425,212 129,572 144,847 699,631
Income before taxation 4,961 2,154 10,063 17,178Taxation (2,726) (1,525) (3,164) (7,415)
Net income for the year 2,235 629 6,899 9,763Other comprehensive income 540 (1,317) (2,088) (2,865)
Total comprehensive income 2,775 (688) 4,811 6,898
Group’s share of income for the year 1,112 283 2,644 4,039
Group’s share of dividends received for the year – (4,500) (2,064) (6,564)
SagicorCDP General Other Total
2015
Revenue 100,037 125,222 172,413 397,672
Income before taxation (772) 5,175 7,369 11,772Taxation 606 (2,397) (1,156) (2,947)
Net income for the year (166) 2,778 6,213 8,825Other comprehensive income (1,614) 320 (1,499) (2,793)
Total comprehensive income (1,780) 3,098 4,714 6,032
Group’s share of income for the year (153) 1,250 2,196 3,293
Group’s share of dividends received for the year – (1,781) (2,986) (4,767)
18. Financial investments2016 2015
Available-for-sale:Equity securities (listed) 9,713 8,698Equity securities (unlisted) 9,559 6,449
19,272 15,147Loans and receivables:Debt securities (unlisted) 25,350 19,858Fixed deposits 2,671 2,635
28,021 22,493
Total 47,293 37,640
Notes to the Consolidated Financial Statements30 September 2016
(Expressed in thousands of Barbados Dollars)
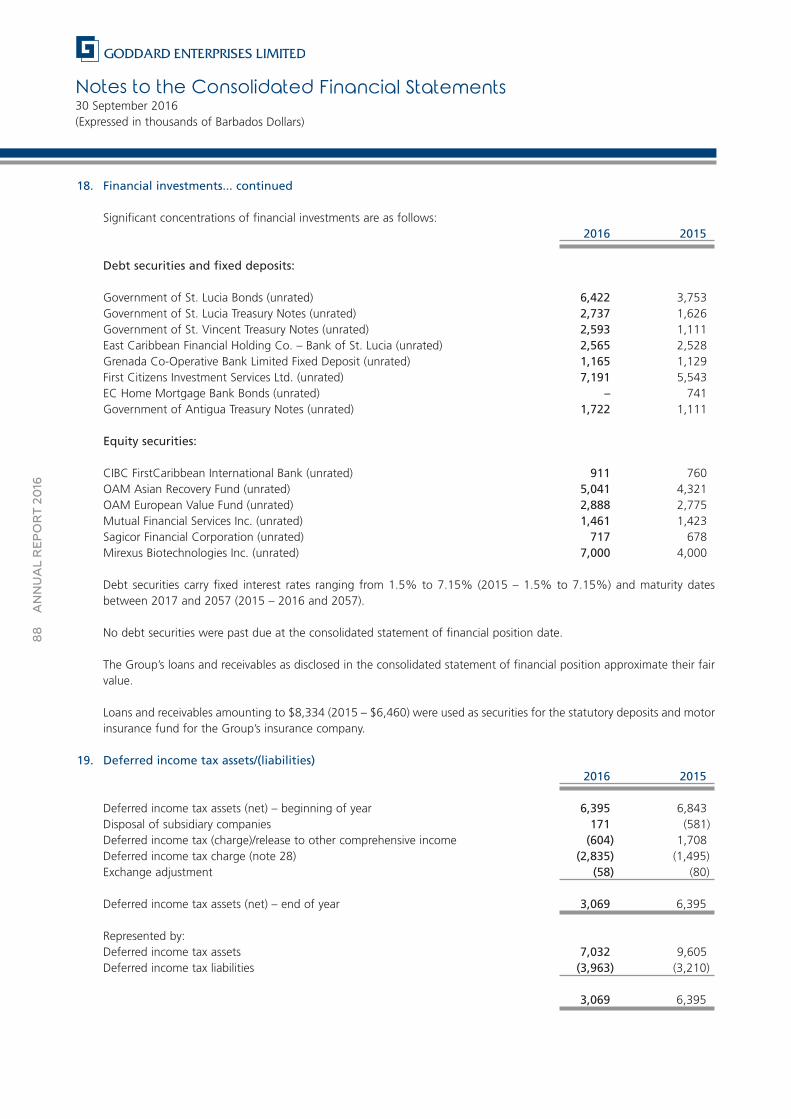
Notes to the Consolidated Financial Statements30 September 2016(Expressed in thousands of Barbados Dollars)
88
ANNUAL REPORT 20
16
18. Financial investments... continued
Significant concentrations of financial investments are as follows:2016 2015
Debt securities and fixed deposits:
Government of St. Lucia Bonds (unrated) 6,422 3,753Government of St. Lucia Treasury Notes (unrated) 2,737 1,626Government of St. Vincent Treasury Notes (unrated) 2,593 1,111East Caribbean Financial Holding Co. – Bank of St. Lucia (unrated) 2,565 2,528Grenada Co-Operative Bank Limited Fixed Deposit (unrated) 1,165 1,129First Citizens Investment Services Ltd. (unrated) 7,191 5,543EC Home Mortgage Bank Bonds (unrated) – 741Government of Antigua Treasury Notes (unrated) 1,722 1,111
Equity securities:
CIBC FirstCaribbean International Bank (unrated) 911 760OAM Asian Recovery Fund (unrated) 5,041 4,321OAM European Value Fund (unrated) 2,888 2,775Mutual Financial Services Inc. (unrated) 1,461 1,423Sagicor Financial Corporation (unrated) 717 678Mirexus Biotechnologies Inc. (unrated) 7,000 4,000
Debt securities carry fixed interest rates ranging from 1.5% to 7.15% (2015 – 1.5% to 7.15%) and maturity datesbetween 2017 and 2057 (2015 – 2016 and 2057).
No debt securities were past due at the consolidated statement of financial position date.
The Group’s loans and receivables as disclosed in the consolidated statement of financial position approximate their fairvalue.
Loans and receivables amounting to $8,334 (2015 – $6,460) were used as securities for the statutory deposits and motorinsurance fund for the Group’s insurance company.
19. Deferred income tax assets/(liabilities)2016 2015
Deferred income tax assets (net) – beginning of year 6,395 6,843Disposal of subsidiary companies 171 (581)Deferred income tax (charge)/release to other comprehensive income (604) 1,708Deferred income tax charge (note 28) (2,835) (1,495)Exchange adjustment (58) (80)
Deferred income tax assets (net) – end of year 3,069 6,395
Represented by:Deferred income tax assets 7,032 9,605Deferred income tax liabilities (3,963) (3,210)
3,069 6,395
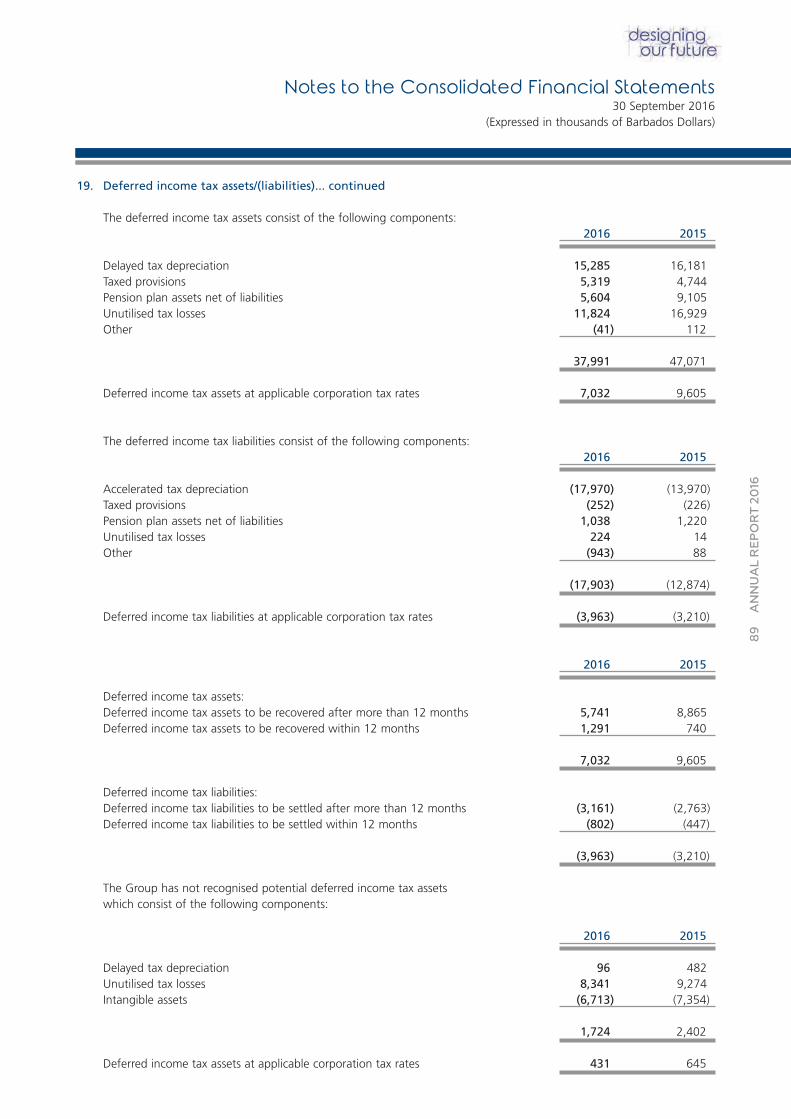
89
ANNUAL REPORT 20
16
19. Deferred income tax assets/(liabilities)... continued
The deferred income tax assets consist of the following components:2016 2015
Delayed tax depreciation 15,285 16,181Taxed provisions 5,319 4,744Pension plan assets net of liabilities 5,604 9,105Unutilised tax losses 11,824 16,929Other (41) 112
37,991 47,071
Deferred income tax assets at applicable corporation tax rates 7,032 9,605
The deferred income tax liabilities consist of the following components:2016 2015
Accelerated tax depreciation (17,970) (13,970)Taxed provisions (252) (226)Pension plan assets net of liabilities 1,038 1,220Unutilised tax losses 224 14Other (943) 88
(17,903) (12,874)
Deferred income tax liabilities at applicable corporation tax rates (3,963) (3,210)
2016 2015
Deferred income tax assets:Deferred income tax assets to be recovered after more than 12 months 5,741 8,865Deferred income tax assets to be recovered within 12 months 1,291 740
7,032 9,605
Deferred income tax liabilities:Deferred income tax liabilities to be settled after more than 12 months (3,161) (2,763)Deferred income tax liabilities to be settled within 12 months (802) (447)
(3,963) (3,210)
The Group has not recognised potential deferred income tax assetswhich consist of the following components:
2016 2015
Delayed tax depreciation 96 482Unutilised tax losses 8,341 9,274Intangible assets (6,713) (7,354)
1,724 2,402
Deferred income tax assets at applicable corporation tax rates 431 645
Notes to the Consolidated Financial Statements30 September 2016
(Expressed in thousands of Barbados Dollars)
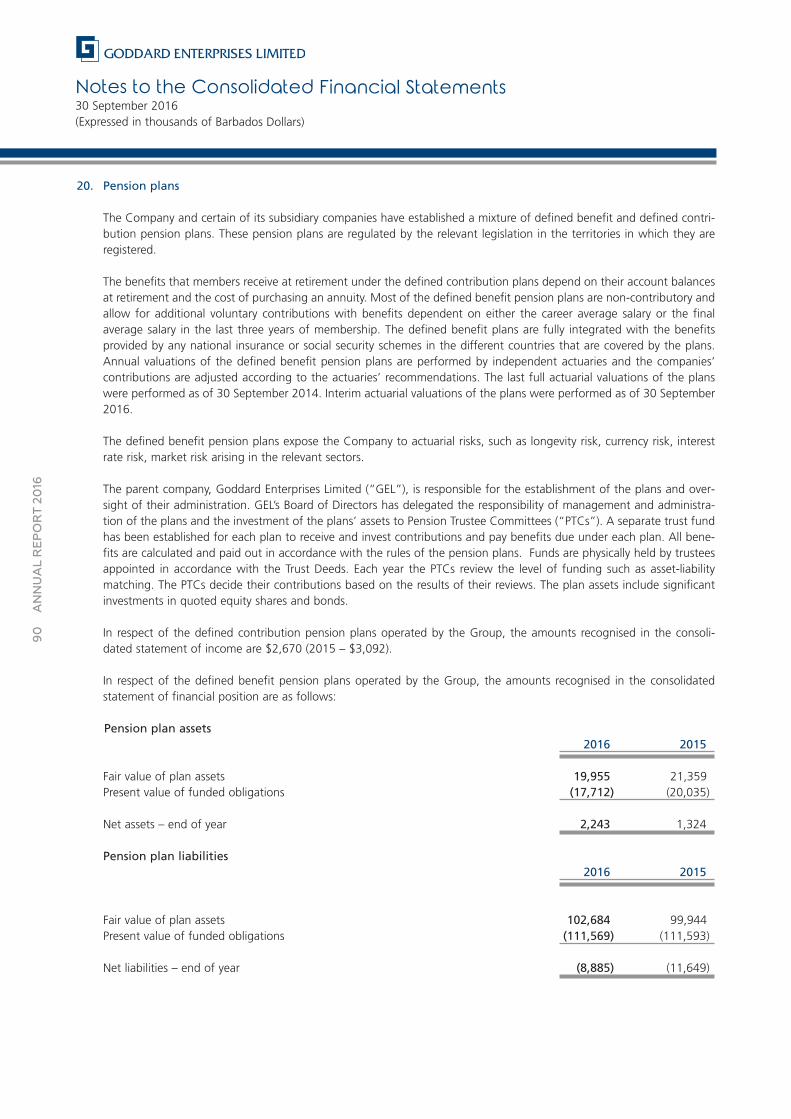
Notes to the Consolidated Financial Statements30 September 2016(Expressed in thousands of Barbados Dollars)
90
ANNUAL REPORT 20
16
20. Pension plans
The Company and certain of its subsidiary companies have established a mixture of defined benefit and defined contri-bution pension plans. These pension plans are regulated by the relevant legislation in the territories in which they areregistered.
The benefits that members receive at retirement under the defined contribution plans depend on their account balancesat retirement and the cost of purchasing an annuity. Most of the defined benefit pension plans are non-contributory andallow for additional voluntary contributions with benefits dependent on either the career average salary or the final average salary in the last three years of membership. The defined benefit plans are fully integrated with the benefits provided by any national insurance or social security schemes in the different countries that are covered by the plans.Annual valuations of the defined benefit pension plans are performed by independent actuaries and the companies’ contributions are adjusted according to the actuaries’ recommendations. The last full actuarial valuations of the planswere performed as of 30 September 2014. Interim actuarial valuations of the plans were performed as of 30 September2016.
The defined benefit pension plans expose the Company to actuarial risks, such as longevity risk, currency risk, interestrate risk, market risk arising in the relevant sectors.
The parent company, Goddard Enterprises Limited (“GEL”), is responsible for the establishment of the plans and over-sight of their administration. GEL’s Board of Directors has delegated the responsibility of management and administra-tion of the plans and the investment of the plans’ assets to Pension Trustee Committees (“PTCs”). A separate trust fundhas been established for each plan to receive and invest contributions and pay benefits due under each plan. All bene-fits are calculated and paid out in accordance with the rules of the pension plans. Funds are physically held by trusteesappointed in accordance with the Trust Deeds. Each year the PTCs review the level of funding such as asset-liabilitymatching. The PTCs decide their contributions based on the results of their reviews. The plan assets include significantinvestments in quoted equity shares and bonds.
In respect of the defined contribution pension plans operated by the Group, the amounts recognised in the consoli-dated statement of income are $2,670 (2015 – $3,092).
In respect of the defined benefit pension plans operated by the Group, the amounts recognised in the consolidated statement of financial position are as follows:
Pension plan assets2016 2015
Fair value of plan assets 19,955 21,359Present value of funded obligations (17,712) (20,035)
Net assets – end of year 2,243 1,324
Pension plan liabilities2016 2015
Fair value of plan assets 102,684 99,944Present value of funded obligations (111,569) (111,593)
Net liabilities – end of year (8,885) (11,649)
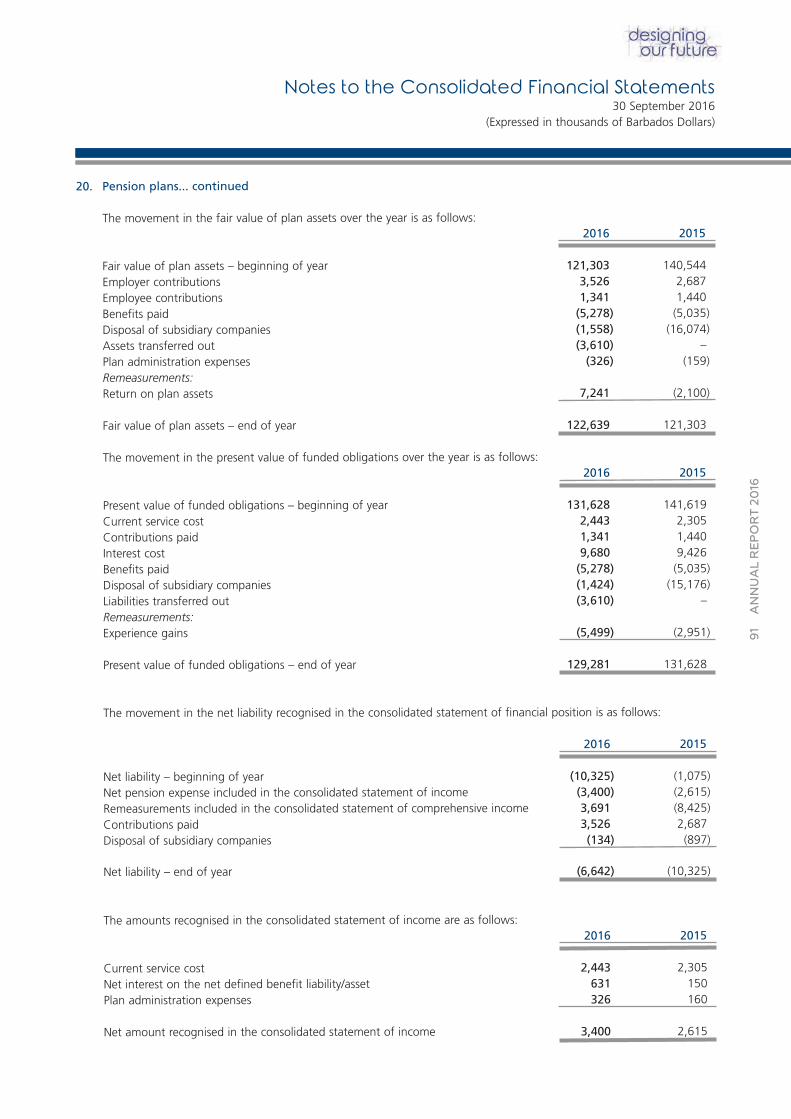
91
ANNUAL REPORT 20
16
20. Pension plans... continued
The movement in the fair value of plan assets over the year is as follows:2016 2015
Fair value of plan assets – beginning of year 121,303 140,544Employer contributions 3,526 2,687Employee contributions 1,341 1,440Benefits paid (5,278) (5,035)Disposal of subsidiary companies (1,558) (16,074)Assets transferred out (3,610) –Plan administration expenses (326) (159)Remeasurements:Return on plan assets 7,241 (2,100)
Fair value of plan assets – end of year 122,639 121,303
The movement in the present value of funded obligations over the year is as follows:2016 2015
Present value of funded obligations – beginning of year 131,628 141,619Current service cost 2,443 2,305Contributions paid 1,341 1,440Interest cost 9,680 9,426Benefits paid (5,278) (5,035)Disposal of subsidiary companies (1,424) (15,176)Liabilities transferred out (3,610) –Remeasurements:Experience gains (5,499) (2,951)
Present value of funded obligations – end of year 129,281 131,628
The movement in the net liability recognised in the consolidated statement of financial position is as follows:
2016 2015
Net liability – beginning of year (10,325) (1,075)Net pension expense included in the consolidated statement of income (3,400) (2,615)Remeasurements included in the consolidated statement of comprehensive income 3,691 (8,425)Contributions paid 3,526 2,687Disposal of subsidiary companies (134) (897)
Net liability – end of year (6,642) (10,325)
The amounts recognised in the consolidated statement of income are as follows:2016 2015
Current service cost 2,443 2,305Net interest on the net defined benefit liability/asset 631 150Plan administration expenses 326 160
Net amount recognised in the consolidated statement of income 3,400 2,615
Notes to the Consolidated Financial Statements30 September 2016
(Expressed in thousands of Barbados Dollars)
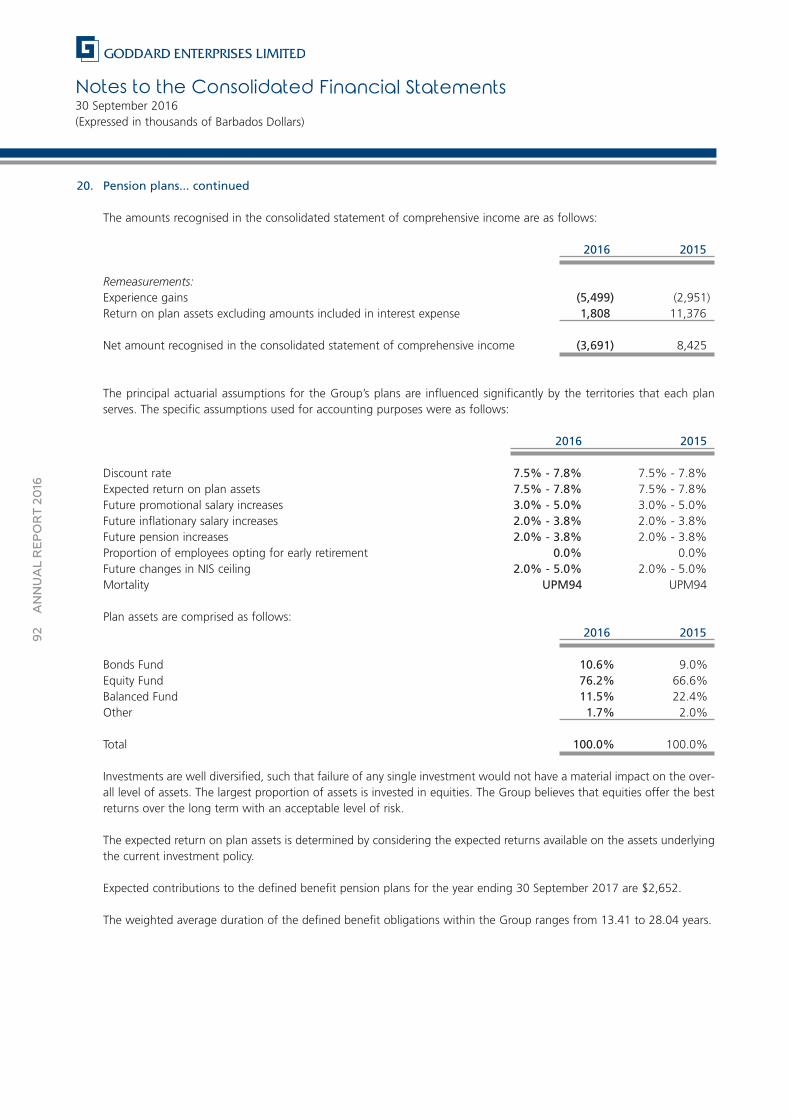
Notes to the Consolidated Financial Statements30 September 2016(Expressed in thousands of Barbados Dollars)
92
ANNUAL REPORT 20
16
20. Pension plans... continued
The amounts recognised in the consolidated statement of comprehensive income are as follows:
2016 2015
Remeasurements:Experience gains (5,499) (2,951)Return on plan assets excluding amounts included in interest expense 1,808 11,376
Net amount recognised in the consolidated statement of comprehensive income (3,691) 8,425
The principal actuarial assumptions for the Group’s plans are influenced significantly by the territories that each planserves. The specific assumptions used for accounting purposes were as follows:
2016 2015
Discount rate 7.5% - 7.8% 7.5% - 7.8%Expected return on plan assets 7.5% - 7.8% 7.5% - 7.8%Future promotional salary increases 3.0% - 5.0% 3.0% - 5.0%Future inflationary salary increases 2.0% - 3.8% 2.0% - 3.8%Future pension increases 2.0% - 3.8% 2.0% - 3.8%Proportion of employees opting for early retirement 0.0% 0.0%Future changes in NIS ceiling 2.0% - 5.0% 2.0% - 5.0%Mortality UPM94 UPM94
Plan assets are comprised as follows:2016 2015
Bonds Fund 10.6% 9.0%Equity Fund 76.2% 66.6%Balanced Fund 11.5% 22.4%Other 1.7% 2.0%
Total 100.0% 100.0%
Investments are well diversified, such that failure of any single investment would not have a material impact on the over-all level of assets. The largest proportion of assets is invested in equities. The Group believes that equities offer the bestreturns over the long term with an acceptable level of risk.
The expected return on plan assets is determined by considering the expected returns available on the assets underlyingthe current investment policy.
Expected contributions to the defined benefit pension plans for the year ending 30 September 2017 are $2,652.
The weighted average duration of the defined benefit obligations within the Group ranges from 13.41 to 28.04 years.
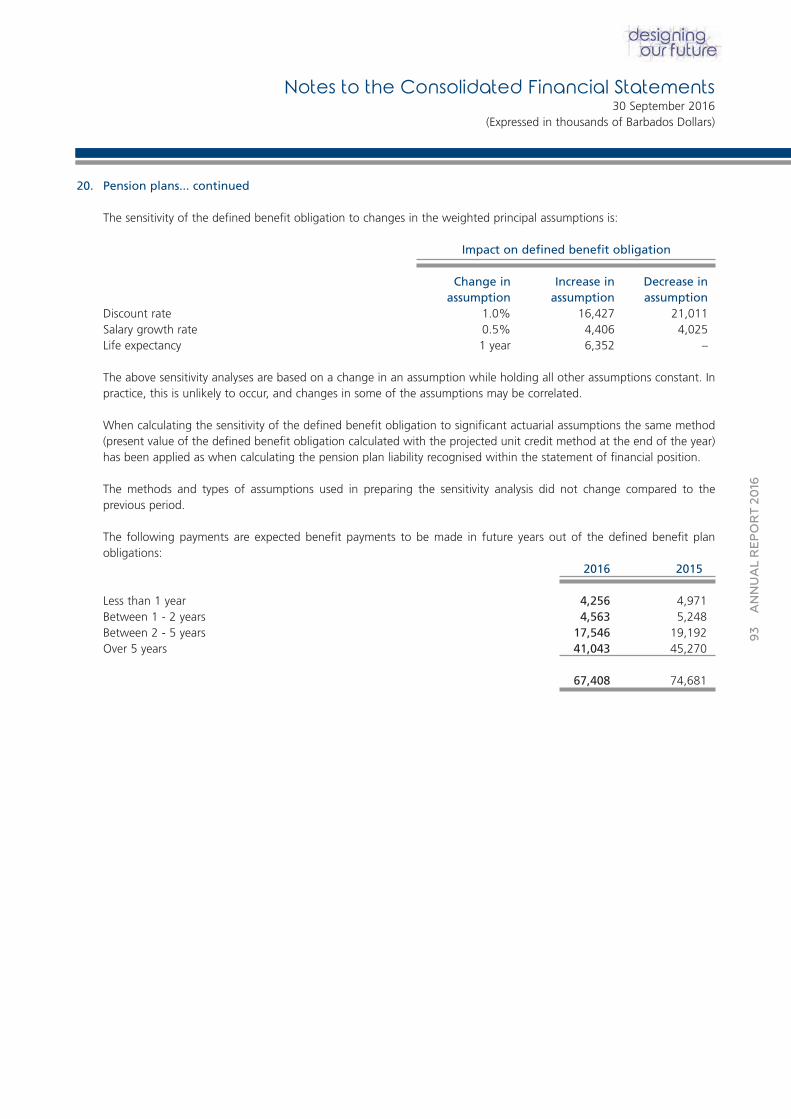
93
ANNUAL REPORT 20
16
20. Pension plans... continued
The sensitivity of the defined benefit obligation to changes in the weighted principal assumptions is:
Impact on defined benefit obligation
Change in Increase in Decrease inassumption assumption assumption
Discount rate 1.0% 16,427 21,011Salary growth rate 0.5% 4,406 4,025Life expectancy 1 year 6,352 –
The above sensitivity analyses are based on a change in an assumption while holding all other assumptions constant. Inpractice, this is unlikely to occur, and changes in some of the assumptions may be correlated.
When calculating the sensitivity of the defined benefit obligation to significant actuarial assumptions the same method(present value of the defined benefit obligation calculated with the projected unit credit method at the end of the year)has been applied as when calculating the pension plan liability recognised within the statement of financial position.
The methods and types of assumptions used in preparing the sensitivity analysis did not change compared to the previous period.
The following payments are expected benefit payments to be made in future years out of the defined benefit plan obligations:
2016 2015
Less than 1 year 4,256 4,971Between 1 - 2 years 4,563 5,248Between 2 - 5 years 17,546 19,192Over 5 years 41,043 45,270
67,408 74,681
Notes to the Consolidated Financial Statements30 September 2016
(Expressed in thousands of Barbados Dollars)
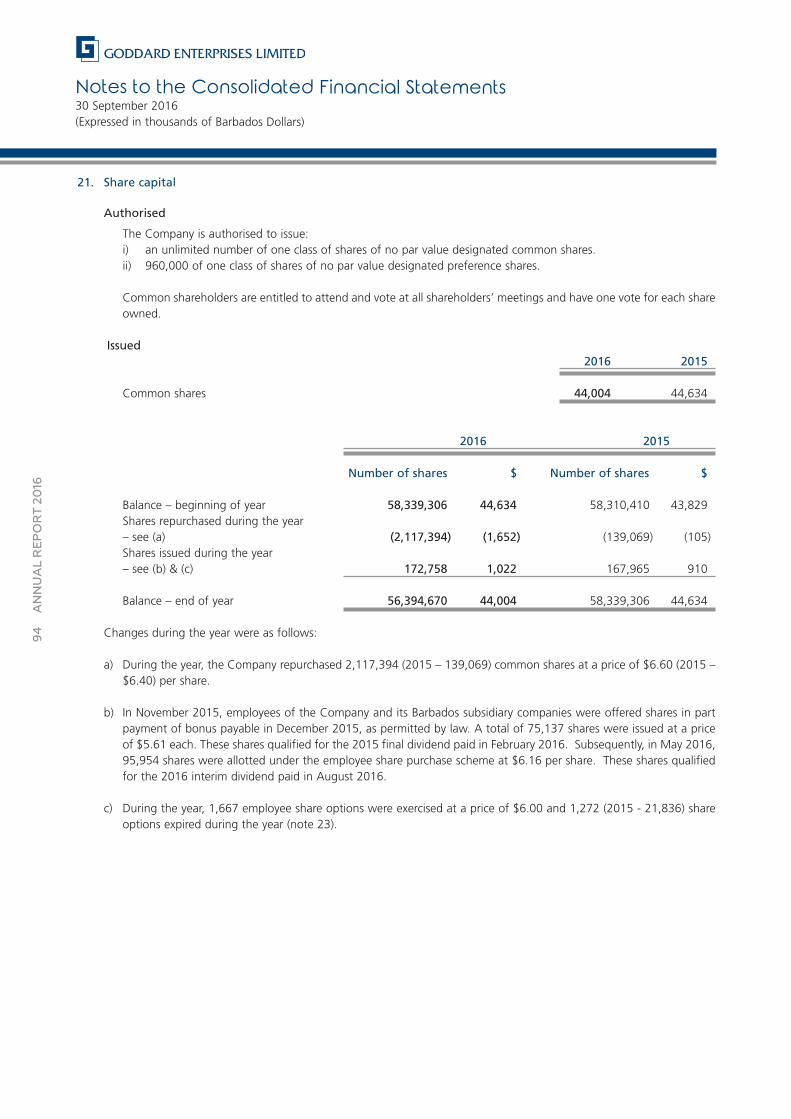
Notes to the Consolidated Financial Statements30 September 2016(Expressed in thousands of Barbados Dollars)
94
ANNUAL REPORT 20
16
21. Share capital
Authorised
The Company is authorised to issue:i) an unlimited number of one class of shares of no par value designated common shares.ii) 960,000 of one class of shares of no par value designated preference shares.
Common shareholders are entitled to attend and vote at all shareholders’ meetings and have one vote for each shareowned.
Issued2016 2015
Common shares 44,004 44,634
2016 2015
Number of shares $ Number of shares $
Balance – beginning of year 58,339,306 44,634 58,310,410 43,829Shares repurchased during the year– see (a) (2,117,394) (1,652) (139,069) (105)Shares issued during the year – see (b) & (c) 172,758 1,022 167,965 910
Balance – end of year 56,394,670 44,004 58,339,306 44,634
Changes during the year were as follows:
a) During the year, the Company repurchased 2,117,394 (2015 – 139,069) common shares at a price of $6.60 (2015 –$6.40) per share.
b) In November 2015, employees of the Company and its Barbados subsidiary companies were offered shares in partpayment of bonus payable in December 2015, as permitted by law. A total of 75,137 shares were issued at a priceof $5.61 each. These shares qualified for the 2015 final dividend paid in February 2016. Subsequently, in May 2016,95,954 shares were allotted under the employee share purchase scheme at $6.16 per share. These shares qualifiedfor the 2016 interim dividend paid in August 2016.
c) During the year, 1,667 employee share options were exercised at a price of $6.00 and 1,272 (2015 - 21,836) shareoptions expired during the year (note 23).
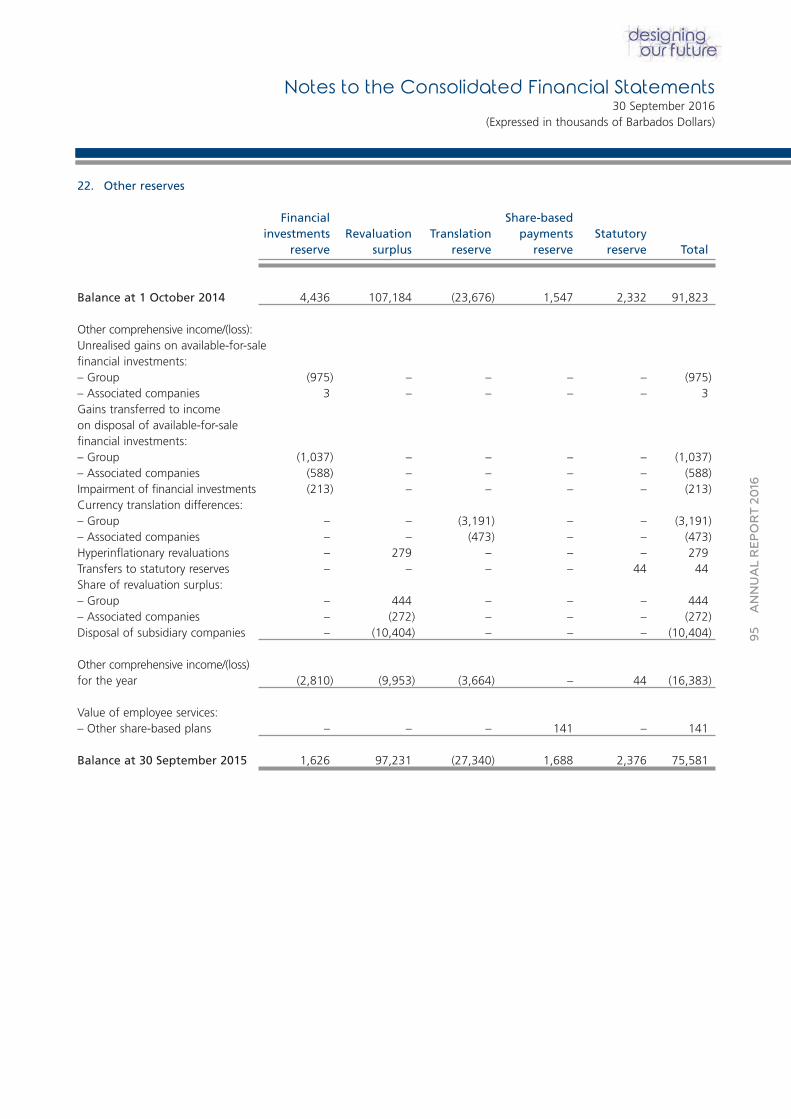
95
ANNUAL REPORT 20
16
22. Other reserves
Financial Share-basedinvestments Revaluation Translation payments Statutory
reserve surplus reserve reserve reserve Total
Balance at 1 October 2014 4,436 107,184 (23,676) 1,547 2,332 91,823
Other comprehensive income/(loss):Unrealised gains on available-for-salefinancial investments:– Group (975) – – – – (975)– Associated companies 3 – – – – 3Gains transferred to incomeon disposal of available-for-salefinancial investments:– Group (1,037) – – – – (1,037)– Associated companies (588) – – – – (588)Impairment of financial investments (213) – – – – (213)Currency translation differences:– Group – – (3,191) – – (3,191)– Associated companies – – (473) – – (473)Hyperinflationary revaluations – 279 – – – 279Transfers to statutory reserves – – – – 44 44Share of revaluation surplus:– Group – 444 – – – 444– Associated companies – (272) – – – (272)Disposal of subsidiary companies – (10,404) – – – (10,404)
Other comprehensive income/(loss)for the year (2,810) (9,953) (3,664) – 44 (16,383)
Value of employee services:– Other share-based plans – – – 141 – 141
Balance at 30 September 2015 1,626 97,231 (27,340) 1,688 2,376 75,581
Notes to the Consolidated Financial Statements30 September 2016
(Expressed in thousands of Barbados Dollars)
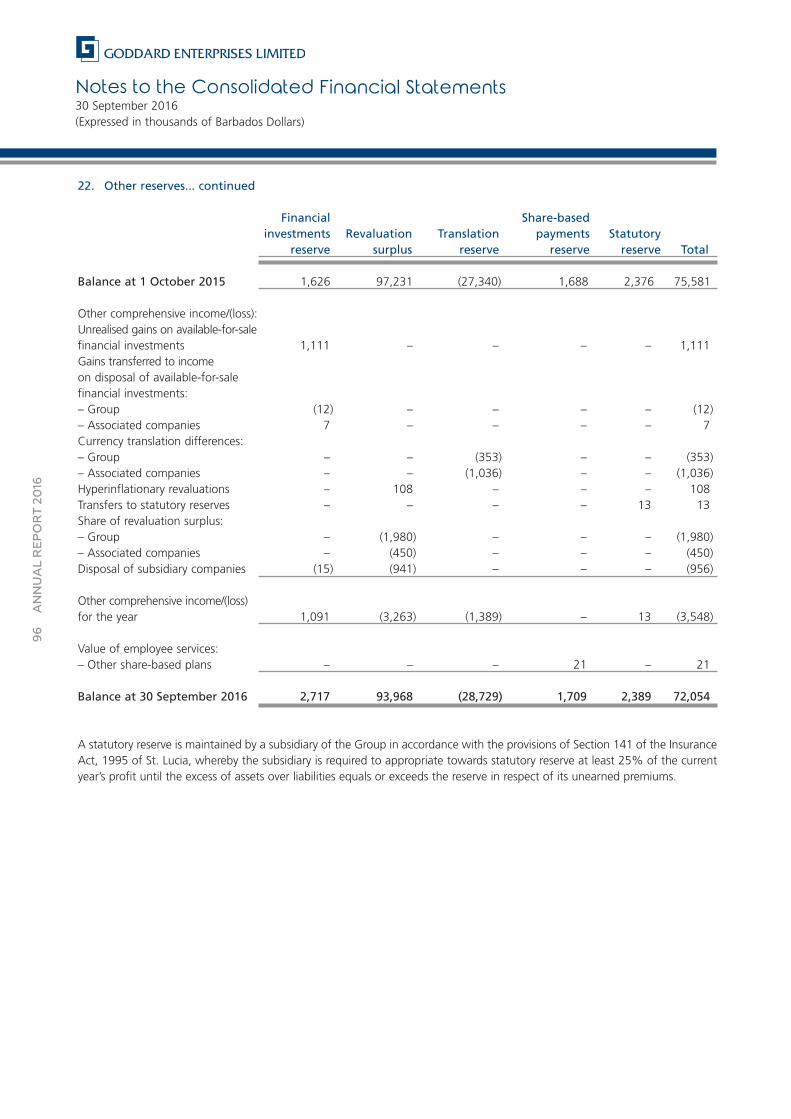
Notes to the Consolidated Financial Statements30 September 2016(Expressed in thousands of Barbados Dollars)
96
ANNUAL REPORT 20
16
22. Other reserves... continued
Financial Share-basedinvestments Revaluation Translation payments Statutory
reserve surplus reserve reserve reserve Total
Balance at 1 October 2015 1,626 97,231 (27,340) 1,688 2,376 75,581
Other comprehensive income/(loss):Unrealised gains on available-for-salefinancial investments 1,111 – – – – 1,111Gains transferred to incomeon disposal of available-for-salefinancial investments: – Group (12) – – – – (12)– Associated companies 7 – – – – 7Currency translation differences:– Group – – (353) – – (353)– Associated companies – – (1,036) – – (1,036)Hyperinflationary revaluations – 108 – – – 108Transfers to statutory reserves – – – – 13 13Share of revaluation surplus:– Group – (1,980) – – – (1,980)– Associated companies – (450) – – – (450)Disposal of subsidiary companies (15) (941) – – – (956)
Other comprehensive income/(loss)for the year 1,091 (3,263) (1,389) – 13 (3,548)
Value of employee services:– Other share-based plans – – – 21 – 21
Balance at 30 September 2016 2,717 93,968 (28,729) 1,709 2,389 72,054
A statutory reserve is maintained by a subsidiary of the Group in accordance with the provisions of Section 141 of the InsuranceAct, 1995 of St. Lucia, whereby the subsidiary is required to appropriate towards statutory reserve at least 25% of the currentyear’s profit until the excess of assets over liabilities equals or exceeds the reserve in respect of its unearned premiums.
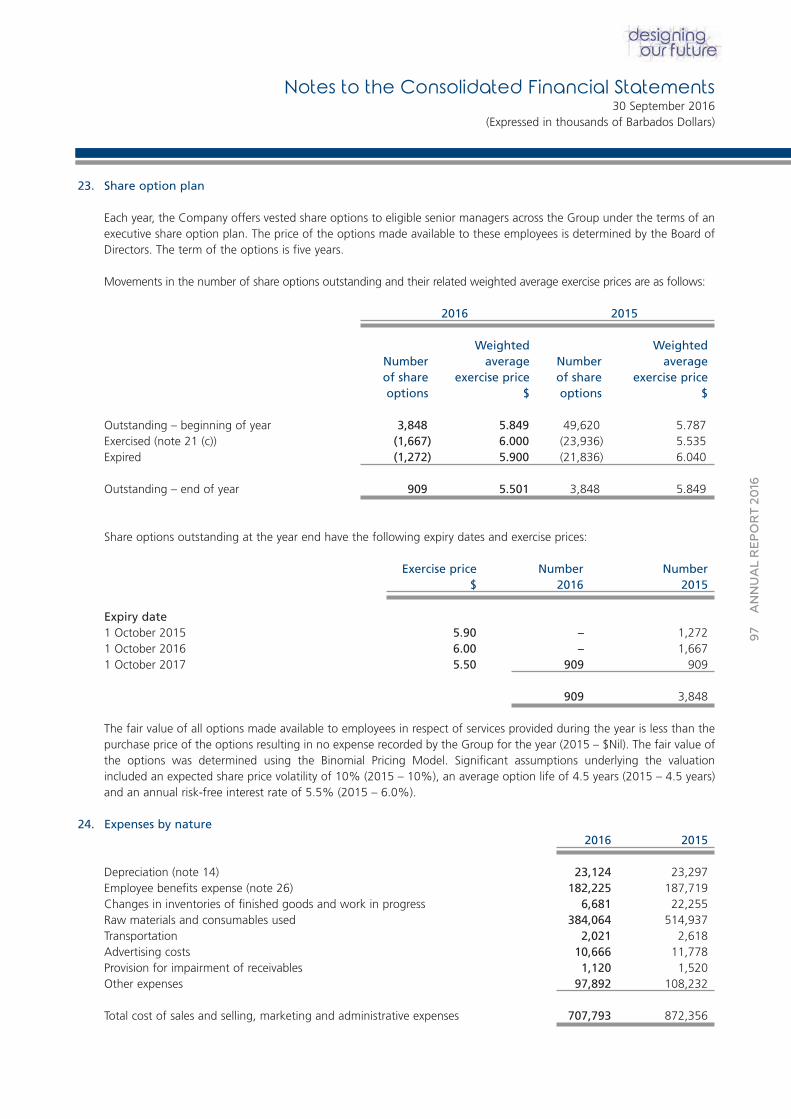
97
ANNUAL REPORT 20
16
23. Share option plan
Each year, the Company offers vested share options to eligible senior managers across the Group under the terms of anexecutive share option plan. The price of the options made available to these employees is determined by the Board ofDirectors. The term of the options is five years.
Movements in the number of share options outstanding and their related weighted average exercise prices are as follows:
2016 2015
Weighted WeightedNumber average Number averageof share exercise price of share exercise priceoptions $ options $
Outstanding – beginning of year 3,848 5.849 49,620 5.787Exercised (note 21 (c)) (1,667) 6.000 (23,936) 5.535Expired (1,272) 5.900 (21,836) 6.040
Outstanding – end of year 909 5.501 3,848 5.849
Share options outstanding at the year end have the following expiry dates and exercise prices:
Exercise price Number Number$ 2016 2015
Expiry date1 October 2015 5.90 – 1,2721 October 2016 6.00 – 1,6671 October 2017 5.50 909 909
909 3,848
The fair value of all options made available to employees in respect of services provided during the year is less than thepurchase price of the options resulting in no expense recorded by the Group for the year (2015 – $Nil). The fair value ofthe options was determined using the Binomial Pricing Model. Significant assumptions underlying the valuation included an expected share price volatility of 10% (2015 – 10%), an average option life of 4.5 years (2015 – 4.5 years)and an annual risk-free interest rate of 5.5% (2015 – 6.0%).
24. Expenses by nature2016 2015
Depreciation (note 14) 23,124 23,297Employee benefits expense (note 26) 182,225 187,719Changes in inventories of finished goods and work in progress 6,681 22,255Raw materials and consumables used 384,064 514,937Transportation 2,021 2,618Advertising costs 10,666 11,778Provision for impairment of receivables 1,120 1,520Other expenses 97,892 108,232
Total cost of sales and selling, marketing and administrative expenses 707,793 872,356
Notes to the Consolidated Financial Statements30 September 2016
(Expressed in thousands of Barbados Dollars)
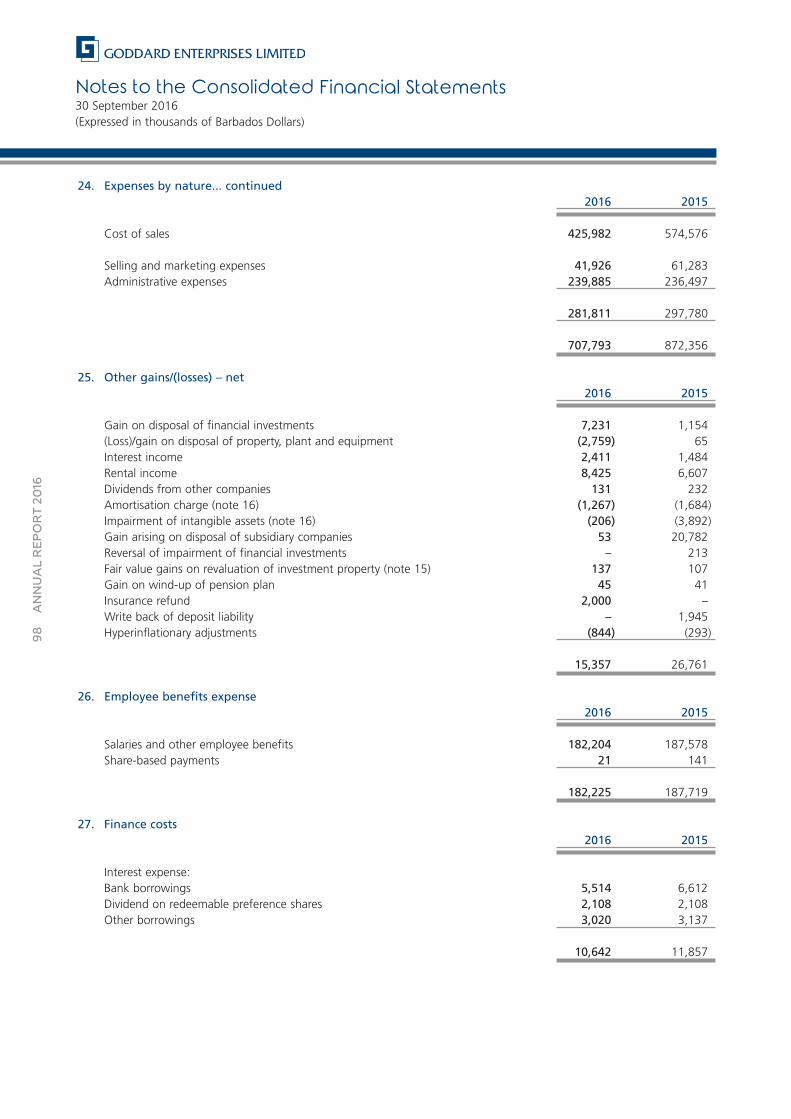
Notes to the Consolidated Financial Statements30 September 2016(Expressed in thousands of Barbados Dollars)
98
ANNUAL REPORT 20
16
24. Expenses by nature... continued2016 2015
Cost of sales 425,982 574,576
Selling and marketing expenses 41,926 61,283Administrative expenses 239,885 236,497
281,811 297,780
707,793 872,356
25. Other gains/(losses) – net2016 2015
Gain on disposal of financial investments 7,231 1,154(Loss)/gain on disposal of property, plant and equipment (2,759) 65Interest income 2,411 1,484Rental income 8,425 6,607Dividends from other companies 131 232Amortisation charge (note 16) (1,267) (1,684)Impairment of intangible assets (note 16) (206) (3,892)Gain arising on disposal of subsidiary companies 53 20,782Reversal of impairment of financial investments – 213Fair value gains on revaluation of investment property (note 15) 137 107Gain on wind-up of pension plan 45 41Insurance refund 2,000 –Write back of deposit liability – 1,945Hyperinflationary adjustments (844) (293)
15,357 26,761
26. Employee benefits expense2016 2015
Salaries and other employee benefits 182,204 187,578Share-based payments 21 141
182,225 187,719
27. Finance costs2016 2015
Interest expense:Bank borrowings 5,514 6,612Dividend on redeemable preference shares 2,108 2,108Other borrowings 3,020 3,137
10,642 11,857
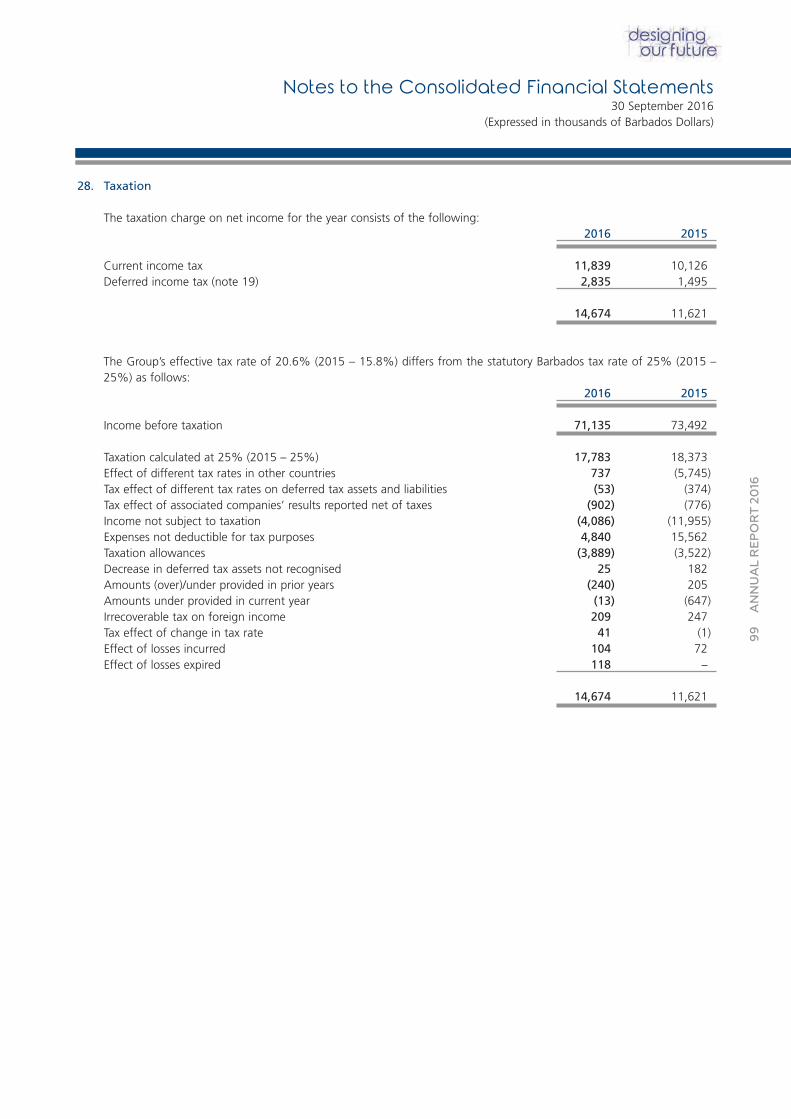
99
ANNUAL REPORT 20
16
28. Taxation
The taxation charge on net income for the year consists of the following:2016 2015
Current income tax 11,839 10,126Deferred income tax (note 19) 2,835 1,495
14,674 11,621
The Group’s effective tax rate of 20.6% (2015 – 15.8%) differs from the statutory Barbados tax rate of 25% (2015 –25%) as follows:
2016 2015
Income before taxation 71,135 73,492
Taxation calculated at 25% (2015 – 25%) 17,783 18,373Effect of different tax rates in other countries 737 (5,745)Tax effect of different tax rates on deferred tax assets and liabilities (53) (374)Tax effect of associated companies’ results reported net of taxes (902) (776)Income not subject to taxation (4,086) (11,955)Expenses not deductible for tax purposes 4,840 15,562Taxation allowances (3,889) (3,522)Decrease in deferred tax assets not recognised 25 182Amounts (over)/under provided in prior years (240) 205Amounts under provided in current year (13) (647)Irrecoverable tax on foreign income 209 247Tax effect of change in tax rate 41 (1)Effect of losses incurred 104 72Effect of losses expired 118 –
14,674 11,621
Notes to the Consolidated Financial Statements30 September 2016
(Expressed in thousands of Barbados Dollars)
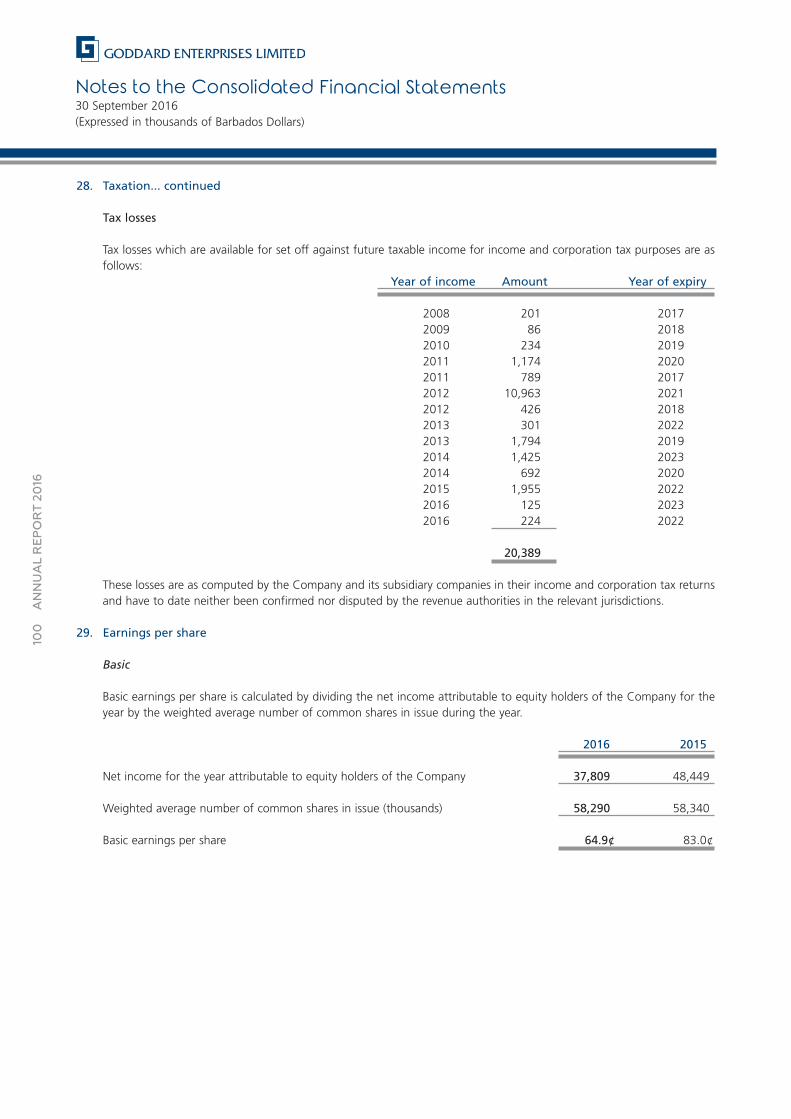
Notes to the Consolidated Financial Statements30 September 2016(Expressed in thousands of Barbados Dollars)
100
ANNUAL REPORT 20
16
28. Taxation... continued
Tax losses
Tax losses which are available for set off against future taxable income for income and corporation tax purposes are as follows:
Year of income Amount Year of expiry
2008 201 20172009 86 20182010 234 20192011 1,174 20202011 789 20172012 10,963 20212012 426 20182013 301 20222013 1,794 20192014 1,425 20232014 692 20202015 1,955 20222016 125 20232016 224 2022
20,389
These losses are as computed by the Company and its subsidiary companies in their income and corporation tax returnsand have to date neither been confirmed nor disputed by the revenue authorities in the relevant jurisdictions.
29. Earnings per share
Basic
Basic earnings per share is calculated by dividing the net income attributable to equity holders of the Company for theyear by the weighted average number of common shares in issue during the year.
2016 2015
Net income for the year attributable to equity holders of the Company 37,809 48,449
Weighted average number of common shares in issue (thousands) 58,290 58,340
Basic earnings per share 64.9¢ 83.0¢
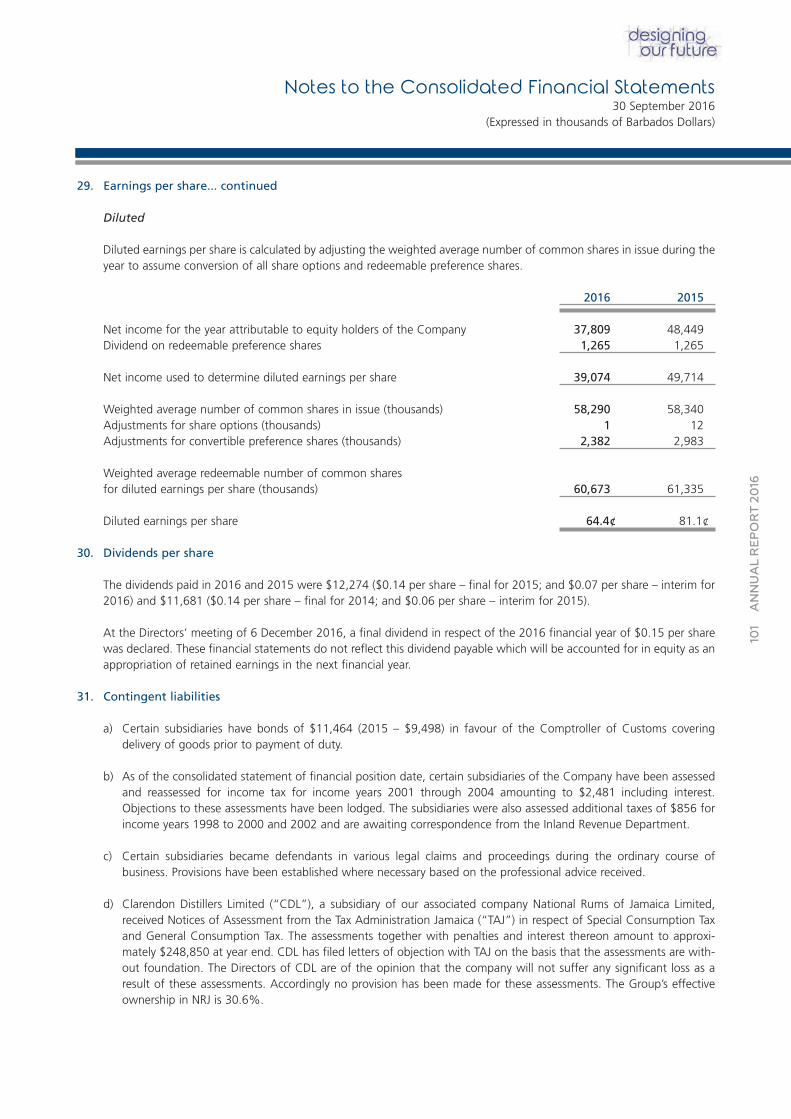
101
ANNUAL REPORT 20
16
29. Earnings per share... continued
Diluted
Diluted earnings per share is calculated by adjusting the weighted average number of common shares in issue during theyear to assume conversion of all share options and redeemable preference shares.
2016 2015
Net income for the year attributable to equity holders of the Company 37,809 48,449Dividend on redeemable preference shares 1,265 1,265
Net income used to determine diluted earnings per share 39,074 49,714
Weighted average number of common shares in issue (thousands) 58,290 58,340Adjustments for share options (thousands) 1 12Adjustments for convertible preference shares (thousands) 2,382 2,983
Weighted average redeemable number of common sharesfor diluted earnings per share (thousands) 60,673 61,335
Diluted earnings per share 64.4¢ 81.1¢
30. Dividends per share
The dividends paid in 2016 and 2015 were $12,274 ($0.14 per share – final for 2015; and $0.07 per share – interim for2016) and $11,681 ($0.14 per share – final for 2014; and $0.06 per share – interim for 2015).
At the Directors’ meeting of 6 December 2016, a final dividend in respect of the 2016 financial year of $0.15 per sharewas declared. These financial statements do not reflect this dividend payable which will be accounted for in equity as anappropriation of retained earnings in the next financial year.
31. Contingent liabilities
a) Certain subsidiaries have bonds of $11,464 (2015 – $9,498) in favour of the Comptroller of Customs covering delivery of goods prior to payment of duty.
b) As of the consolidated statement of financial position date, certain subsidiaries of the Company have been assessedand reassessed for income tax for income years 2001 through 2004 amounting to $2,481 including interest.Objections to these assessments have been lodged. The subsidiaries were also assessed additional taxes of $856 forincome years 1998 to 2000 and 2002 and are awaiting correspondence from the Inland Revenue Department.
c) Certain subsidiaries became defendants in various legal claims and proceedings during the ordinary course of business. Provisions have been established where necessary based on the professional advice received.
d) Clarendon Distillers Limited (“CDL”), a subsidiary of our associated company National Rums of Jamaica Limited,received Notices of Assessment from the Tax Administration Jamaica (“TAJ”) in respect of Special Consumption Taxand General Consumption Tax. The assessments together with penalties and interest thereon amount to approxi-mately $248,850 at year end. CDL has filed letters of objection with TAJ on the basis that the assessments are with-out foundation. The Directors of CDL are of the opinion that the company will not suffer any significant loss as aresult of these assessments. Accordingly no provision has been made for these assessments. The Group’s effectiveownership in NRJ is 30.6%.
Notes to the Consolidated Financial Statements30 September 2016
(Expressed in thousands of Barbados Dollars)
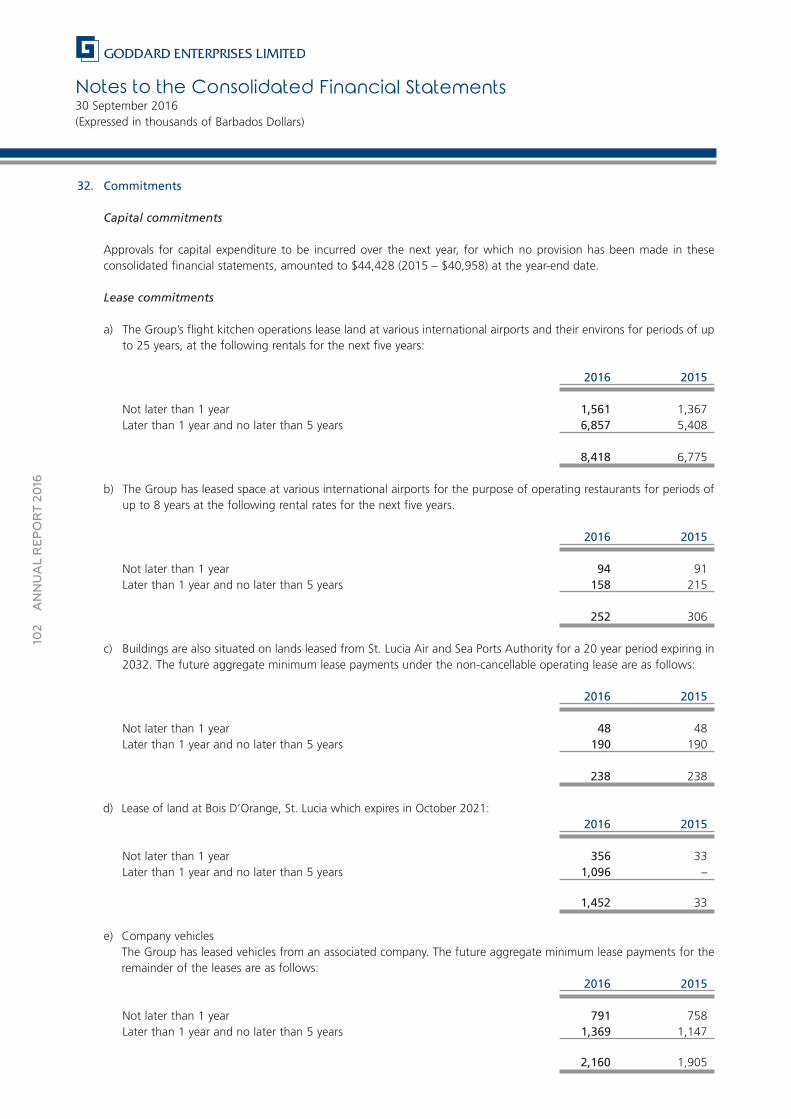
Notes to the Consolidated Financial Statements30 September 2016(Expressed in thousands of Barbados Dollars)
102
ANNUAL REPORT 20
16
32. Commitments
Capital commitments
Approvals for capital expenditure to be incurred over the next year, for which no provision has been made in these consolidated financial statements, amounted to $44,428 (2015 – $40,958) at the year-end date.
Lease commitments
a) The Group’s flight kitchen operations lease land at various international airports and their environs for periods of upto 25 years, at the following rentals for the next five years:
2016 2015
Not later than 1 year 1,561 1,367Later than 1 year and no later than 5 years 6,857 5,408
8,418 6,775
b) The Group has leased space at various international airports for the purpose of operating restaurants for periods ofup to 8 years at the following rental rates for the next five years.
2016 2015
Not later than 1 year 94 91Later than 1 year and no later than 5 years 158 215
252 306
c) Buildings are also situated on lands leased from St. Lucia Air and Sea Ports Authority for a 20 year period expiring in2032. The future aggregate minimum lease payments under the non-cancellable operating lease are as follows:
2016 2015
Not later than 1 year 48 48Later than 1 year and no later than 5 years 190 190
238 238
d) Lease of land at Bois D’Orange, St. Lucia which expires in October 2021:2016 2015
Not later than 1 year 356 33Later than 1 year and no later than 5 years 1,096 –
1,452 33
e) Company vehiclesThe Group has leased vehicles from an associated company. The future aggregate minimum lease payments for theremainder of the leases are as follows:
2016 2015
Not later than 1 year 791 758Later than 1 year and no later than 5 years 1,369 1,147
2,160 1,905
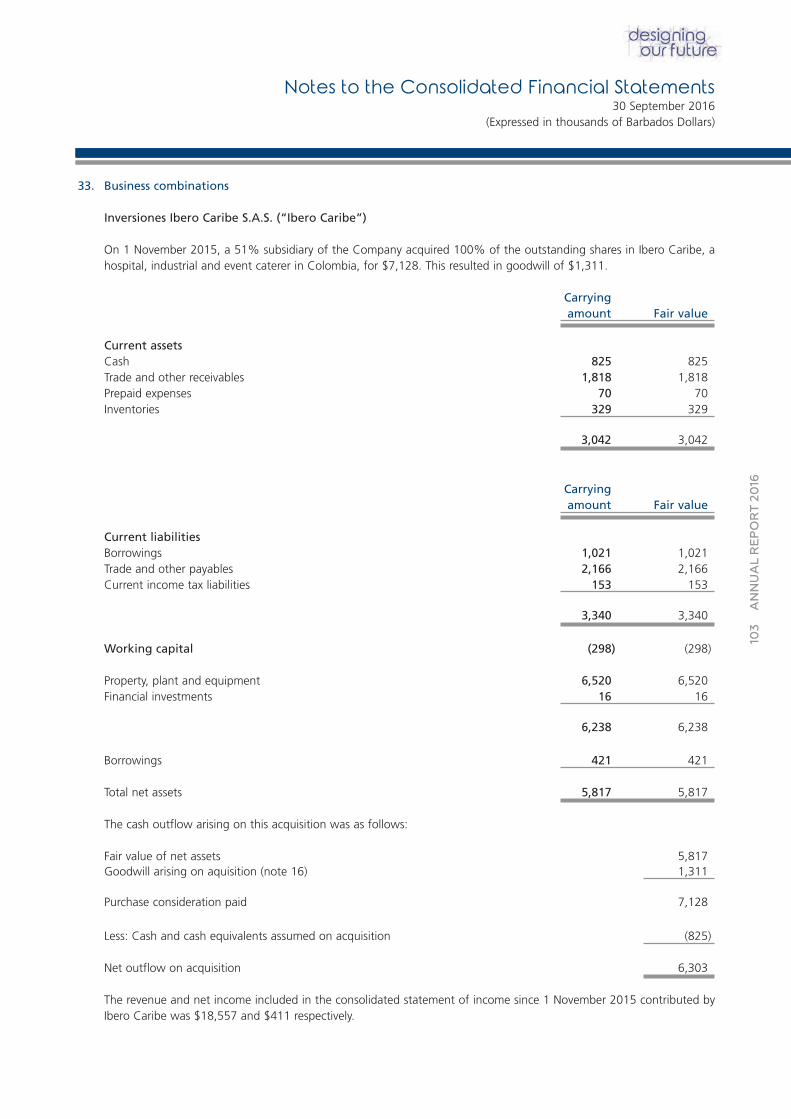
103
ANNUAL REPORT 20
16
33. Business combinations
Inversiones Ibero Caribe S.A.S. (“Ibero Caribe”)
On 1 November 2015, a 51% subsidiary of the Company acquired 100% of the outstanding shares in Ibero Caribe, ahospital, industrial and event caterer in Colombia, for $7,128. This resulted in goodwill of $1,311.
Carryingamount Fair value
Current assetsCash 825 825Trade and other receivables 1,818 1,818Prepaid expenses 70 70Inventories 329 329
3,042 3,042
Carryingamount Fair value
Current liabilitiesBorrowings 1,021 1,021Trade and other payables 2,166 2,166Current income tax liabilities 153 153
3,340 3,340
Working capital (298) (298)
Property, plant and equipment 6,520 6,520Financial investments 16 16
6,238 6,238
Borrowings 421 421
Total net assets 5,817 5,817
The cash outflow arising on this acquisition was as follows:
Fair value of net assets 5,817Goodwill arising on aquisition (note 16) 1,311
Purchase consideration paid 7,128
Less: Cash and cash equivalents assumed on acquisition (825)
Net outflow on acquisition 6,303
The revenue and net income included in the consolidated statement of income since 1 November 2015 contributed byIbero Caribe was $18,557 and $411 respectively.
Notes to the Consolidated Financial Statements30 September 2016
(Expressed in thousands of Barbados Dollars)
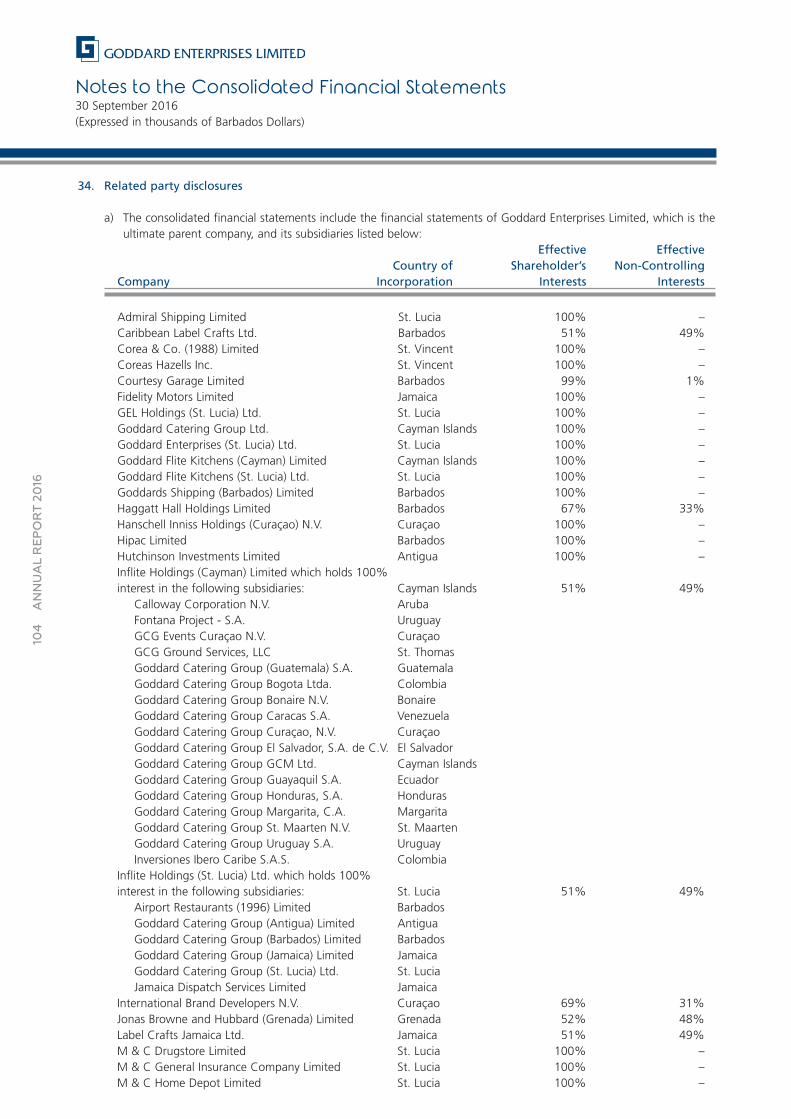
Notes to the Consolidated Financial Statements30 September 2016(Expressed in thousands of Barbados Dollars)
104
ANNUAL REPORT 20
16
34. Related party disclosures
a) The consolidated financial statements include the financial statements of Goddard Enterprises Limited, which is the ultimate parent company, and its subsidiaries listed below:
Effective EffectiveCountry of Shareholder’s Non-Controlling
Company Incorporation Interests Interests
Admiral Shipping Limited St. Lucia 100% –Caribbean Label Crafts Ltd. Barbados 51% 49%Corea & Co. (1988) Limited St. Vincent 100% –Coreas Hazells Inc. St. Vincent 100% –Courtesy Garage Limited Barbados 99% 1%Fidelity Motors Limited Jamaica 100% –GEL Holdings (St. Lucia) Ltd. St. Lucia 100% –Goddard Catering Group Ltd. Cayman Islands 100% –Goddard Enterprises (St. Lucia) Ltd. St. Lucia 100% –Goddard Flite Kitchens (Cayman) Limited Cayman Islands 100% –Goddard Flite Kitchens (St. Lucia) Ltd. St. Lucia 100% –Goddards Shipping (Barbados) Limited Barbados 100% –Haggatt Hall Holdings Limited Barbados 67% 33%Hanschell Inniss Holdings (Curaçao) N.V. Curaçao 100% –Hipac Limited Barbados 100% –Hutchinson Investments Limited Antigua 100% –Inflite Holdings (Cayman) Limited which holds 100%interest in the following subsidiaries: Cayman Islands 51% 49%
Calloway Corporation N.V. ArubaFontana Project - S.A. UruguayGCG Events Curaçao N.V. CuraçaoGCG Ground Services, LLC St. ThomasGoddard Catering Group (Guatemala) S.A. GuatemalaGoddard Catering Group Bogota Ltda. ColombiaGoddard Catering Group Bonaire N.V. BonaireGoddard Catering Group Caracas S.A. VenezuelaGoddard Catering Group Curaçao, N.V. CuraçaoGoddard Catering Group El Salvador, S.A. de C.V. El SalvadorGoddard Catering Group GCM Ltd. Cayman IslandsGoddard Catering Group Guayaquil S.A. EcuadorGoddard Catering Group Honduras, S.A. HondurasGoddard Catering Group Margarita, C.A. MargaritaGoddard Catering Group St. Maarten N.V. St. MaartenGoddard Catering Group Uruguay S.A. UruguayInversiones Ibero Caribe S.A.S. Colombia
Inflite Holdings (St. Lucia) Ltd. which holds 100%interest in the following subsidiaries: St. Lucia 51% 49%
Airport Restaurants (1996) Limited BarbadosGoddard Catering Group (Antigua) Limited AntiguaGoddard Catering Group (Barbados) Limited BarbadosGoddard Catering Group (Jamaica) Limited JamaicaGoddard Catering Group (St. Lucia) Ltd. St. LuciaJamaica Dispatch Services Limited Jamaica
International Brand Developers N.V. Curaçao 69% 31%Jonas Browne and Hubbard (Grenada) Limited Grenada 52% 48%Label Crafts Jamaica Ltd. Jamaica 51% 49%M & C Drugstore Limited St. Lucia 100% –M & C General Insurance Company Limited St. Lucia 100% –M & C Home Depot Limited St. Lucia 100% –
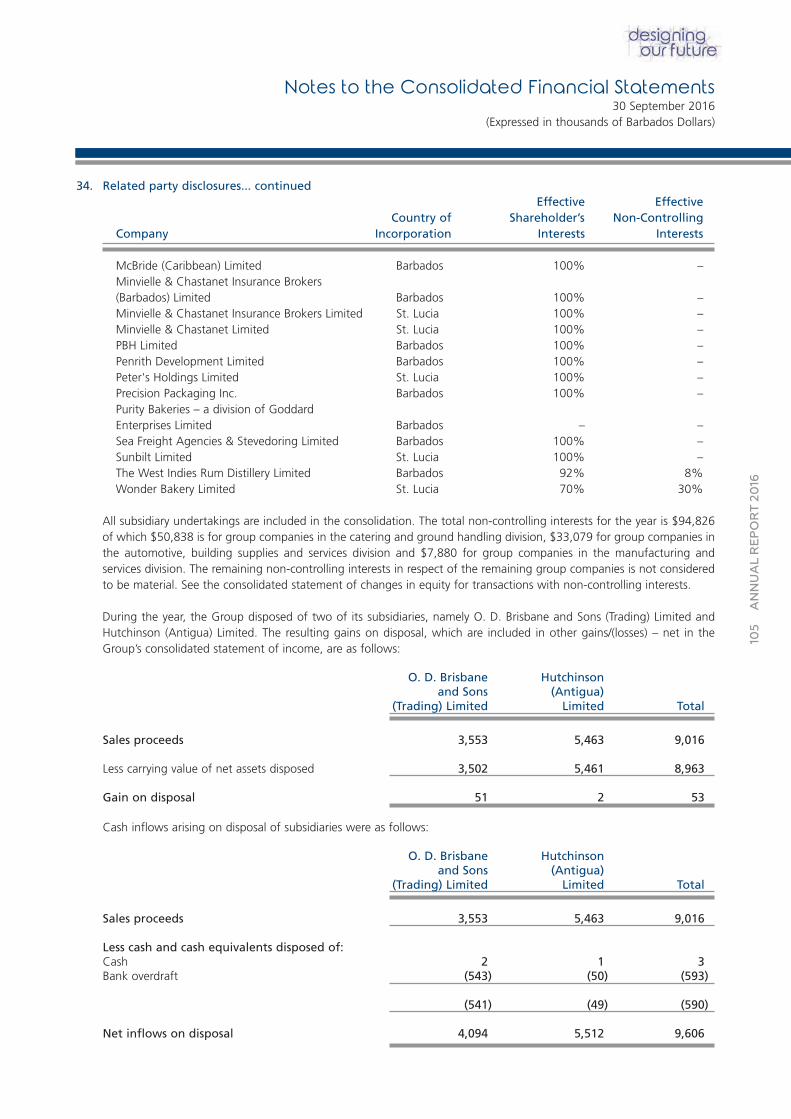
105
ANNUAL REPORT 20
16
34. Related party disclosures... continuedEffective Effective
Country of Shareholder’s Non-ControllingCompany Incorporation Interests Interests
McBride (Caribbean) Limited Barbados 100% –Minvielle & Chastanet Insurance Brokers(Barbados) Limited Barbados 100% –Minvielle & Chastanet Insurance Brokers Limited St. Lucia 100% –Minvielle & Chastanet Limited St. Lucia 100% –PBH Limited Barbados 100% –Penrith Development Limited Barbados 100% –Peter's Holdings Limited St. Lucia 100% –Precision Packaging Inc. Barbados 100% –Purity Bakeries – a division of GoddardEnterprises Limited Barbados – –Sea Freight Agencies & Stevedoring Limited Barbados 100% –Sunbilt Limited St. Lucia 100% –The West Indies Rum Distillery Limited Barbados 92% 8%Wonder Bakery Limited St. Lucia 70% 30%
All subsidiary undertakings are included in the consolidation. The total non-controlling interests for the year is $94,826of which $50,838 is for group companies in the catering and ground handling division, $33,079 for group companies inthe automotive, building supplies and services division and $7,880 for group companies in the manufacturing and services division. The remaining non-controlling interests in respect of the remaining group companies is not consideredto be material. See the consolidated statement of changes in equity for transactions with non-controlling interests.
During the year, the Group disposed of two of its subsidiaries, namely O. D. Brisbane and Sons (Trading) Limited andHutchinson (Antigua) Limited. The resulting gains on disposal, which are included in other gains/(losses) – net in theGroup’s consolidated statement of income, are as follows:
O. D. Brisbane Hutchinsonand Sons (Antigua)
(Trading) Limited Limited Total
Sales proceeds 3,553 5,463 9,016
Less carrying value of net assets disposed 3,502 5,461 8,963
Gain on disposal 51 2 53
Cash inflows arising on disposal of subsidiaries were as follows:
O. D. Brisbane Hutchinsonand Sons (Antigua)
(Trading) Limited Limited Total
Sales proceeds 3,553 5,463 9,016
Less cash and cash equivalents disposed of:Cash 2 1 3Bank overdraft (543) (50) (593)
(541) (49) (590)
Net inflows on disposal 4,094 5,512 9,606
Notes to the Consolidated Financial Statements30 September 2016
(Expressed in thousands of Barbados Dollars)
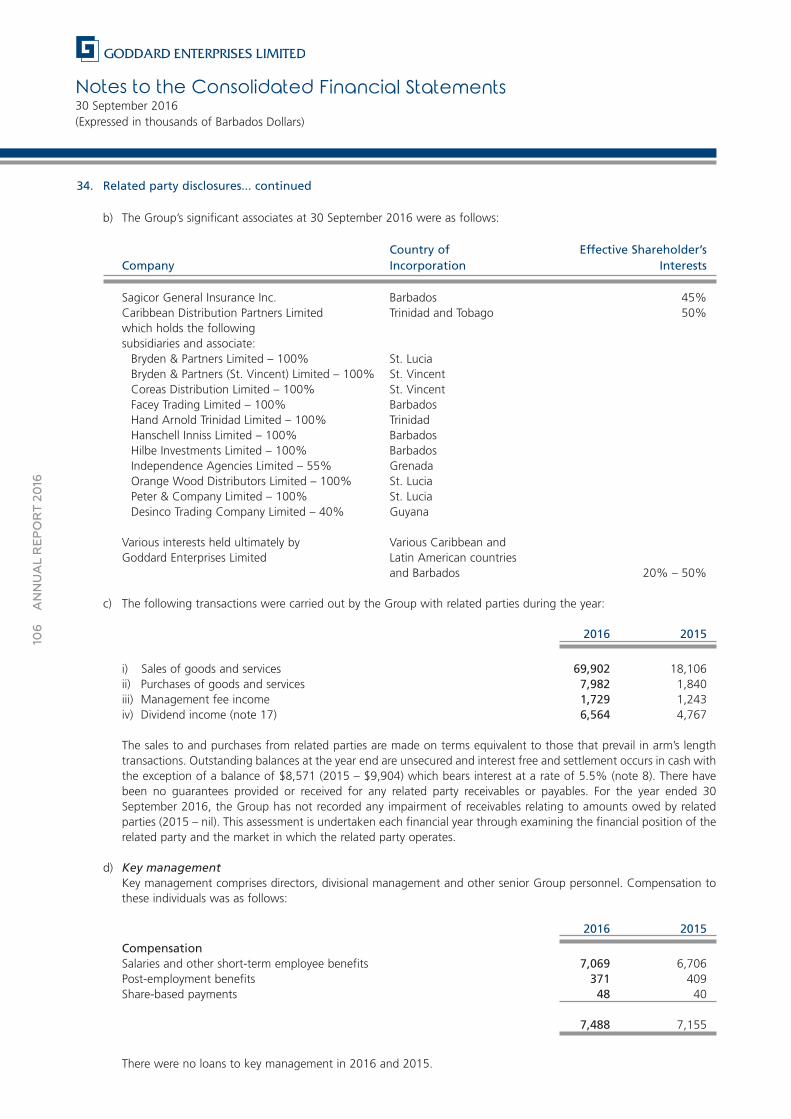
Notes to the Consolidated Financial Statements30 September 2016(Expressed in thousands of Barbados Dollars)
106
ANNUAL REPORT 20
16
34. Related party disclosures... continued
b) The Group’s significant associates at 30 September 2016 were as follows:
Country of Effective Shareholder’sCompany Incorporation Interests
Sagicor General Insurance Inc. Barbados 45%Caribbean Distribution Partners Limited Trinidad and Tobago 50%which holds the followingsubsidiaries and associate:Bryden & Partners Limited – 100% St. LuciaBryden & Partners (St. Vincent) Limited – 100% St. VincentCoreas Distribution Limited – 100% St. VincentFacey Trading Limited – 100% BarbadosHand Arnold Trinidad Limited – 100% TrinidadHanschell Inniss Limited – 100% BarbadosHilbe Investments Limited – 100% BarbadosIndependence Agencies Limited – 55% GrenadaOrange Wood Distributors Limited – 100% St. LuciaPeter & Company Limited – 100% St. LuciaDesinco Trading Company Limited – 40% Guyana
Various interests held ultimately by Various Caribbean andGoddard Enterprises Limited Latin American countries
and Barbados 20% – 50%
c) The following transactions were carried out by the Group with related parties during the year:
2016 2015
i) Sales of goods and services 69,902 18,106ii) Purchases of goods and services 7,982 1,840iii) Management fee income 1,729 1,243iv) Dividend income (note 17) 6,564 4,767
The sales to and purchases from related parties are made on terms equivalent to those that prevail in arm’s lengthtransactions. Outstanding balances at the year end are unsecured and interest free and settlement occurs in cash withthe exception of a balance of $8,571 (2015 – $9,904) which bears interest at a rate of 5.5% (note 8). There havebeen no guarantees provided or received for any related party receivables or payables. For the year ended 30September 2016, the Group has not recorded any impairment of receivables relating to amounts owed by relatedparties (2015 – nil). This assessment is undertaken each financial year through examining the financial position of therelated party and the market in which the related party operates.
d) Key management Key management comprises directors, divisional management and other senior Group personnel. Compensation tothese individuals was as follows:
2016 2015
CompensationSalaries and other short-term employee benefits 7,069 6,706Post-employment benefits 371 409Share-based payments 48 40
7,488 7,155
There were no loans to key management in 2016 and 2015.
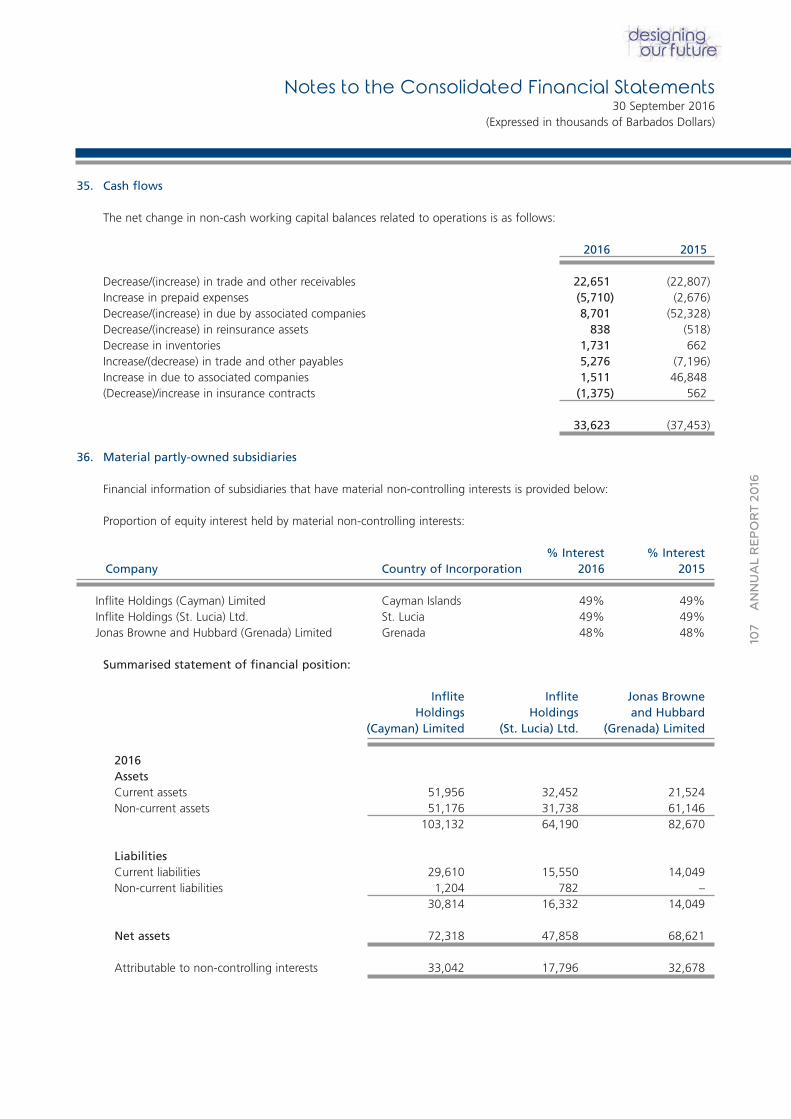
Notes to the Consolidated Financial Statements30 September 2016
(Expressed in thousands of Barbados Dollars)
107
ANNUAL REPORT 20
16
35. Cash flows
The net change in non-cash working capital balances related to operations is as follows:
2016 2015
Decrease/(increase) in trade and other receivables 22,651 (22,807)Increase in prepaid expenses (5,710) (2,676)Decrease/(increase) in due by associated companies 8,701 (52,328)Decrease/(increase) in reinsurance assets 838 (518)Decrease in inventories 1,731 662Increase/(decrease) in trade and other payables 5,276 (7,196)Increase in due to associated companies 1,511 46,848(Decrease)/increase in insurance contracts (1,375) 562
33,623 (37,453)
36. Material partly-owned subsidiaries
Financial information of subsidiaries that have material non-controlling interests is provided below:
Proportion of equity interest held by material non-controlling interests:
% Interest % InterestCompany Country of Incorporation 2016 2015
Inflite Holdings (Cayman) Limited Cayman Islands 49% 49%Inflite Holdings (St. Lucia) Ltd. St. Lucia 49% 49%Jonas Browne and Hubbard (Grenada) Limited Grenada 48% 48%
Summarised statement of financial position:
Inflite Inflite Jonas BrowneHoldings Holdings and Hubbard
(Cayman) Limited (St. Lucia) Ltd. (Grenada) Limited
2016AssetsCurrent assets 51,956 32,452 21,524Non-current assets 51,176 31,738 61,146
103,132 64,190 82,670
LiabilitiesCurrent liabilities 29,610 15,550 14,049Non-current liabilities 1,204 782 –
30,814 16,332 14,049
Net assets 72,318 47,858 68,621
Attributable to non-controlling interests 33,042 17,796 32,678
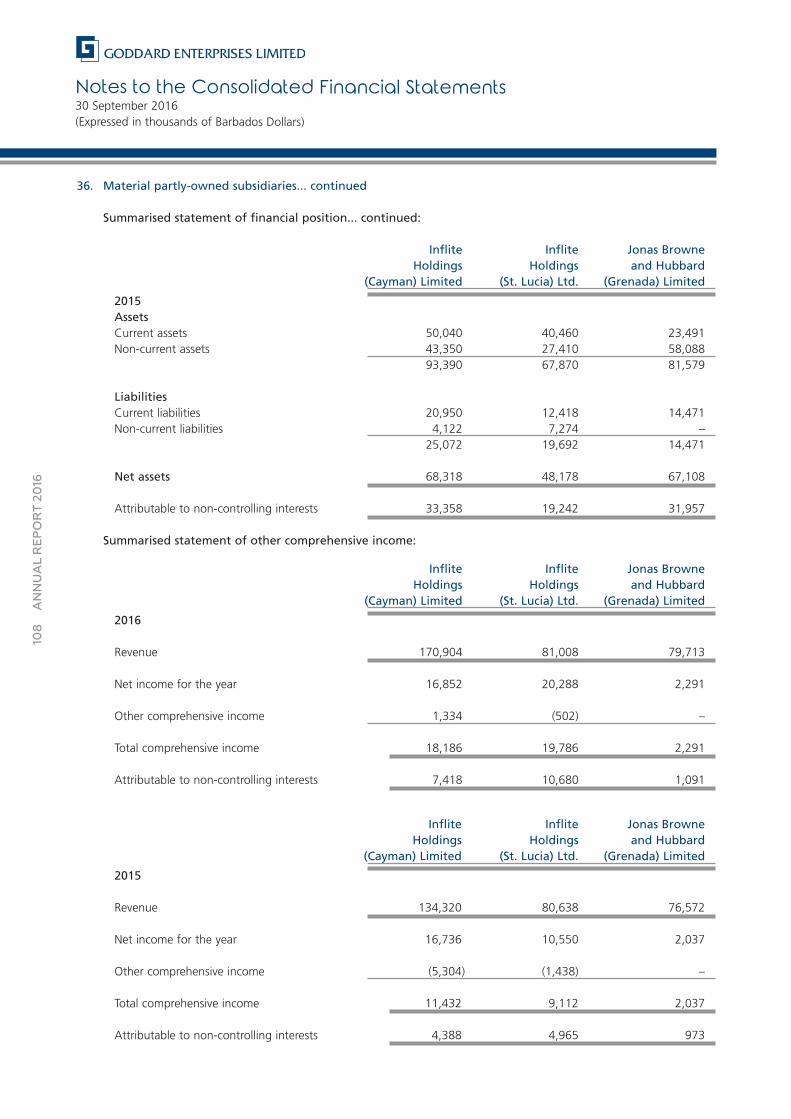
Notes to the Consolidated Financial Statements30 September 2016(Expressed in thousands of Barbados Dollars)
108
ANNUAL REPORT 20
16
36. Material partly-owned subsidiaries... continued
Summarised statement of financial position... continued:
Inflite Inflite Jonas BrowneHoldings Holdings and Hubbard
(Cayman) Limited (St. Lucia) Ltd. (Grenada) Limited
2015AssetsCurrent assets 50,040 40,460 23,491Non-current assets 43,350 27,410 58,088
93,390 67,870 81,579
LiabilitiesCurrent liabilities 20,950 12,418 14,471Non-current liabilities 4,122 7,274 –
25,072 19,692 14,471
Net assets 68,318 48,178 67,108
Attributable to non-controlling interests 33,358 19,242 31,957
Summarised statement of other comprehensive income:
Inflite Inflite Jonas BrowneHoldings Holdings and Hubbard
(Cayman) Limited (St. Lucia) Ltd. (Grenada) Limited
2016
Revenue 170,904 81,008 79,713
Net income for the year 16,852 20,288 2,291
Other comprehensive income 1,334 (502) –
Total comprehensive income 18,186 19,786 2,291
Attributable to non-controlling interests 7,418 10,680 1,091
Inflite Inflite Jonas BrowneHoldings Holdings and Hubbard
(Cayman) Limited (St. Lucia) Ltd. (Grenada) Limited
2015
Revenue 134,320 80,638 76,572
Net income for the year 16,736 10,550 2,037
Other comprehensive income (5,304) (1,438) –
Total comprehensive income 11,432 9,112 2,037
Attributable to non-controlling interests 4,388 4,965 973
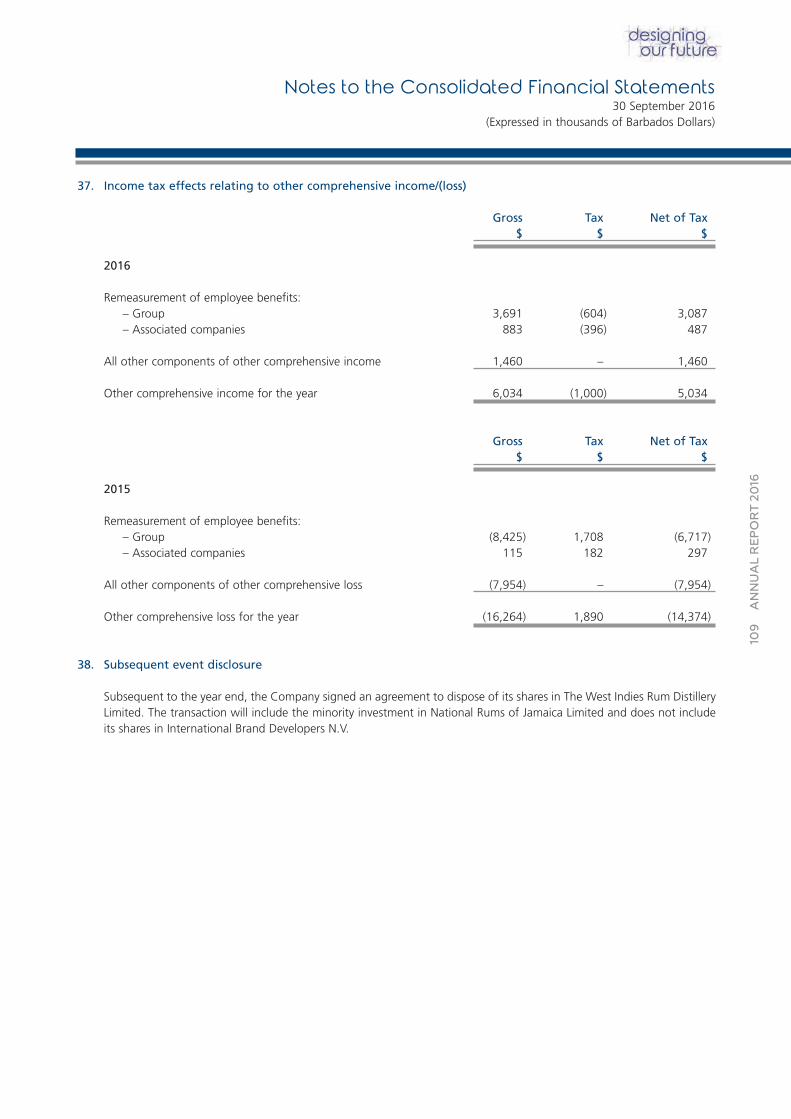
Notes to the Consolidated Financial Statements30 September 2016
(Expressed in thousands of Barbados Dollars)
109
ANNUAL REPORT 20
16
37. Income tax effects relating to other comprehensive income/(loss)
Gross Tax Net of Tax$ $ $
2016
Remeasurement of employee benefits:– Group 3,691 (604) 3,087– Associated companies 883 (396) 487
All other components of other comprehensive income 1,460 – 1,460
Other comprehensive income for the year 6,034 (1,000) 5,034
Gross Tax Net of Tax$ $ $
2015
Remeasurement of employee benefits:– Group (8,425) 1,708 (6,717)– Associated companies 115 182 297
All other components of other comprehensive loss (7,954) – (7,954)
Other comprehensive loss for the year (16,264) 1,890 (14,374)
38. Subsequent event disclosure
Subsequent to the year end, the Company signed an agreement to dispose of its shares in The West Indies Rum DistilleryLimited. The transaction will include the minority investment in National Rums of Jamaica Limited and does not includeits shares in International Brand Developers N.V.
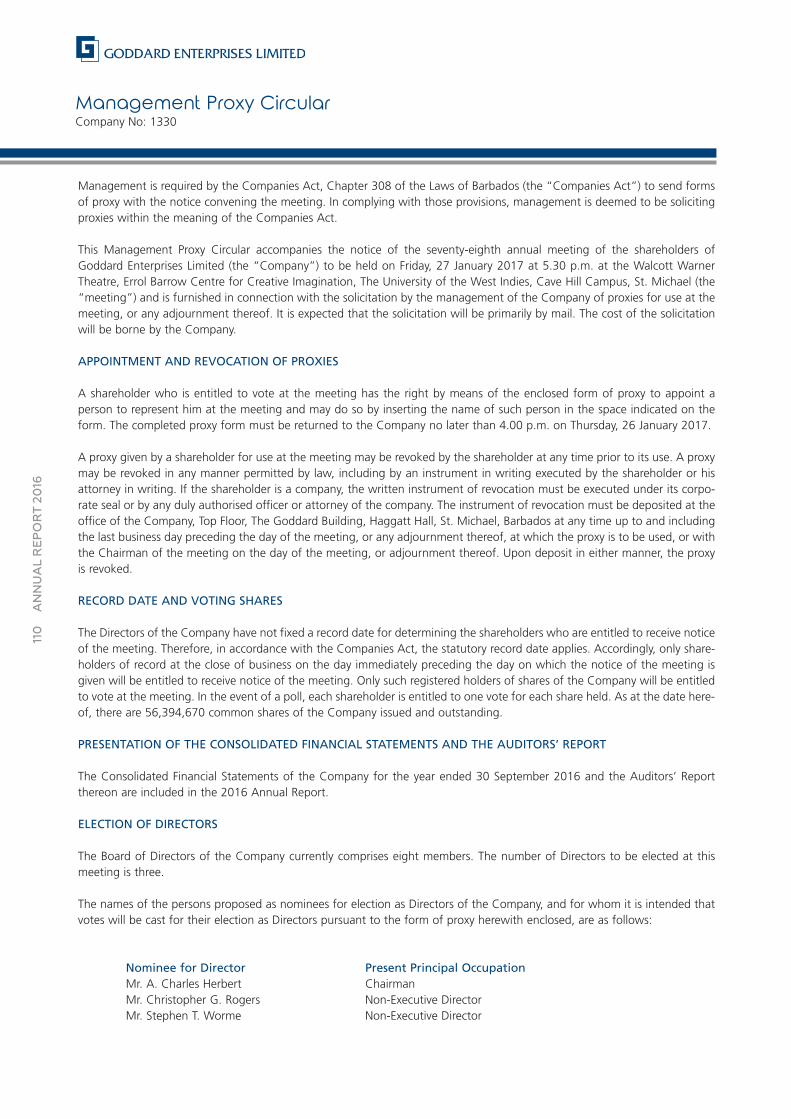
Management Proxy CircularCompany No: 1330
110
ANNUAL REPORT 20
16
Management is required by the Companies Act, Chapter 308 of the Laws of Barbados (the “Companies Act”) to send formsof proxy with the notice convening the meeting. In complying with those provisions, management is deemed to be solicitingproxies within the meaning of the Companies Act.
This Management Proxy Circular accompanies the notice of the seventy-eighth annual meeting of the shareholders ofGoddard Enterprises Limited (the “Company”) to be held on Friday, 27 January 2017 at 5.30 p.m. at the Walcott WarnerTheatre, Errol Barrow Centre for Creative Imagination, The University of the West Indies, Cave Hill Campus, St. Michael (the“meeting”) and is furnished in connection with the solicitation by the management of the Company of proxies for use at themeeting, or any adjournment thereof. It is expected that the solicitation will be primarily by mail. The cost of the solicitationwill be borne by the Company.
APPOINTMENT AND REVOCATION OF PROXIES
A shareholder who is entitled to vote at the meeting has the right by means of the enclosed form of proxy to appoint a person to represent him at the meeting and may do so by inserting the name of such person in the space indicated on theform. The completed proxy form must be returned to the Company no later than 4.00 p.m. on Thursday, 26 January 2017.
A proxy given by a shareholder for use at the meeting may be revoked by the shareholder at any time prior to its use. A proxymay be revoked in any manner permitted by law, including by an instrument in writing executed by the shareholder or hisattorney in writing. If the shareholder is a company, the written instrument of revocation must be executed under its corpo-rate seal or by any duly authorised officer or attorney of the company. The instrument of revocation must be deposited at theoffice of the Company, Top Floor, The Goddard Building, Haggatt Hall, St. Michael, Barbados at any time up to and includingthe last business day preceding the day of the meeting, or any adjournment thereof, at which the proxy is to be used, or withthe Chairman of the meeting on the day of the meeting, or adjournment thereof. Upon deposit in either manner, the proxyis revoked.
RECORD DATE AND VOTING SHARES
The Directors of the Company have not fixed a record date for determining the shareholders who are entitled to receive noticeof the meeting. Therefore, in accordance with the Companies Act, the statutory record date applies. Accordingly, only share-holders of record at the close of business on the day immediately preceding the day on which the notice of the meeting isgiven will be entitled to receive notice of the meeting. Only such registered holders of shares of the Company will be entitledto vote at the meeting. In the event of a poll, each shareholder is entitled to one vote for each share held. As at the date here-of, there are 56,394,670 common shares of the Company issued and outstanding.
PRESENTATION OF THE CONSOLIDATED FINANCIAL STATEMENTS AND THE AUDITORS’ REPORT
The Consolidated Financial Statements of the Company for the year ended 30 September 2016 and the Auditors’ Reportthereon are included in the 2016 Annual Report.
ELECTION OF DIRECTORS
The Board of Directors of the Company currently comprises eight members. The number of Directors to be elected at thismeeting is three.
The names of the persons proposed as nominees for election as Directors of the Company, and for whom it is intended thatvotes will be cast for their election as Directors pursuant to the form of proxy herewith enclosed, are as follows:
Nominee for Director Present Principal OccupationMr. A. Charles Herbert ChairmanMr. Christopher G. Rogers Non-Executive DirectorMr. Stephen T. Worme Non-Executive Director
111
ANNUAL REPORT 20
16
Messrs. A. Charles Herbert, Christopher G. Rogers and Stephen T. Worme are currently Directors of the Company and willretire at the close of the seventy-eighth annual meeting in accordance with article 4.4 of the by-laws of the Company butbeing qualified, are eligible for re-election. Each of Messrs. Herbert, Rogers and Worme was last re-elected to the Board atthe seventy-fifth annual meeting of the shareholders held on 31 January 2014 for a term of three years.
It is proposed that the term of office for each of Messrs. Herbert, Rogers and Worme will expire at the close of the third annual meeting of shareholders following his election or until his successor is elected or appointed.
The management of the Company does not contemplate that any of the three persons named above will, for any reason,become unable or unwilling to serve as a Director.
RE-APPOINTMENT OF AUDITORS
It is proposed to nominate the firm of Ernst & Young, Chartered Accountants, the present Auditors of the consolidated financialstatements of the Company, as the Auditors of the Company to hold office until the next annual meeting of shareholders.
DISCRETIONARY AUTHORITY
Management knows of no matter to come before the meeting other than the matters referred to in the Notice of Meetingenclosed herewith. However, if any other matter which is not now known to management should properly come before themeeting or any adjournment thereof, the shares represented by proxies in favour of management nominees will be voted onany such matter in accordance with the best judgment of the proxy holders.
Similar discretionary authority is deemed to be conferred with respect to any amendment to any matter identified in the Noticeof Meeting.
The contents of this Management Proxy Circular and the sending thereof to all the holders of shares of the Company havebeen approved by the Directors of the Company.
No director's statement is submitted pursuant to section 71(2) of the Companies Act.
No auditor's statement is submitted pursuant to section 163(1) of the Companies Act.
No shareholder's statement is submitted pursuant to sections 112(a) and 113(2) of the Companies Act.
6 December 2016
Kathy-Ann L. ScantleburyCorporate Secretary
Management Proxy Circular... continued
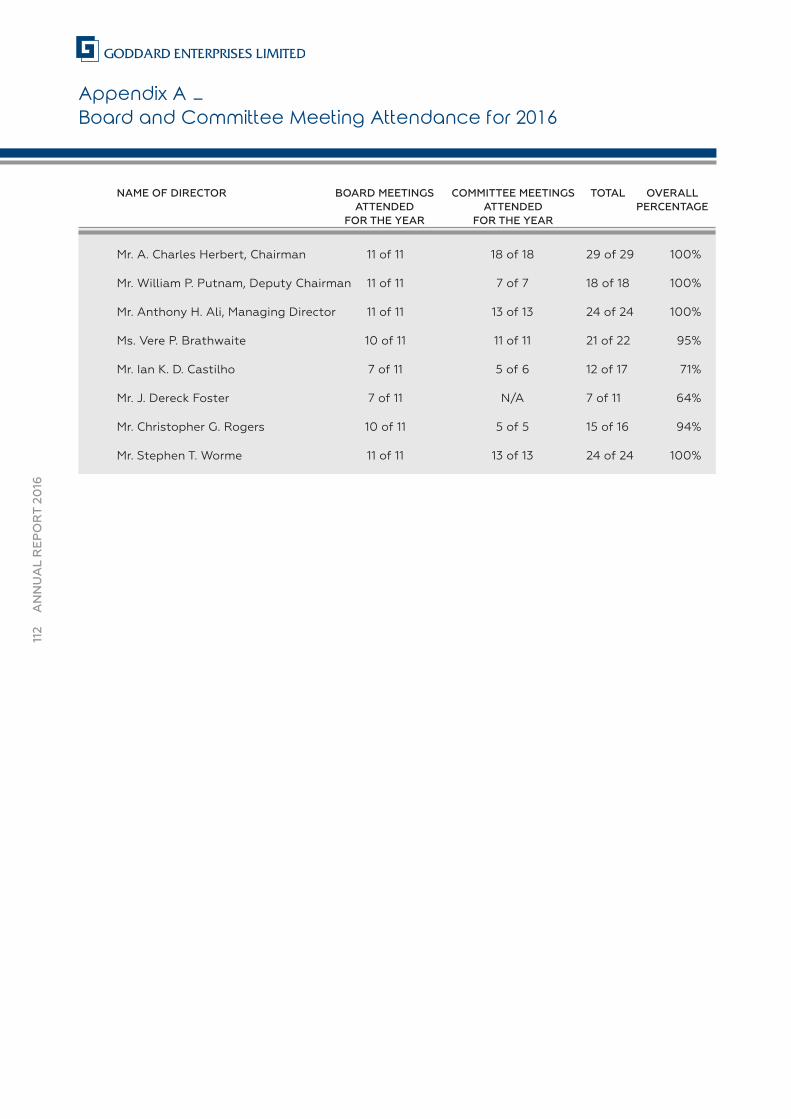
112
ANNUAL REPORT 20
16
NAME OF DIRECTOR BOARD MEETINGS COMMITTEE MEETINGS TOTAL OVERALLATTENDED ATTENDED PERCENTAGE
FOR THE YEAR FOR THE YEAR
Mr. A. Charles Herbert, Chairman 11 of 11 18 of 18 29 of 29 100%
Mr. William P. Putnam, Deputy Chairman 11 of 11 7 of 7 18 of 18 100%
Mr. Anthony H. Ali, Managing Director 11 of 11 13 of 13 24 of 24 100%
Ms. Vere P. Brathwaite 10 of 11 11 of 11 21 of 22 95%
Mr. Ian K. D. Castilho 7 of 11 5 of 6 12 of 17 71%
Mr. J. Dereck Foster 7 of 11 N/A 7 of 11 64%
Mr. Christopher G. Rogers 10 of 11 5 of 5 15 of 16 94%
Mr. Stephen T. Worme 11 of 11 13 of 13 24 of 24 100%
Appendix A –
Board and Committee Meeting Attendance for 2016
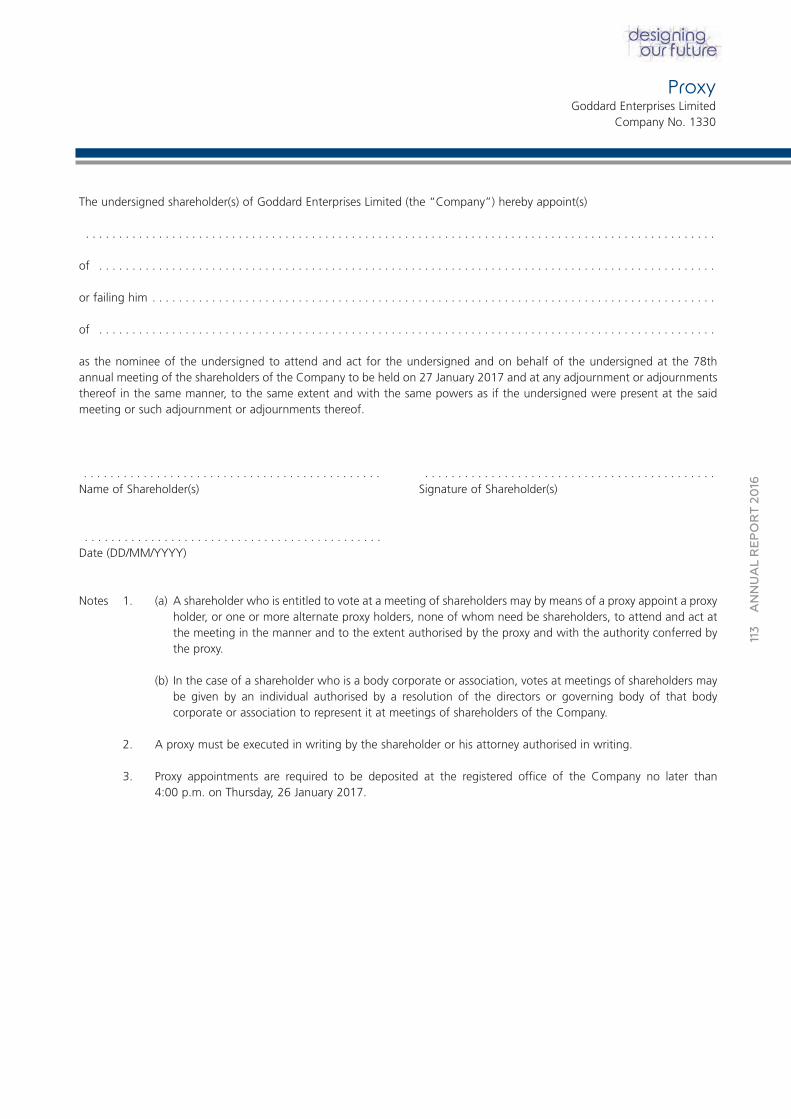
113
ANNUAL REPORT 20
16
ProxyGoddard Enterprises Limited
Company No. 1330
The undersigned shareholder(s) of Goddard Enterprises Limited (the “Company”) hereby appoint(s)
. . . . . . . . . . . . . . . . . . . . . . . . . . . . . . . . . . . . . . . . . . . . . . . . . . . . . . . . . . . . . . . . . . . . . . . . . . . . . . . . . . . . . . . . . . . . . . .
of . . . . . . . . . . . . . . . . . . . . . . . . . . . . . . . . . . . . . . . . . . . . . . . . . . . . . . . . . . . . . . . . . . . . . . . . . . . . . . . . . . . . . . . . . . . . .
or failing him . . . . . . . . . . . . . . . . . . . . . . . . . . . . . . . . . . . . . . . . . . . . . . . . . . . . . . . . . . . . . . . . . . . . . . . . . . . . . . . . . . . . .
of . . . . . . . . . . . . . . . . . . . . . . . . . . . . . . . . . . . . . . . . . . . . . . . . . . . . . . . . . . . . . . . . . . . . . . . . . . . . . . . . . . . . . . . . . . . . .
as the nominee of the undersigned to attend and act for the undersigned and on behalf of the undersigned at the 78thannual meeting of the shareholders of the Company to be held on 27 January 2017 and at any adjournment or adjournmentsthereof in the same manner, to the same extent and with the same powers as if the undersigned were present at the saidmeeting or such adjournment or adjournments thereof.
. . . . . . . . . . . . . . . . . . . . . . . . . . . . . . . . . . . . . . . . . . . . . . . . . . . . . . . . . . . . . . . . . . . . . . . . . . . . . . . . . . . . . . . . .Name of Shareholder(s) Signature of Shareholder(s)
. . . . . . . . . . . . . . . . . . . . . . . . . . . . . . . . . . . . . . . . . . . . .Date (DD/MM/YYYY)
Notes 1. (a) A shareholder who is entitled to vote at a meeting of shareholders may by means of a proxy appoint a proxyholder, or one or more alternate proxy holders, none of whom need be shareholders, to attend and act atthe meeting in the manner and to the extent authorised by the proxy and with the authority conferred bythe proxy.
(b) In the case of a shareholder who is a body corporate or association, votes at meetings of shareholders maybe given by an individual authorised by a resolution of the directors or governing body of that body corporate or association to represent it at meetings of shareholders of the Company.
2. A proxy must be executed in writing by the shareholder or his attorney authorised in writing.
3. Proxy appointments are required to be deposited at the registered office of the Company no later than 4:00 p.m. on Thursday, 26 January 2017.

| A
NN
UA
L R
EP
OR
T 2
01
6| |||
AN
AN
ANN
AN
AN
AN
AN
AN
AN
AN
AN
AN
ANN
AN
AN
AN
AN
AAAN
UN
UN
UN
UN
UN
UNN
UN
UN
UN
UN
UN
UN
UN
UUN
UUUUNN
AL
AL
AL
AL
AL
AL
AL
AL
AL
AL
AL
AL
AL
AL
AL
AL
AL
AL
AARRRRRRRRRRRRRRRRRRR
EP
EP
EP
EP
EP
EP
EP
EP
EP
EP
EP
EP
EP
EP
EP
EP
EP
EP
EEO
RO
RO
RO
RO
RO
RO
RO
RO
RO
RO
RO
RO
RO
RO
RO
RO
RRTTTTTTTTTTTTTTTTTTTTTTTTTTTTTTTTTTTTTTTT
20
20
20
20
20
20
20
20
20
200
200
20
2000
21
61
61
61
61
61
61
61
61
61
61
61
61
61
61
61
61
61
61
61
61
61
61
661
61
61
66661
61
61
61111111