Embed Size (px)
Citation preview
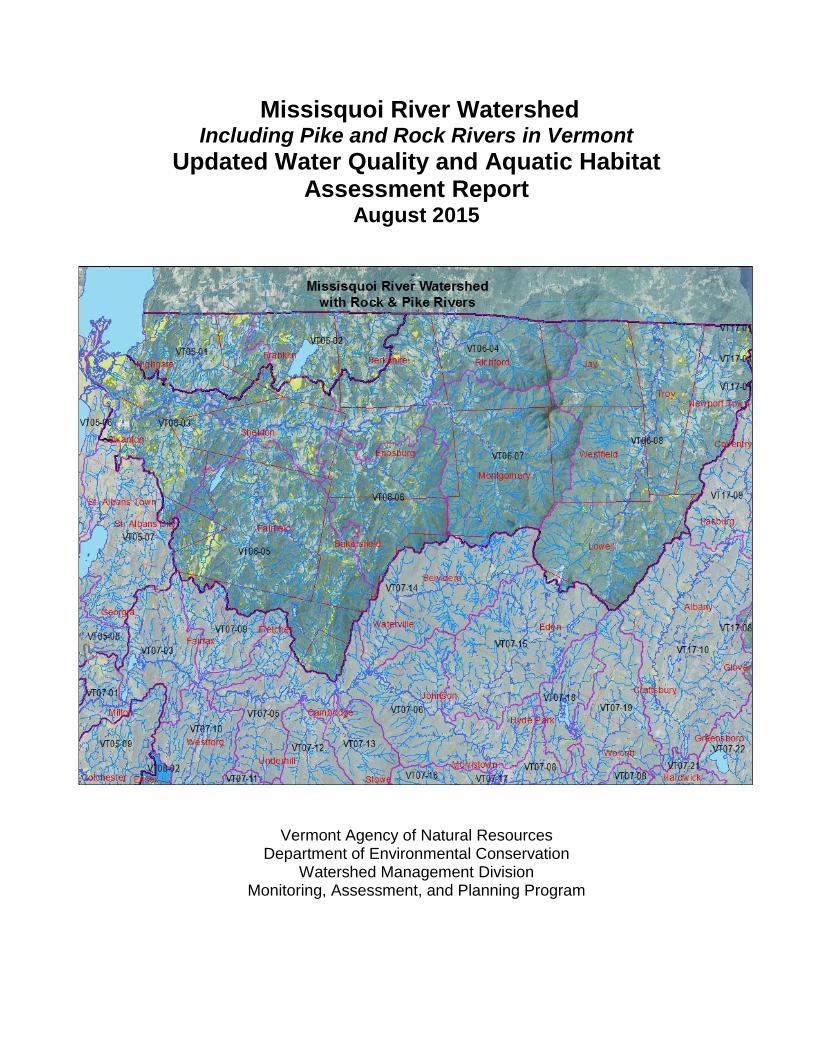
Missisquoi River Watershed Including Pike and Rock Rivers in Vermont
Updated Water Quality and Aquatic Habitat Assessment Report
August 2015
Vermont Agency of Natural Resources Department of Environmental Conservation
Watershed Management Division Monitoring, Assessment, and Planning Program
Table of Contents
Missisquoi River Watershed ......................................................................................................... 1
General Description .................................................................................................................. 1
Missisquoi River .................................................................................................................... 1
Rock River ............................................................................................................................. 1
Pike River .............................................................................................................................. 2
Earlier Information on the Rivers within this Report .................................................................. 2
Missisquoi River Basin Association sampling ........................................................................ 2
Upper Missisquoi River ................................................................................................................. 3
General Description .................................................................................................................. 3
Upper Missisquoi River and Tributaries Summary of Segments with Impacts .......................... 3
Assessment Information for the Upper Missisquoi Watershed .................................................. 4
Biological Monitoring for the Upper Mississquoi 2004 – 2014 ............................................... 4
Physical Assessments for Upper Missisquoi ....................................................................... 10
Hazardous Waste Sites ....................................................................................................... 11
Jay Branch Subwatershed of Upper Missisquoi Watershed ....................................................... 12
General Description ................................................................................................................ 12
Jay Branch Summary of Segments with Impacts .................................................................... 13
Assessment Information for the Jay Branch Subwatershed .................................................... 14
Biological Monitoring Results .............................................................................................. 14
Water Chemistry Monitoring Results 2004 – 2014 .............................................................. 17
Mid and Lower Missisquoi River ................................................................................................. 18
General Watershed Description .............................................................................................. 18
Mid Missisquoi River and Tributaries Segments with Impacts ................................................ 19
Assessment Information for the Mid and Lower Missisquoi River ........................................... 20
Biological Monitoring for the Mid and Lower Mississquoi 2004 – 2014* .............................. 21
Fisheries .............................................................................................................................. 24
Hazardous sites ................................................................................................................... 25
Lampricide impacts ............................................................................................................. 26
Black Creek ................................................................................................................................ 27
General Description ................................................................................................................ 27
Summary of Segments with Impacts ....................................................................................... 27
Assessment Information for the Black Creek Watershed ........................................................ 27
Biological Monitoring for the Black Creek watershed 2004 – 2014 ...................................... 27
Water Quality Monitoring ..................................................................................................... 28
Tyler Branch ............................................................................................................................... 30
General Description ................................................................................................................ 30
Summary of Segments with Impacts ....................................................................................... 30
Assessment Information for the Tyler Branch Watershed ....................................................... 30
Biological Monitoring in the Tyler Branch Watershed .......................................................... 30
Biological Monitoring Needed in the Tyler Branch Watershed............................................. 31
Water Quality Monitoring ..................................................................................................... 31
Physical Assessments ......................................................................................................... 31
Trout River .................................................................................................................................. 34
General Description ................................................................................................................ 34
Summary of Segments with Impacts ....................................................................................... 34
Assessment InformationTrout River Watershed ...................................................................... 34
Biological Monitoring in the Trout River Watershed 2004 – 2014 ........................................ 34
Rock and Pike Rivers ................................................................................................................. 36
General Description ................................................................................................................ 36
Summary of Segments with Impacts ....................................................................................... 37
Assessment Information for the Rock and Pike Rivers ........................................................... 38
Biological Monitoring for the Rock and Pike Rivers 2004 – 2014 ........................................ 38
Chemistry Data for Rock and Pike Rivers ........................................................................... 38
References and Resources ........................................................................................................ 39
Websites ................................................................................................................................. 40
Appendix 1.................................................................................................................................... 1
History of Impacts to Jay Branch & tributaries .......................................................................... 1
Jay Peak Village and golf course development water and wetland issues ............................ 1
Post WQ Remediation Plans ................................................................................................. 2
Appendix 2.................................................................................................................................... 5
Water Quality Monitoring results for 2013 and 2014 ................................................................. 5
Water Quality Monitoring Results from 2013 ......................................................................... 5
Water Quality Monitoring Results from 2014 ......................................................................... 6
1
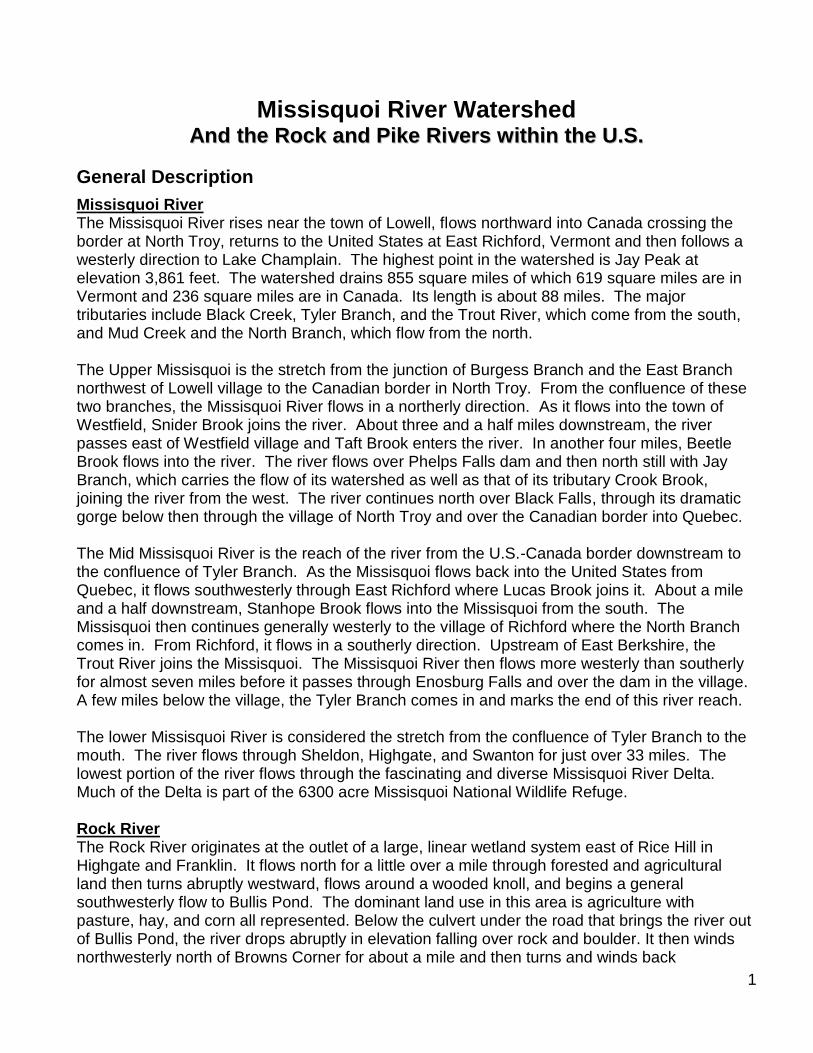
Missisquoi River Watershed AAnndd tthhee RRoocckk aanndd PPiikkee RRiivveerrss wwiitthhiinn tthhee UU..SS..
General Description
Missisquoi River The Missisquoi River rises near the town of Lowell, flows northward into Canada crossing the border at North Troy, returns to the United States at East Richford, Vermont and then follows a westerly direction to Lake Champlain. The highest point in the watershed is Jay Peak at elevation 3,861 feet. The watershed drains 855 square miles of which 619 square miles are in Vermont and 236 square miles are in Canada. Its length is about 88 miles. The major tributaries include Black Creek, Tyler Branch, and the Trout River, which come from the south, and Mud Creek and the North Branch, which flow from the north.
The Upper Missisquoi is the stretch from the junction of Burgess Branch and the East Branch northwest of Lowell village to the Canadian border in North Troy. From the confluence of these two branches, the Missisquoi River flows in a northerly direction. As it flows into the town of Westfield, Snider Brook joins the river. About three and a half miles downstream, the river passes east of Westfield village and Taft Brook enters the river. In another four miles, Beetle Brook flows into the river. The river flows over Phelps Falls dam and then north still with Jay Branch, which carries the flow of its watershed as well as that of its tributary Crook Brook, joining the river from the west. The river continues north over Black Falls, through its dramatic gorge below then through the village of North Troy and over the Canadian border into Quebec.
The Mid Missisquoi River is the reach of the river from the U.S.-Canada border downstream to the confluence of Tyler Branch. As the Missisquoi flows back into the United States from Quebec, it flows southwesterly through East Richford where Lucas Brook joins it. About a mile and a half downstream, Stanhope Brook flows into the Missisquoi from the south. The Missisquoi then continues generally westerly to the village of Richford where the North Branch comes in. From Richford, it flows in a southerly direction. Upstream of East Berkshire, the Trout River joins the Missisquoi. The Missisquoi River then flows more westerly than southerly for almost seven miles before it passes through Enosburg Falls and over the dam in the village. A few miles below the village, the Tyler Branch comes in and marks the end of this river reach.
The lower Missisquoi River is considered the stretch from the confluence of Tyler Branch to the mouth. The river flows through Sheldon, Highgate, and Swanton for just over 33 miles. The lowest portion of the river flows through the fascinating and diverse Missisquoi River Delta. Much of the Delta is part of the 6300 acre Missisquoi National Wildlife Refuge.
Rock River The Rock River originates at the outlet of a large, linear wetland system east of Rice Hill in Highgate and Franklin. It flows north for a little over a mile through forested and agricultural land then turns abruptly westward, flows around a wooded knoll, and begins a general southwesterly flow to Bullis Pond. The dominant land use in this area is agriculture with pasture, hay, and corn all represented. Below the culvert under the road that brings the river out of Bullis Pond, the river drops abruptly in elevation falling over rock and boulder. It then winds northwesterly north of Browns Corner for about a mile and then turns and winds back
2
southwesterly into the town of Highgate. Through this stretch the river is in a small valley amidst extensive flat fields of hay, corn, and pasture. About one-half mile past the mouth of Steele Brook, the river begins a meandering northerly flow for over six miles to the Canadian border. Below Rollo Road, the river is now in a much higher, steep and narrow valley.
In Canada, it continues northwesterly and then curves and heads southwesterly back into the United States. Not far south of the border, the river flows through a large floodplain forest and then into Missisquoi Bay.
Pike River The Pike River originates in the hills of Berkshire, Vermont then flows southerly for approximately 4 miles to the confluence of Mineral Brook before meandering around to the west then flowing northerly and into Quebec. In Quebec, the Pike River makes a large arc northwesterly and then southerly into Missisquoi Bay in Canada. About 85% of the Pike River watershed is in Quebec. The outlet stream from Lake Carmi and its watershed join the Pike River about a mile south of the Quebec/Vermont border.
Earlier Information on the Rivers within this Report
A 2004 Basin 6 assessment report that covered the Missisquoi River and all of its tributaries included the following information that is not repeated here:
Sites described in the Waterfalls, Cascades, and Gorges of Vermont (1985) report
Sites described in the The Vermont Swimming Hole Study (1992) report
Sites described in the Whitewater Rivers of Vermont (1989) report
Documented significant natural communities
Descriptions of most of the named brooks in the watershed
In addition, the Missisquoi Bay Basin Water Quality Management Plan was completed in March 2013. This plan has the above information included as well as monitoring and assessment data and information since the 2004 assessment report updated through 2010 and 2011 in part.
The Rock and Pike Rivers were assessed back in 2003 as part of the Basin 5 Water Quality Assessment Report. When Basin 5 rivers and streams were updated in 2013, the Rock and Pike were not included as they have now been considered with the Missisquoi Bay watershed in the basin plan that was completed in March 2013.
Missisquoi River Basin Association sampling Ten sites on the mainstem of the Missisquoi River and two sites on tributaries were sampled by MRBA volunteers for total phosphorus, total nitrogen, and turbidity in the period 2005 through 2007. Then in 2008, the sampling effort was increased greatly and 22 sites were sampled on the mainstem and a number of tributaries. Some of the 22 sites were at the original sampling locations and a number were new. Five of the mainstem sites and 14 of the tributary sites have six or more years of sampling data – all of these were sampled as recently as 2014.
In 2013, two sites on Godin Brook were added and these have now been sampled for two seasons. See Table 1 in the MRBA Summary of Results 2005 – 2014 report.

3
UUppppeerr MMiissssiissqquuooii RRiivveerr (not including the Jay Branch watershed)
General Description
The Upper Missisquoi River is the stretch from the junction of Burgess Branch and the East Branch northwest of Lowell village to the Canadian border in North Troy. The named streams to the upper Missisquoi River include: LeClair Brook, Snider Brook, Mineral Spring Brook, Lily Brook, Taft Brook, Coburn Brook, Beetle Brook, Bugbee Brook, and Jay Branch with its tributary Crook Brook. This stretch of river includes Black Falls and its dramatic gorge.
Upper Missisquoi River and Tributaries Summary of Segments with Impacts
The table below summarizes the surface waters that appear on either the 303(d) Impaired Waters List, the Other Priority Waters Lists (Parts B through F that have altered or impaired waters on them), or the Stressed Waters List from the 2014 reporting cycle. Also see Figure 1, a map of the Upper Missisquoi on page 9. Table 1. River or Stream Segments with Impacts on Upper Missisquoi and tributaries
Stream or Lake Segment
Milage & Status
Pollutant Source Other information
Mud Creek, Vermont border up to rm 6.5
3.2 miles Impaired Part A list
nutrients, sediment
agricultural land runoff
Coburn Brook, mouth to rm 0.2
0.2 miles Impaired Part A list
Nutrients agricultural activity and runoff
Burgess Branch rm 4.9 to 5.4
0.5 miles Impaired Part A list
sediment, asbestos fibers
old asbestos mine tailing erosion
Burgess Branch Trib 11, mouth to rm 0.5
0.5 miles Impaired Part A list
sediment, asbestos fibers
old asbestos mine tailing erosion
East Branch Missisquoi River, from gravel pit access road down
1.0 miles Stressed
sediment, nutrients
gravel pit and road leading to it, also pasture with no buffer
4
Assessment Information for the Upper Missisquoi Watershed
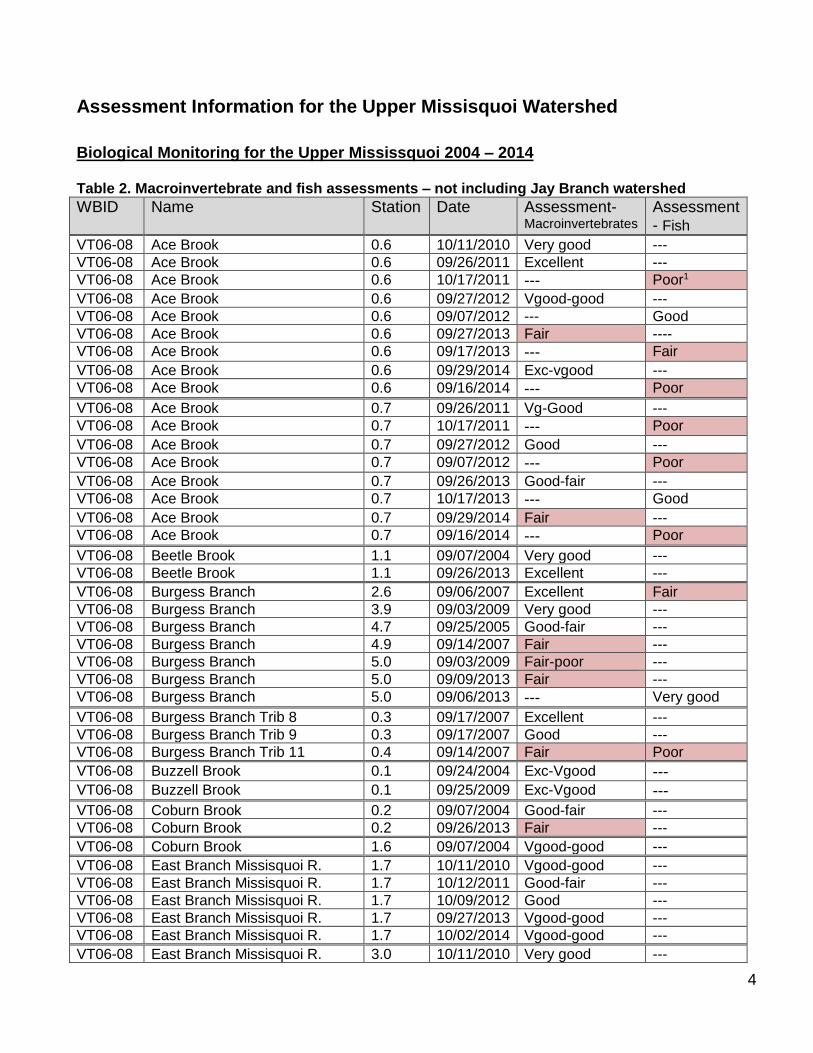
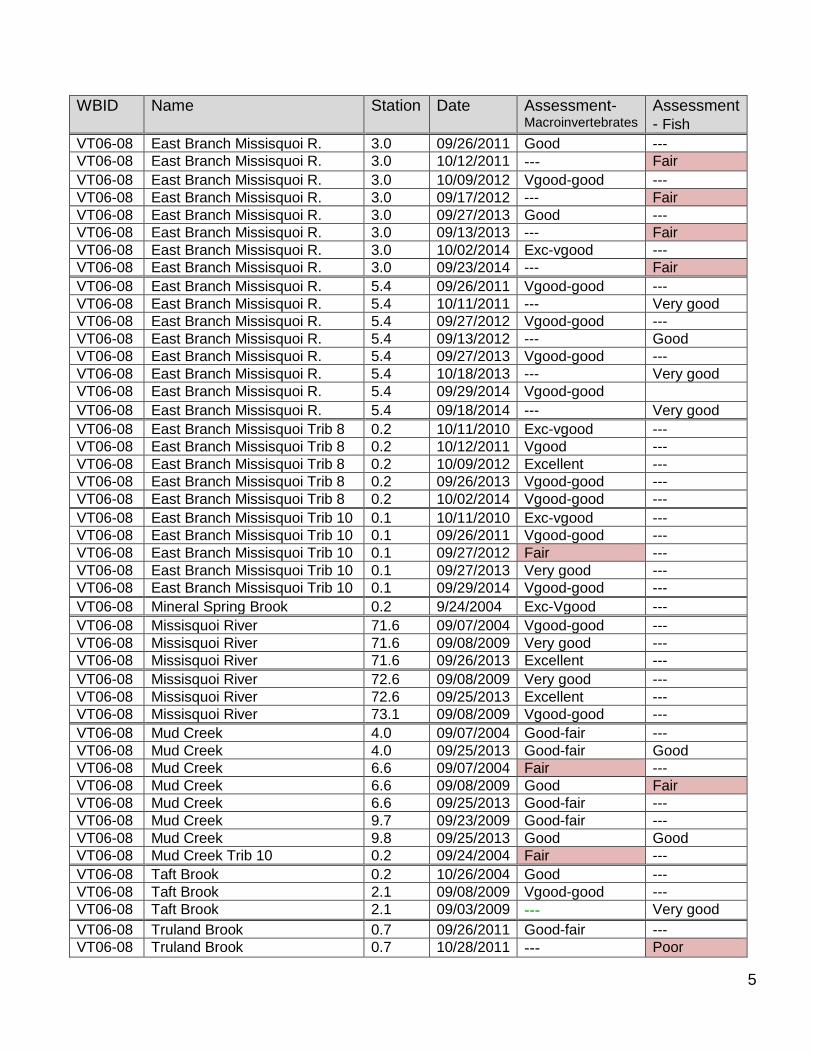
Biological Monitoring for the Upper Mississquoi 2004 – 2014 Table 2. Macroinvertebrate and fish assessments – not including Jay Branch watershed
WBID Name Station Date Assessment-Macroinvertebrates
Assessment - Fish
VT06-08 Ace Brook 0.6 10/11/2010 Very good --- VT06-08 Ace Brook 0.6 09/26/2011 Excellent --- VT06-08 Ace Brook 0.6 10/17/2011 --- Poor1
VT06-08 Ace Brook 0.6 09/27/2012 Vgood-good --- VT06-08 Ace Brook 0.6 09/07/2012 --- Good VT06-08 Ace Brook 0.6 09/27/2013 Fair ---- VT06-08 Ace Brook 0.6 09/17/2013 --- Fair
VT06-08 Ace Brook 0.6 09/29/2014 Exc-vgood --- VT06-08 Ace Brook 0.6 09/16/2014 --- Poor
VT06-08 Ace Brook 0.7 09/26/2011 Vg-Good --- VT06-08 Ace Brook 0.7 10/17/2011 --- Poor
VT06-08 Ace Brook 0.7 09/27/2012 Good --- VT06-08 Ace Brook 0.7 09/07/2012 --- Poor
VT06-08 Ace Brook 0.7 09/26/2013 Good-fair --- VT06-08 Ace Brook 0.7 10/17/2013 --- Good
VT06-08 Ace Brook 0.7 09/29/2014 Fair --- VT06-08 Ace Brook 0.7 09/16/2014 --- Poor
VT06-08 Beetle Brook 1.1 09/07/2004 Very good --- VT06-08 Beetle Brook 1.1 09/26/2013 Excellent ---
VT06-08 Burgess Branch 2.6 09/06/2007 Excellent Fair VT06-08 Burgess Branch 3.9 09/03/2009 Very good --- VT06-08 Burgess Branch 4.7 09/25/2005 Good-fair --- VT06-08 Burgess Branch 4.9 09/14/2007 Fair --- VT06-08 Burgess Branch 5.0 09/03/2009 Fair-poor --- VT06-08 Burgess Branch 5.0 09/09/2013 Fair --- VT06-08 Burgess Branch 5.0 09/06/2013 --- Very good
VT06-08 Burgess Branch Trib 8 0.3 09/17/2007 Excellent --- VT06-08 Burgess Branch Trib 9 0.3 09/17/2007 Good --- VT06-08 Burgess Branch Trib 11 0.4 09/14/2007 Fair Poor
VT06-08 Buzzell Brook 0.1 09/24/2004 Exc-Vgood --- VT06-08 Buzzell Brook 0.1 09/25/2009 Exc-Vgood ---
VT06-08 Coburn Brook 0.2 09/07/2004 Good-fair --- VT06-08 Coburn Brook 0.2 09/26/2013 Fair ---
VT06-08 Coburn Brook 1.6 09/07/2004 Vgood-good ---
VT06-08 East Branch Missisquoi R. 1.7 10/11/2010 Vgood-good --- VT06-08 East Branch Missisquoi R. 1.7 10/12/2011 Good-fair --- VT06-08 East Branch Missisquoi R. 1.7 10/09/2012 Good --- VT06-08 East Branch Missisquoi R. 1.7 09/27/2013 Vgood-good --- VT06-08 East Branch Missisquoi R. 1.7 10/02/2014 Vgood-good ---
VT06-08 East Branch Missisquoi R. 3.0 10/11/2010 Very good ---
5
WBID Name Station Date Assessment-Macroinvertebrates
Assessment - Fish
VT06-08 East Branch Missisquoi R. 3.0 09/26/2011 Good --- VT06-08 East Branch Missisquoi R. 3.0 10/12/2011 --- Fair
VT06-08 East Branch Missisquoi R. 3.0 10/09/2012 Vgood-good --- VT06-08 East Branch Missisquoi R. 3.0 09/17/2012 --- Fair VT06-08 East Branch Missisquoi R. 3.0 09/27/2013 Good --- VT06-08 East Branch Missisquoi R. 3.0 09/13/2013 --- Fair VT06-08 East Branch Missisquoi R. 3.0 10/02/2014 Exc-vgood --- VT06-08 East Branch Missisquoi R. 3.0 09/23/2014 --- Fair
VT06-08 East Branch Missisquoi R. 5.4 09/26/2011 Vgood-good --- VT06-08 East Branch Missisquoi R. 5.4 10/11/2011 --- Very good VT06-08 East Branch Missisquoi R. 5.4 09/27/2012 Vgood-good --- VT06-08 East Branch Missisquoi R. 5.4 09/13/2012 --- Good VT06-08 East Branch Missisquoi R. 5.4 09/27/2013 Vgood-good --- VT06-08 East Branch Missisquoi R. 5.4 10/18/2013 --- Very good VT06-08 East Branch Missisquoi R. 5.4 09/29/2014 Vgood-good VT06-08 East Branch Missisquoi R. 5.4 09/18/2014 --- Very good
VT06-08 East Branch Missisquoi Trib 8 0.2 10/11/2010 Exc-vgood --- VT06-08 East Branch Missisquoi Trib 8 0.2 10/12/2011 Vgood --- VT06-08 East Branch Missisquoi Trib 8 0.2 10/09/2012 Excellent --- VT06-08 East Branch Missisquoi Trib 8 0.2 09/26/2013 Vgood-good --- VT06-08 East Branch Missisquoi Trib 8 0.2 10/02/2014 Vgood-good ---
VT06-08 East Branch Missisquoi Trib 10 0.1 10/11/2010 Exc-vgood --- VT06-08 East Branch Missisquoi Trib 10 0.1 09/26/2011 Vgood-good --- VT06-08 East Branch Missisquoi Trib 10 0.1 09/27/2012 Fair --- VT06-08 East Branch Missisquoi Trib 10 0.1 09/27/2013 Very good --- VT06-08 East Branch Missisquoi Trib 10 0.1 09/29/2014 Vgood-good ---
VT06-08 Mineral Spring Brook 0.2 9/24/2004 Exc-Vgood ---
VT06-08 Missisquoi River 71.6 09/07/2004 Vgood-good --- VT06-08 Missisquoi River 71.6 09/08/2009 Very good --- VT06-08 Missisquoi River 71.6 09/26/2013 Excellent ---
VT06-08 Missisquoi River 72.6 09/08/2009 Very good --- VT06-08 Missisquoi River 72.6 09/25/2013 Excellent --- VT06-08 Missisquoi River 73.1 09/08/2009 Vgood-good ---
VT06-08 Mud Creek 4.0 09/07/2004 Good-fair --- VT06-08 Mud Creek 4.0 09/25/2013 Good-fair Good VT06-08 Mud Creek 6.6 09/07/2004 Fair --- VT06-08 Mud Creek 6.6 09/08/2009 Good Fair VT06-08 Mud Creek 6.6 09/25/2013 Good-fair --- VT06-08 Mud Creek 9.7 09/23/2009 Good-fair --- VT06-08 Mud Creek 9.8 09/25/2013 Good Good VT06-08 Mud Creek Trib 10 0.2 09/24/2004 Fair ---
VT06-08 Taft Brook 0.2 10/26/2004 Good --- VT06-08 Taft Brook 2.1 09/08/2009 Vgood-good --- VT06-08 Taft Brook 2.1 09/03/2009 --- Very good
VT06-08 Truland Brook 0.7 09/26/2011 Good-fair --- VT06-08 Truland Brook 0.7 10/28/2011 --- Poor
6
WBID Name Station Date Assessment-Macroinvertebrates
Assessment - Fish
VT06-08 Truland Brook 0.7 09/27/2012 Vgood-good --- VT06-08 Truland Brook 0.7 09/07/2012 --- Poor
VT06-08 Truland Brook 0.7 09/26/2013 Good-fair --- VT06-08 Truland Brook 0.7 10/30/2013 --- Poor
VT06-08 Truland Brook 0.7 09/29/2014 Exc-vgood ---- VT06-08 Truland Brook 0.7 09/09/2014 --- Poor VT06-08 Truland Brook 1.8 09/26/2013 Exc-vgood ---
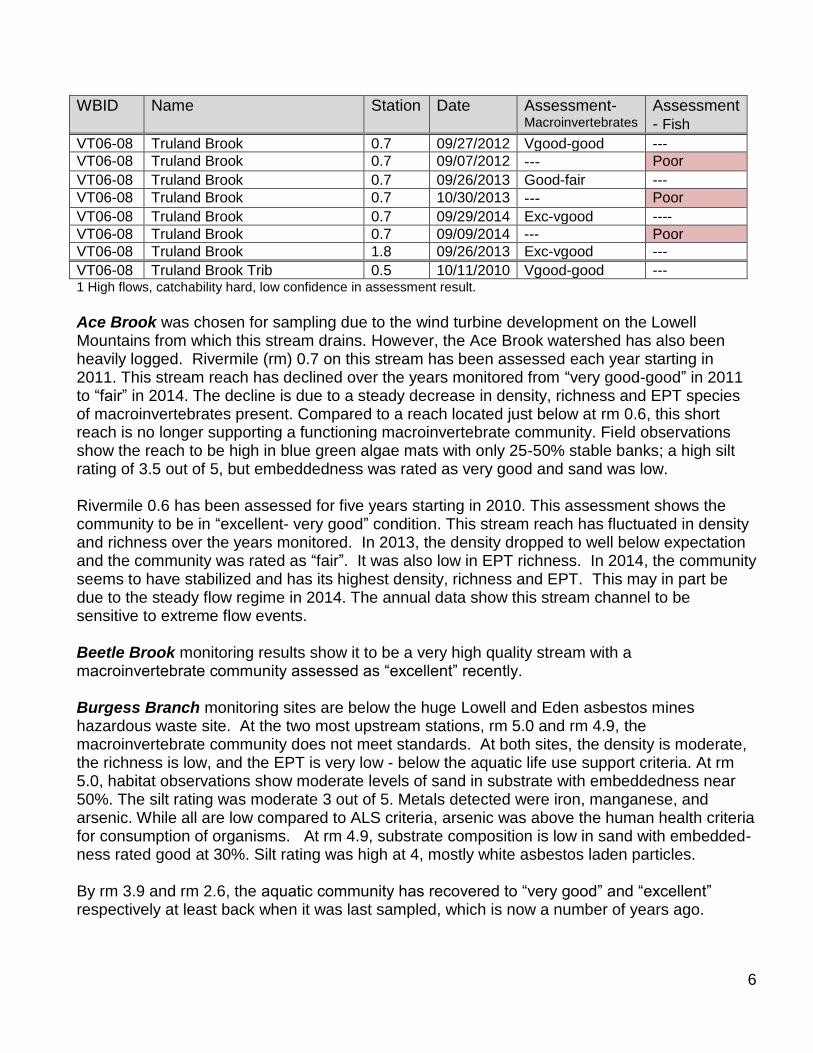
VT06-08 Truland Brook Trib 0.5 10/11/2010 Vgood-good --- 1 High flows, catchability hard, low confidence in assessment result.
Ace Brook was chosen for sampling due to the wind turbine development on the Lowell Mountains from which this stream drains. However, the Ace Brook watershed has also been heavily logged. Rivermile (rm) 0.7 on this stream has been assessed each year starting in 2011. This stream reach has declined over the years monitored from “very good-good” in 2011 to “fair” in 2014. The decline is due to a steady decrease in density, richness and EPT species of macroinvertebrates present. Compared to a reach located just below at rm 0.6, this short reach is no longer supporting a functioning macroinvertebrate community. Field observations show the reach to be high in blue green algae mats with only 25-50% stable banks; a high silt rating of 3.5 out of 5, but embeddedness was rated as very good and sand was low. Rivermile 0.6 has been assessed for five years starting in 2010. This assessment shows the community to be in “excellent- very good” condition. This stream reach has fluctuated in density and richness over the years monitored. In 2013, the density dropped to well below expectation and the community was rated as “fair”. It was also low in EPT richness. In 2014, the community seems to have stabilized and has its highest density, richness and EPT. This may in part be due to the steady flow regime in 2014. The annual data show this stream channel to be sensitive to extreme flow events. Beetle Brook monitoring results show it to be a very high quality stream with a macroinvertebrate community assessed as “excellent” recently. Burgess Branch monitoring sites are below the huge Lowell and Eden asbestos mines hazardous waste site. At the two most upstream stations, rm 5.0 and rm 4.9, the macroinvertebrate community does not meet standards. At both sites, the density is moderate, the richness is low, and the EPT is very low - below the aquatic life use support criteria. At rm 5.0, habitat observations show moderate levels of sand in substrate with embeddedness near 50%. The silt rating was moderate 3 out of 5. Metals detected were iron, manganese, and arsenic. While all are low compared to ALS criteria, arsenic was above the human health criteria for consumption of organisms. At rm 4.9, substrate composition is low in sand with embedded-ness rated good at 30%. Silt rating was high at 4, mostly white asbestos laden particles. By rm 3.9 and rm 2.6, the aquatic community has recovered to “very good” and “excellent” respectively at least back when it was last sampled, which is now a number of years ago.
7
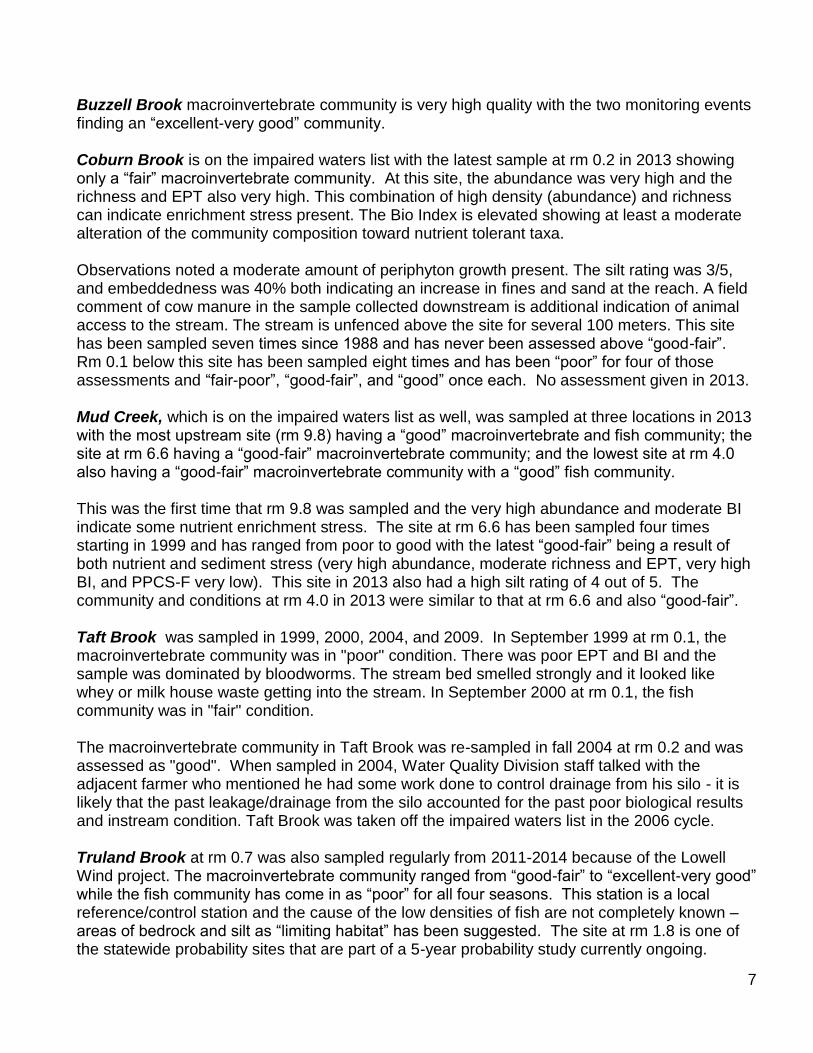
Buzzell Brook macroinvertebrate community is very high quality with the two monitoring events finding an “excellent-very good” community. Coburn Brook is on the impaired waters list with the latest sample at rm 0.2 in 2013 showing only a “fair” macroinvertebrate community. At this site, the abundance was very high and the richness and EPT also very high. This combination of high density (abundance) and richness can indicate enrichment stress present. The Bio Index is elevated showing at least a moderate alteration of the community composition toward nutrient tolerant taxa. Observations noted a moderate amount of periphyton growth present. The silt rating was 3/5, and embeddedness was 40% both indicating an increase in fines and sand at the reach. A field comment of cow manure in the sample collected downstream is additional indication of animal access to the stream. The stream is unfenced above the site for several 100 meters. This site has been sampled seven times since 1988 and has never been assessed above “good-fair”. Rm 0.1 below this site has been sampled eight times and has been “poor” for four of those assessments and “fair-poor”, “good-fair”, and “good” once each. No assessment given in 2013. Mud Creek, which is on the impaired waters list as well, was sampled at three locations in 2013 with the most upstream site (rm 9.8) having a “good” macroinvertebrate and fish community; the site at rm 6.6 having a “good-fair” macroinvertebrate community; and the lowest site at rm 4.0 also having a “good-fair” macroinvertebrate community with a “good” fish community. This was the first time that rm 9.8 was sampled and the very high abundance and moderate BI indicate some nutrient enrichment stress. The site at rm 6.6 has been sampled four times starting in 1999 and has ranged from poor to good with the latest “good-fair” being a result of both nutrient and sediment stress (very high abundance, moderate richness and EPT, very high BI, and PPCS-F very low). This site in 2013 also had a high silt rating of 4 out of 5. The community and conditions at rm 4.0 in 2013 were similar to that at rm 6.6 and also “good-fair”. Taft Brook was sampled in 1999, 2000, 2004, and 2009. In September 1999 at rm 0.1, the macroinvertebrate community was in "poor" condition. There was poor EPT and BI and the sample was dominated by bloodworms. The stream bed smelled strongly and it looked like whey or milk house waste getting into the stream. In September 2000 at rm 0.1, the fish community was in "fair" condition. The macroinvertebrate community in Taft Brook was re-sampled in fall 2004 at rm 0.2 and was assessed as "good". When sampled in 2004, Water Quality Division staff talked with the adjacent farmer who mentioned he had some work done to control drainage from his silo - it is likely that the past leakage/drainage from the silo accounted for the past poor biological results and instream condition. Taft Brook was taken off the impaired waters list in the 2006 cycle. Truland Brook at rm 0.7 was also sampled regularly from 2011-2014 because of the Lowell Wind project. The macroinvertebrate community ranged from “good-fair” to “excellent-very good” while the fish community has come in as “poor” for all four seasons. This station is a local reference/control station and the cause of the low densities of fish are not completely known – areas of bedrock and silt as “limiting habitat” has been suggested. The site at rm 1.8 is one of the statewide probability sites that are part of a 5-year probability study currently ongoing.
8
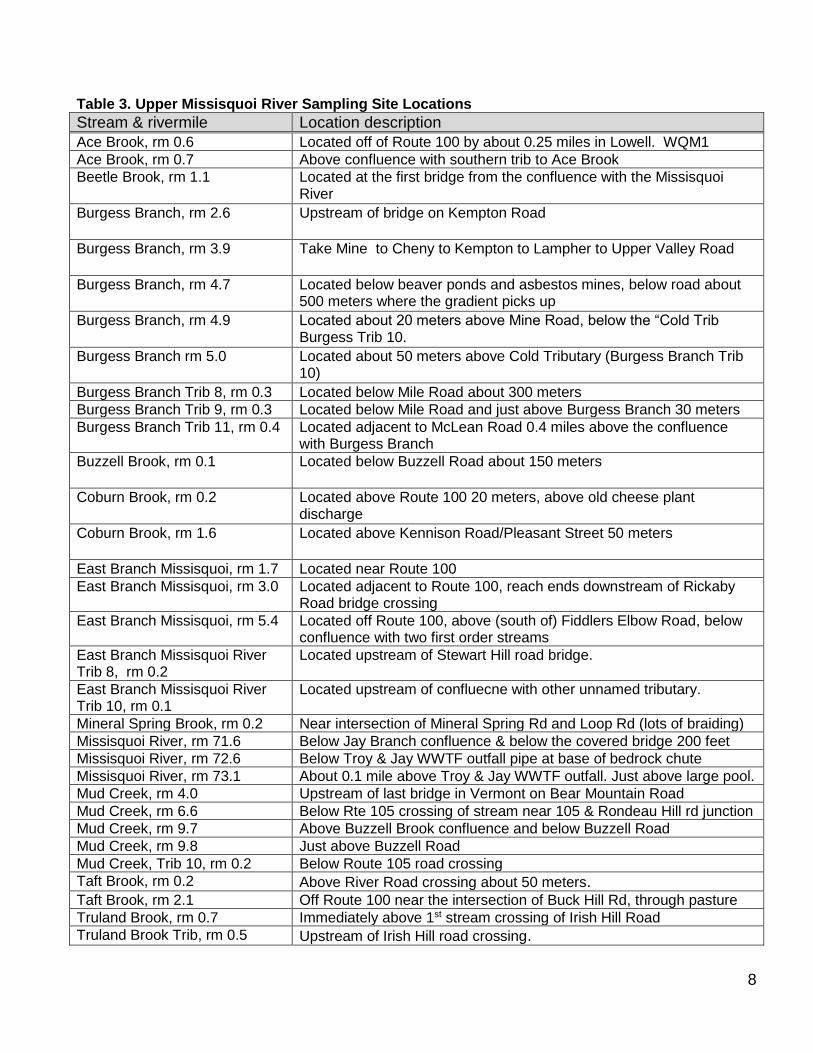
Table 3. Upper Missisquoi River Sampling Site Locations
Stream & rivermile Location description
Ace Brook, rm 0.6 Located off of Route 100 by about 0.25 miles in Lowell. WQM1 Ace Brook, rm 0.7 Above confluence with southern trib to Ace Brook Beetle Brook, rm 1.1
Located at the first bridge from the confluence with the Missisquoi River
Burgess Branch, rm 2.6
Upstream of bridge on Kempton Road
Burgess Branch, rm 3.9
Take Mine to Cheny to Kempton to Lampher to Upper Valley Road
Burgess Branch, rm 4.7
Located below beaver ponds and asbestos mines, below road about 500 meters where the gradient picks up
Burgess Branch, rm 4.9
Located about 20 meters above Mine Road, below the “Cold Trib Burgess Trib 10.
Burgess Branch rm 5.0
Located about 50 meters above Cold Tributary (Burgess Branch Trib 10)
Burgess Branch Trib 8, rm 0.3 Located below Mile Road about 300 meters Burgess Branch Trib 9, rm 0.3 Located below Mile Road and just above Burgess Branch 30 meters Burgess Branch Trib 11, rm 0.4 Located adjacent to McLean Road 0.4 miles above the confluence
with Burgess Branch Buzzell Brook, rm 0.1
Located below Buzzell Road about 150 meters
Coburn Brook, rm 0.2
Located above Route 100 20 meters, above old cheese plant discharge
Coburn Brook, rm 1.6
Located above Kennison Road/Pleasant Street 50 meters
East Branch Missisquoi, rm 1.7 Located near Route 100 East Branch Missisquoi, rm 3.0 Located adjacent to Route 100, reach ends downstream of Rickaby
Road bridge crossing East Branch Missisquoi, rm 5.4 Located off Route 100, above (south of) Fiddlers Elbow Road, below
confluence with two first order streams East Branch Missisquoi River Trib 8, rm 0.2
Located upstream of Stewart Hill road bridge.
East Branch Missisquoi River Trib 10, rm 0.1
Located upstream of confluecne with other unnamed tributary.
Mineral Spring Brook, rm 0.2 Near intersection of Mineral Spring Rd and Loop Rd (lots of braiding) Missisquoi River, rm 71.6 Below Jay Branch confluence & below the covered bridge 200 feet Missisquoi River, rm 72.6 Below Troy & Jay WWTF outfall pipe at base of bedrock chute Missisquoi River, rm 73.1 About 0.1 mile above Troy & Jay WWTF outfall. Just above large pool. Mud Creek, rm 4.0 Upstream of last bridge in Vermont on Bear Mountain Road Mud Creek, rm 6.6 Below Rte 105 crossing of stream near 105 & Rondeau Hill rd junction Mud Creek, rm 9.7 Above Buzzell Brook confluence and below Buzzell Road Mud Creek, rm 9.8 Just above Buzzell Road Mud Creek, Trib 10, rm 0.2 Below Route 105 road crossing Taft Brook, rm 0.2 Above River Road crossing about 50 meters. Taft Brook, rm 2.1 Off Route 100 near the intersection of Buck Hill Rd, through pasture Truland Brook, rm 0.7 Immediately above 1st stream crossing of Irish Hill Road Truland Brook Trib, rm 0.5 Upstream of Irish Hill road crossing.

9
Figure 1. Upper Missisquoi Assessment Information
10
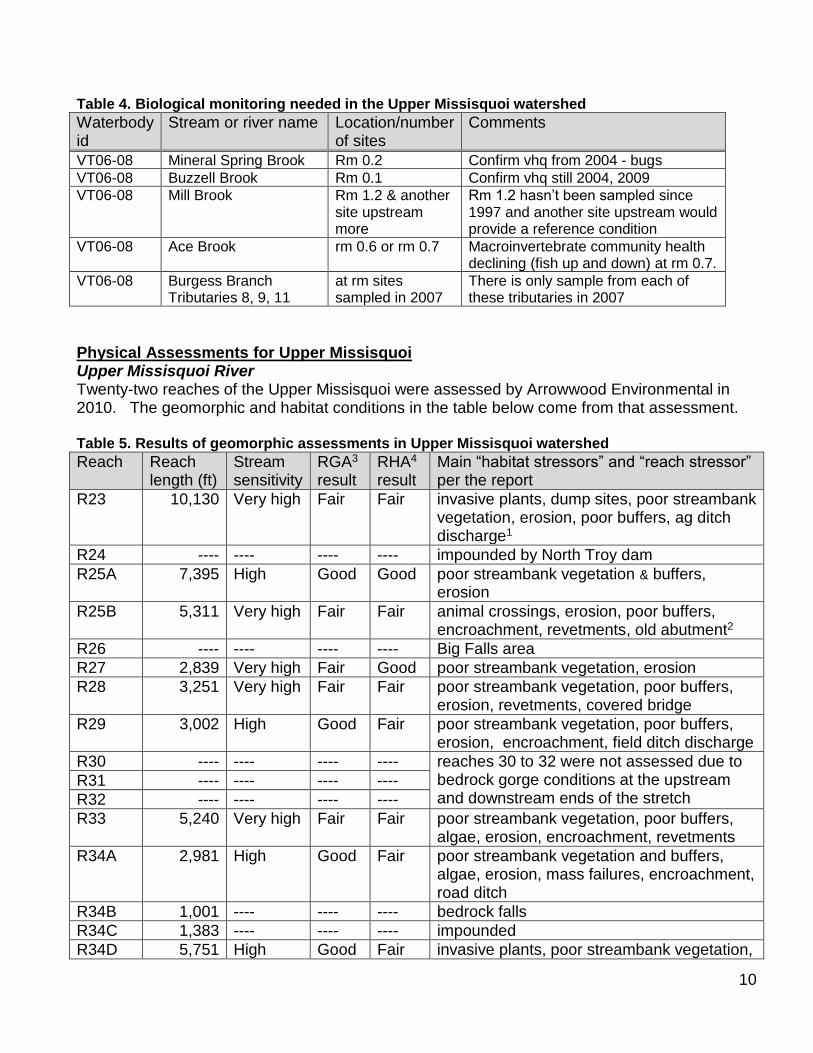
Table 4. Biological monitoring needed in the Upper Missisquoi watershed
Waterbody id
Stream or river name Location/number of sites
Comments
VT06-08 Mineral Spring Brook Rm 0.2 Confirm vhq from 2004 - bugs VT06-08 Buzzell Brook Rm 0.1 Confirm vhq still 2004, 2009 VT06-08 Mill Brook Rm 1.2 & another
site upstream more
Rm 1.2 hasn’t been sampled since 1997 and another site upstream would provide a reference condition
VT06-08 Ace Brook rm 0.6 or rm 0.7 Macroinvertebrate community health declining (fish up and down) at rm 0.7.
VT06-08 Burgess Branch Tributaries 8, 9, 11
at rm sites sampled in 2007
There is only sample from each of these tributaries in 2007
Physical Assessments for Upper Missisquoi Upper Missisquoi River Twenty-two reaches of the Upper Missisquoi were assessed by Arrowwood Environmental in 2010. The geomorphic and habitat conditions in the table below come from that assessment. Table 5. Results of geomorphic assessments in Upper Missisquoi watershed
Reach Reach length (ft)
Stream sensitivity
RGA3 result
RHA4 result
Main “habitat stressors” and “reach stressor” per the report
R23 10,130 Very high Fair Fair invasive plants, dump sites, poor streambank vegetation, erosion, poor buffers, ag ditch discharge1
R24 ---- ---- ---- ---- impounded by North Troy dam
R25A 7,395 High Good Good poor streambank vegetation & buffers, erosion
R25B 5,311 Very high Fair Fair animal crossings, erosion, poor buffers, encroachment, revetments, old abutment2
R26 ---- ---- ---- ---- Big Falls area
R27 2,839 Very high Fair Good poor streambank vegetation, erosion
R28 3,251 Very high Fair Fair poor streambank vegetation, poor buffers, erosion, revetments, covered bridge
R29 3,002 High Good Fair poor streambank vegetation, poor buffers, erosion, encroachment, field ditch discharge
R30 ---- ---- ---- ---- reaches 30 to 32 were not assessed due to bedrock gorge conditions at the upstream and downstream ends of the stretch
R31 ---- ---- ---- ----
R32 ---- ---- ---- ----
R33 5,240 Very high Fair Fair poor streambank vegetation, poor buffers, algae, erosion, encroachment, revetments
R34A 2,981 High Good Fair poor streambank vegetation and buffers, algae, erosion, mass failures, encroachment, road ditch
R34B 1,001 ---- ---- ---- bedrock falls
R34C 1,383 ---- ---- ---- impounded
R34D 5,751 High Good Fair invasive plants, poor streambank vegetation,

11
Reach Reach length (ft)
Stream sensitivity
RGA3 result
RHA4 result
Main “habitat stressors” and “reach stressor” per the report
poor buffers, erosion, encroachments
R35A 14,820 Very high Fair Fair dump sites, poor streambank vegetation, erosion, encroachments, revetments, field ditch
R35B 7,411 High Good Fair poor streambank vegetation, algae colonization, poor buffers, erosion, encroachments, revetments, field ditch, undersized farm bridge
R35B T3.01-A (Taft Brook)
1,688 Extreme Fair Fair dredging, poor streambank vegetation, algae colonization, poor buffers, erosion, straightening, revetments, undersized double culvert, farm ditches
R35B T3.01-B (Taft Brook)
10,484 Extreme Fair Fair invasive plants, animal crossings, poor streambank vegetation, algae colonization, poor buffers, erosion, revetments, double culvert crossing, field ditches
1 classified in reach summary as “stormwater inputs” but the specifics were in the reach description and used in this table; 2 classified in the reach summary as “constrictions” but specifics were in the reach description and used here; 3 RGA = rapid geomorphic assessment; 4 RHA = rapid habitat assessment
Hazardous Waste Sites Vermont Asbestos Group mine waste1
The Vermont Asbestos Group Mine site is an inactive asbestos mine and mill which operated beginning in the early 1900s and closed in 1993. The mine site comprises 1540 acres on private lands on Belvidere Mountain in the towns of Eden and Lowell. The asbestos ore was mined from open pits producing chrysotile “white” asbestos. The Vermont Asbestos Group or “VAG” was one of a number of mining and exploration businesses that once operated out of this property. VAG purchased the property from GAF corporation, which along with a predecessor corporation, operated the mine from 1936-1975. Currently the mine site consists of a network of mine and mill structures and two significant mill tailings piles estimated at 29-30 million tons. The ANR has been investigating this property due to significant erosion of the asbestos waste piles migrating offsite into nearby streams and wetlands. In 2005-2007, the ANR conducted biological and chemical assessments within the Lamoille River and Missisquoi River watersheds which revealed impairment to the aquatic biota and water quality. This impairment includes a wetland located one mile downstream. In 2007-2008, the US Environmental Protection Agency (EPA) installed diversion trenches, berms, and sedimentation basins to keep the contaminated runoff from the tailing piles from further reaching streams and wetlands. In 2013, EPA again provided needed assistance in removing or capping dry asbestos ore in a building beginning to fail. The towns of Lowell and Eden rejected the idea of the mine site going on the Superfund list and as a result millions of federal dollars of clean-up money will not be available for site remediation. 1 The first three paragrapsh are taken from Vermont DEC and U.S. EPA websites and slightly edited.
12
JJaayy BBrraanncchh SSuubbwwaatteerrsshheedd ooff UUppppeerr MMiissssiissqquuooii WWaatteerrsshheedd
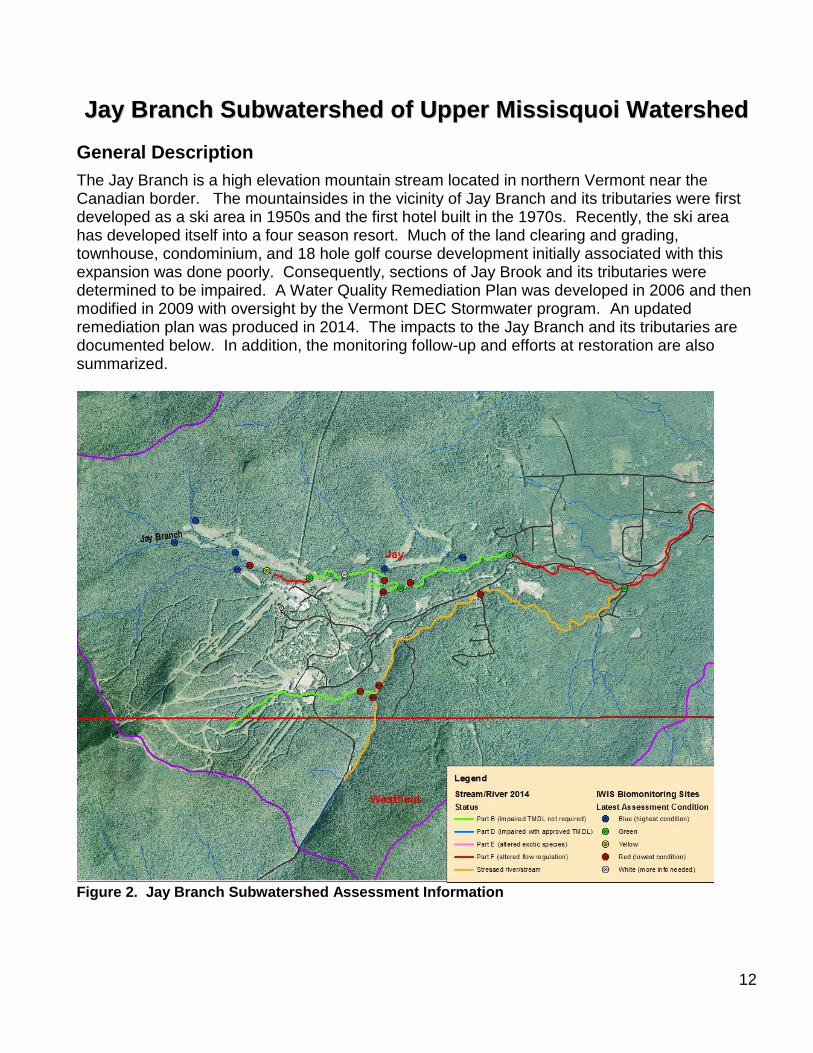
General Description
The Jay Branch is a high elevation mountain stream located in northern Vermont near the Canadian border. The mountainsides in the vicinity of Jay Branch and its tributaries were first developed as a ski area in 1950s and the first hotel built in the 1970s. Recently, the ski area has developed itself into a four season resort. Much of the land clearing and grading, townhouse, condominium, and 18 hole golf course development initially associated with this expansion was done poorly. Consequently, sections of Jay Brook and its tributaries were determined to be impaired. A Water Quality Remediation Plan was developed in 2006 and then modified in 2009 with oversight by the Vermont DEC Stormwater program. An updated remediation plan was produced in 2014. The impacts to the Jay Branch and its tributaries are documented below. In addition, the monitoring follow-up and efforts at restoration are also summarized.
Figure 2. Jay Branch Subwatershed Assessment Information
13
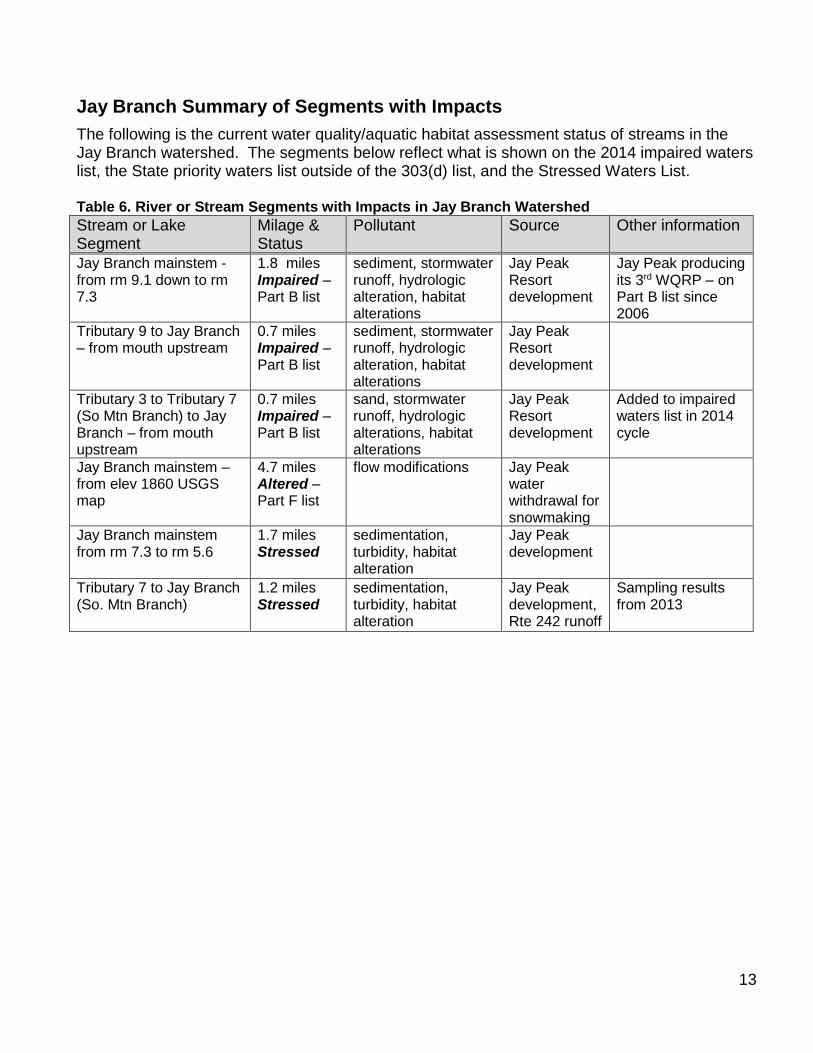
Jay Branch Summary of Segments with Impacts
The following is the current water quality/aquatic habitat assessment status of streams in the Jay Branch watershed. The segments below reflect what is shown on the 2014 impaired waters list, the State priority waters list outside of the 303(d) list, and the Stressed Waters List. Table 6. River or Stream Segments with Impacts in Jay Branch Watershed
Stream or Lake Segment
Milage & Status
Pollutant Source Other information
Jay Branch mainstem - from rm 9.1 down to rm 7.3
1.8 miles Impaired – Part B list
sediment, stormwater runoff, hydrologic alteration, habitat alterations
Jay Peak Resort development
Jay Peak producing its 3rd WQRP – on Part B list since 2006
Tributary 9 to Jay Branch – from mouth upstream
0.7 miles Impaired – Part B list
sediment, stormwater runoff, hydrologic alteration, habitat alterations
Jay Peak Resort development
Tributary 3 to Tributary 7 (So Mtn Branch) to Jay Branch – from mouth upstream
0.7 miles Impaired – Part B list
sand, stormwater runoff, hydrologic alterations, habitat alterations
Jay Peak Resort development
Added to impaired waters list in 2014 cycle
Jay Branch mainstem – from elev 1860 USGS map
4.7 miles Altered – Part F list
flow modifications Jay Peak water withdrawal for snowmaking
Jay Branch mainstem from rm 7.3 to rm 5.6
1.7 miles Stressed
sedimentation, turbidity, habitat alteration
Jay Peak development
Tributary 7 to Jay Branch (So. Mtn Branch)
1.2 miles Stressed
sedimentation, turbidity, habitat alteration
Jay Peak development, Rte 242 runoff
Sampling results from 2013
14
Assessment Information for the Jay Branch Subwatershed
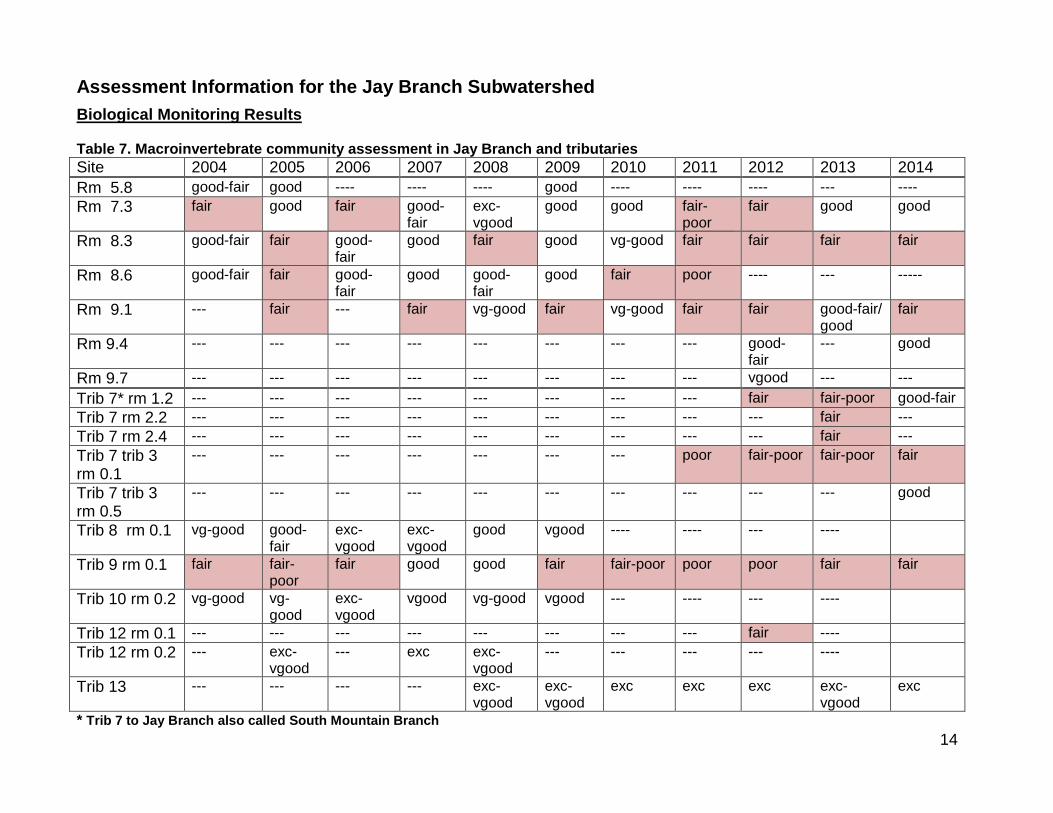
Biological Monitoring Results Table 7. Macroinvertebrate community assessment in Jay Branch and tributaries Site 2004 2005 2006 2007 2008 2009 2010 2011 2012 2013 2014
Rm 5.8 good-fair good ---- ---- ---- good ---- ---- ---- --- ----
Rm 7.3 fair good fair good-fair
exc-vgood
good good fair-poor
fair good good
Rm 8.3 good-fair fair good-fair
good fair good vg-good fair fair fair fair
Rm 8.6 good-fair fair good-fair
good good-fair
good fair poor ---- --- -----
Rm 9.1 --- fair --- fair vg-good fair vg-good fair fair good-fair/ good
fair
Rm 9.4 --- --- --- --- --- --- --- --- good-fair
--- good
Rm 9.7 --- --- --- --- --- --- --- --- vgood --- ---
Trib 7* rm 1.2 --- --- --- --- --- --- --- --- fair fair-poor good-fair
Trib 7 rm 2.2 --- --- --- --- --- --- --- --- --- fair ---
Trib 7 rm 2.4 --- --- --- --- --- --- --- --- --- fair ---
Trib 7 trib 3 rm 0.1
--- --- --- --- --- --- --- poor fair-poor fair-poor fair
Trib 7 trib 3 rm 0.5
--- --- --- --- --- --- --- --- --- --- good
Trib 8 rm 0.1 vg-good good-fair
exc-vgood
exc-vgood
good vgood ---- ---- --- ----
Trib 9 rm 0.1 fair fair-poor
fair good good fair fair-poor poor poor fair fair
Trib 10 rm 0.2 vg-good vg-good
exc-vgood
vgood vg-good vgood --- ---- --- ----
Trib 12 rm 0.1 --- --- --- --- --- --- --- --- fair ----
Trib 12 rm 0.2 --- exc-vgood
--- exc exc-vgood
--- --- --- --- ----
Trib 13 --- --- --- --- exc-vgood
exc- vgood
exc exc exc exc-vgood
exc
* Trib 7 to Jay Branch also called South Mountain Branch
15
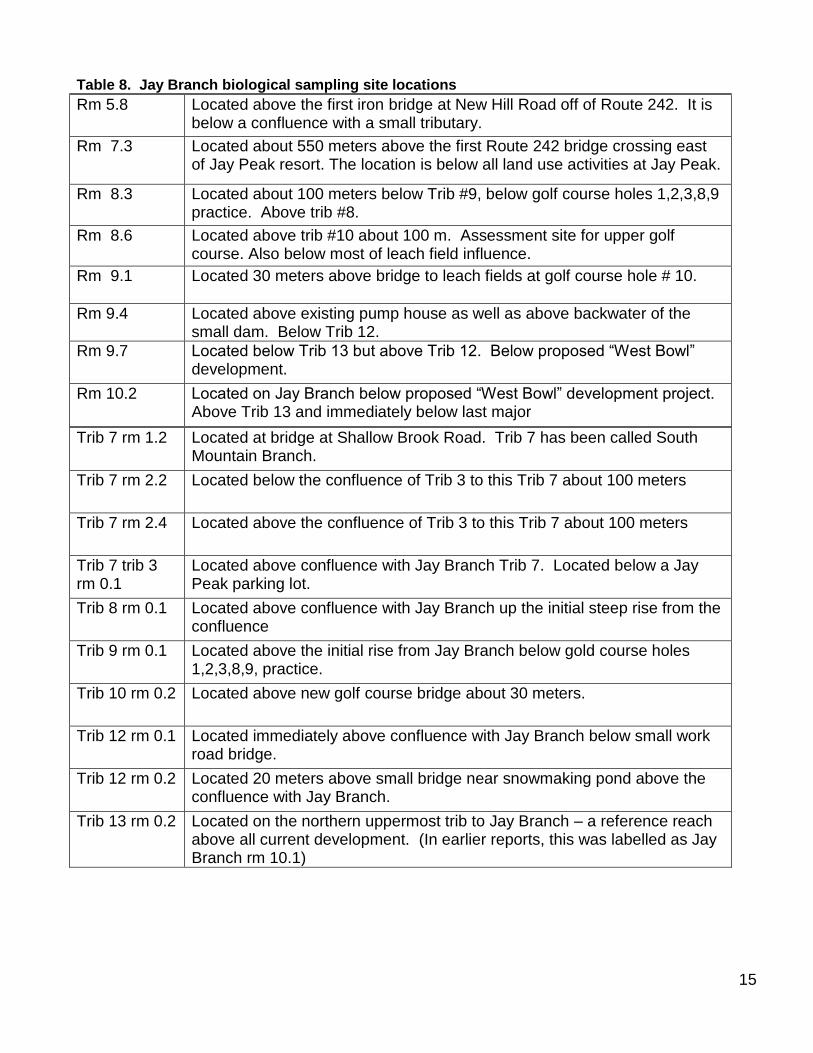
Table 8. Jay Branch biological sampling site locations
Rm 5.8 Located above the first iron bridge at New Hill Road off of Route 242. It is below a confluence with a small tributary.
Rm 7.3 Located about 550 meters above the first Route 242 bridge crossing east of Jay Peak resort. The location is below all land use activities at Jay Peak.
Rm 8.3 Located about 100 meters below Trib #9, below golf course holes 1,2,3,8,9 practice. Above trib #8.
Rm 8.6 Located above trib #10 about 100 m. Assessment site for upper golf course. Also below most of leach field influence.
Rm 9.1 Located 30 meters above bridge to leach fields at golf course hole # 10.
Rm 9.4 Located above existing pump house as well as above backwater of the small dam. Below Trib 12.
Rm 9.7 Located below Trib 13 but above Trib 12. Below proposed “West Bowl” development.
Rm 10.2 Located on Jay Branch below proposed “West Bowl” development project. Above Trib 13 and immediately below last major
Trib 7 rm 1.2 Located at bridge at Shallow Brook Road. Trib 7 has been called South Mountain Branch.
Trib 7 rm 2.2 Located below the confluence of Trib 3 to this Trib 7 about 100 meters
Trib 7 rm 2.4 Located above the confluence of Trib 3 to this Trib 7 about 100 meters
Trib 7 trib 3 rm 0.1
Located above confluence with Jay Branch Trib 7. Located below a Jay Peak parking lot.
Trib 8 rm 0.1 Located above confluence with Jay Branch up the initial steep rise from the confluence
Trib 9 rm 0.1 Located above the initial rise from Jay Branch below gold course holes 1,2,3,8,9, practice.
Trib 10 rm 0.2 Located above new golf course bridge about 30 meters.
Trib 12 rm 0.1 Located immediately above confluence with Jay Branch below small work road bridge.
Trib 12 rm 0.2 Located 20 meters above small bridge near snowmaking pond above the confluence with Jay Branch.
Trib 13 rm 0.2 Located on the northern uppermost trib to Jay Branch – a reference reach above all current development. (In earlier reports, this was labelled as Jay Branch rm 10.1)
16
Jay Branch A portion of Jay Branch and Tributary 9 to Jay Branch were first assessed as impaired in 2006. The impaired reach of Jay Branch has in the past extended from rm 9.1 to rm 8.3, but was extended to include the reach from rm 9.1 down to rm 7.3 during the 2014 303(d)/305(b) listing cycle. This extension was the result of a “fair-poor” and “fair” macroinvertebrate community assessment at rm 7.3 in 2011 and 2012 respectively. The macroinvertebrate community had seemed to be improving in the years following the original listing but then in 2011, the four sites of RM 9.1, RM 8.6, RM 8.3, RM 7.3 all dramatically declined in health while the site at RM 10.1 (a reference site) was in “excellent” condition. The four sites starting with RM 9.1 and going downstream were: “fair”, “poor”, “fair”, “fair-poor”. In 2012, there was not any real improvement. In 2013, the community health improved to “good” at rm 7.3 and “good-fair/good” at rm 9.1. In 2014, rm 7.3 remained “good” while rm 9.1 backslid again to “fair”. Tributary 9 to Jay Branch Tributary 9 to Jay Branch was impaired from 2004 through 2006; improved in 2007 and 2008 but then declined substantially in 2009 and 2010 due likely to instream work during these years. No improvement was shown in 2011 and in 2012, the percent Oligochaeta decreased but density, richness, and EPT all remained poor. In 2013 and 2014, the stream was still impaired with a “fair” macroinvertebrate community assessment. This stream, as a perennial stream, is supposed to have 50 foot buffers unless there is a specific streamside management zone plan specifying that it can have less than this and specifying what the vegetation will be. Tributary 9 has been subject to continuing encroachments on the buffer. Tributary 7 or South Mountain Branch Tributary 7, also known as South Mountain Branch, was sampled in 2012 at rm 1.2 and the macroinvertebrate community was “fair” or not supporting the aquatic life use of this stream. In 2013, the assessment was “fair-poor”, however, in 2014, it was improved to “good-fair”. Back in 1993, the macroinvertebrate community in Tributary 7 at rm 1.2 was assessed as “good”. South Mountain Branch was sampled farther upstream in 2013 to try to gauge the extent of the impacts and also to bracket the influence of Tributary 3 to Tributary 7. The macroinvertebrate community at the rm 2.2 site, located about 100 meters downstream of where Tributary 3 enters, was assessed as “fair-poor”. The macroinvertebrate community at rm 2.4, upstream of the confluence of Tributary 3, was assessed as “fair”. South Mountain Branch at RM 2.4 above Tributary 3 had low sediment indicators, with embeddedness at 10%, silt rating of 1, and percent fines 1. Sediment indicators increased again at RM 2.2 immediately below Tributary 3 with embeddedness increasing to 55%, silt rating of 3, and percent fines 16. Tributary 3 to Tributary 7 In addition, Tributary 3 to Tributary 7, which runs from an area where ski trails have been built down along a large parking lot to South Mountain Branch, was sampled at rm 0.1 in 2011, 2012, 2013, and 2014 and the macroinvertebrate community was “poor”, “fair-poor”, “fair-poor”, and “fair” respectively. This tributary was added to the impaired waters list during the 2014 303(d) cycle.
17
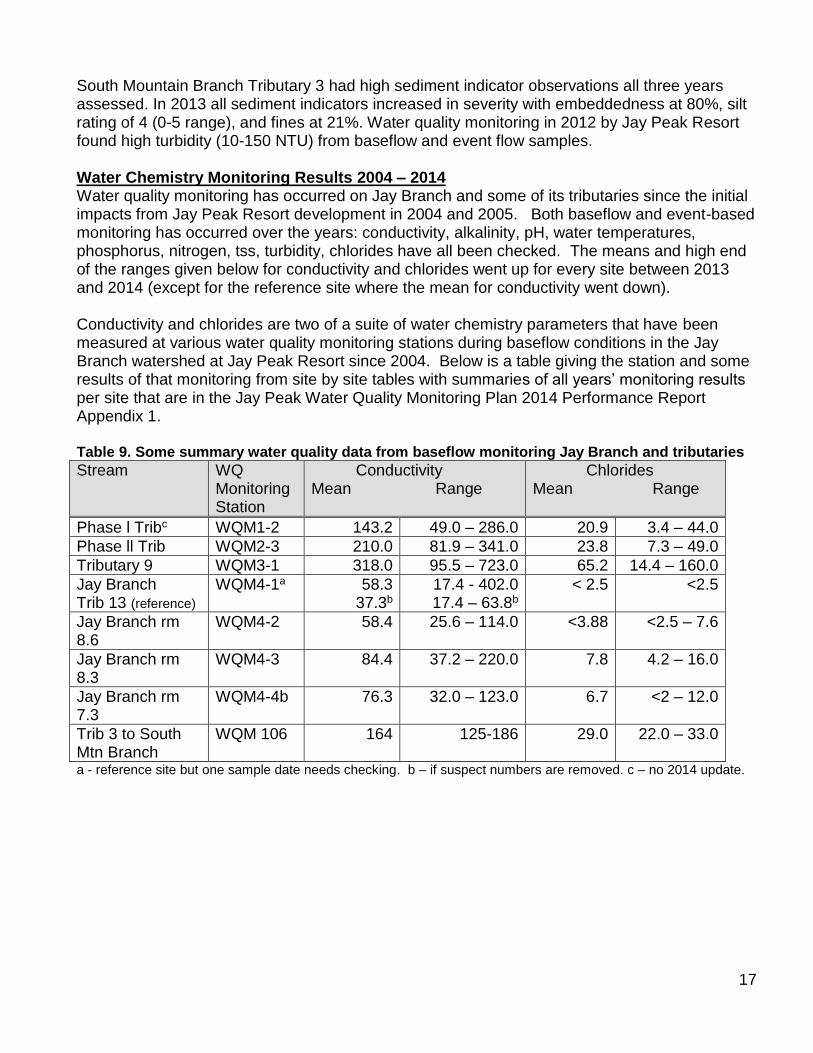
South Mountain Branch Tributary 3 had high sediment indicator observations all three years assessed. In 2013 all sediment indicators increased in severity with embeddedness at 80%, silt rating of 4 (0-5 range), and fines at 21%. Water quality monitoring in 2012 by Jay Peak Resort found high turbidity (10-150 NTU) from baseflow and event flow samples. Water Chemistry Monitoring Results 2004 – 2014 Water quality monitoring has occurred on Jay Branch and some of its tributaries since the initial impacts from Jay Peak Resort development in 2004 and 2005. Both baseflow and event-based monitoring has occurred over the years: conductivity, alkalinity, pH, water temperatures, phosphorus, nitrogen, tss, turbidity, chlorides have all been checked. The means and high end of the ranges given below for conductivity and chlorides went up for every site between 2013 and 2014 (except for the reference site where the mean for conductivity went down). Conductivity and chlorides are two of a suite of water chemistry parameters that have been measured at various water quality monitoring stations during baseflow conditions in the Jay Branch watershed at Jay Peak Resort since 2004. Below is a table giving the station and some results of that monitoring from site by site tables with summaries of all years’ monitoring results per site that are in the Jay Peak Water Quality Monitoring Plan 2014 Performance Report Appendix 1. Table 9. Some summary water quality data from baseflow monitoring Jay Branch and tributaries
Stream WQ Monitoring Station
Conductivity Mean Range
Chlorides Mean Range
Phase l Tribc WQM1-2 143.2 49.0 – 286.0 20.9 3.4 – 44.0
Phase ll Trib WQM2-3 210.0 81.9 – 341.0 23.8 7.3 – 49.0
Tributary 9 WQM3-1 318.0 95.5 – 723.0 65.2 14.4 – 160.0
Jay Branch Trib 13 (reference)
WQM4-1a 58.3 37.3b
17.4 - 402.0 17.4 – 63.8b
< 2.5 <2.5
Jay Branch rm 8.6
WQM4-2 58.4 25.6 – 114.0 <3.88 <2.5 – 7.6
Jay Branch rm 8.3
WQM4-3 84.4 37.2 – 220.0 7.8 4.2 – 16.0
Jay Branch rm 7.3
WQM4-4b 76.3 32.0 – 123.0 6.7 <2 – 12.0
Trib 3 to South Mtn Branch
WQM 106 164 125-186 29.0 22.0 – 33.0
a - reference site but one sample date needs checking. b – if suspect numbers are removed. c – no 2014 update.
18
MMiidd aanndd LLoowweerr MMiissssiissqquuooii RRiivveerr
General Watershed Description
The following section has data and information for the Missisquoi River mainstem from its mouth at Lake Champlain up to the Canadian border. The lower Missisquoi River is the mainstem from its mouth up to the confluence of Tyler Branch. The river flows through Sheldon, Highgate, and Swanton for just over 33 miles. The lowest portion of the river flows through the fascinating and diverse Missisquoi River Delta, much of which is part of the 6300 acre Missisquoi National Wildlife Refuge. The named tributaries to the this stretch include Kelly, Hungerford, Morrow, and McGowan Brooks. This section of river and its tributaries are waterbodies 06-01 and 06-03. The U.S. Geological Survey has operated a gage station on the Missisquoi River at Swanton since March 1990. The monthly mean flows from 1990 to 2014 in cubic feet per second ranged from a low July mean of 148 cfs in 1991 to a high April mean of 8,916 cfs in 2011. The average of the monthly discharges ranged from 729 cfs in September to 4,890 cfs in April for the 1990 to 2014 time period. Peak flows at this station have been 37,700 (January 20,1996), 32,200 (January 9,1998), and 31,000 cfs (June 12, 2002). This reach of river includes the Highgate Falls and Sheldon Falls hydroelectric facilities. The Sheldon Springs facility includes a dam (eliminating the falls), an intake structure, a penstock, a powerhouse, and tailrace. The facility bypasses about 4700 feet of river. The 1984 Water Quality Certification permits the facility to operate as a peaking project with minimum conservation flows in the bypass which are less than current standards to protect aquatic habitat. Whitewater boating releases occur in the bypass reach when requested. Project operations are known to have impacts on the aquatic habitat and fisheries down-stream of the powerhouse. The state-threatened great St. John’s wort grows high on the gorge walls below the dam. The Highgate Falls facility operates in a peaking mode with a maximum drawdown of 2 ½ feet and a minimum bypass conservation flow of 35 cfs (only 10% of 7Q10 or 7 day low flow at this site). Below the dam, there are falls and cascades about 15 feet high and then below the falls, there is a gorge about 1/3 mile long with 20 to 30 foot high walls. The minimum bypass flows are through this gorge. Peaking operations from the Highgate facility are known to impact aquatic habitat and fisheries downstream and below the lower Swanton dam. The Mid Missisquoi River is the reach of the river from the U.S.-Canada border downtream to Tyler Branch. As the Missisquoi flows back into the U.S. from Quebec, it flows south-westerly through East Richford where Lucas Brook joins it. About 1½ miles downstream, Stanhope Brook flows into the Missisquoi from the south. The river then continues generally westerly to Richford village where the North Branch comes in. From Richford, it flows in a southerly direction. Upstream of East Berkshire, the Trout River joins the Missisquoi. The Missisquoi River then flows more westerly than southerly for almost seven miles before it passes through Enosburg Falls and over the dam in the village. A few miles below the village, the Tyler Branch comes in and marks the end of this reach.
19
Mid Missisquoi River and Tributaries Segments with Impacts
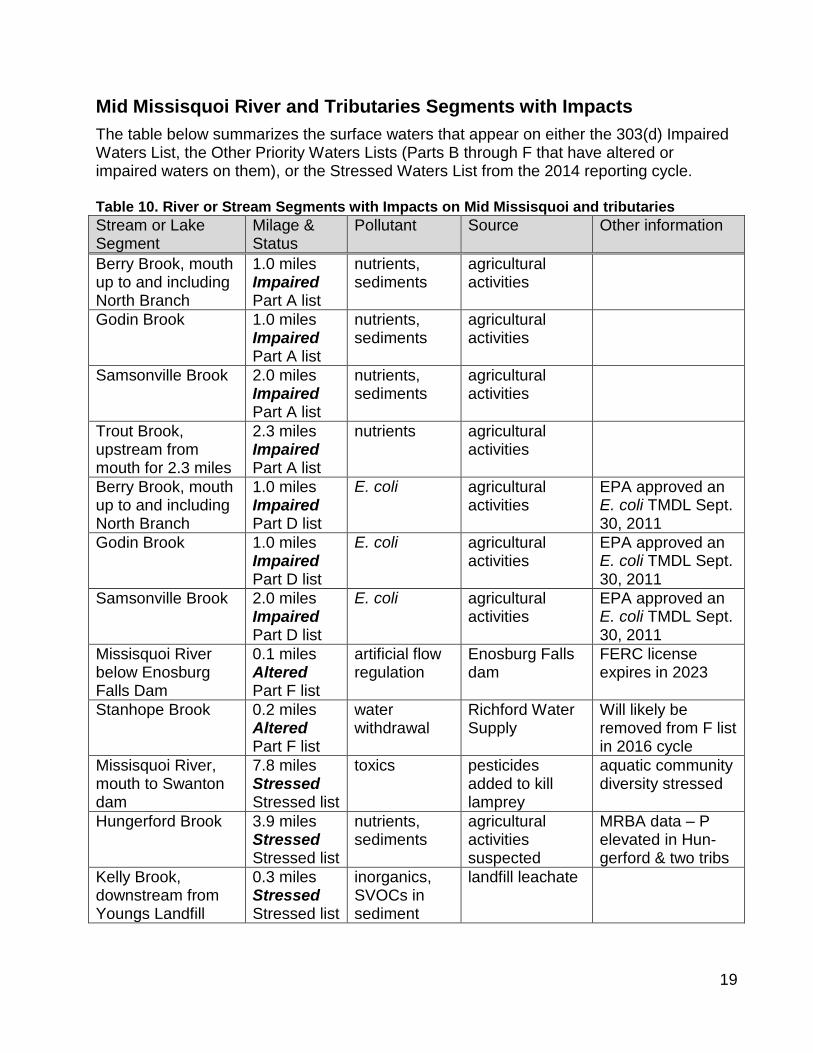
The table below summarizes the surface waters that appear on either the 303(d) Impaired Waters List, the Other Priority Waters Lists (Parts B through F that have altered or impaired waters on them), or the Stressed Waters List from the 2014 reporting cycle. Table 10. River or Stream Segments with Impacts on Mid Missisquoi and tributaries
Stream or Lake Segment
Milage & Status
Pollutant Source Other information
Berry Brook, mouth up to and including North Branch
1.0 miles Impaired Part A list
nutrients, sediments
agricultural activities
Godin Brook
1.0 miles Impaired Part A list
nutrients, sediments
agricultural activities
Samsonville Brook
2.0 miles Impaired Part A list
nutrients, sediments
agricultural activities
Trout Brook, upstream from mouth for 2.3 miles
2.3 miles Impaired Part A list
nutrients agricultural activities
Berry Brook, mouth up to and including North Branch
1.0 miles Impaired Part D list
E. coli agricultural activities
EPA approved an E. coli TMDL Sept. 30, 2011
Godin Brook
1.0 miles Impaired Part D list
E. coli agricultural activities
EPA approved an E. coli TMDL Sept. 30, 2011
Samsonville Brook
2.0 miles Impaired Part D list
E. coli agricultural activities
EPA approved an E. coli TMDL Sept. 30, 2011
Missisquoi River below Enosburg Falls Dam
0.1 miles Altered Part F list
artificial flow regulation
Enosburg Falls dam
FERC license expires in 2023
Stanhope Brook 0.2 miles Altered Part F list
water withdrawal
Richford Water Supply
Will likely be removed from F list in 2016 cycle
Missisquoi River, mouth to Swanton dam
7.8 miles Stressed Stressed list
toxics pesticides added to kill lamprey
aquatic community diversity stressed
Hungerford Brook 3.9 miles Stressed Stressed list
nutrients, sediments
agricultural activities suspected
MRBA data – P elevated in Hun-gerford & two tribs
Kelly Brook, downstream from Youngs Landfill
0.3 miles Stressed Stressed list
inorganics, SVOCs in sediment
landfill leachate
20
Assessment Information for the Mid and Lower Missisquoi River
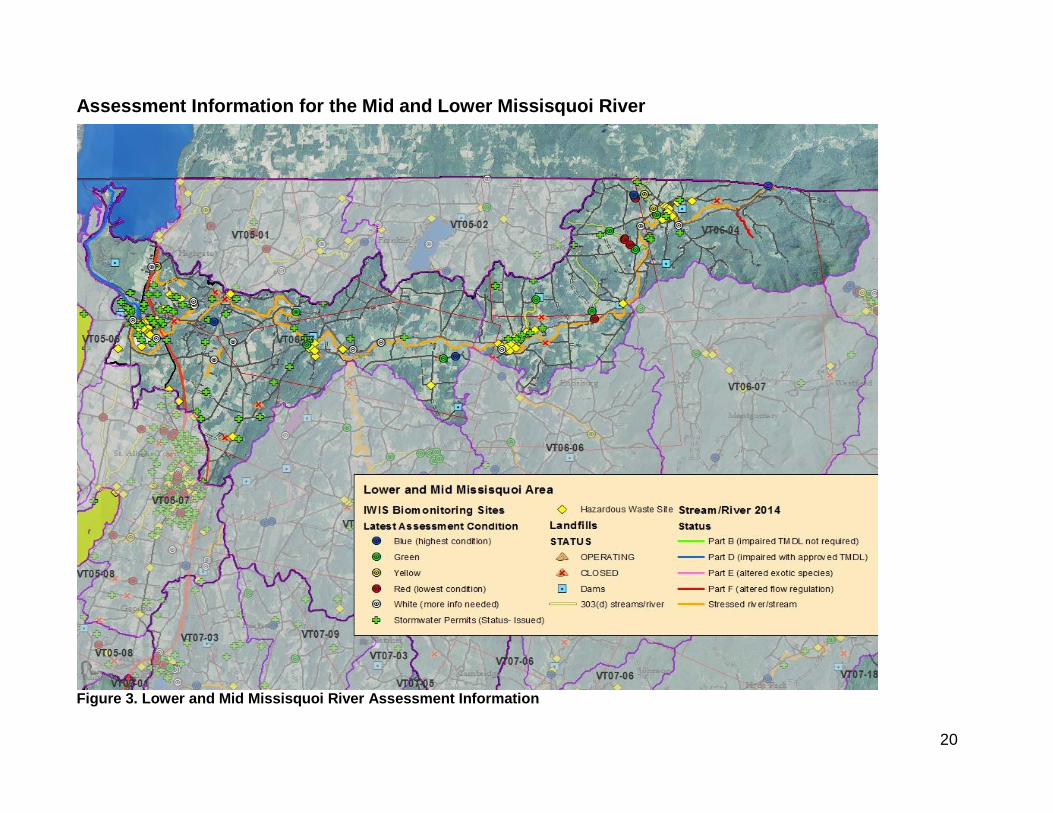
Figure 3. Lower and Mid Missisquoi River Assessment Information
21
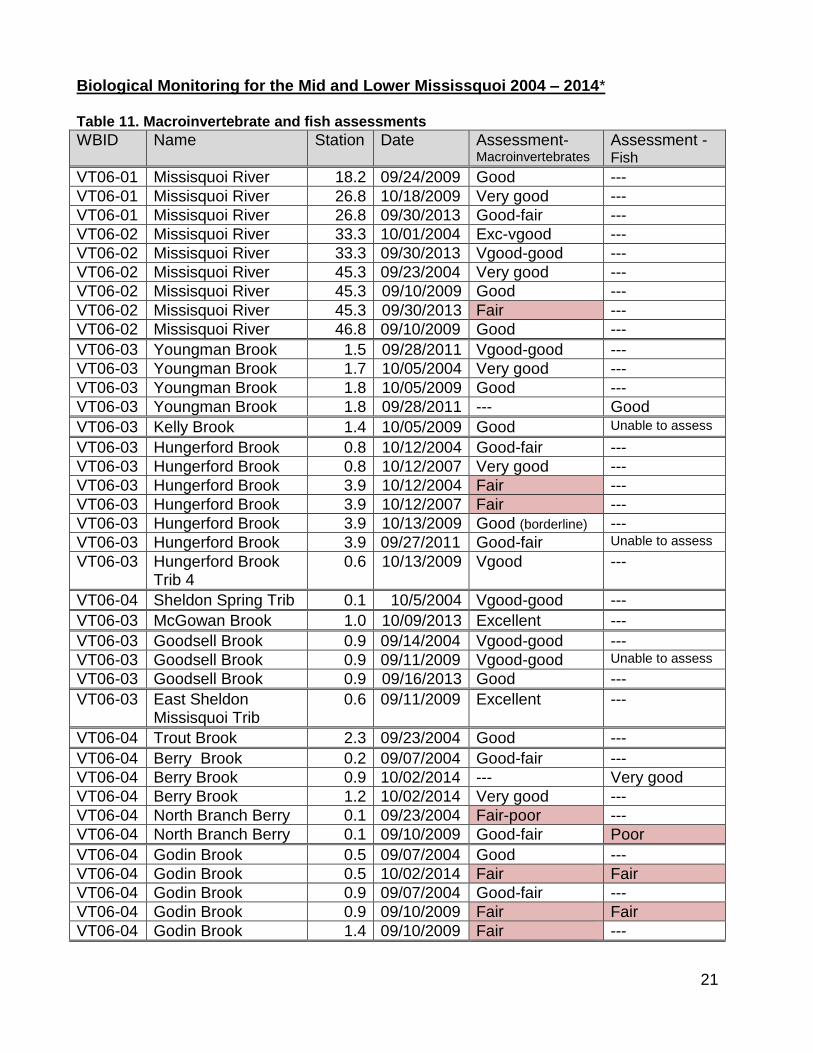
Biological Monitoring for the Mid and Lower Mississquoi 2004 – 2014* Table 11. Macroinvertebrate and fish assessments
WBID Name Station Date Assessment-Macroinvertebrates
Assessment - Fish
VT06-01 Missisquoi River 18.2 09/24/2009 Good ---
VT06-01 Missisquoi River 26.8 10/18/2009 Very good ---
VT06-01 Missisquoi River 26.8 09/30/2013 Good-fair ---
VT06-02 Missisquoi River 33.3 10/01/2004 Exc-vgood ---
VT06-02 Missisquoi River 33.3 09/30/2013 Vgood-good ---
VT06-02 Missisquoi River 45.3 09/23/2004 Very good ---
VT06-02 Missisquoi River 45.3 09/10/2009 Good ---
VT06-02 Missisquoi River 45.3 09/30/2013 Fair ---
VT06-02 Missisquoi River 46.8 09/10/2009 Good ---
VT06-03 Youngman Brook 1.5 09/28/2011 Vgood-good ---
VT06-03 Youngman Brook 1.7 10/05/2004 Very good ---
VT06-03 Youngman Brook 1.8 10/05/2009 Good ---
VT06-03 Youngman Brook 1.8 09/28/2011 --- Good
VT06-03 Kelly Brook 1.4 10/05/2009 Good Unable to assess
VT06-03 Hungerford Brook 0.8 10/12/2004 Good-fair ---
VT06-03 Hungerford Brook 0.8 10/12/2007 Very good ---
VT06-03 Hungerford Brook 3.9 10/12/2004 Fair ---
VT06-03 Hungerford Brook 3.9 10/12/2007 Fair ---
VT06-03 Hungerford Brook 3.9 10/13/2009 Good (borderline) ---
VT06-03 Hungerford Brook 3.9 09/27/2011 Good-fair Unable to assess
VT06-03 Hungerford Brook Trib 4
0.6 10/13/2009 Vgood ---
VT06-04 Sheldon Spring Trib 0.1 10/5/2004 Vgood-good ---
VT06-03 McGowan Brook 1.0 10/09/2013 Excellent ---
VT06-03 Goodsell Brook 0.9 09/14/2004 Vgood-good ---
VT06-03 Goodsell Brook 0.9 09/11/2009 Vgood-good Unable to assess
VT06-03 Goodsell Brook 0.9 09/16/2013 Good ---
VT06-03 East Sheldon Missisquoi Trib
0.6 09/11/2009 Excellent ---
VT06-04 Trout Brook 2.3 09/23/2004 Good ---
VT06-04 Berry Brook 0.2 09/07/2004 Good-fair ---
VT06-04 Berry Brook 0.9 10/02/2014 --- Very good
VT06-04 Berry Brook 1.2 10/02/2014 Very good ---
VT06-04 North Branch Berry 0.1 09/23/2004 Fair-poor ---
VT06-04 North Branch Berry 0.1 09/10/2009 Good-fair Poor
VT06-04 Godin Brook 0.5 09/07/2004 Good ---
VT06-04 Godin Brook 0.5 10/02/2014 Fair Fair
VT06-04 Godin Brook 0.9 09/07/2004 Good-fair ---
VT06-04 Godin Brook 0.9 09/10/2009 Fair Fair
VT06-04 Godin Brook 1.4 09/10/2009 Fair ---
22
VT06-04 Samsonville Brook 0.2 8/16/2005 Poor ---
VT06-04 Samsonville Brook 0.2 9/10/2009 Fair Unable to assess
* A summary of the macroinvertebrate community assessment results from 1993 through 2001 can
be found in the first Missisquoi River Watershed Assessment Report, November 2004.
Missisquoi River The Missisquoi River biological community assessment has gone from “excellent” in 1999 down to “very good” in 2004 to “good” in 2009 and to “fair” in 2013. The notes from the 2013 community analysis summarized that “the macroinvertebrate fingerprint of lower density, richness and EPT present, and low BI/high EPT/EPTc, along with an altered PPCS-f due to filter feeders, point to a high flow event with scour issues, and non-point [source] particulates. Most other water quality parameters seem to be very similar to previous sampling, including slightly elevated Fe, and Al, and somewhat low DO.” Youngman Brook The two sampling sites on Youngman that are downstream of the road have a healthier macroinvertebrate community than rm 1.8 upstream of the road. The upstream site was assessed as “good” in 2009 based on the draft low gradient IBI. Nutrient enrichment was not seen as the issue and conductivity and chloride were both low during the 2009 sampling. This site is close to a gun range. Hungerford Brook Hungerford Brook, especially at the site rm 3.9, has had a macroinvertebrate community that has been below or near the threshold of meeting standards since 1999. The community was “fair” from 1999 to 2007 and improved to a borderline “good” in 2009 but declined to “good-fair” in 2011. Total phosphorus, conductivity, chlorides have all been high. The land use of the watershed is largely agricultural and there is a clear need for riparian buffer strips. Goodsell Brook The macroinvertebrate assessment for this brook has gone from “very good-good” to “good” from 2004 to 2011. The Oligochaetes percentage was low in 2004, elevated in 2009, and above the threshold for aquatic life use support in 2011. Berry Brook Berry Brook has been sampled since the early 1990s when it was part of a agricultural nonpoint source study. At the rm 1.2 site, the macroinvertebrate community has been “very good to excellent” and it was “very good” in 2014. The lower site at rm 0.2 was “fair” and “good” in the 1990s and “good-fair” in 2004 when it was last sampled. Berry Brook at rm 1.2 has a forested corridor above it while intensive agricultural land use is downstream. Godin Brook & Samsonville Brook Both of these brooks have macroinvertebrate communities that do not meet the aquatic life support use standard and they appear on the Part A impaired waters list for nutrients and sediment and the Part D impaired waters with a TMDL list for E. coli. The watersheds of these brooks are dominated by agriculture and the streams lack adequate buffer strips in sections.
23
Table 12. Lower and Mid Missisquoi River Sampling Site Locations
Stream & rivermile Location description
Missisquoi River 18.2 Upstream of bridge on Machia Road, Highgate
Missisquoi River 26.8 Behind the Abbey Restaurant, Sheldon
Missisquoi River 33.3 About 200 meters below Enosburg WWTF, adjacent to Route 105, Enosburg
Missisquoi River 45.3 Off Marvin Road below a stone house, above confluence with Godin Brook, Berkshire
Missisquoi River 46.8 Above Richford WWTF on main branch (above where an overflow channel comes int), Richford
Youngman Brook 1.5 Located below Route 7 and I-89, Highgate
Youngman Brook 1.7 Below culvert crossing on Frontage Road, Highgate
Youngman Brook 1.8 Immediately upstream from Frontage Road crossing by the firing range, Highgate
Kelly Brook 1.4 Below Route 78 culvert, Highgate
Hungerford Brook 0.8 In ravine below Route 207, below falls about 200 meters in riffle area, Highgate
Hungerford Brook 3.9 immediately below bridge on Woodhill Road by memorial, Swanton
Hungerford Trib 4 0.8 Along Cook Road/Bushy Road, above bridge about 50 m.
Sheldon Spring Trib 0.1 Immediately above Mill Road, adjacent to and above WWTF building, Sheldon
McGowan Brook 1.0 Upstream of culvert/road crossing on Sheldon Heights Road, Sheldon
Goodsell Brook 0.9 Above East Sheldon Road 25 meters, Sheldon
East Sheldon Missisquoi Trib 0.6
Along Sheldon Road, next stream up (east) from Goodsell Brook, Sheldon
Trout Brook 2.3 Below Enosburg Vocational School area, Berkshire
Berry Brook 0.2 About 30 meters above Davis Road, Richford
Berry Brook 0.9 About 50 meters below confluence with North Branch Berry Brook, Berkshire
Berry Brook 1.2 At the northwest end of field near Berk. ??? On Richford line. Berkshire
North Branch Berry Brook 0.1
About 25 meters upstream from the confluence with the main branch, 100 meters up from the bridge, Richford.
Godin Brook 0.5 Immediately upstream from 1st bridge from mouth, Berkshire.
Godin Brook 0.9 Below first large farm on brook about 200 meters, as brook moves away from road, Berkshire.
Godin Brook 1.4 On Godin Farm of Godin Road above confluence with Trib #4, Berkshire.
Samsonville Brook 0.2 Immediately above Route 105 bridge and RR bikepath, Enosburg.
Table 13. Biological monitoring needed in the Lower or Mid Missisquoi watershed
Water-body id
Stream or river name
Location/number of sites
Comments
VT06-03 Morrow Brook 1 site - anywhere No samples from this named stream.
VT06-04 Giddings Brook 1 site - anywhere No samples from this named stream.
24
VT06-04 Loveland Brook 1 site - anywhere No samples from this named stream.
VT06-04 Stanhope Brook 1 site - anywhere No samples from this named stream.
VT06-04 Lucas Brook 1 site - anywhere No samples from this named stream.
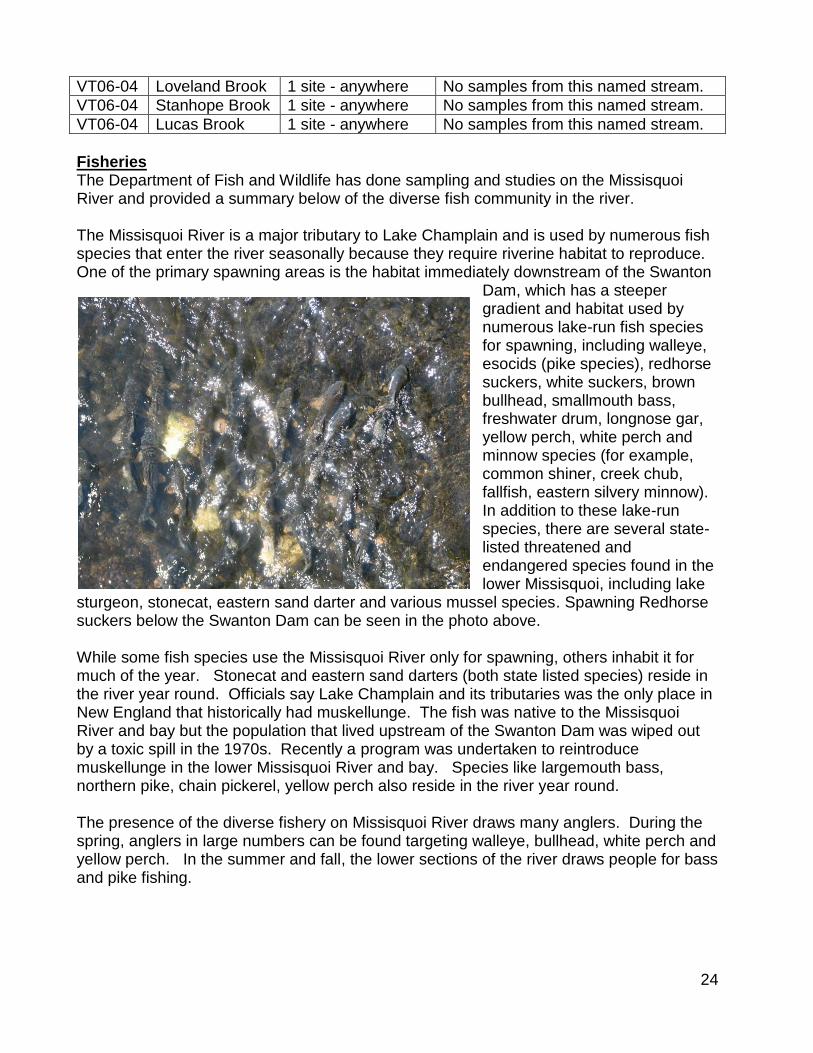
Fisheries The Department of Fish and Wildlife has done sampling and studies on the Missisquoi River and provided a summary below of the diverse fish community in the river. The Missisquoi River is a major tributary to Lake Champlain and is used by numerous fish species that enter the river seasonally because they require riverine habitat to reproduce. One of the primary spawning areas is the habitat immediately downstream of the Swanton
Dam, which has a steeper gradient and habitat used by numerous lake-run fish species for spawning, including walleye, esocids (pike species), redhorse suckers, white suckers, brown bullhead, smallmouth bass, freshwater drum, longnose gar, yellow perch, white perch and minnow species (for example, common shiner, creek chub, fallfish, eastern silvery minnow). In addition to these lake-run species, there are several state-listed threatened and endangered species found in the lower Missisquoi, including lake
sturgeon, stonecat, eastern sand darter and various mussel species. Spawning Redhorse suckers below the Swanton Dam can be seen in the photo above. While some fish species use the Missisquoi River only for spawning, others inhabit it for much of the year. Stonecat and eastern sand darters (both state listed species) reside in the river year round. Officials say Lake Champlain and its tributaries was the only place in New England that historically had muskellunge. The fish was native to the Missisquoi River and bay but the population that lived upstream of the Swanton Dam was wiped out by a toxic spill in the 1970s. Recently a program was undertaken to reintroduce muskellunge in the lower Missisquoi River and bay. Species like largemouth bass, northern pike, chain pickerel, yellow perch also reside in the river year round. The presence of the diverse fishery on Missisquoi River draws many anglers. During the spring, anglers in large numbers can be found targeting walleye, bullhead, white perch and yellow perch. In the summer and fall, the lower sections of the river draws people for bass and pike fishing.

25
Hazardous sites Boise Cascade/North Site A hazardous waste site, the Boise Cascade/North Landfill/Lagoon (Boise Cascade/NLL), is located on Mill Street in Sheldon and is bounded on the north by the Missisquoi River. Some history and some sampling results are described in the 2004 Missisquoi River watershed assessment report. Following is information from Ross Environmental Associates, Inc. (R.E.A.) who has done regular inspections of both the Boise North and Boise South hazardous waste sites. This information is from a site visit in May 2014 and a report dated June 5, 2014.
“Final confirmatory groundwater, surface water and sediment sample were completed in 2000, with no State or Federal standards exceeded. No further sampling was required to be completed. Since the 2000 sampling event, R.E.A. has completed semi-annual inspections of the landfill caps and surrounding seeps, streams and dams. No significant change in the caps, seeps, streams or dams have been noted… [May 2014] Inspection of the North Landfill included a walk around the entire perimeter of the landfill encompassing the area betweeen the Missisquoi River to the north and the Recreation path to the south….No visible seeps were noted around the perimeter of the landfill area or along the Missisquoi River, which abuts the landfill to the north..”
R.E.A. has recommended to the land owner that they apply for “Custodial Care” status from Vermont DEC Waste Management Division. Young Landfill The Young Landfill property is a hazardous waste site in Highgate, which is bordered on the east by wetlands that are adjacent to Kelly Brook and the “toe of the slope of the landfill is in contact with surface water.” The property was first used as a sand and gravel quarry from 1953 until the early 1960s. At that time, it began operating as a municipal landfill serving nine towns. "Industrial waste disposal occurred from the 1960s until 1979 in three solvent trenches, located approximately 300 feet northwest of the landfill." (Trip Report for the Young Landfill, Highgate, Vermont done for EPA by Roy F. Weston Inc. Feb. 1999). Following the 1978 Vermont Solid Waste Rules, the Young Landfill was given an "Assurance of Discontinuance" requiring the facility to close by April 1, 1983. In May 1984, Vermont Agency of Environmental Conservation personnel saw leachate coming from the eastern edge of the landfill and on the landfill slopes. Also in September 1984 paper sludge was being used as a landfill cover. In December 1985, the owner was told that disposal activites should cease by January 20, 1986. Later investigations found that disposal activities had continued still. Groundwater, soil, surface water, and sediment sampling occurred over the years following: 1989, 1993, 1996, and 1998. The 1998 sampling done by a U.S. EPA and Vermont DEC team found nine inorganic elements above Vermont Groundwater Enforcement Standards (VGES) in seep samples, and sediment in Kelly Brook contained beryllium and bis(2-ethylhexyl) phthalate in concentrations exceeding the sample detection limit and reference level respectively.
26
In 2011, a report was done by Stone Environmental for Vermont DEC that reported on the results from a Limited Site Investigation (LSI) at the Young Landfill. This investigation looked at groundwater and sediment quality. Groundwater samples were taken from eight monitoring wells and six sediment samples were collected as well. Monitoring well 5 on the east side of the landfill (the Kelly Brook side) had arsensic above the VGES in the September 2011 sample. Two of the sediment samples had arsenic, copper, nickel, and zinc above the Vermont DEC Sediment Quality Guideline Threshold Effect Concentrations (TEC) with arsenic being above the Probable Effects Concentration as well. A third sediment sample had nickel and zinc about the TEC. Lampricide impacts 2008 The Missisquoi River was treated with lampricide in fall 2008 to kill sea lamprey. Of the lamprey species that were killed in the 2008 treatment, only 37.6% were the targeted sea lamprey and 61.9% were the silver lamprey - a species of special concern - with 0.5% (1 individual) killed being the brook lamprey. The one brook lamprey killed was the first record of it being in the Missisquoi River downstream of the Swanton Dam. In addition, at least twelve species and 85 individuals of non-lamprey fish were killed in this 2008 treatment including 22 stonecats, 23 logperch and 13 tessalated darters. Stonecats are a state endangered species and the dead stonecats are the first record of them in the Missisquoi River downstream of the Swanton Dam. One mudpuppy, a species of special concern, and 531 northern leopard frogs were killed. 2012 There were 7.8 miles of the Missisquoi River treated with lampricide in 2012. The fish species found dead in the immediate post-treatment survey (not including sea lamprey) included: 143 silver lamprey, 13 tesselated darters, 6 logperch, 5 brown bullheads, 2 bluegills, 1 unidentified cyprinid, 1 American brook lamprey (threatened), 1 stonecat (endangered). No other species were noted as killed in the assessment stretches. Five stretches in the 7.8 mile treatment length were assessed on two days following the treatment. Only a small percent of the riverbed was surveyed per section: 10% in M1, 5% in M2, 8% in M3, 5% in M4 and 3% in M5. In addition to the post-treatment survey for non-target species, there was also a pre- and post-survey of sea lamprey, which also noted the silver lamprey and American brook lamprey found. The year before the 2012 Missisquoi treatment, there were 63 sea lamprey, 69 silver lamprey, and two American brook lamprey (threatened) found. Following the treatment in the 2013 season, there were no sea lamprey, one silver lamprey, and no American brook lamprey found.
27
BBllaacckk CCrreeeekk
General Description
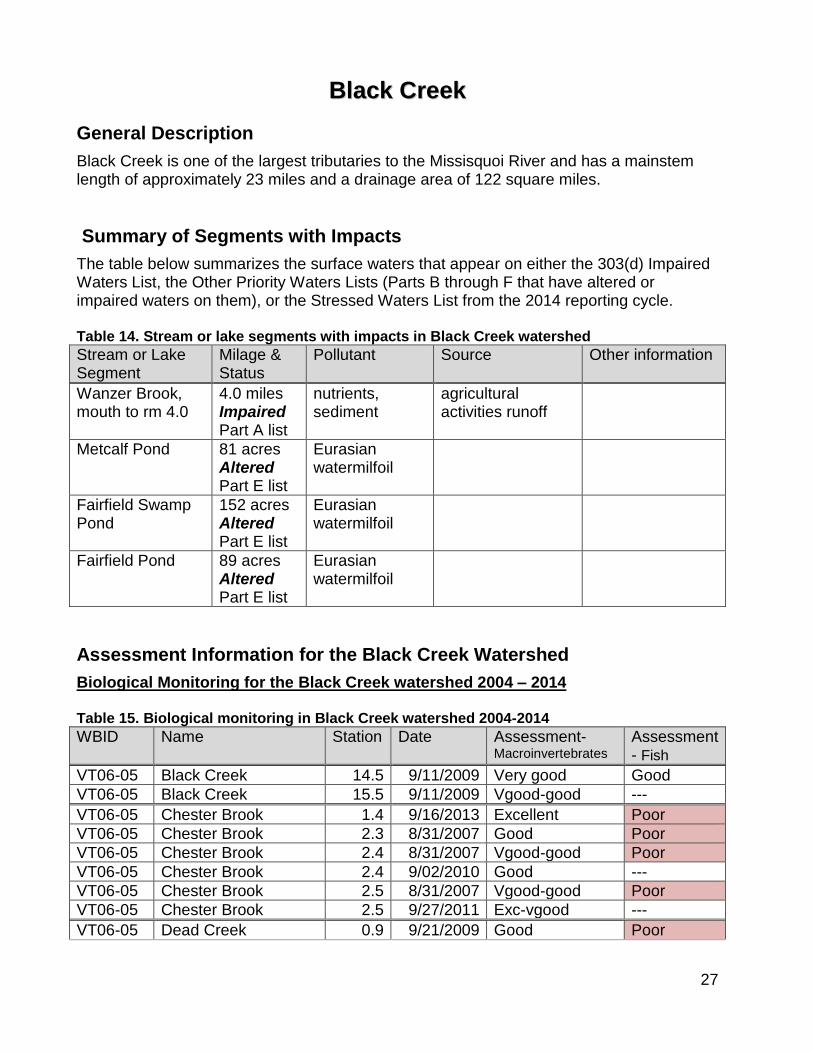
Black Creek is one of the largest tributaries to the Missisquoi River and has a mainstem length of approximately 23 miles and a drainage area of 122 square miles.
Summary of Segments with Impacts
The table below summarizes the surface waters that appear on either the 303(d) Impaired Waters List, the Other Priority Waters Lists (Parts B through F that have altered or impaired waters on them), or the Stressed Waters List from the 2014 reporting cycle. Table 14. Stream or lake segments with impacts in Black Creek watershed
Stream or Lake Segment
Milage & Status
Pollutant Source Other information
Wanzer Brook, mouth to rm 4.0
4.0 miles Impaired Part A list
nutrients, sediment
agricultural activities runoff
Metcalf Pond
81 acres Altered Part E list
Eurasian watermilfoil
Fairfield Swamp Pond
152 acres Altered Part E list
Eurasian watermilfoil
Fairfield Pond
89 acres Altered Part E list
Eurasian watermilfoil
Assessment Information for the Black Creek Watershed
Biological Monitoring for the Black Creek watershed 2004 – 2014 Table 15. Biological monitoring in Black Creek watershed 2004-2014
WBID Name Station Date Assessment-Macroinvertebrates
Assessment - Fish
VT06-05 Black Creek 14.5 9/11/2009 Very good Good
VT06-05 Black Creek 15.5 9/11/2009 Vgood-good ---
VT06-05 Chester Brook 1.4 9/16/2013 Excellent Poor
VT06-05 Chester Brook 2.3 8/31/2007 Good Poor
VT06-05 Chester Brook 2.4 8/31/2007 Vgood-good Poor
VT06-05 Chester Brook 2.4 9/02/2010 Good ---
VT06-05 Chester Brook 2.5 8/31/2007 Vgood-good Poor
VT06-05 Chester Brook 2.5 9/27/2011 Exc-vgood ---
VT06-05 Dead Creek 0.9 9/21/2009 Good Poor
28
WBID Name Station Date Assessment-Macroinvertebrates
Assessment - Fish
VT06-05 Fairfield River 0.2 9/24/2013 Good Very good
VT06-05 Swamp School Brook 0.5 10/17/2006 Excellent ---
VT06-05 Swamp School Brook 0.9 9/21/2009 Exc-vgood Poor
VT06-05 Wanzer Brook 1.4 9/14/2004 Good-fair Fair
VT06-05 Wanzer Brook 1.4 9/26/2006 Good Poor
VT06-05 Wanzer Brook 3.2 9/14/2004 Fair Poor
VT06-05 Wanzer Brook 3.2 9/26/2006 --- Poor
VT06-05 Wanzer Brook 3.2 9/02/2010 Good ---
VT06-05 Wanzer Brook 3.6 8/30/2007 Fair Poor
VT06-05 Wanzer Brook 3.6 9/02/2010 Good Poor
VT06-05 Wanzer Brook 3.6 9/27/2011 Fair-poor ---
VT06-05 Wanzer Brook 3.6 9/24/2013 Good ---
VT06-05 Wanzer Brook 4.0 8/30/2007 Good-fair Poor
VT06-05 Wanzer Brook 4.0 9/02/2010 Good Poor
VT06-05 Wanzer Brook 4.0 9/27/2011 Good-fair ---
VT06-05 Wanzer Brook 4.0 9/24/2013 Good ---
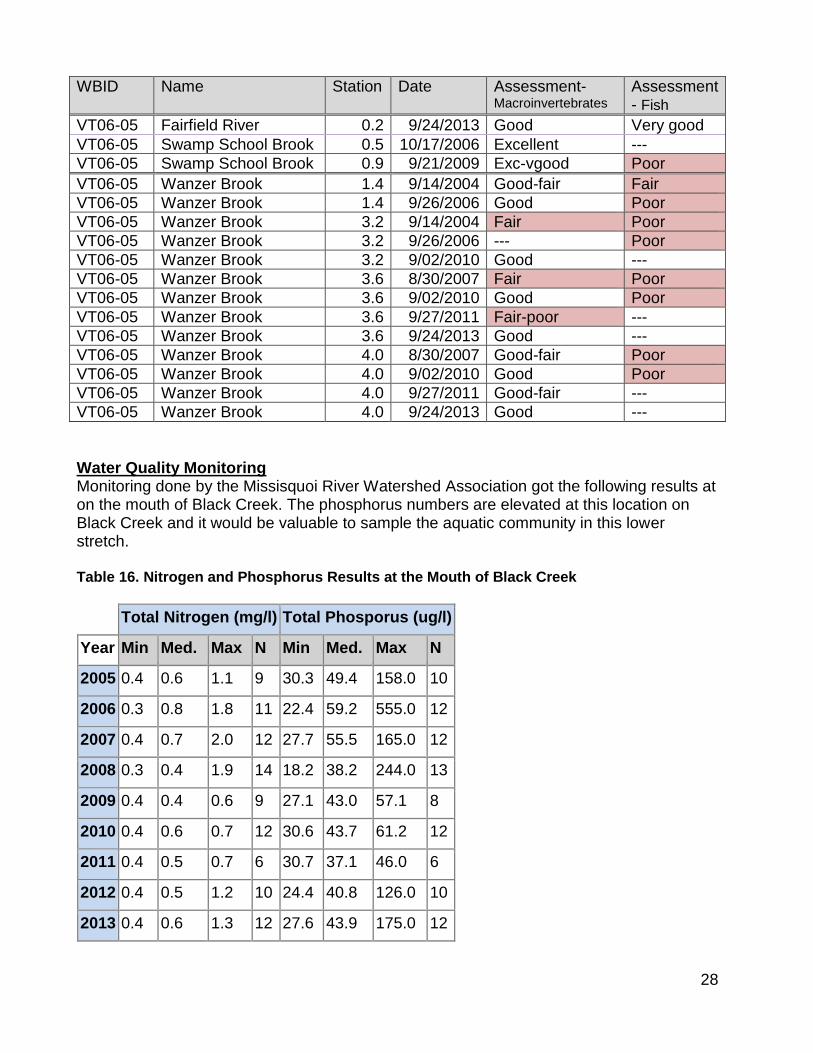
Water Quality Monitoring Monitoring done by the Missisquoi River Watershed Association got the following results at on the mouth of Black Creek. The phosphorus numbers are elevated at this location on Black Creek and it would be valuable to sample the aquatic community in this lower stretch. Table 16. Nitrogen and Phosphorus Results at the Mouth of Black Creek
Total Nitrogen (mg/l) Total Phosporus (ug/l)
Year Min Med. Max N Min Med. Max N
2005 0.4 0.6 1.1 9 30.3 49.4 158.0 10
2006 0.3 0.8 1.8 11 22.4 59.2 555.0 12
2007 0.4 0.7 2.0 12 27.7 55.5 165.0 12
2008 0.3 0.4 1.9 14 18.2 38.2 244.0 13
2009 0.4 0.4 0.6 9 27.1 43.0 57.1 8
2010 0.4 0.6 0.7 12 30.6 43.7 61.2 12
2011 0.4 0.5 0.7 6 30.7 37.1 46.0 6
2012 0.4 0.5 1.2 10 24.4 40.8 126.0 10
2013 0.4 0.6 1.3 12 27.6 43.9 175.0 12
29
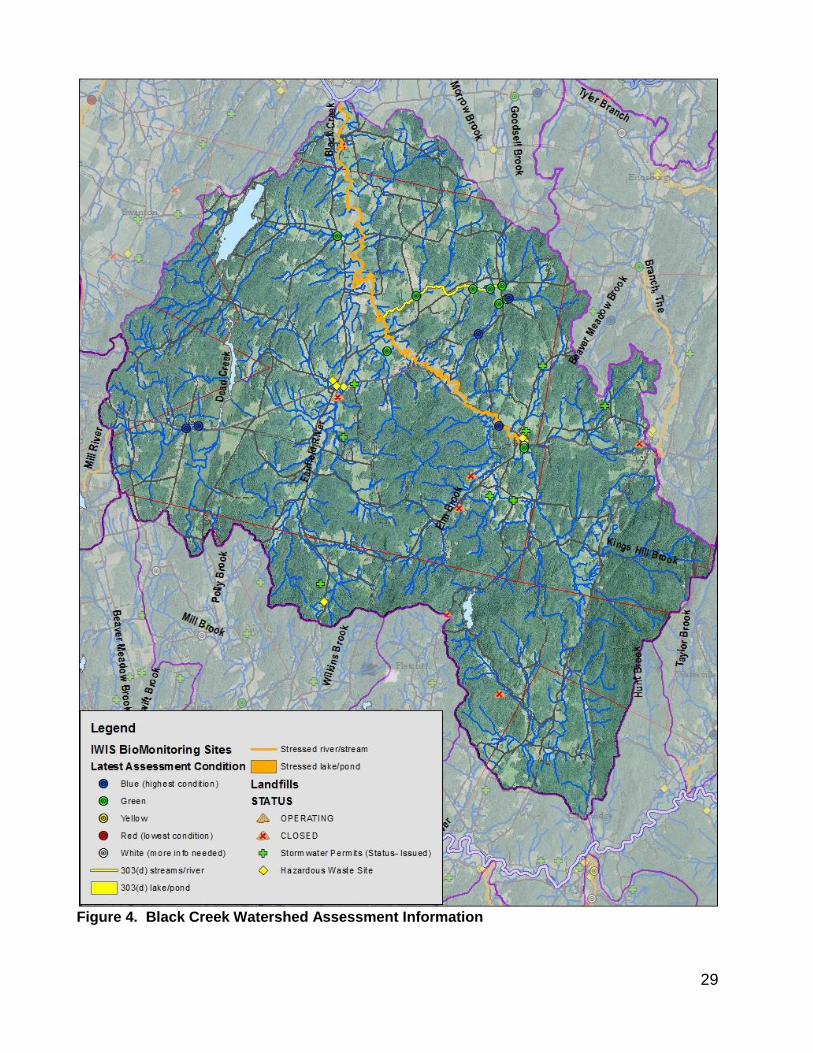
Figure 4. Black Creek Watershed Assessment Information
30
TTyylleerr BBrraanncchh
General Description
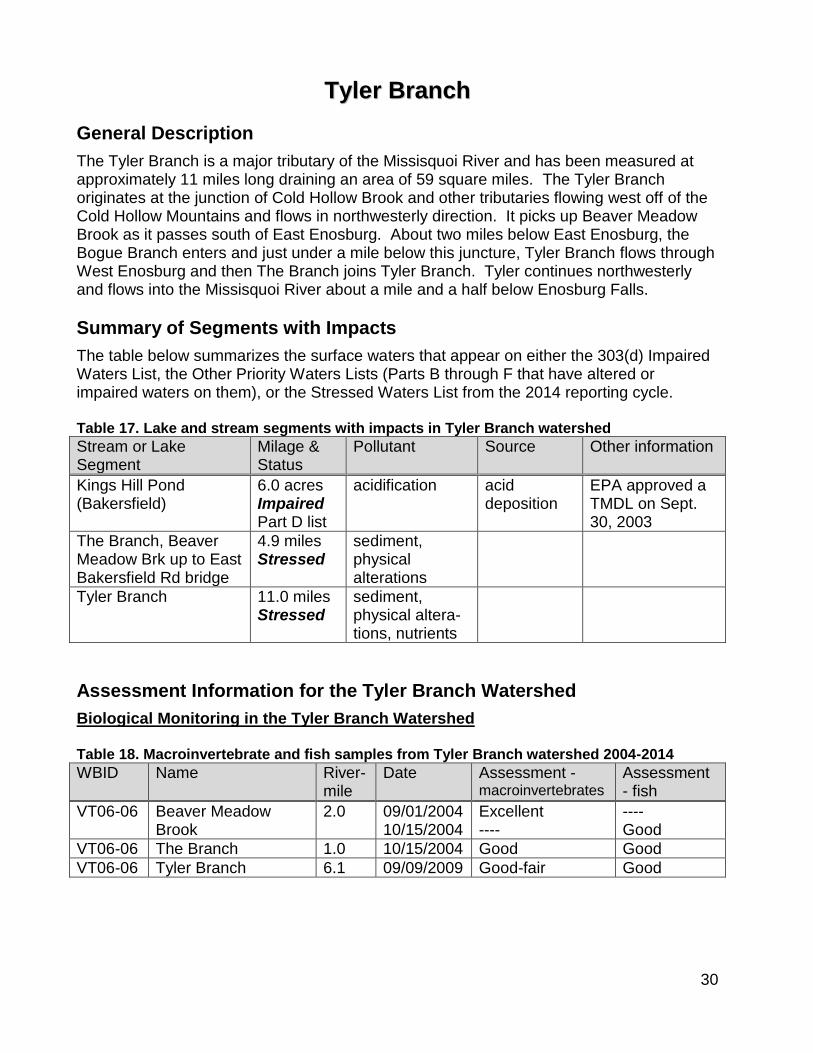
The Tyler Branch is a major tributary of the Missisquoi River and has been measured at approximately 11 miles long draining an area of 59 square miles. The Tyler Branch originates at the junction of Cold Hollow Brook and other tributaries flowing west off of the Cold Hollow Mountains and flows in northwesterly direction. It picks up Beaver Meadow Brook as it passes south of East Enosburg. About two miles below East Enosburg, the Bogue Branch enters and just under a mile below this juncture, Tyler Branch flows through West Enosburg and then The Branch joins Tyler Branch. Tyler continues northwesterly and flows into the Missisquoi River about a mile and a half below Enosburg Falls.
Summary of Segments with Impacts
The table below summarizes the surface waters that appear on either the 303(d) Impaired Waters List, the Other Priority Waters Lists (Parts B through F that have altered or impaired waters on them), or the Stressed Waters List from the 2014 reporting cycle. Table 17. Lake and stream segments with impacts in Tyler Branch watershed
Stream or Lake Segment
Milage & Status
Pollutant Source Other information
Kings Hill Pond (Bakersfield)
6.0 acres Impaired Part D list
acidification acid deposition
EPA approved a TMDL on Sept. 30, 2003
The Branch, Beaver Meadow Brk up to East Bakersfield Rd bridge
4.9 miles Stressed
sediment, physical alterations
Tyler Branch 11.0 miles Stressed
sediment, physical altera-tions, nutrients
Assessment Information for the Tyler Branch Watershed
Biological Monitoring in the Tyler Branch Watershed Table 18. Macroinvertebrate and fish samples from Tyler Branch watershed 2004-2014
WBID Name River-mile
Date Assessment - macroinvertebrates
Assessment - fish
VT06-06 Beaver Meadow Brook
2.0 09/01/2004 10/15/2004
Excellent ----
---- Good
VT06-06 The Branch 1.0 10/15/2004 Good Good
VT06-06 Tyler Branch 6.1 09/09/2009 Good-fair Good
31
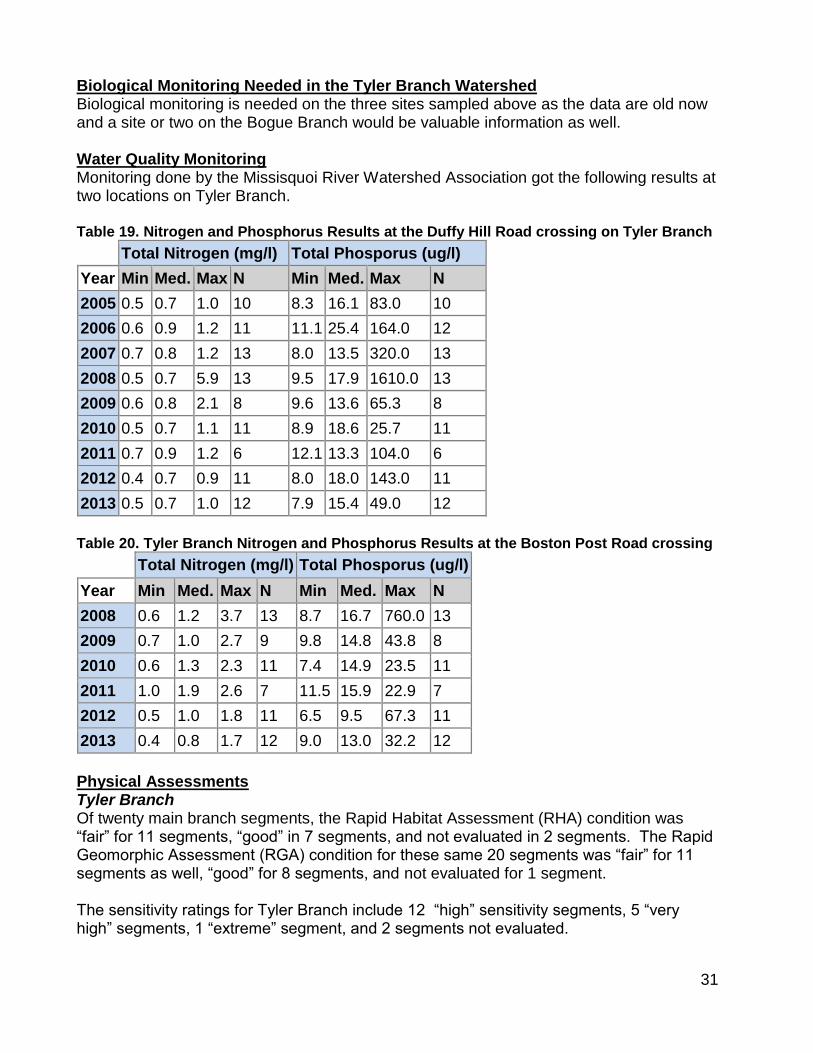
Biological Monitoring Needed in the Tyler Branch Watershed Biological monitoring is needed on the three sites sampled above as the data are old now and a site or two on the Bogue Branch would be valuable information as well. Water Quality Monitoring Monitoring done by the Missisquoi River Watershed Association got the following results at two locations on Tyler Branch. Table 19. Nitrogen and Phosphorus Results at the Duffy Hill Road crossing on Tyler Branch
Total Nitrogen (mg/l) Total Phosporus (ug/l)
Year Min Med. Max N Min Med. Max N
2005 0.5 0.7 1.0 10 8.3 16.1 83.0 10
2006 0.6 0.9 1.2 11 11.1 25.4 164.0 12
2007 0.7 0.8 1.2 13 8.0 13.5 320.0 13
2008 0.5 0.7 5.9 13 9.5 17.9 1610.0 13
2009 0.6 0.8 2.1 8 9.6 13.6 65.3 8
2010 0.5 0.7 1.1 11 8.9 18.6 25.7 11
2011 0.7 0.9 1.2 6 12.1 13.3 104.0 6
2012 0.4 0.7 0.9 11 8.0 18.0 143.0 11
2013 0.5 0.7 1.0 12 7.9 15.4 49.0 12
Table 20. Tyler Branch Nitrogen and Phosphorus Results at the Boston Post Road crossing
Total Nitrogen (mg/l) Total Phosporus (ug/l)
Year Min Med. Max N Min Med. Max N
2008 0.6 1.2 3.7 13 8.7 16.7 760.0 13
2009 0.7 1.0 2.7 9 9.8 14.8 43.8 8
2010 0.6 1.3 2.3 11 7.4 14.9 23.5 11
2011 1.0 1.9 2.6 7 11.5 15.9 22.9 7
2012 0.5 1.0 1.8 11 6.5 9.5 67.3 11
2013 0.4 0.8 1.7 12 9.0 13.0 32.2 12
Physical Assessments Tyler Branch Of twenty main branch segments, the Rapid Habitat Assessment (RHA) condition was “fair” for 11 segments, “good” in 7 segments, and not evaluated in 2 segments. The Rapid Geomorphic Assessment (RGA) condition for these same 20 segments was “fair” for 11 segments as well, “good” for 8 segments, and not evaluated for 1 segment. The sensitivity ratings for Tyler Branch include 12 “high” sensitivity segments, 5 “very high” segments, 1 “extreme” segment, and 2 segments not evaluated.
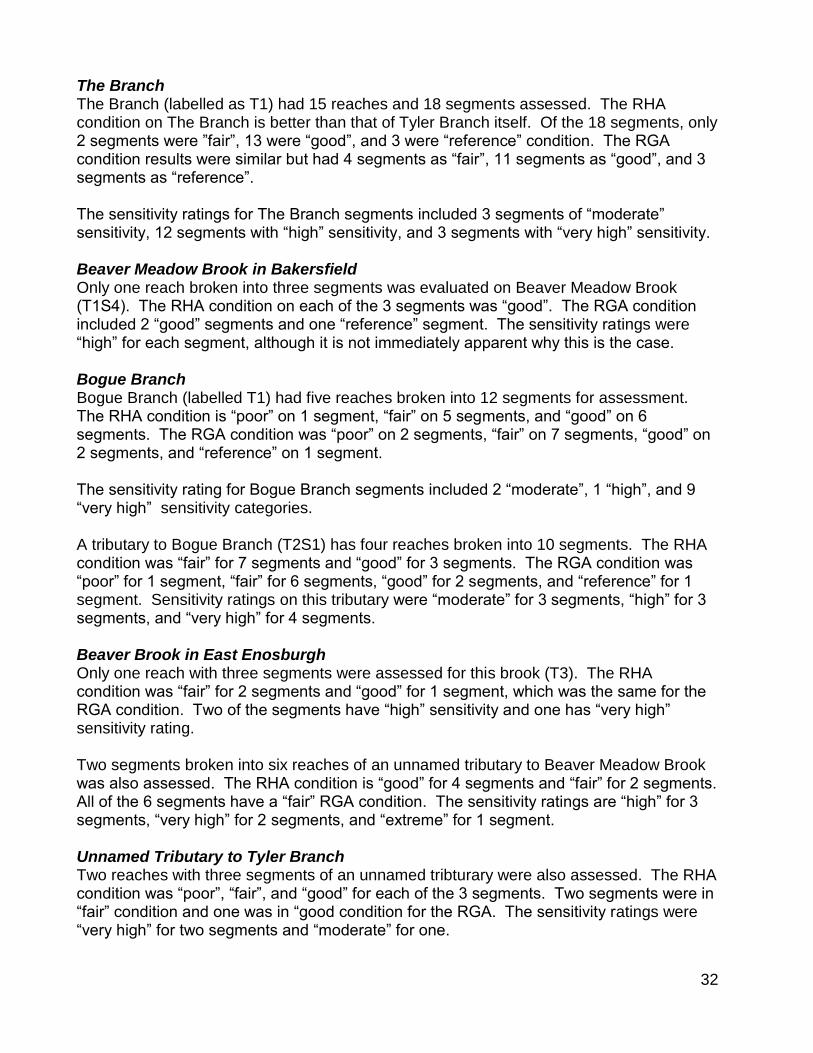
32
The Branch The Branch (labelled as T1) had 15 reaches and 18 segments assessed. The RHA condition on The Branch is better than that of Tyler Branch itself. Of the 18 segments, only 2 segments were ”fair”, 13 were “good”, and 3 were “reference” condition. The RGA condition results were similar but had 4 segments as “fair”, 11 segments as “good”, and 3 segments as “reference”. The sensitivity ratings for The Branch segments included 3 segments of “moderate” sensitivity, 12 segments with “high” sensitivity, and 3 segments with “very high” sensitivity. Beaver Meadow Brook in Bakersfield Only one reach broken into three segments was evaluated on Beaver Meadow Brook (T1S4). The RHA condition on each of the 3 segments was “good”. The RGA condition included 2 “good” segments and one “reference” segment. The sensitivity ratings were “high” for each segment, although it is not immediately apparent why this is the case. Bogue Branch Bogue Branch (labelled T1) had five reaches broken into 12 segments for assessment. The RHA condition is “poor” on 1 segment, “fair” on 5 segments, and “good” on 6 segments. The RGA condition was “poor” on 2 segments, “fair” on 7 segments, “good” on 2 segments, and “reference” on 1 segment. The sensitivity rating for Bogue Branch segments included 2 “moderate”, 1 “high”, and 9 “very high” sensitivity categories. A tributary to Bogue Branch (T2S1) has four reaches broken into 10 segments. The RHA condition was “fair” for 7 segments and “good” for 3 segments. The RGA condition was “poor” for 1 segment, “fair” for 6 segments, “good” for 2 segments, and “reference” for 1 segment. Sensitivity ratings on this tributary were “moderate” for 3 segments, “high” for 3 segments, and “very high” for 4 segments. Beaver Brook in East Enosburgh Only one reach with three segments were assessed for this brook (T3). The RHA condition was “fair” for 2 segments and “good” for 1 segment, which was the same for the RGA condition. Two of the segments have “high” sensitivity and one has “very high” sensitivity rating. Two segments broken into six reaches of an unnamed tributary to Beaver Meadow Brook was also assessed. The RHA condition is “good” for 4 segments and “fair” for 2 segments. All of the 6 segments have a “fair” RGA condition. The sensitivity ratings are “high” for 3 segments, “very high” for 2 segments, and “extreme” for 1 segment. Unnamed Tributary to Tyler Branch Two reaches with three segments of an unnamed tribturary were also assessed. The RHA condition was “poor”, “fair”, and “good” for each of the 3 segments. Two segments were in “fair” condition and one was in “good condition for the RGA. The sensitivity ratings were “very high” for two segments and “moderate” for one.
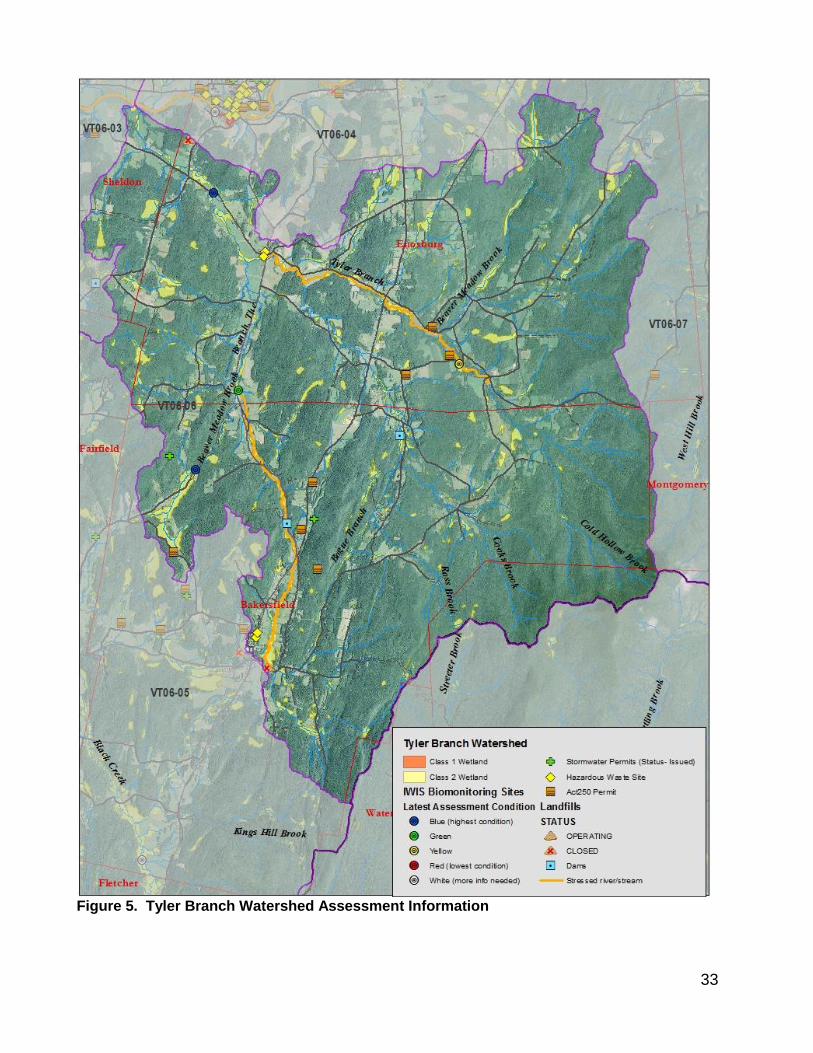
33
Figure 5. Tyler Branch Watershed Assessment Information
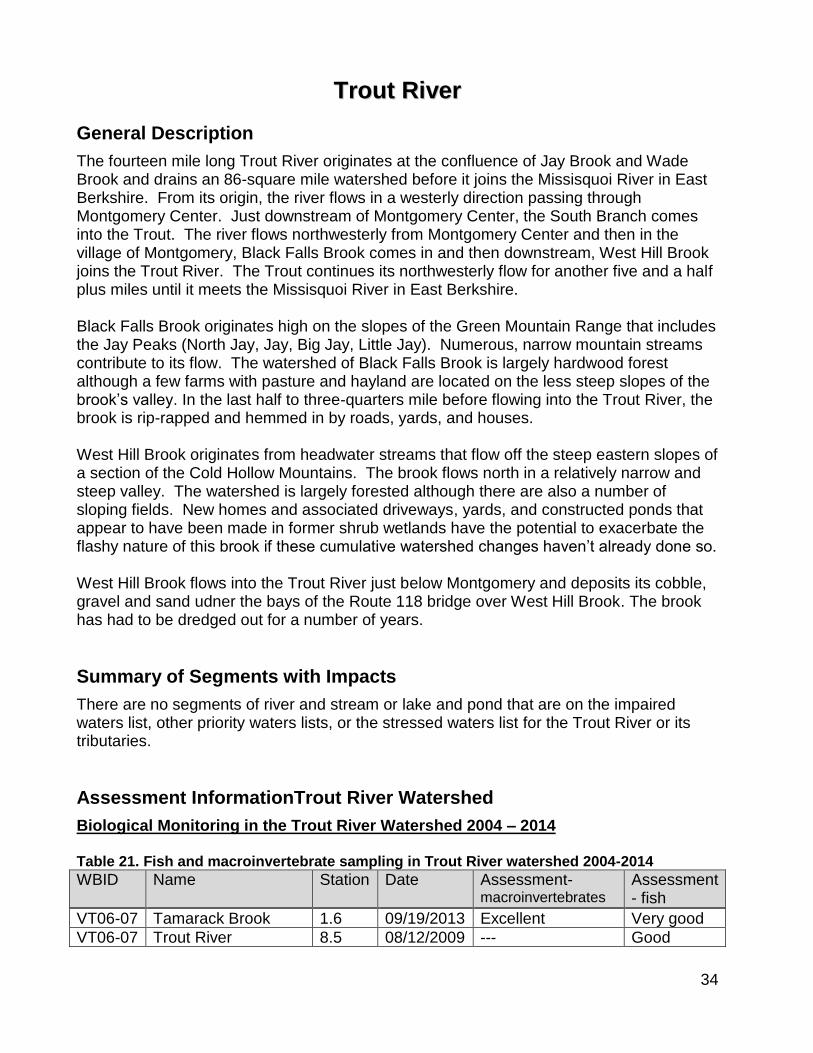
34
TTrroouutt RRiivveerr
General Description
The fourteen mile long Trout River originates at the confluence of Jay Brook and Wade Brook and drains an 86-square mile watershed before it joins the Missisquoi River in East Berkshire. From its origin, the river flows in a westerly direction passing through Montgomery Center. Just downstream of Montgomery Center, the South Branch comes into the Trout. The river flows northwesterly from Montgomery Center and then in the village of Montgomery, Black Falls Brook comes in and then downstream, West Hill Brook joins the Trout River. The Trout continues its northwesterly flow for another five and a half plus miles until it meets the Missisquoi River in East Berkshire. Black Falls Brook originates high on the slopes of the Green Mountain Range that includes the Jay Peaks (North Jay, Jay, Big Jay, Little Jay). Numerous, narrow mountain streams contribute to its flow. The watershed of Black Falls Brook is largely hardwood forest although a few farms with pasture and hayland are located on the less steep slopes of the brook’s valley. In the last half to three-quarters mile before flowing into the Trout River, the brook is rip-rapped and hemmed in by roads, yards, and houses. West Hill Brook originates from headwater streams that flow off the steep eastern slopes of a section of the Cold Hollow Mountains. The brook flows north in a relatively narrow and steep valley. The watershed is largely forested although there are also a number of sloping fields. New homes and associated driveways, yards, and constructed ponds that appear to have been made in former shrub wetlands have the potential to exacerbate the flashy nature of this brook if these cumulative watershed changes haven’t already done so. West Hill Brook flows into the Trout River just below Montgomery and deposits its cobble, gravel and sand udner the bays of the Route 118 bridge over West Hill Brook. The brook has had to be dredged out for a number of years.
Summary of Segments with Impacts
There are no segments of river and stream or lake and pond that are on the impaired waters list, other priority waters lists, or the stressed waters list for the Trout River or its tributaries.
Assessment InformationTrout River Watershed
Biological Monitoring in the Trout River Watershed 2004 – 2014 Table 21. Fish and macroinvertebrate sampling in Trout River watershed 2004-2014
WBID Name Station Date Assessment- macroinvertebrates
Assessment - fish
VT06-07 Tamarack Brook 1.6 09/19/2013 Excellent Very good
VT06-07 Trout River 8.5 08/12/2009 --- Good
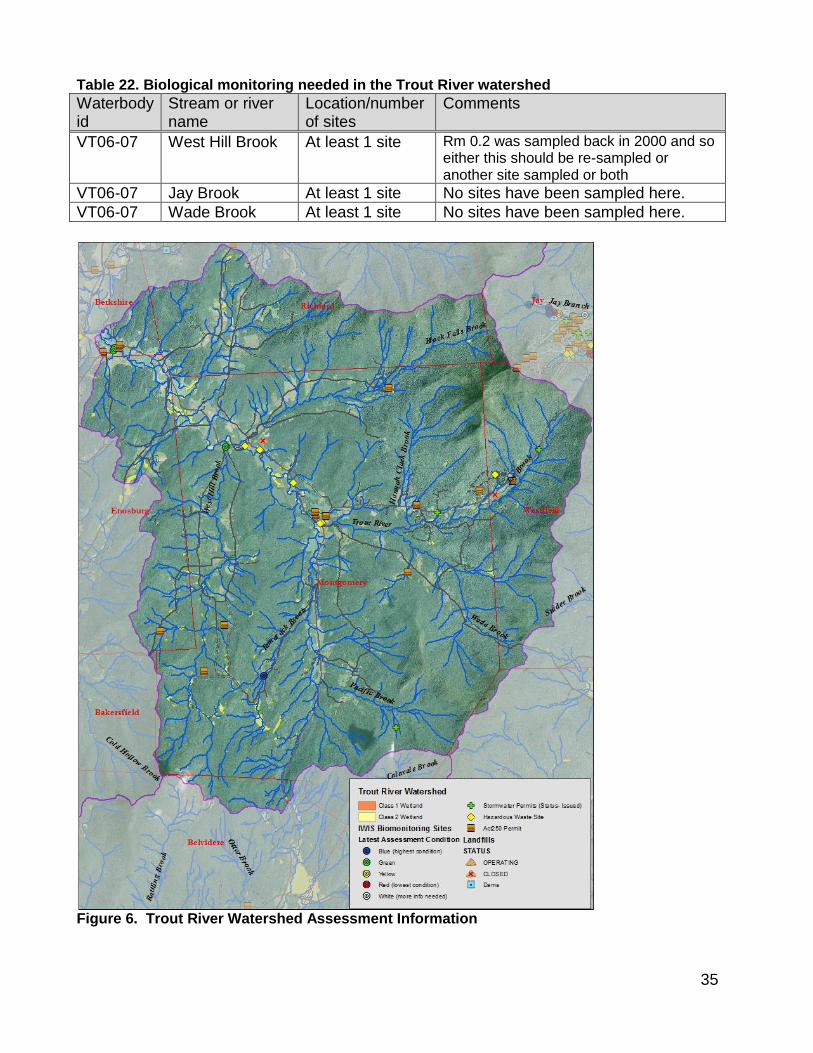
35
Table 22. Biological monitoring needed in the Trout River watershed
Waterbody id
Stream or river name
Location/number of sites
Comments
VT06-07 West Hill Brook At least 1 site Rm 0.2 was sampled back in 2000 and so either this should be re-sampled or another site sampled or both
VT06-07 Jay Brook At least 1 site No sites have been sampled here.
VT06-07 Wade Brook At least 1 site No sites have been sampled here.
Figure 6. Trout River Watershed Assessment Information
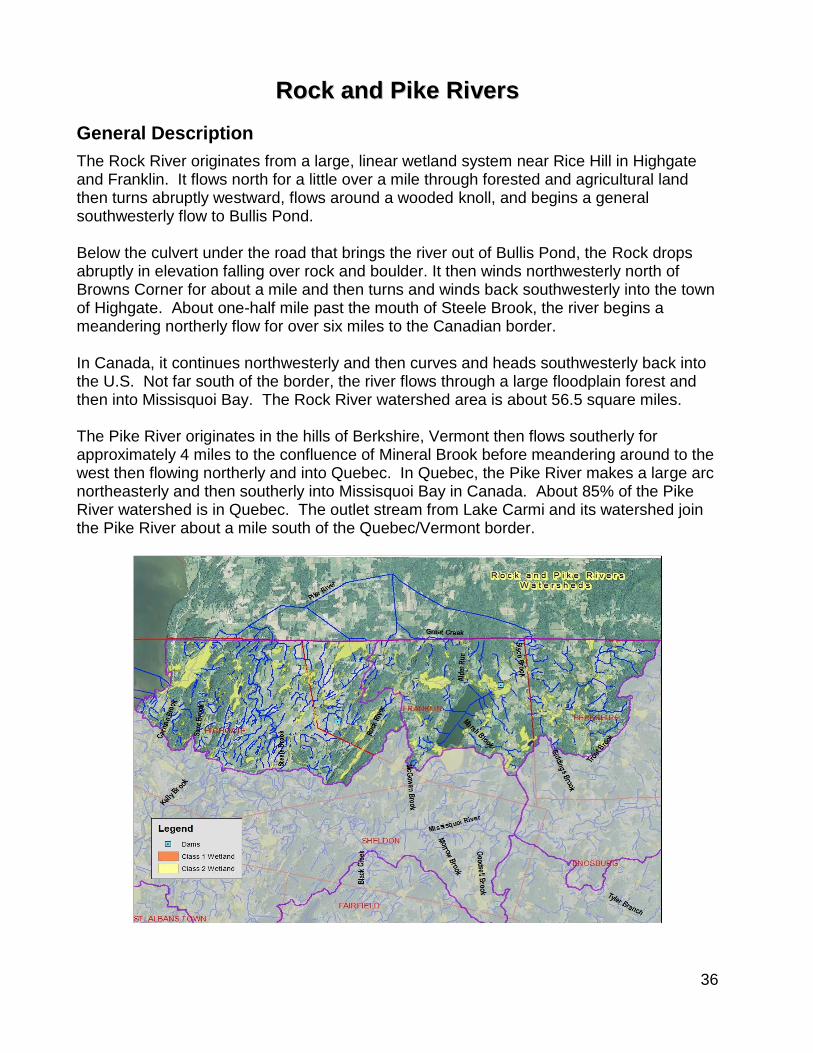
36
RRoocckk aanndd PPiikkee RRiivveerrss
General Description
The Rock River originates from a large, linear wetland system near Rice Hill in Highgate and Franklin. It flows north for a little over a mile through forested and agricultural land then turns abruptly westward, flows around a wooded knoll, and begins a general southwesterly flow to Bullis Pond. Below the culvert under the road that brings the river out of Bullis Pond, the Rock drops abruptly in elevation falling over rock and boulder. It then winds northwesterly north of Browns Corner for about a mile and then turns and winds back southwesterly into the town of Highgate. About one-half mile past the mouth of Steele Brook, the river begins a meandering northerly flow for over six miles to the Canadian border. In Canada, it continues northwesterly and then curves and heads southwesterly back into the U.S. Not far south of the border, the river flows through a large floodplain forest and then into Missisquoi Bay. The Rock River watershed area is about 56.5 square miles. The Pike River originates in the hills of Berkshire, Vermont then flows southerly for approximately 4 miles to the confluence of Mineral Brook before meandering around to the west then flowing northerly and into Quebec. In Quebec, the Pike River makes a large arc northeasterly and then southerly into Missisquoi Bay in Canada. About 85% of the Pike River watershed is in Quebec. The outlet stream from Lake Carmi and its watershed join the Pike River about a mile south of the Quebec/Vermont border.
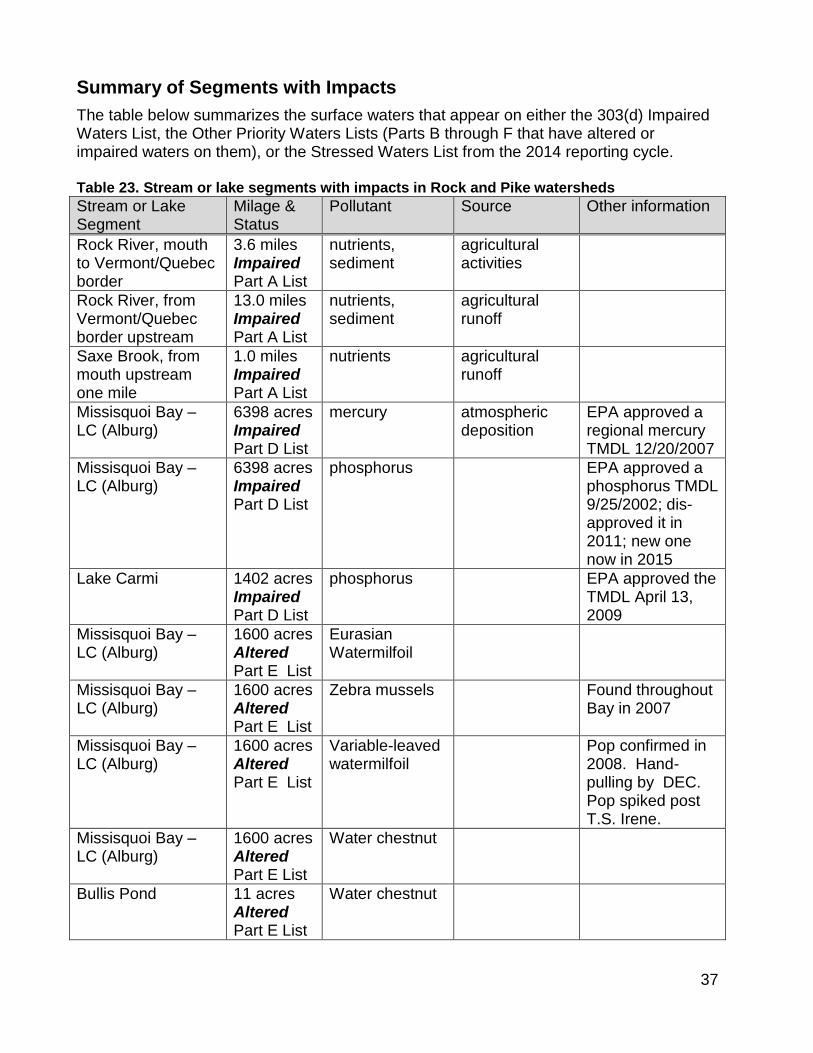
37
Summary of Segments with Impacts
The table below summarizes the surface waters that appear on either the 303(d) Impaired Waters List, the Other Priority Waters Lists (Parts B through F that have altered or impaired waters on them), or the Stressed Waters List from the 2014 reporting cycle. Table 23. Stream or lake segments with impacts in Rock and Pike watersheds
Stream or Lake Segment
Milage & Status
Pollutant Source Other information
Rock River, mouth to Vermont/Quebec border
3.6 miles Impaired Part A List
nutrients, sediment
agricultural activities
Rock River, from Vermont/Quebec border upstream
13.0 miles Impaired Part A List
nutrients, sediment
agricultural runoff
Saxe Brook, from mouth upstream one mile
1.0 miles Impaired Part A List
nutrients agricultural runoff
Missisquoi Bay – LC (Alburg)
6398 acres Impaired Part D List
mercury
atmospheric deposition
EPA approved a regional mercury TMDL 12/20/2007
Missisquoi Bay – LC (Alburg)
6398 acres Impaired Part D List
phosphorus EPA approved a phosphorus TMDL 9/25/2002; dis-approved it in 2011; new one now in 2015
Lake Carmi 1402 acres Impaired Part D List
phosphorus EPA approved the TMDL April 13, 2009
Missisquoi Bay – LC (Alburg)
1600 acres Altered Part E List
Eurasian Watermilfoil
Missisquoi Bay – LC (Alburg)
1600 acres Altered Part E List
Zebra mussels Found throughout Bay in 2007
Missisquoi Bay – LC (Alburg)
1600 acres Altered Part E List
Variable-leaved watermilfoil
Pop confirmed in 2008. Hand-pulling by DEC. Pop spiked post T.S. Irene.
Missisquoi Bay – LC (Alburg)
1600 acres Altered Part E List
Water chestnut
Bullis Pond 11 acres Altered Part E List
Water chestnut
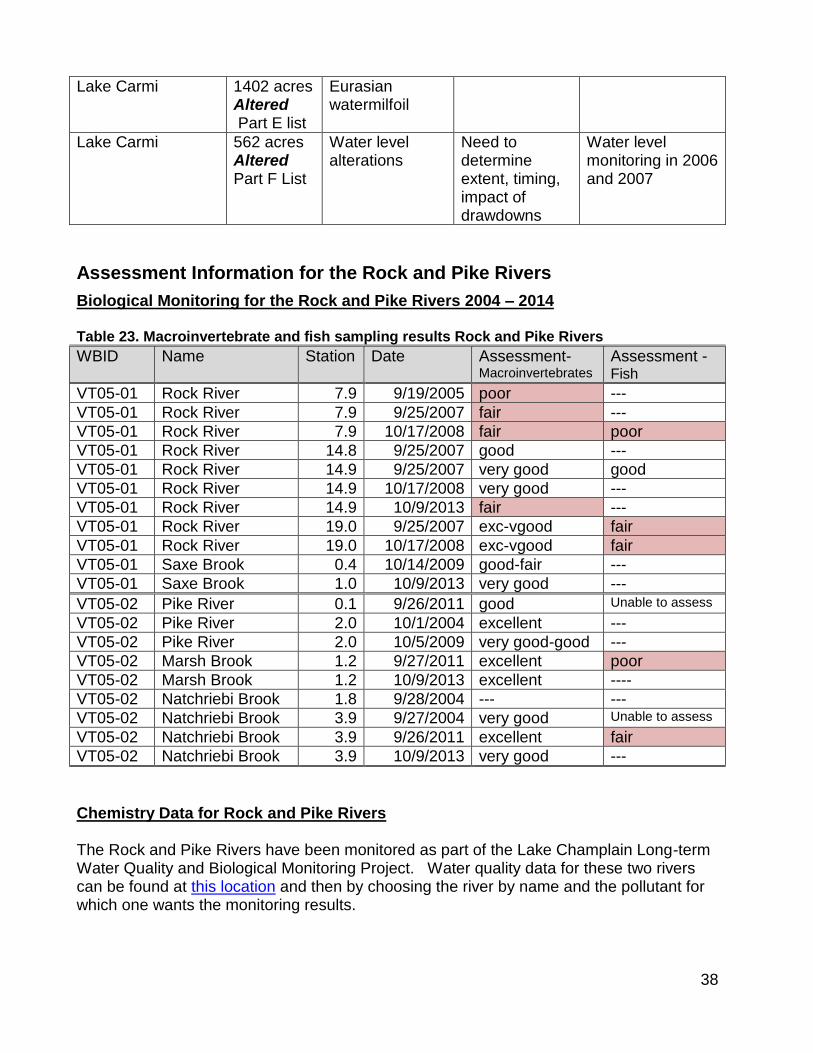
38
Lake Carmi 1402 acres Altered Part E list
Eurasian watermilfoil
Lake Carmi 562 acres Altered Part F List
Water level alterations
Need to determine extent, timing, impact of drawdowns
Water level monitoring in 2006 and 2007
Assessment Information for the Rock and Pike Rivers
Biological Monitoring for the Rock and Pike Rivers 2004 – 2014 Table 23. Macroinvertebrate and fish sampling results Rock and Pike Rivers
WBID Name Station Date Assessment-Macroinvertebrates
Assessment - Fish
VT05-01 Rock River 7.9 9/19/2005 poor ---
VT05-01 Rock River 7.9 9/25/2007 fair ---
VT05-01 Rock River 7.9 10/17/2008 fair poor
VT05-01 Rock River 14.8 9/25/2007 good ---
VT05-01 Rock River 14.9 9/25/2007 very good good
VT05-01 Rock River 14.9 10/17/2008 very good ---
VT05-01 Rock River 14.9 10/9/2013 fair ---
VT05-01 Rock River 19.0 9/25/2007 exc-vgood fair
VT05-01 Rock River 19.0 10/17/2008 exc-vgood fair
VT05-01 Saxe Brook 0.4 10/14/2009 good-fair ---
VT05-01 Saxe Brook 1.0 10/9/2013 very good ---
VT05-02 Pike River 0.1 9/26/2011 good Unable to assess
VT05-02 Pike River 2.0 10/1/2004 excellent ---
VT05-02 Pike River 2.0 10/5/2009 very good-good ---
VT05-02 Marsh Brook 1.2 9/27/2011 excellent poor
VT05-02 Marsh Brook 1.2 10/9/2013 excellent ----
VT05-02 Natchriebi Brook 1.8 9/28/2004 --- ---
VT05-02 Natchriebi Brook 3.9 9/27/2004 very good Unable to assess
VT05-02 Natchriebi Brook 3.9 9/26/2011 excellent fair
VT05-02 Natchriebi Brook 3.9 10/9/2013 very good ---
Chemistry Data for Rock and Pike Rivers The Rock and Pike Rivers have been monitored as part of the Lake Champlain Long-term Water Quality and Biological Monitoring Project. Water quality data for these two rivers can be found at this location and then by choosing the river by name and the pollutant for which one wants the monitoring results.
39
RReeffeerreenncceess aanndd RReessoouurrcceess Aquatic Life Use Support Attainment of the South Mountain Branch Watershed 2013, Vermont ANR DEC WSMD BASS. Assessing the Biological Condition of Vermont’s Wadeable Streams 2008-2012: Results of a statewide probability-based survey, October 2014. Vermont Department of Environmental Conservation, Watershed Management Division, Monitoring Assessment and Planning Program, Montpelier, Vermont. Black Creek Corridor Plan, Franklin County, April 2009. Prepared for Missisquoi River Basin Association, East Berkshire, Vermont by The Johnson Company, Inc., Montpelier, Vermont. Jay Peak Resort Water Quality Remediation Plan, October 6, 2006. Pioneer Environmental Associates, LLC, Vergennes, Vermont. Jay Peak Resort Water Quality Remediation Plan, Jay Branch Watershed, June 9, 2009, VHB Pioneer, North Ferrisburgh, Vermont. Lake Champlain Sea Lamprey Control Program Chemical Treatment Summary: Missisquoi River, Vermont 2012” by Stephen Smith, U.S. Fish and Wildlife Service, Lake Champlain Fish and Wildlife Resources Office. Results of Sea Lamprey Assessment Surveys Prior to and Following the 2012 Lampricide Treatment of the Missisquoi River, February 3, 2014. Prepared by BJ Allaire, USFW Lake Champlain Fish and Wildlife Resources Office. State of Vermont Environmental Court Assurance of Discontinuance dated May 10, 2007. State of Vermont Environmental Court Assurance of Discontinuance February 16, 2007. State of Vermont 2006 List of Priority Surface Waters Outside the Scope of Clean Water Act Section 303(d). Part B. Impaired Surface Waters – No Total Maximum Daily Load Determination Required. State of Vermont Environmental Court Stipulated Emergency Order filed February 16, 2005.
Summary of 2009 Biological and Chemical Assessments within Burgess Branch, Hutchins Brook, Dark Branch and Gihon watersheds in Lowell and Eden Vermont. Memo to John Schmeltzer and Linda Elliott of DEC Waste Management from Richard Levey, of DEC Watershed Management Division, April 14, 2010. Tyler Branch Watershed Phase 2 Stream Geomorphic Assessment, June 2, 2009. Prepared by Redstart Consulting for Northwest Regional Planning Commission and Vermont Agency of Natural Resources, Department of Environmental Conservation.
40
Upper Missisquoi River Corridor Plan, Missisquoi River Watershed, Orleans County, Vermont. September 30, 2011. Prepared by: Arrowwood Environmental for Missisquoi River Basin Association and Vermont River Management Program.
Use Attainment for Streams Affected By Snowmaking Water Withdrawals in Vermont, David Bottamini for Vermont ANR DEC Water Quality Division, May 1996.
Vermont DEC Waste Management Division Haz Material Section - info on Jay Peak Maintenance Garage site and sampling (2004).
Vermont DEC Watershed Management Division - field notes, reports, maps, and nutrient sampling results.
Vermont DEC Watershed Management Division BASS - biological monitoring data and analysis up through 2014.
Water Quality Monitoring Plan 2013 Performance Report Jay Peak Resort, Jay, Vermont, June 9, 2014. Prepared by Vanasse Hangen Brustlin, Inc. (VHB), North Ferrisburgh, VT.
Water Quality Monitoring Plan 2011 Performance Report Jay Peak Resort, Jay, Vermont, July 15, 2012. Prepared by Vanasse Hangen Brustlin, Inc. North Ferrisburgh, Vt.
Water Quality Monitoring Plan 2010 Performance Report Jay Peak Resort, Jay, Vermont, June 30, 2011. Prepared by Vanasse Hangen Brustlin, Inc., North Ferrisburgh, Vt.
Websites
Vermont Asbestos Group mine information: www.anr.state.vt.us/dec/wastediv/sms/VAG.htm
http://www.epa.gov/region1/removal-sites/VAGMineSite.html
Lake Champlain tributary monitoring sites: https://anrweb.vermont.gov/dec/_dec/LongTermMonitoringTributary.aspx
http://dec.vermont.gov/watershed/lakes-ponds/monitor/lake-champlain
1
AAppppeennddiixx 11
History of Impacts to Jay Branch & tributaries
The impairment of a segment of Jay Branch and Jay Branch Tributary 9 began with Jay Peak Resort’s failure to obtain stormwater permits for some of its condominium development in 2004, which led to stormwater runoff to Jay Branch tributaries and then got worse with erosion from construction of the golf course. Filling and alterations of a stream and wetlands in the golf course development process then also contributed to the impacts. A brief history of the development issues that have led to the stream and wetland impacts as well as the state and federal attempt to achieve compliance and restoration is given below (more complete outlines are contained in earlier subwatershed reports). Jay Peak Village and golf course development water and wetland issues The following history is taken from a “Stipulated Emergency Order” that was filed in Environmental Court on February 16, 2005 and from the Jay Peak Resort Water Quality Remediation Plan October 6, 2006. On May 11, 2004, the Vermont Agency of Natural Resources Water Quality Division found that Phase l development at Jay Peak Resort had occurred without a stormwater control system as required by its stormwater permit and that Phase II had begun without having its stormwater permit. Observations included that the Phase II tributary had significantly incised and was receiving a lot of sediment. The Agency of Natural Resources issued Jay Peak a Notice of Alleged Violation on May 17, 2004 documenting the needed stormwater and construction permits for the Phase I and Phase 2 development areas. Under the NOAV and a follow-up letter from ANR to JPR dated May 25, 2004, Jay Peak Resort was required to:
obtain coverage under the Stormwater General Permit (GP) 3-9010 for previously permitted stormwater discharges of Phase I 2002 of the Jay Peak Village project (condominiums). (JPR was originally to have constructed and installed stormwater treatment facilities no later than November 15, 2003 and had failed to install these facilities);
obtain coverage under Stormwater GP 3-9015 for new stormwater discharges and coverage under NPDES Construction General Permit 3-9001 for Phase II 2003 of the Jay Peak Village project;
obtain coverage under the Construction General Permit for the rest of the Phase II Jay Peak Village development;
address significant unauthorized cutting of protected stream buffer areas;
stabilize all exposed areas and stop construction until in compliance with all state and federal laws.
Following issuance of the May 17, 2004 NOAV, Jay Peak Resort hired Pioneer Environmental Associates to do a watershed study that delineated watersheds and
2
subwatersheds within the Jay Branch basin; identified and mapped stormwater infrastructure; and did hydrologic modeling among other tasks. Jay Peak was then issued the above mentioned Emergency Order in February 2005 that set deadlines and required schedules and reporting for the construction of the stormwater treatment facilities. Jay Peak Resort began construction of the 18-hole golf course referenced above in 2004. The first nine holes were largely completed by the summer of 2005 and earth disturbance began on the back nine holes that summer. Stream buffers were cut, erosion and stormwater control was inadequate, and many acres of bare soil without proper protection were exposed throughout the summer, which included some large storms. Turbidity results from event sampling showed many instances of turbid discharges. Two turbidity monitoring sites had a number of results over 1000 NTUs in the second half of 2004. In late September 2005, the Jay Branch was running brown after the storms and the Vermont Natural Resources Council brought this situation to the public and to the Agency of Natural Resources. VNRC staff had collected water samples during that time and found high levels of turbidity and phosphorus as would be expected given the silt and sediment coming downstream from the areas of bare soils at the golf course site. From September 24, 2005 through December 2, 2005, Vermont ANR DEC issued five 1272 Orders to address various erosion control and stormwater problems at the site. These are described in a document - Listing of Jay Branch and Tributary #9 on Part B of Vermont’s Proposed 2006 List of Priority Surface Waters - done prior to placing Jay Branch and Tributary 9 on the Part B List of Waters. In late April 2006, Jay Peak was issued three 1272 Orders requiring them to take the necessary steps to bring its work into compliance on the golf course and Jay Village. The April 28, 2006 order required the creation of a Water Quality Remediation Plan for Jay Branch and Tributary 9 to the Jay Branch. As a result of the 1272 orders, the Jay Branch and Tributary 9 sections that are impaired were put onto the Part B List of Priority Surface Waters Outside the Scope of the CWA Section 303(d) versus the 303(d) List of Impaired Surface Waters needing a TMDL. The Jay Branch and Tributary 9 were only listed for sediment impairments. Post WQ Remediation Plans The 2006 Water Quality Remediation Plan was very thorough with much good data, information, modelling, and recommendations for the restoration and the monitoring needed to address the water quality and aquatic habitat damage that the golf course development and lack of condominium stormwater controls had caused to Tributary 9 and Jay Branch. The plan components included watershed and subwatershed delineations; a watershed-wide hydrological model; a stream survey and reconnaissance followed by Phase 2 stream geomorphic assessment results from Tributary 9 and Jay Branch; and determinations of sediment loads for existing conditions. Information that came out of the stream assessments during many site visits included substrate embeddedness, land use descriptions, stream channel type descriptions, riparian vegetation type and condition.
3
In the 2006 Remediation Plan, there are also summary reports from hydrologic modeling for 1-, 2-, 10-, and 100- year rainfall events (24 hour duration); and a detailed list of problem areas with potential implementation measures. An Assurance of Discontinuance between ANR and JPR was filed with the Environmental Court in February 2007 to address five violations at the resort. Another Assurance of Discontinuance between ANR and JPR was filed with the Environmental Court in May 2007 to address at least four violations. In 2009, the Water Quality Remediation Plan was updated and prepared based on 2003 through 2008 water quality monitoring and assessment information. A sediment loading analysis was included in the plan which compares loading to various subwatersheds under pre-development conditions, existing conditions, and “remediation stage 1” conditions. The remediation scenario showed improvements (i.e. less) in sediment loading when compared to existing conditions, however even with some remediation improvements, the sediment loading from all the Jay Peak development is still almost double what the loading was pre-development. The 2009 Remediation plan also includes: the results of hydrological modelling for two scenarios (there is no pre-development scenario); identification of three major iron seeps; discussion of the riparian condition; descriptions of the instream channel process from geomorphic assessment done in 2006, 2007, and 2008; presentation of 2004 through 2008 biomonitoring results; discussion of riparian zone/stream buffer issues; and itemization of remediation projects and strategies. In September 2010, the U.S. EPA ordered Jay Peak to restore the stream and wetlands that they had damaged when constructing the golf course and filling the stream and wetland. The case was brought to EPA by the Army Corps of Engineers in the spring of 2008. The resort agreed to the terms of the order and completed the work required before the October 2010 deadline. However during a July 2014 site visit, there was active work re-doing a section of stabilization on one of the streams that were part of the EPA and Corps required restoration. Jay Peak Resort was issued another 1272 order on March 21, 2014 “in the matter of Jay Peak Resort and Water Quality Related to Jay Branch, Jay Branch Tributary #9, and South Mountain Branch Tributary #3.” The order required these items of the resort:
Adapt and update the existing WQRP;
Identify and rank all potential sources of sediment and the BMPs needed to reduce the sources in the plan;
Create a systematic number and identification system for each identified source so that progress can be tracked;
Create a schedule for the implementation of the BMPs and other remediation measures to be achieved with a two year period.
Following this order, ANR issued JPR an Individual Construction Permit (5467-INDC.4) and two operational stormwater permits (5467-9015.10A and 3758-9015A) on April 29,
4
2014. These permits were appealed by VNRC on May 29, 2014 because the permits applied to development in the impaired watersheds of Tributary 9 and Jay Branch. Jay Peak Resort meanwhile had submitted a draft Water Quality Remediation Plan on May 21, 2014 as required by the 1272 order. After further revision, ANR approved the WQRP on February 2, 2015. The appeal of the stormwater permits led to several months of negotiation between Jay Peak Resort, the Agency of Natural Resources, the Vermont Natural Resources Council, and the Vermont Law School’s Environment and Natural Resources Law Clinic resulting in a Settlement Agreement dated February 12, 2015. The Settlement Agreement has set deadlines for the remediations of the impaired waters. There are also interim biocriteria to be met between 2014 and 2018, which is the final attainment year. There is also a requirement for offsets and a construction stoppage if goals are not met or there is backsliding in the health of the streams. For compliance year 2014, two of the four biomonitoring sites that need to meet interim targets did not meet all the targets per the flowchart in Appendix F of the Settlement Agreement. In addition, a site that did not have targets, slipped from meeting the water quality standards into non-compliance. Jay Peak Resort is looking to find additional small scale sediment reduction BMPs beyond the work required in the WQRP because of the missed targets.
5
AAppppeennddiixx 22
Water Quality Monitoring results for 2013 and 2014
Water Quality Monitoring Results from 2013 Vanasse Hangen Brustlin Inc. (VHB) prepared a Water Quality Monitoring Plan 2013 Performance Report dated June 9, 2014. This report includes:
an analysis of the water quality monitoring activities (baseflow, event-based, snowmelt) from March 2013 to September 2013 dates on Jay Branch and several tributaries and on South Mountain Branch (Trib 7);
an evaluation of substrate conditions at various sites; and
presentation of the macroinvertebrate sampling results. A summary of which sites were sampled and when is given on page 5 of the VHB report. Key water chemistry results Baseflow and event-flow water chemistry samples were taken at 10 monitoring stations and winter melt samples were collected at seven stations. All the results for 2013 and historical monitoring results are in Appendices 1, 2, and 3 of the Water Quality Monitoring Plan 2013 Performance Report. Baseflow monitoring
Phase I tributary had a conductivity value of 276 (the 2nd highest since monitoring began) and a D.O. value of 76.3 on 9/5/2013.
Phase II tributary had conductivity values of 323 and 293 on 8/22/2013 and on 9/5/2013 respectively. The D.O. value on 8/22 was 78%.
Tributary 9 had conductivity values of 723 on 8/22/2013 and 567 on 9/5/2013 much higher than the mean of 295 over 21 samples since 2004. Tributary 9 also had chloride values of 160 and 120 which were several times almost all of the earlier samples taken since 2004.
The reference site values (WQM 4-1) for conductivity in 2013 were 51 on 8/22/2013 and 45 on 9/5/2013. D.O. reference values were 85% and 84.7% and chloride was less than 2.5 mg/liter. Event-flow monitoring:
Tributary 9 had conductivity values during event flows on 9/12/2013 and 9/22/2013 of 192 and 215 respectively. Turbidity was measured at 38.5NTUs on the 9/12 date.
Reference site values during event monitoring got conductivity at 28 on 9/12 and 26 on 9/22. The turbidity was 0.8 and 0.4 respectively. Snow melt monitoring:
Phase I tributary had conductivity of 263 umho/cm, D.O. of 67%, and turbidity of 77 NTUs on the 3/12/2013 winter water chemistry sampling date.
Phase II tributary had conductivity of 342 and turbidity of 120 NTUs on that same 3/12/2013 date (no D.O. was measured).
Tributary 9 had a conductivity value of 530 on 3/12/2013.
6
Jay Branch at rm 8.3 (WQM 4-3) had a conductivity value of 407 on the 3/12/2013 date.
Reference site values on 3/12/2013 were 30 for conductivity and less than zero for turbidity. Water Quality Monitoring Results from 2014 Water quality monitoring, biomonitoring, and substrate monitoring all occurred on the impaired and some reference site streams in the Jay Branch watershed in 2014. Winter melt chemistry monitoring was done in April 2014, base flow and event flow water chemistry was done in August and September 2014, biomonitoring and substrate sampling were done in October 2014. A Water Quality Monitoring Plan 2014 Performance Report has been done by VHB with the results of this monitoring and dated February 18, 2015. Key water chemistry results Some of the water chemistry at Jay Branch rm 8.3 included August and September baseflow conductivity of 127 and 220 umho/cm; D.O. of 85.0 and 76.5%; and chloride of 16.0 and 16.0 mg/L respectively. These values were elevated (in the case of conductivity and chlorides) from past years. The same was the case with the event chemistry from this site also collected on one August and one September date. Event conductivity was 135 and 220 umho/cm; and chlorides were 19.0 and 15.0 mg/L - conductivity and chloride numbers are substantially higher than in the past. D.O. was 82.9 and 80.0%.
Jay Branch rm 7.3 baseflow chemistry from this site also showed elevated conductivity (elevated from previous years and from the reference site) but not to the degree of rm 8.3. Tributary 9 base flow chemistry results had high conductivity readings - 479 and 636 umho/cm. Chlorides were 100 and 150 mg/L. These levels of chloride are now at or above a proposed stressed level of concern and chloride management should be implemented to prevent levels from reaching ALS criteria of 230mg/l. Dissolved oxygen was 79.5 and 72.5%. The event based chemistry results for Tributary 9 were 463 and 583 umho/cm for conductivity; and 92.0 and 130 for chlorides. Dissolved oxygen was 79.1 and 69.5%. Tributary 3 to South Mountain Branch (Tributary 7) conductivities during baseflow conditions were measured at 181 and 186 umho/cm; chlorides at 31 and 33 mg/L. Dissolved oxygen was 81 and 79.8%. Event water chemistry sampling found conductivity at 191 and 182 umho/cm; chlorides at 31 and 32 mg/L; and D.O percentages at 56.5 and 79.5. At the reference site of Tributary 13 to Jay Branch at rm 0.2, the dissolved oxygen in 2014 was 72.2% and 78.1% both lower than the readings of earlier years – this was during event chemistry measurements in mid August and mid September. Dissolved oxygen at the reference site in April during winter water chemistry sampling (snow melt) was 96.5% and 97.9%.

7
General
Alkalinity is generally low (<30) at most locations, which reflects bedrock. The highest values were on Phase I tributary (to Tributary 9) (>60mg/l) which is likely a response from using calcium based rock in ditches, culvert crossings, and stormwater structures. The higher turbidity hits found during the supplemental turbidity monitoring that is shown in Appendix 4 were on Phase l and Phase ll tributaries and Tributary 9. The spikes in turbidity ranged from around 30 to 45 NTUs.