Embed Size (px)
Citation preview
Missouri civic health index

NatioNal CoNfereNCe oN CitizeNshipNCoC is a dynamic, non-partisan nonprofit working at the forefront of our nation’s civic life. We continuously explore what shapes today’s citizenry, define the evolving role of the individual in our democracy, and uncover ways to motivate greater participation. Through our events, research and reports, NCoC expands our nation’s contemporary understanding of what it means to be a citizen. We seek new ideas and approaches for creating greater civic health and vitality throughout the United States.
Missouri state uNiversityMissouri State University is a public, comprehensive university system with a mission in public affairs. Our purpose is to develop fully educated persons with a focus on ethical leadership, cultural competence and community engagement.
University of MissoUri Kansas CityThe University of Missouri Kansas City is an urban research university characterized by its active engagement with its city and region. UMKC’s civic engagement and service-learning programs are part of the Institute for Human Development, an applied research and training center for human services. Both programs exemplify UMKC’s goals of advancing urban engagement, through programming, research and the support of individual development.
uNiversity of Missouri-st. louis & the publiC poliCy researCh CeNterThe Public Policy Research Center (PPRC) is a research institute based at the University of Missouri-St. Louis. It engages in a variety of research-related activities, including evaluation and applied research projects. The PPRC has a 40-year history of providing public officials and program managers with quality applied research. It strives to conduct evaluations and all studies completed for clients in a way that will enhance their value in decision-making and program improvement.
parK uNiversity & the hauptMaNN sChool of publiC affairsFounded in 1875 in Parkville, Mo., Park University has developed into a comprehensive, independent institution that is a national leader in higher education. Park serves more than 20,900 diverse students, both undergraduate and graduate, annually at 40 campus centers in 21 states and online. Through the Hauptmann School of Public Affairs’ (HSPA) Center for Leadership and academic programs, Bachelor of Public Administration (BPA), Master of Public Affairs (MPA) and Master of Healthcare Administration (MHA), HSPA serves the common good by graduating leaders who exercise authority responsibly, make ethical decisions, act with moral courage, and advance human dignity world-wide.
saiNt louis uNiversity & the CeNter for serviCe aNd CoMMuNity eNgageMeNtSaint Louis University (SLU) is a Catholic, Jesuit institution that values academic excellence, life-changing research, compassionate health care, and a strong commitment to faith and service. With campuses in St. Louis and Madrid, SLU serves more than 13,500 undergraduate, graduate and professional students. The Center for Service and Community Engagement creates a coordinated interface between the University and the communities that surround it,seeking to prepare participants to be effective servant leaders and agents for social change, as well as to foster the creation of a just and equitable society.
WashiNgtoN uNiversityWashington University in St. Louis is a medium-sized, independent university located in the nation’s center. The University’s Gephardt Institute for Public Service promotes lifelong civic engagement and sustained community impact through service initiatives. Washington University is counted among the world’s leaders in teaching, research, patient care and service to society.
This report was produced in 2013 and released in 2014.
about the partners
table of contentsExecutive Summary .................................................................................................................................................................................4Introduction ....................................................................................................................................................................................................5Social Capital and Missouri State Rankings ................................................................................................................. 11Non-Political Civic Engagement and Missouri State Rankings .................................................................... 16The Importance of Volunteering ............................................................................................................................................... 18Electoral and Non-Electoral Political Participation and Missouri State Rankings ..................... 20Confidence in Institutions and Missouri State Rankings ................................................................................... 23Summary........................................................................................................................................................................................................ 25Conclusion and Recommendations ....................................................................................................................................... 26Technical Notes ....................................................................................................................................................................................... 28A Word About Recommendations ........................................................................................................................................... 28Endnotes........................................................................................................................................................................................................ 29Civic Health Index and Partners ............................................................................................................................................... 30
Acknowledgments: Special thanks to the Office of the Associate Provost for the Student Development and Public Affairs at Missouri State University, Missouri Campus Compact, United Way of Greater Saint Louis, Points of Light Foundation, and the Center for Information & Research on Civic Learning and Engagement (CIRCLE) in the Jonathan M. Tisch College of Citizenship and Public Service at Tufts University.
Leah Sweetman, Ph.D., Assistant Director for Service Learning, Center for Service and Community Engagement, Saint Louis University
Robert Cropf, Ph.D., Professor, Department of Political Science, Saint Louis University
Amanda Moore McBride, Ph.D., Associate Professor and Associate Dean for Social Work, Brown School, Director, Gephardt Institute for Public Service, Research Director, Center for Social Development, Washington University in Saint Louis
Robin Hattori, Assistant Director, Gephardt Institute for Public Service, Washington University in Saint Louis
Alexis N. Petri, Ed.D., Director of Interdisciplinary Training, UMKC Institute for Human Development
Julie Warm, Ph.D., Co-director of Service-Learning, UMKC Institute for Human Development
Mark Tranel, Ph.D., Director, Public Policy Research Center, Research Associate Professor, Public Policy Administration, University of Missouri-Saint Louis
Eric Click, Ph.D., Assistant Professor of Public Administration Program, Park University
Authors: Mike Stout, Ph.D., Department of Sociology and Anthropology, Missouri State University
John B. Harms, Ph.D., Department of Sociology and Anthropology, Missouri State University
Tim Knapp, Ph.D., Department of Sociology and Anthropology, Missouri State University
Bryan Sokol, Ph.D., Associate Professor of Psychology, Director, Center for Service and Community Engagement, Saint Louis University

4 Missouri c i v ic health inde x
Missourians rank 15th and 18th in voter registration and voter turnout for local elections.
Photo: Gephardt Institute for Public Service
executive suMMaryUsing data from the US Census Bureau’s annual Current Population Survey, this report examines the civic health of the state of Missouri, as well as its two largest metropolitan areas, Kansas City and St. Louis. Civic health is measured using four broad categories, each of which contains multiple indicators. The four areas are: social capital; non-political civic participation; electoral and non-electoral political participation; and confidence in institu-tions. Below is a brief overview of some of the most significant findings for the state for each category in 2012. More detailed information on the trends for each category for the state, Kansas City, and St. Louis are discussed within the report.
Social Capital
� Missouri was ranked in the top half of the 50 states and the District of Columbia on all but one of the social capital indicators (sitting down to dinner with other members of one’s household).
� Missourians had higher rates of membership in four of five types of groups compared with people across the nation.
� A higher proportion of Missourians were officers or committee members in groups compared with Americans in general.
� Missourians generally were more likely to be trusting of their neighbors, to talk to their neighbors more frequently, and to do favors for their neighbors than are people in the nation as a whole.
Non-Political Civic Participation
� Missourians were more likely to volunteer than average Americans.
� Missourians who volunteered were much more likely than Missourians who did not volunteer to participate in other civic actions.
� About one in ten Missourians worked with neighbors to fix a community problem, which was higher than the national average.
� More residents donated to a charity or religious organization than the national average.
� Missouri residents were less likely than people across the nation to attend public meetings in which community affairs were discussed.
Electoral and Non-Electoral Political Participation
� Missouri ranked 15th and 29th in 2010 voter registration and turnout, and was ranked 18th for frequency of local voting.
� Missouri was ranked in the bottom half of states when it came to non-electoral political activities, such as buying/boycotting products or services for political reasons, contact-ing public officials, discussing politics with family and friends, and expressing political opinions via the Internet.
Confidence in Institutions
� Slightly higher proportions of Missourians than Americans in general expressed confi-dence in corporations and the media.
� There was no difference between Missouri and the national average in rates of confidence in public schools.

5
introduction
The National Conference on Citizenship was founded in 1946 to sustain the spirit of cooperation and civic commitment that blossomed during World War II. In 1953, Congress recognized the importance of efforts to maintain and build the nation’s civic infrastructure by granting the NCoC a formal charter and charging the organization with the respon-sibilities of monitoring the well-being of civic life and developing ways of promoting effective citizenship. During the 1950s, both presidents Truman and Eisenhower were involved with the development of the NCoC. Through its long history, NCoC has worked with other organi-zations to encourage the development of informed, engaged citizens and to increase civic participation. Among other events and programs, NCoC has held an annual conference to showcase private and public initiatives to strengthen citizenship.
In 2006, NCoC launched a landmark initiative to create a national index measuring the state of America’s civic health. For decades, various organizations had published indices of leading economic indicators. However, no such measure existed to gauge the condition of the nation’s civic sphere. NCoC began convening a working group of partners at the Center for Information and Research on Civic Learning and Engagement (CIRCLE) at Tufts. The group included partici-pants in Harvard’s Saguaro Seminar on Civic Engagement in America, and other distinguished scholars and private sector leaders. The working group crafted an index of indicators of social capital and social and political participation to measure the level of civic engagement and the health of our nation’s democracy. In 2009, NCoC was incorporated into the Edward M. Kennedy Serve America Act, and directed to expand the civic health assessment in partner-ship with the Corporation for National and Community Service and the U.S. Census Bureau. This collaboration has provided the largest civic data set in the country and has allowed NCoC to work in collaboration with partners in more than 30 states and cities across the country.
The 2013 Missouri Civic Health Initiative
In 2010, Missouri was one of 13 states and four cities that participated in the 2010 Civic Health Index. The 2010 Missouri Civic Health Index was the first statewide examination of the civic health of the state. The state’s involvement was centered in the Sociology Program at Missouri State University (MSU) in Springfield. MSU is the state’s higher education public affairs institution, and the university sponsors a wide range of programs to promote civic engagement among its students, staff, and faculty.
For the 2013 Missouri Civic Health Index, MSU and NCoC have partnered with six organiza-tions to produce the follow-up to the 2010 report. The seven state-wide partners for the 2013 Missouri Civic Health Assessment are: Missouri State University; Missouri Campus Compact; Saint Louis University; University of Missouri-Saint Louis Public Policy Research Center (PPRC); Park University-Hauptmann School of Public Affairs (HSPA); University of Mis-souri-Kansas City Service Learning Program; and the Gephardt Institute for Public Service, Washington University in Saint Louis.
Missouri’s participation in the national assessment is one of a number of initiatives that leaders have established to enhance civic participation among state residents. Collabora-tion among state organizations helps to build a network of scholars, policy makers, and community leaders who are interested in revitalizing the civic health of the state of Missouri through community and economic development.
Engagement Opportunity Highlights
FOCUS St. LouisPage 11
The Nine Network of Public MediaPage 12
Midtown Plaza PlanPage 16
Youth Madam PresidentPage 21
Cultural Leadership (St. Louis)Page 22
Kids Voting Missouri Page 26

6 Missouri c i v ic health inde x
Civil Society and Civic Health
Much of the thinking and discourse about the health of our society is framed in terms of activities in the private and public sectors. We regularly hear about the market’s workings and the govern-ment’s actions, and we rightly debate what the proper relationship should be between the two sectors. Unfortunately, this obscures the recognition of civil society and what goes on in our com-munities, and how this impacts the functioning of the state1 and the market2. This report analyzes and describes various indicators of civic life in Missouri. It is our hope the findings presented in this report will bring the workings of civil society into public discourse. This will allow policy makers and civic leaders in communities across the “Show-Me State” to strengthen civic engagement by providing citizens with opportunities to participate in the process of identifying and addressing public issues. We also hope this report will be used to guide statewide discussions on planning for community and economic development, so that communities across the state will be healthier, safer, more equitable, and better equipped to cope with future disasters (natural and manmade) and economic downturns.
Although the institutional structures3 of the market and the state are recognized and understood reasonably well by most Americans, civil society remains obscure. Few Americans know what civil society is, how it works, and what goods it provides. As a result, another goal of this report is to allow civic leaders and policy makers across the state of Missouri to use this information to inform public policy in ways that promote civic health.
What is Civil Society?
Civil society consists of the families, households, religious groups, voluntary associations, phil-anthropic organizations, and clubs that constitute a community. It is important to note that it is comprised of a complex mosaic of individual communities that each have their own unique characteristics, and that are woven into the fabric of society through their relations with the state and the market. Civil society is important because it is structured in a way that provides op-portunities for community problem-solving the state and the market cannot provide.4 The state and the market are structured differently than the mosaic of communities that make up civil society. Whereas markets operate with private capital5 and states operate with public capital6, civil society operates with social capital.7
What is Social Capital?
Social capital refers to networks of social relationships characterized by norms of trust and reci-procity.8 The central premise of social capital is that social networks have value because they can be structured in ways that provide people with access to opportunities and other vital resources. Like physical capital (e.g., technologies and tools) and human capital (e.g., education, talent, and skills), social capital enhances the productivity of both individuals and groups. Unlike physical capital, however, social capital doesn’t wear-out or depreciate with use – in fact it appreciates as it is used.9 Also unlike physical capital, social capital is non-exclusive and can be used by many people at once. In this sense, social capital has many attributes of a “public good.”
the diMeNsioNs of soCial CapitalSocial capital has two dimensions: a structural dimension and an attitudinal dimension. The struc-tural dimension involves how individuals interact with each other and are attached to different groups and organizations.10 In this report the structural dimension of social capital is measured by the frequency of informal interaction between people and the formal connections that people have to voluntary organizations.
The attitudinal dimension refers to the feelings of trust and reciprocity people have with others.11 This dimension of social capital is important because it can influence the ways resources are allocated through social networks for addressing community problems. In this report, trust is measured as the level of trust respondents have in their neighbors, and reciprocity is measured by the frequency that respondents exchange favors with their neighbors.
Civil society consists of the families, households, religious groups, voluntary associations, philanthropic organizations, and clubs that constitute a community.
Photo: FOCUS St. Louis

7
Broad, inclusive participation is central to democratic processes, and the extent to which it varies within and across communities has implications for how effectively citizens are able to address pressing public issues.
Network structures connect people to community resources and the levels of trust and reci-procity that characterize the network determine the nature and the extent of the flow of resources through the network.12 The resources accessible through such networks are ben-eficial to individual members of the network, and they often produce spillover effects that are beneficial to the broader community.13
One of the major reasons to conduct an assessment of a community’s civic health is to examine how the structure of social networks provides access to resources that are useful for addressing community problems. In this way, social capital represents an important indicator of civic health. Decades of prior research has shown that social capital is strongly related to civic engagement, and that it is an important indicator of civic health.
What is Civic Engagement?
The term “civic engagement” describes diverse activities and generally includes activities that build on the collective resources, skills, expertise, and knowledge of citizens to improve the quality of life in communities.14 Civic engagement consists of attitudes that develop and behaviors that take place within communities. Civic engagement has a political dimension (e.g., voting, pro-testing, boycotting, writing letters to elected officials), and a non-political dimension (e.g., volun-teering, working on a community-based project, working with neighbors to fix a problem). Broad, inclusive participation is central to democratic processes, and the extent to which it varies within and across communities has implications for how effectively citizens are able to address pressing public issues. An understanding of the dynamics of social capital and civic engagement can inform policies and programs that facilitate civic engagement, strengthen participatory democracy, and improve civic health.
the politiCal aNd NoN-politiCal diMeNsioNs of CiviC eNgageMeNtIn this report we conceptualize civic engagement as a set of attitudes and behaviors related to par-ticipation in political and non-political activity. We measure the political dimension of civic engage-ment using survey questions related to voter registration, voting in local and national elections, contacting public officials, buying or boycotting products for political reasons, discussing politics with family and friends, and expressing political opinions via the Internet. We measure the non-political dimension of civic engagement using questions related to volunteering, attending public meetings, working with neighbors, and donating to charity.
Confidence in Institutions
In addition to the questions measuring social capital and civic engagement, this year’s report contains new information on confidence in corporations, the media, and public schools. Con-fidence in institutions is an indicator of civic health that is distinct from social capital and civic engagement. It provides valuable information on citizen’s attitudes regarding the ef-fectiveness of some of the institutions charged with solving economic and social problems, informing citizens, and providing opportunity for social mobility.15
Data
This report features statistics on key trends in social capital and civic engagement for the state of Missouri, the Kansas City metro area16, and the St. Louis metro area.17 These sta-tistics were produced and provided to us through a partnership between the Corporation for National and Community Service (CNCS), the National Conference on Citizenship (NCoC), and the U.S. Census Bureau. The Edward M. Kennedy Serve America Act, signed into law in April 2009, authorized these organizations to produce the data for this report with the assistance of the Bureau of Labor Statistics. The data were organized by the Center for Information and Research on Civic Learning and Engagement (CIRCLE) at Tufts University.
8 Missouri c i v ic health inde x
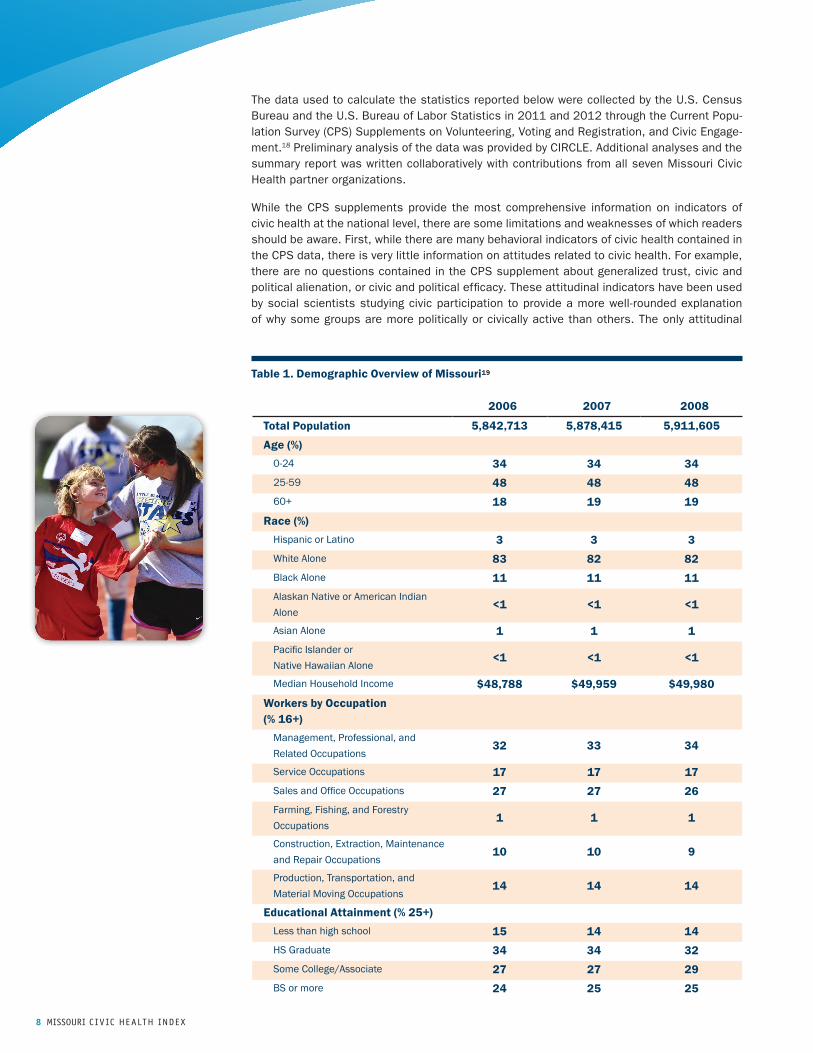
The data used to calculate the statistics reported below were collected by the U.S. Census Bureau and the U.S. Bureau of Labor Statistics in 2011 and 2012 through the Current Popu-lation Survey (CPS) Supplements on Volunteering, Voting and Registration, and Civic Engage-ment.18 Preliminary analysis of the data was provided by CIRCLE. Additional analyses and the summary report was written collaboratively with contributions from all seven Missouri Civic Health partner organizations.
While the CPS supplements provide the most comprehensive information on indicators of civic health at the national level, there are some limitations and weaknesses of which readers should be aware. First, while there are many behavioral indicators of civic health contained in the CPS data, there is very little information on attitudes related to civic health. For example, there are no questions contained in the CPS supplement about generalized trust, civic and political alienation, or civic and political efficacy. These attitudinal indicators have been used by social scientists studying civic participation to provide a more well-rounded explanation of why some groups are more politically or civically active than others. The only attitudinal
2006 2007 2008
Total Population 5,842,713 5,878,415 5,911,605
Age (%)0-24 34 34 3425-59 48 48 4860+ 18 19 19
Race (%)Hispanic or Latino 3 3 3White Alone 83 82 82Black Alone 11 11 11Alaskan Native or American Indian Alone
<1 <1 <1
Asian Alone 1 1 1Pacific Islander or Native Hawaiian Alone
<1 <1 <1
Median Household Income $48,788 $49,959 $49,980
Workers by Occupation (% 16+)
Management, Professional, and Related Occupations
32 33 34
Service Occupations 17 17 17Sales and Office Occupations 27 27 26Farming, Fishing, and Forestry Occupations
1 1 1
Construction, Extraction, Maintenance and Repair Occupations
10 10 9
Production, Transportation, and Material Moving Occupations
14 14 14
Educational Attainment (% 25+)Less than high school 15 14 14HS Graduate 34 34 32Some College/Associate 27 27 29BS or more 24 25 25
Table 1. Demographic Overview of Missouri19

9
2009 2010 2011 2012
Total Population 5,987,580 5,996,231 6,010,688 6,021,988
Age (%)0-24 34 34 33 3325-59 47 47 47 4660+ 19 20 20 21
Race (%)Hispanic or Latino 3 4 4 4White Alone 82 81 81 81Black Alone 11 12 11 11Alaskan Native or American Indian Alone
<1 <1 <1 <1
Asian Alone 1 2 2 2Pacific Islander or Native Hawaiian Alone
<1 <1 <1 <1
Median Household Income $48,417 $46,653 $46,192 $45,321
Workers by Occupation (% 16+)
Management, Professional, and Related Occupations
64 34 35 35
Service Occupations 10 18 19 18Sales and Office Occupations 22 26 25 25Farming, Fishing, and Forestry Occupations
5 1 1 1
Construction, Extraction, Maintenance and Repair Occupations
14 8 7 8
Production, Transportation, and Material Moving Occupations
8 13 13 14
Educational Attainment (% 25+)Less than high school 13 13 12 12HS Graduate 32 32 31 31Some College/Associate 30 29 30 30BS or more 25 26 26 26
Table 1. Demographic Overview of Missouri (continued)19
indicators that we were able to examine in this report were confidence in several institutions, including public schools, corporations, and the media. The only indicator of trust we were able to examine was trust in neighbors. Additionally, while we were able to examine year-by-year trends at the state level for the indicators of civic health, we had to use three-year pooled averages for the metropolitan areas due to small sample size. This means that we were unable to report statistics at the metro level for the new indicators that were included in the 2011 and 2012 CPS supplements. In sections of the report where we compare the state to the metro areas, we use the three-year pooled averages for all three so that the statistics are comparable.
With these limitations in mind, the remainder of the report focuses on summarizing the de-mographic characteristics of the state of Missouri and the results of the 2011 and 2012 CPS civic health index for the state of Missouri, Kansas City, and St. Louis. In most instances, statistics are rounded to the nearest whole number.
Photo: Saint Louis University

10 Missouri c i v ic health inde x
Between 2006 and 2012, Missouri saw an increase of 179,275 people. Over that time the state’s population has also been getting older and more racially diverse, with the increase in racial diversity primarily attributable to the growth of the Latino/Hispanic population. Median household income in the state has been declining over the past seven years. In 2006 median household income was $48,788 and in 2012 it was $45,321, a decline of $3,467. The initial decline in incomes began following the 2007-2008 recession, and continued falling through-out the subsequent “recovery” from 2009-2012. According to the U.S. Census American Community Survey, the median household income in the United States was $51,371 in 2012, so Missouri had a median household income that was $6,050 lower than the national average (a relative difference of 11.78%). The state has seen declines in the percentage of residents working in construction occupations, and has seen an increase in the percentage working in service occupations (e.g., retail workers, restaurant workers, and hotel and entertainment workers).
Review of Findings from 2010 Missouri Civic Health Assessment
The 2010 Missouri Civic Health Index20 included three measures of social participation (vol-unteering, working with neighbors to solve local problems, and attending a public meeting), and the state had above-average participation rates for two of the three measures. Among residents of the 50 states and the District of Columbia, Missourians ranked 19th in working with neighbors to solve community problems: 10.3% of state residents had worked with others to address local problems in the previous year, compared with the national average of 8.8%. Missouri ranked 24th in the nation for volunteering among residents ages 16 and older: 28.8% of Missourians had volunteered during 2009, which was above the national average volunteer rate of 26.8%. On the third measure, only 8.7% of Missourians had attended a public meeting in the past year, which was below the national average rate of 9.9%.
While the rates of people working with neighbors had been relatively stable since 2005, there were signs of waning social participation through volunteering and attending public meetings. Missouri volunteer rates peaked at 34.3% in 2004, which was higher than the 2009 rate of 28.8%. And, while Missourians had an above-average rate of 11.6% of people who had attended a public meeting in 2006, the 8.7% of state residents who had done so in 2009 fell below the national average.
The 2010 Missouri Civic Health Index also included three indicators of political participation (voter registration, voter turnout, and involvement in non-electoral political activities), and the state ranked above the national average for two of the three measures. The state’s voter registration rate of 74.5% was 15th highest and above the national registration rate of 71.0%. And 65.8% of Missouri’s eligible voters had gone to the polls in the 2008 election, which was the 23rd highest voting rate that year and above the national average of 63.6%. However, Missouri ranked 30th among the states in the proportion of people who had engaged in one of five non-electoral activities, such as contacting a government official or showing support for a particular candidate through a campaign sign in their yard: 27.1% of state residents had engaged in a non-electoral activity.
While Missourians were above average on a majority of indicators for community and political participation, trends in civic engagement varied significantly by education and income levels. College graduates and those with incomes of $75,000 or more had much higher rates of engagement through volunteering, working with neighbors to fix a local problem, attending a community meeting, and voting than those without college degrees and with lower incomes.
While there was significant variation by education and income, looking at education, employ-ment and income patterns for Missouri relative to the nation, the authors of the 2010 state report noted that “Missouri has a stronger ‘blue-collar’ base for civic engagement than is typical of the nation as a whole”.21 However, they also argued that employment declines in manufacturing, construction, transportation, and utilities might be eroding that blue-collar base for civic participation. They also noted that state support for higher education was dwindling, which was contributing to fast-rising tuition and fees at public four-year universities.
Between 2006 and 2012, Missouri saw an increase of 179,275 people. Over that time the state’s population has also been getting older and more racially diverse.
Photo: FOCUS St. Louis

11
If these trends continue, the authors maintained that “working- and middle-class families will struggle more than they have in decades to afford college education.” They stated, “if nothing is done, this may weaken civic engagement in Missouri in the long run.”22
The 2010 report concluded Missouri has established a political and organizational infrastruc-ture to further enhance civic engagement, and that state-wide initiatives provide opportuni-ties for improving the civic health of the “Show-Me State.” However, continuing declines in the state’s blue-collar middle class and the erosion of public funding for higher education pose significant threats to the state’s civic health.
social capital and Missouri state rankingsThe survey measured three dimensions of people’s connectedness with others: (1) Organiza-tional Connections: membership and leadership in groups; (1) Connections with Friends and Family: informal social interactions with household members and friends, and (3) Neighbor-hood Social Capital: interactions with and trust in their neighbors.
As the table above indicates, Missouri was ranked in the top half of the 50 states and the District of Columbia on all but one of the social capital indicators. While the state is high in interaction with family, friends, and neighbors, it is noticeably low compared to others for sitting down to dinner as a household. The actual levels of the indicators of social capital are presented in Table 3.
Rank
See or hear from family or friends 4th
Talk with neighbors 7th
Do or receive favors for neighbors 13th
Group officer or committee member 16th
Group membership 19th
Trust people in neighborhood 19th
Dinner with household members 42nd
Table 2. State Ranking on Social Capital Indicators
Table 3. Three-year Pooled Estimates (2009-2011)23 of Indicators of Social Capital
Organizational Connections USA MO KC STLBelong to no groups 64% 62% 64% 62%Belong to one group 22% 22% 19% 22%Belong to two or more groups 14% 16% 17% 16%Group officer/committee member 10% 11% 11% 10%
Connections with Friends & Family USA MO KC STLSee/hear from friends/family frequently 79% 85% 86% 82%Dinner with household members frequently 90% 88% 89% 89%
Neighborhood Social Capital USA MO KC STLTalk with neighbors frequently 44% 48% 45% 44%Do/receive favors for neighbors frequently 14% 16% 13% 15%Trust most/all people in neighborhood 57% 63% ** **
FOCUS St. Louis www.focus-stl.org
.FOCUS St. Louis is a regional nonprofit that helps create a thriving, cooperative region by engaging citizens to participate in active leadership roles and to influence positive community change.
FOCUS’ leadership programs include: Leadership St. Louis®, one of the most highly-respected year-long leadership development programs in the nation for established leaders; Youth Leadership St. Louis, for high school juniors; Emerging Leaders for young professionals; Coro™ Fellows Program in Public Affairs, a year-long program in public affairs; Coro™ Women In Leadership, for women passionate about the community; and Experience St. Louis, for executives new to St. Louis.
FOCUS also supports citizen engagement and community policy initiatives. FOCUS helped engage over 1,500 citizens in public meetings for OneSTL, the region’s sustainability plan.

12 Missouri c i v ic health inde x
Organizational Connectedness
Missourians had higher rates of membership in four of five types of groups compared with people across the nation (see Figure 1). 26% of state residents were members of church or religious or-ganizations (not counting attendance at services), which was significantly higher than the national average of 21%. Missourians also had higher membership rates than Americans in general in school groups (17% to 16%), sports or recreation groups (12% to 11%), and service or civic groups (10% to 7%). A higher proportion of Missourians were officers or committee members in groups compared with Americans in general, 14% to 11%. Missouri ranked 16th among the states on this indicator of group leadership.
In almost all instances, Kansas City residents are more likely than national respondents to join groups. Furthermore, the groups that they most often choose to join mirror the United States and Missouri findings. People in Kansas City were more likely to participate in church or religious organizations than any other type of group affiliation, and it should be noted that this rate (28%) is higher than either the national (21%) or Missouri average (26%). In the same vein, the second and third most prominent forms of involvement are to be an officer or committee member in a group, and to participate in a school group. Over 15% of Kansas City residents are group officer or committee member, and 15% of Kansas City residents participate in sports or recreation groups. Both rates are higher than the national and state averages. Participation in a service or civic group came in at 11% (above the national and state average). The only category in which residents of the Kansas City metropolitan area fall behind is participation in any other groups, which shows a 4% participation rate.
Compared with the state and national data, St. Louisans’ rates of group membership portray a mixed picture. St. Louis rates of participation in schools (22%) and sports groups (14%) were higher than the national average and the average for the state. People in St. Louis participated in service or civic groups at the same rate as the rest of the state (10%). A smaller number of St. Louis residents (11%) are group officers or committee members than the average in Missouri (14%) although it is slightly higher than for Americans in general (11%). And, fewer people in St. Louis took part in another type of organization, such as a self-help group or garden club, than did Americans in general.
30%
25%
20%
15%
10%
5%
0%
Figure 1: National, State, and Metro Indicators of Group Membership
USA Missouri
Kansas City St. Louis
21
26
28
22
Church or religious org
16 17 16
22
School group
11
14 15
11
Group officer / committee
Other groupService or civic group
The Nine Network of Public Mediawww.ninenet.org
The Nine Network of Public Media has built on its trusted position in St. Louis to develop partnerships with organizations committed to critical issues in our region. Nine combines media resources with the knowledge and skills of its partners to achieve measurable outcomes ranging from increased awareness to mobilization and community impact.
In last few years, Nine partnerships have addressed the mortgage crisis, youth mental health, the heroin epidemic, high school dropout, and healthcare issues. Nine also has worked with partners to engage citizens in the arts, entrepreneurship, governance, and conservation. In 2012, the Nine Network collaborated with St. Louis Public Radio, the St. Louis Beacon, and FOCUS St. Louis® on Beyond November, an initiative to engage citizens on issues and candidates leading up and following the November elections.
Nine’s initiatives create and disseminate content, engage the community and evaluate outcomes utilizing robust websites, social media, print, and video platforms.
Sports or recreation group
11 12
15 14
7
10 11 10
6 5 4 5

13
Connections with Friends and Family
According to statistics reported in Table 2, more people in Missouri (85%) frequently see or hear from family and friends compared with Americans overall (79%). However, Missourians were somewhat less likely than average Americans to frequently have dinner with household members by a margin of 88% to 90%. In fact, Missouri ranked 42nd among the states on this measure of family cohesion.
About 86% of Kansas City residents see their family and friends a few times a week or more, which is considerably higher than the national average of 79%. The 89% of Kansas City residents who have dinner with household members a few times a week or more is below the national average of 90%, but is above the rate for the state as a whole (88%).
More St. Louisans (82%) frequently see or hear from family and friends than the national average (79%); although, St. Louisans were less likely to do this than people in Missouri overall (85%). Slightly fewer people in St. Louis have dinner with household members (89%) compared with the national average (90%). However, slightly more people in St. Louis have dinner with household members than the average for all of Missouri (88%).
Neighborhood Social Capital
Three questions measured people’s connections with their neighbors. Close to half of Missou-rians (48%) frequently talk with their neighbors, which compares with 44% of people across the nation. The state ranked 7th on this measure of neighborliness. Missourians generally are more trusting of their neighbors than are people in the nation as a whole, as 63% of state residents trust all or most of their neighbors, compared with 57% of the U.S. population. Missouri ranked 19th in terms of trust in neighbors. More talking with and trust in neighbors carries over into somewhat higher rates of reciprocal exchanges. 16% of state residents reported that they do or receive favors for neighbors, compared with 14% of Americans overall; Missouri ranked 13th on this measure of neighborhood cohesion.
According to data in Table 3, Kansas City residents keep to themselves more than their counterparts in the rest of the state. While the state average for talking frequently with their neighbors is 48%, for Kansas City residents this percentage is 45%. The same trend holds true when it comes to doing or receiving favors for neighbors a few times a week or more during a typical month. Favors are defined as small acts of kindness such as lending tools, helping with shopping, housesitting or watching each other’s children. Kansas City (13%) lags a bit behind Missouri (16%), St. Louis (15%), and the nation (14%). Data was not available for whether Kansas City residents trust their neighbors, so comparison with the state and nation as a whole are not possible.
When considering social capital for a city, the frequency of positive interactions among neighbors, such as talking with each other, asking for or providing favors, and trusting people who live near you, matters. People in St. Louis were slightly less likely, on average, to frequently talk with their neighbors (44%) than Missourians as a whole (48%). But St. Louisans were more likely to converse with neighbors than other Americans. St. Louis residents, however, lag behind the rest of the state in trusting all or most of their neighbors, 58% to 63%. Nevertheless, St. Louis scored higher on this indicator than the rest of the country. The average number of St. Louis residents who say they do or receive favors for neighbors is almost the same as the average for residents in the rest of the state (15% compared with 16%). St. Louisans were more likely to do or receive favors for neighbors than Americans overall (14%), however.
More people in Missouri (85%) frequently see or hear from family and friends compared with americans overall (79%).

14 Missouri c i v ic health inde x
The Demographics of Social Capital in Missouri
As with other resources, such as income or wealth, social capital is not distributed equally among the population. Table 4 reports the distribution of social capital by gender, income, education, and age.
1 in 10about one in ten Missourians worked with neighbors to fix a community problem.
Most liKely to see or hear froM faMily frieNds regularlyTable 4 shows that women, people with incomes greater than $50,000, people with a high school diploma or higher, and younger people were the most likely to see or hear from friends and family on a frequent basis. Notably, this is the only dimension of social capital in which young adults score higher than people age 30 and older.
Most liKely to frequeNtly talK With NeighborsCitizens over 30 were more likely to frequently talk with their neighbors and to do favors for their neighbors than younger citizens. There were no other significant differences across demographic groups in talking with neighbors and doing/receiving favors with neighbors.
Most liKely to serve as aN offiCer or oN a CoMMitteeWomen, people with incomes of $50,000 or more, those who had attended or graduated from college, and people age 30 or older were the most likely to have been a group officer or served on a community committee.
Most liKely to beloNg to a groupWomen, people with an income of at least $50,000, those who had been to college, and older citizens were more likely to belong to at least one voluntary group than citizens who are male, have lower incomes, are less educated, and are younger.
Most liKely to trust NeighborsCitizens with incomes of $75,000 or more, those who had earned a bachelor’s degree or higher, and older citizens were the most likely to report that they trusted all or most people in their neighborhood.
Most liKely to have diNNer With MeMbers of householdWomen, people with a bachelor’s degree or higher, and older citizens were most likely to have dinner frequently with other members of their household.
Photo: Saint Louis University

15
Gender Income
M F
Less than $35k
$35k to
$49k$50k to
$74k$75k or
more
See or hear from family friends - Frequently/a few times a week or more
83% 87% 81% 85% 89% 89%
Talk with neighbors - Frequently/a few times a week or more
49% 47% 48% 52% 44% 50%
Do or receive favors for neighbors - Frequently/a few times a week or more
17% 15% 18% 17% 12% 15%
Group officer or committee member - Yes 12% 15% 7% 12% 17% 22%
Any group involvement 40% 45% 30% 40% 46% 58%
Trust people in neighbor-hood - All people 18% 16% 15% 14% 18% 23%
Trust people in neighbor-hood - Most people 44% 48% 39% 51% 48% 56%
Dinner with household members - Frequently/a few times a week or more
86% 90% 85% 87% 93% 88%
Table 4. Demographic Breakdowns of Social Capital Indicators
Women, people with an income of at least $50,000, those who had been to college, and older citizens were more likely to belong to at least one voluntary group
Photo: Gephardt Institute for Public Service
Education Age
Less than HS
High School
Some College
BA or more
18-29 30+
See or hear from family friends - Frequently/a few times a week or more
78% 84% 86% 88% 88% 85%
Talk with neighbors - Frequently/a few times a week or more
45% 50% 52% 50% 41% 50%
Do or receive favors for neighbors - Frequently/a few times a week or more
17% 17% 19% 12% 12% 17%
Group officer or committee member - Yes 2% 9% 14% 23% 11% 14%
Any group involvement 23% 33% 44% 62% 36% 44%
Trust people in neighbor-hood - All people ** 17% 15% 21% 14% 18%
Trust people in neighbor-hood - Most people ** 47% 51% 50% 33% 49%
Dinner with household members - Frequently/a few times a week or more
** 89% 91% 94% 76% 91%

16 Missouri c i v ic health inde x
Missourians were more likely to volunteer than average Americans were, 32% to 27% (see Table 5). About one in ten Missourians (10%) worked with neighbors to fix a community problem, which was higher than the national average of 9%. 54% of Missouri residents donated to a charity or religious organization, which was higher than the national rate of 52%.
More people who live in Kansas City volunteer than the national average, 30% to 27%. 11% of Kansas City residents worked with other people in their neighborhood to fix a problem, which was higher than for the nation, state, and St. Louis. Kansas City residents donate to charities (57%) at a higher rate than their state (51%) and the country (51%).
St. Louis residents were more likely to volunteer than were Americans in general, 32% to 27%. Almost one in ten, 10%, of St. Louis residents worked with neighbors to fix a problem, and this was higher than the national average of 9%. More people in St. Louis (57%) donated to a charity or religious organization than the average for all Americans (51%). City residents also did better than their national counterparts on attending public meetings, 10% compared to 9%.
USA MO KC STL
Volunteer rate 27% 30% 30% 32%
Worked with neighbors 9% 10% 11% 10%
Donated to charity 51% 51% 57% 57%
Attended public meetings 9% 9% 9% 10%
Table 6. Three-year Pooled Estimates (2009-2011) of Indicators of Non-political
non-political civic engageMent and Missouri state rankingsAs Table 5 indicates, non-political civic engagement was measured in four ways: Volunteering, working with neighbors to fix a problem or improve a condition in the community, donating to charitable and religious organizations, and attending a public meeting in which community affairs were discussed. It is noteworthy that while Missouri hovers in a middle range for volunteerism and working with neighbors, the state is considerably lower for attendance to public meetings.
Rank
Volunteered 15th
Worked with Neighbors 22nd
Donated to Charity 29th
Attended Public Meetings 44th
Table 5. State Rankings on Non-Political Civic Engagement Indicators
Midtown Plaza Plan http://bit.ly/1cw519j
Led by the City of Kansas City Missouri Planning and Development department, the Midtown Plaza Plan process has been underway since Spring 2013. The process brings together community members to assess what the community is, wants to become, and then the group decides how to make that happen. Through area plans, elected officials have a framework to make important decisions about economic growth, transportation, and housing, for example.
As an interesting twist on the planning process, alongside a series of public meetings, the City is using a social media tool, mindmixer.com. The site allows individuals to share and respond to ideas – in this case, ideas related to land use, neighborhood character, transportation, and urban design guidelines. So far, 82 ideas have been put forward and each idea has been seen by hundreds of people, many of whom have chosen to comment and/or to support an idea.
The social media age holds interesting promise for grassroots civic engagement. The Midtown Plaza Plan process has extended its reach and the breadth of the ideas community members have shared.
17
Gender Income
M F
Less than $35k
$35k to
$49k$50k to
$74k$75k or
more
Volunteer rate28% 35% 21% 34% 35% 42%
Worked with neighbors12% 8% 8% 11% 13% 10%
Donated to charity51% 57% 39% 56% 57% 73%
Attended public meetings 7% 8% 5% 7% 6% 11%
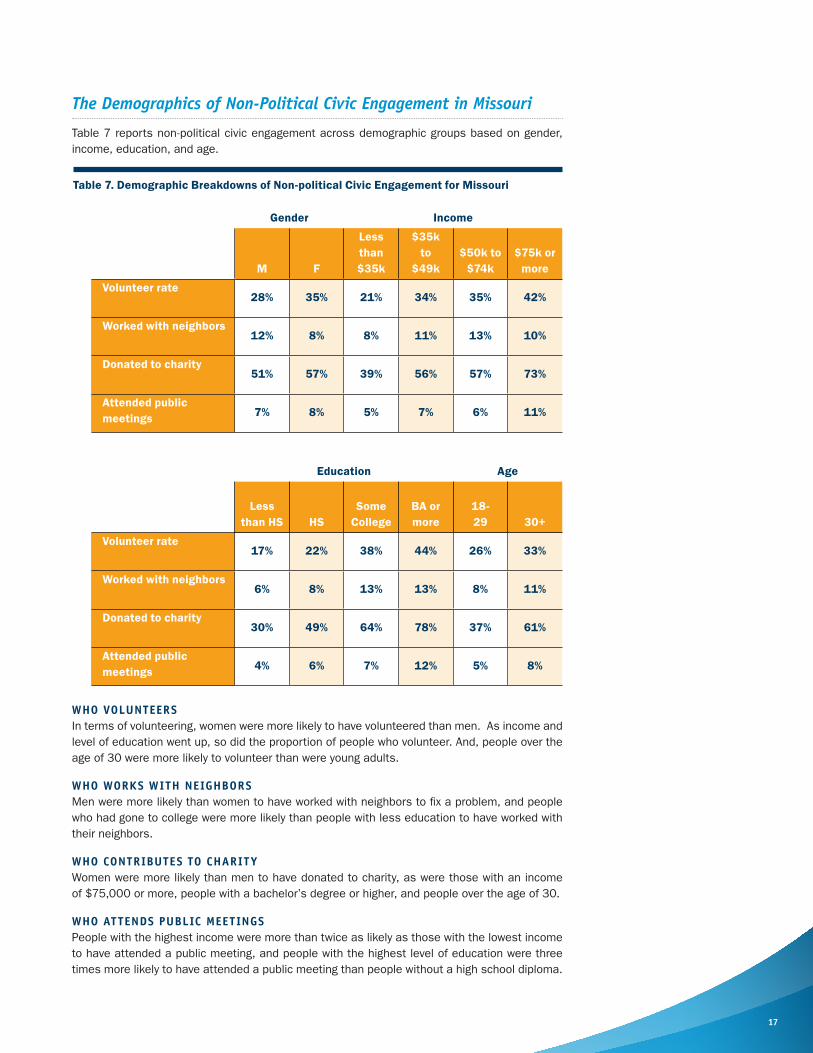
Table 7. Demographic Breakdowns of Non-political Civic Engagement for Missouri
The Demographics of Non-Political Civic Engagement in Missouri
Table 7 reports non-political civic engagement across demographic groups based on gender, income, education, and age.
Who voluNteersIn terms of volunteering, women were more likely to have volunteered than men. As income and level of education went up, so did the proportion of people who volunteer. And, people over the age of 30 were more likely to volunteer than were young adults.
Who WorKs With NeighborsMen were more likely than women to have worked with neighbors to fix a problem, and people who had gone to college were more likely than people with less education to have worked with their neighbors.
Who CoNtributes to CharityWomen were more likely than men to have donated to charity, as were those with an income of $75,000 or more, people with a bachelor’s degree or higher, and people over the age of 30.
Who atteNds publiC MeetiNgsPeople with the highest income were more than twice as likely as those with the lowest income to have attended a public meeting, and people with the highest level of education were three times more likely to have attended a public meeting than people without a high school diploma.
Education Age
Less than HS HS
Some College
BA or more
18-29 30+
Volunteer rate17% 22% 38% 44% 26% 33%
Worked with neighbors6% 8% 13% 13% 8% 11%
Donated to charity30% 49% 64% 78% 37% 61%
Attended public meetings 4% 6% 7% 12% 5% 8%

18 Missouri c i v ic health inde x
the iMportance of volunteeringPrior research has shown that people who volunteer are more likely to participate in their com-munities in other ways than people who do not volunteer. Therefore, it is important to under-stand the dynamics of voluntary activity across the “Show-Me State” in order to encourage more citizens to become involved in their communities. Since voluntary activity is at the center of civic engagement, it is essential to know the answers to such questions as: Who volunteers? What types of volunteering do they do? For which organizations are they volunteering?
Volunteer Demographics
In the state of Missouri, women were more likely to have volunteered than men. People who earned $75,000 or more were two times more likely to have volunteered that people who earned less than $35,000. The relationship between education and volunteering was even stronger, as people with bachelor’s degrees or higher were 2.5 times more likely to volunteer than people with less than a high school education. And, about one out of four Missourians less than 30 years old volunteered, compared to about one out of three Missourians over 30.
Volunteer Activities
Statewide, Missourians who volunteered were most likely to have collected, prepared, distrib-uted, or served food, or engaged in general labor or transportation. In St. Louis, residents were most likely to have collected, prepared, distributed or served food, and fundraised. In Kansas City, residents were more likely to engage in general labor or transportation.
% MO (3-year pooled average)
% KC Metro (3-year pooled
average)
% STL Metro (3-year pooled
average)
Collect, prepare, distribute, or serve food
30% 30% 31%
Engage in general labor or transportation
26% 33% 18%
Fundraising 24% 31% 28%
Mentor youth 20% 23% 15%
Collect, make, or distribute clothing
19% 18% 16%
Tutor or teach 16% 22% 15%
Provide professional or management assistance
14% 19% 17%
Any other type of activity
26% 11% 12%
Table 8. Type of Volunteering for Missouri, Kansas City, and St. Louis (Age 16+)
Volunteer Organizations
As Figure 2 shows, 70% of Missourians who volunteered said they volunteered for one orga-nization, and 18% volunteered for two organizations. Missourians were most likely to have volunteered through a religious organization or through a children’s educational organization. This was also the case in St. Louis and Kansas City.
People who volunteer are more likely to participate in the communities in other ways than people who do not volunteer.
Photo: Gephardt Institute for Public Service

19
Figure 2: Number of Organizations For which Missourians Volunteered
1 organization
2 organizations
3 organizations
4 organizations
5 Organizations
70.20%
17.80%
9.10%
0.80%
% MO (3-year pooled average)
% KC Metro (3-year pooled
average)
% STL Metro (3-year pooled
average)
Religious 37% 36% 39%
Children’s Educational 16% 20% 18%
Social and Community Service
13% 15% 12%
Other 32% 29% 31%
Table 9. Type of Organization Volunteered for in Missouri, Kansas City, and St. Louis
Civic Behavior Volunteer Not a Volunteer
Attend Public Meetings (16+) 17% 3%
Fixed Something in the Neighborhood (16+)
20% 5%
Donated $25 or more (16+) 83% 41%
Table 10. Civic Activities in Missouri by Volunteer Status
Volunteers were about five times more likely to have attended a public meeting than non-volunteers, they were also nearly four times more likely to have worked with neighbors to fix a problem in their neighborhood, and they were twice as likely to have donated money to charity.
Volunteer Hours
In terms of average number of hours volunteered, St. Louis leads Kansas City slightly with hours volunteering per year (34 hours to 31 hours), but given the higher overall state rate (35 hours), citizens in towns and rural areas appear to be volunteering as well.
Relationship between Volunteering and Other Forms of Political and Civic Engagement
Missourians who volunteered were much more likely than Missourians who did not volunteer to participate in other civic behaviors.
2.10%

20 Missouri c i v ic health inde x
electoral and non-electoral political participation and Missouri state rankings
Table 12 indicates that nearly seven out of ten Missouri adults, 69%, are registered to vote, which is higher than the national average (65%). 46% of Missourians reported they had voted in the 2010 midterm national election, which was on par with the national average (46%). 64% of state residents voted in the presidential election year of 2012, which was higher than the national voting rate (62%). 64% of Missourians said they always or sometimes vote in local elections, which is higher than the 58% rate among all Americans.
Rank
Registered in 2010 15th
Frequently votes in local elections 18th
Voted in 2010 election 29th
Bought or boycotted 26th
Contacted public official 26th
Discuss politics 41st
Express opinions via Internet 46th
Table 11. State Rankings of Non-electoral Political Participation Indicators
USA MO KC STL
Electoral ParticipationRegistered to vote 2010 65% 69% 68% 75%Registered to vote 2012 71% 77% 78% 81%Voted 2010 45% 46% 44% 52%Voted 2012 62% 64% 65% 68%
Vote in local elections (always or sometimes)25 58% 64% 60% 66%
Non-electoral ParticipationContacted public official 11% 12% 10% 13%Bought or boycotted products 11% 11% 12% 12%Discuss politics frequently 30% 28% 28% 28%Express opinions via the Internet frequently 8% 6% 8% 5%
Table 12. Single-Year Estimates of Electoral and Non-electoral Political Participation Indicators
Political participation was broken down into electoral activities (registered to vote, frequency of voting in local elections, and voted in the 2010 midterm national election) and non-elec-toral activities (bought or boycotted a product or services for political reasons, contacted a government official, discussed politics with family or friends, and expressed political opinions via the Internet).
As Table 11 indicates, in terms of electoral participation, of the 50 states and the District of Columbia, the state of Missouri ranked 15th and 18th in voter registration and voter turnout for local elections, and was 29th in turnout for the 2010 election. Missouri was ranked in the bottom half of states when it came to non-electoral political activities. The state ranked 26th in buying/boycotting products or services for political reasons and in contacting public officials. As Table 11 indicates, MO is noticeably low in its rankings of discussing politics and expressing political opinions online.
81%in 2012, 81% of saint louisans were registered to vote, compared to 78% of Kansas city residents, 77% Missourans, and 71% nationally.

21
In terms of non-electoral political engagement, 12% of Missouri residents had contacted a government official at some time during the past 12 months, which was somewhat above the national rate of 11%. Missouri ranked 26th in terms of contacting public officials. Similarly, 11% of state residents had bought or boycotted a product or service in the past 12 months, which is equal to the national average. The state also ranked 26th on that measure of political action. 28% of Missourians frequently discussed politics with family or friends, which was below the 30% rate for the nation as a whole. And only 6% of state residents had expressed a political opinion via the Internet, which was lower than the 8% of people across the nation that had done so.
Electoral and Non-Electoral Political Participation in Kansas City and St. Louis Metropolitan Areas (MSA)
Over two-thirds of Kansas City residents, 68%, were registered to vote in 2010, which is above the national voter registration rate of 65%. Kansas City residents were more likely to have reported voting in the 2012 election than Americans overall (65% to 62%). And, a higher percentage of Kansas City residents who are registered to vote (60%) say that they always or sometimes vote in local elections compared with 58% of people across the nation.
When considering non-electoral political activity, Kansas City residents had a somewhat higher rate than Americans in general of buying or boycotting products for a political reason, 12% to 11%. However, compared with people across the nation, Kansas City residents were somewhat less inclined to discuss politics frequently (28% to 30%).
Again, without more robust data in terms of ethnicity, income, employment, age and education, it is difficult to find meaningful conclusions in this data.
People living in St. Louis had above-average rates of political participation across all four measures. The rate of registered voters in St. Louis in 2010 was 75%, and this figure was higher than both the Missouri rate (69%) and the rate for the nation as a whole (65%). 52% of the residents of St. Louis voted in the 2010 election. This figure is higher than both the state as a whole (46%) and the national rate (46%). In the 2012 election, 68% of people from St. Louis voted, compared with 64% of Missourians, and 62% of people across the country. Nearly two-thirds of St. Louis residents (66%) always or sometimes vote in local elections, which is above the rate for the state (64%) and the whole country (58%).
In terms of non-electoral political participation, St. Louisans contacted a public official at a slightly higher rate (13%) than state residents (12%) and people across the nation (11%). People in St. Louis had bought or boycotted a product at a slightly higher rate (12%) than did Missourians (11%) and Americans in general (11%). The rate of political discussion among people in St. Louis (28%) was below the 30% national rate of political discussion. Only 5% of St. Louis residents used the Internet to express political opinions, which was slightly below the Missouri average (6%) and well below the national average (8%).
Madam President Camp http://emilyslist.org/madam-president
Madam President Camp is a summer week-long day camp offered through the University of Kansas City targeting girls entering 5th-8th grades. Girls attending the camp are given an exciting introduction to the world of politics and learn they have a role in governing our country – as much as anyone else.
Madam President Camp is designed to inspire girls toward top leadership roles in politics, business, and the nonprofit sector. Through camp, girls begin building necessary skills to pursue a path to the top of the leadership chain, and foster a network of like-minded peers. They learn about government and nonpartisan politics, planting seeds for continued interest in civic engagement in all its forms.

22 Missouri c i v ic health inde x
The Demographics of Non-electoral Political Participation in Missouri
As with dimensions of social capital, political participation rates vary across some demo-graphic groups. Table 13 reports trends in non-electoral political participation by gender, income, education, and age.
Gender Income
M F
Less than $35k
$35k to
$49k$50k to
$74k$75k or
more
Contacted public official - yes
16% 12% 9% 16% 17% 17%
Bought or boycotted - yes
13% 12% 6% 13% 14% 20%
Discuss politics - frequently/a few times a week or more
31% 23% 20% 21% 31% 36%
Express opinions via Internet - frequently/a few times a week or more
5% 6% 4% 7% 7% 6%
Table 13. Demographic Breakdowns of Non-electoral Political Participation for the State of Missouri
Men were more likely than women to have contacted a public official. Those with incomes of $50,000 or more were nearly two times more likely to have contacted a public official than those with incomes less than $35,000. Those with a bachelor’s degree or higher were more than eight times more likely to have contacted an elected official than those who did not graduate high school. People over 30 were nearly three times more likely to have contacted an elected official than people younger than 30.
Those with incomes of $75,000 or higher were more than three times more likely than those with incomes less than $35,000 to have bought or boycotted a product due to political reasons. Those with bachelor’s degrees or higher were five times more likely to have bought or boycotted a product for political reasons than those who did not graduate from high school.
Table 13 illustrates that it is mostly men, those with bachelor’s degrees or higher, and those over the age of 30 who are most actively discussing politics.
Education Age
Less than HS
High School
Some College
BA or more
18-29 30+
Contacted public official - yes
3% 12% 13% 26% 6% 16%
Bought or boycotted - yes
4% 10% 13% 20% 11% 13%
Discuss politics - frequently/a few times a week or more
19% 21% 29% 41% 17% 29%
Express opinions via Internet - frequently/a few times a week or more
5% 4% 7% 8% 4% 6%
Cultural Leadership (St. Louis) http://culturalleadership.org
Cultural Leadership is modeled af-ter a similar program in Washing-ton, D.C., Operation Understanding DC (founded by Karen Kalish in 1993), which was inspired by a similar program, Operation Under-standing, begun in Philadelphia in 1985 by former Congressman William H. Gray III and George Ross, former President of the American Jewish Committee in Philadelphia. Both programs were designed to rekindle the historical alliance between Jews and African Americans. Historically, these two groups have worked side by side to fight for social justice. Cultural Leadership expanded on this mis-sion.
Examples of mistrust, intolerance, misunderstanding and inequality are everywhere and we saw the need for a future generation of leaders, activists and change agents who would fight for social justice, inclusion and an end to discrimination. Using the lens of the African American and Jewish experience, we train our students to do just that. Over the course of the year, our student participants become “troublemakers of the best kind.”
Cultural leadership students are no longer restricted to African-Americans and Jews but now includes Muslim and Christian teens as well.

23
Rank
Confidence in Corporations 20th
Confidence in Media 24th
Confidence in Public Schools 31st
Table 14. State Rankings on Confidence in Institutions
USA MO KC STL
Confidence in Corporations (some/a great deal) 62% 64% 66% 61%
Confidence in the Media (some/a great deal) 62% 63% 64% 66%
Confidence in Public Schools (some/a great deal)
88% 88% 84% 87%
Table 15. 2011 Confidence in Corporations, the Media, and Public Schools
confidence in institutions and Missouri state rankingsThree questions related to confidence in institutions were added to the 2011 CPS Civic Engage-ment Supplement Among the 50 states, Missouri ranks somewhere in the middle in terms of its confidence in institutions such as corporations, the media, and public schools.
Slightly higher proportions of Missourians than Americans in general express confidence in corporations and the media.
Photo: Nine Network of Public Media
Slightly higher proportions of Missourians than Americans in general express confidence in corporations and the media. There was no difference in rates of confidence in public schools. 64% of state residents have a great deal or some confidence in corporations, compared with 62% of people across the nation. Similarly, 63% of Missourians have a great deal or some confidence in the media, which is slightly higher than the national average of 62%.
More Kansas City residents (66%) have a great deal or some confidence in corporations than their fellow Missourians (64%) and Americans in general (62%) Similarly, 64% of Kansas City residents have a great deal or some confidence in media, which is slightly above the state (63%) and national (62%) levels of confidence. However, Kansas City residents show comparably low rates of confidence in the city’s public schools. Only 84% of area residents have some or a great deal of confidence in public schools, which is considerably lower than the 88% confidence rates across the state and nation.
Fewer people in St. Louis expressed confidence in corporations than their state or national coun-terparts. 61% of St. Louisans have a great deal or some confidence in corporations compared with 64% of Missouri residents and 62% of Americans. More people in St. Louis, however, have confidence in the media than either the rest of Missouri or Americans in general. 66% of people in St. Louis express a great deal or some confidence in media, compared with state residents (63%) and nationally (62%). Residents of St. Louis are also less likely to have confidence in public schools than state residents or Americans in general. 87% of St. Louis residents say they have a great deal of confidence or some confidence in public schools compared with 88% of Missourians and 88% of Americans.
The Demographics of Confidence in Institutions
Confidence in institutions shows some variation across demographic groups, as is shown in the following table.

24 Missouri c i v ic health inde x
Table 16 reports the demographic characteristics of confidence in institutions by gender, income, education, and age. Below are some highlights:
� Very few people had a great deal of confidence in corporations regardless of which demographic characteristic was examined. Women were more likely than men to have some confidence in corporations, as were those with incomes of $50,000 or more, and people with a bachelor’s degree or higher.
� Very few people had a great deal of confidence in the media. Women were more likely than men to have some confidence in the media, as were those with incomes of at least $75,000 and people who had a bachelor’s degree or higher.
Of the three confidence indicators it is very clear that people were more confident in public schools in Missouri than in corporation or in media. Women were more likely to report having a great deal of confidence in public schools than men, and about one out of three respondents from the other demographic groups also reported having a great deal of con-fidence in Missouri’s public schools. Taken together, more than 80% of respondents from each category reported that they had some or a great deal of confidence in public schools.
Gender Income
M F
Less than $35k
$35k to
$49k$50k to
$74k$75k or
more
Confidence in corporations - a great deal 5% 7% 4% 9% 7% 7%
Confidence in corporations - some 54% 61% 54% 54% 65% 64%
Confidence in Media - a great deal 7% 6% 6% 9% 8% 5%
Confidence in Media - some 54% 59% 56% 56% 53% 61%
Confidence in public schools - a great deal 31% 36% 34% 36% 37% 30%
Confidence in public schools - some 57% 52% 53% 49% 54% 60%
Table 16. Demographic Breakdown of Confidence in Institutions
Education Age
Less than HS
High School
Some College
BA or more
18-29 30+
Confidence in corporations - a great deal ** 9% 4% 6% 4% 7%
Confidence in corporations - some ** 57% 61% 66% 58% 58%
Confidence in media - a great deal ** 11% 4% 5% 5% 7%
Confidence in media - some ** 53% 55% 66% 59% 56%
Confidence in public schools - a great deal ** 37% 29% 36% 36% 34%
Confidence in public schools - some ** 55% 56% 52% 54% 54%

25
suMMaryThis report highlighted four major indicators of civic health for the state of Missouri, as well as the Kansas City and St. Louis metropolitan areas:
� Social Capital
� Non-political civic participation
� Political participation
� Confidence in institutions
Within each category, multiple data points describe how the state and metro areas fare in relation to each other and to the rest of the nation. Additionally, the indicators were broken down by different demographics to gain better insight into where civic health is strong and where it is weak.
Overall, the state of Missouri is about average when it comes to the overall civic health of the state. The state is ranked in the middle on most indicators. However, there does appear to be a degree of inequality between who participates in civil society in the state and who does not. The primary driver of this inequality appears to be socioeconomic status, with Missourians who are more highly educated and who have higher incomes being more likely to engage in politics and in their communities. Of the two, education appears to be the most important de-terminant of participation in civil society. People with bachelor’s degrees have greater involve-ment in politics and in their communities than people without them. This trend is not unique to the state; it is a broader reflection of national trends in political and civic participation.
The report also covered characteristics of volunteering across the state. It turns out that, on average, Missourians are more likely to volunteer than the national average. Prior research has shown that people who volunteer are more likely to participate in their communities in other ways than people who do not volunteer. That turns out to be the case in Missouri. For example, Missourians who volunteered were five times more likely to have attended a public meeting than non-volunteers; were nearly four times more likely to have worked with neighbors to fix a problem in their neighborhood; and were twice as likely to have donated money to charity.
Clearly, volunteering strengthens and maintains the civic health of the state, and opportuni-ties and incentives should be provided to encourage more Missourians to volunteer in their communities.
Finally, this report examined new data on confidence in institutions. This new indicator of civic health helps provide some context on how satisfied Missourians are with some of the public, private, and media institutions that help make communities function better. Overall, about two-thirds of Missourians had either some or a great deal of confidence in corporations and the media, and nearly nine out of ten Missourians had some or a great deal of confi-dence in public schools. While these statistics are encouraging it will be important to track the trends over time to see how they fluctuate as a result of policy battles in Jefferson City about the appropriate amount of tax revenue that should go toward funding public schools, and the appropriate amount of tax incentives that should go toward corporations. The media, in the meantime, needs to tell both sides of the story because tax breaks for corporations deplete revenue for other important public benefits, including schools, and citizens need to be informed about the benefits and drawbacks of policies that favor tax cuts over investments in public goods.
Missourians who volunteered were five times more likely to have attended a public meeting than non-volunteers.
Photo: Neighbor for Neighbor

26 Missouri c i v ic health inde x
conclusion and recoMMendations
It is our hope that the data and trends summarized in this report will spark greater discussion among policy makers and civic leaders across the state of Missouri in order to reach a consensus on potential solutions for strengthening civic health in the “Show-Me-State.”
The data compiled on the civic participation of United States citizens in 2010-2011 is dis-concerting overall. As a leading democratic society, the populace is disengaged as evidenced across a range of political and non-political indicators. When comparing Missouri and the two largest MSAs within Missouri to national data, our indicators of civic health are lower in a number of areas, which is especially disconcerting, since civic health at the national level is in and of itself less than robust. Whether civic America is disappearing or morphing, the data are of concern. What is encouraging, however, is that more than ever before we know how to influence civic participation.
Civic Education Educates
As highlighted throughout this report, education matters. Progressively more education is related to progressively more engagement. One matter of education, however, is directly related; that of civic education. Only half the states require civics for high school graduation. Taking a longitudinal view of civic participation, this dip in formal civic education may have negative consequences. It is encouraging, however, to see wide-spread adoption of specific, time-limited curricula regarding voting (see sidebar on Kids Voting Missouri). There is also experimentation with “service learning,” and social studies curricula that provide an applied component to learning about civil society and one’s rights and responsibilities as a citizen. While not a substitute for civics, this may be an effective delivery of related content, especial-ly that emphasizing the role of the social sector. Institutions of higher education have a vital role to play, as well, in nurturing young people to apply their knowledge and skills to address real-world challenges and grow into the next generation of civic leaders.
Parental Role Modeling Influences for a Lifetime
When you pair the dip in formal civic education with the data that Missouri residents rank 42nd in having dinner with their household, the kids of Missouri are not learning the habits of civic participation. Studies have demonstrated that it is during dinner time when children hear their parents discuss their days and current events; the children come to learn and form opinions on politics and how to participate.27 In an era when civil discourse has eroded at the highest levels of government, we can see the importance of teaching our children how to listen, share opinions, agree to disagree, and to compromise. It is not outside the realm of consideration that, as there have been campaigns to promote healthy eating, there could be a campaign to support household dinners and daily discussions as an important parental (and civic) responsibility. Additionally, recent research has shown that parents, especially working mothers, are more likely than the overall population to volunteer for organizations that address children’s needs, engaging in such activities as youth mentoring, tutoring, and teaching.28
Kids Voting Missouri kidsvotingmissouri.org
Kids Voting Missouri is a grassroots, non-partisan, citizenship education program for students in K-12 grades. An affiliate of Kids Voting US, the program is administered by the University of Missouri-St. Louis (UMSL) through its Citizenship Education Clearing House in the College of Education.
This innovative curriculum enables students to become informed citizens by learning about candidates and issues through interactive debates and role playing. They also gain understanding of concepts like leadership, decision making, compromise, majority rule, branches/levels of government, and representative democracy. They engage in simulated voter registration drives and mock elections so that they have the same experience as adult voters on election day. In this way, they are instilled with the habit to engage in the democratic process at an early age.
During its 17-year history at UMSL, more than 1,278,526 K-12 Missouri students have learned essential principles of democracy, citizenship, and voting through Kids Voting Missouri. About 60% of these youth, or approximately 768,100 K-12 students, have taken advantage of their opportunity to “vote” and have cast a Kids Voting Missouri ballot on or near Election Day.

27
Voting Rights Provide Access
It may go without saying that civic participation is influenced by political rights, but those rights are in question. Voting laws have experienced a dramatic shift in recent years with the data not yet in on how voter identification changes will impact voting rates overall and those of particular demographic groups. Recent proposed legislation in Jefferson City for stricter proof of identification may further disenfranchise those who already have a lesser voice in our country: the young, the unemployed, and the minority populations.29 Also, few appear to be addressing or advocating for this issue. While local resources like the Nine Network public media station are collaborating with others to help inform on the issues and keep people engaged beyond election day, it proves difficult overall for people be active in the democratic process when simple voting rights themselves are increasingly harder to pursue. As more Americans are encouraged to exercise their hard-won right to vote, so too should we encourage our local institutions to have the human and technological capacity to remove barriers on Election Day.
Volunteer Engagement Requires Resources
As for non-political civic participation, the role of the nonprofit sector is paramount. One indicator in this report is of particular importance: when Missouri residents volunteer, they are also engaged in other ways. While this should not be construed as cause and effect, some relationship may well exist. Those who volunteer may just be engaged in multiple ways. However, data on volunteering suggests that if a volunteer has a negative experience they are not only less likely to volunteer with that organization but with any organization.30 By extension, nonprofit organizations are harbingers of our civic health. Effective volunteer man-agement requires investment. Volunteers should be treated as precious human capital and managed with dedicated staff, training, and resources.
Civic Health and Economic Resilience
Civic health is itself a worthy goal, but there are larger implications for why such indicators matter. Recent reports from NCoC and CIRCLE31 have focused on the link between civic health and economic vitality. Data suggest that civic participation is more critical than ever when the country experiences an economic downturn. Individuals who have been downsized have higher rates of becoming employed when they are more civically active. This makes sense, as citizens who volunteer, work on projects with neighbors, or voice their opinions at town halls have more of an investment in their communities, gain greater skills, are more informed, and sustain a broader network of people who can be helpful during a job search. Should our economy continue to be sluggish or fall into recession again in the near future, this tie with civic health and economic growth should not be forgotten.
We Can Become More Civically Healthy
As a society, just as we are increasingly concerned with the declining state of American’s physical health, we must be equally concerned about our civic health. As the “Show-Me State,” we should adopt a “let’s show them” attitude. Based on the data in this report, in-creasing civic participation should be a priority of the public, private, and nonprofit sectors. Programs such as Youth: Madam President, Coro Fellows, and other examples cited through-out this report give participants a chance to practice civic skills and participate in civic gover-nance. Institutionalized responses are demanded. From reinstating civics lessons in schools to helping families make time to eat dinner together, we must provide multiple and varied opportunities for people to plug in, get informed, and care about their communities. We must reward voting and town hall participation with governance that represents the people and not just special interests. We must consider incentives to volunteer and provide the necessary infrastructure to support success and impact. Such concerted efforts will move the needle not just in our civic participation but also in the social and economic health of communities across the state.
When comparing Missouri and the two largest MSAs within Missouri to national data, our indicators or civic health are lower in a number of areas, which is especially disconcerting, since civic health at the national level is in and of itself less than robust.

28 Mi ssour i c i v ic health inde x
technical notesFindings presented above are based on CIRCLE’s analysis of the Census Current Population Survey (CPS) data. Any and all errors are our own. Volunteering estimates are from CPS September Volunteering Supplement, 2002 - 2011, Voting and registration data come from the CPS November Voting/Registration Supplement, 1972-2012, and all other civic en-gagement indicators, such as discussion of political informa-tion and connection to neighbors, come from the 2011 CPS November Civic Engagement Supplement.
Estimates for the volunteering indicators (e.g., volunteering, working with neighbors, making donations) are based on U.S. residents ages 16 and older. Estimates for civic engagement and social connection indicators (e.g., exchanging favor with neighbor, discussing politics) are based on U.S. residents ages 18 and older. Voting and registration statistics are based on U.S. citizens who are 18 and older (eligible voters). Any time we examined the relationship between educational attainment and engagement, estimates are only based on adults ages 25 and older, based on the assumption that younger people may still be completing their education.
Because we draw from multiple sources of data with varying sample sizes, we are not able to compute one margin of error
for the state across all indicators. In Missouri, the margins of error for major indicators varied from +/- 1.3% to 3.7%, depending on the sample size and other parameters associ-ated with a specific indicator. Any analysis that breaks down the sample into smaller groups (e.g., gender, education) will have smaller samples and therefore the margin of error will increase. It is also important to emphasize that our margin of error estimates are approximate, as CPS sampling is highly complex and accurate estimation of error rates involves many parameters that are not publicly available.
a Word about recoMMendationsNCoC encourages our partners to consider how civic health data can inform dialogue and action in their communities, and to take an evidence-based approach to helping our commu-nities and country thrive. While we encourage our partners to consider and offer specific recommendations and calls to action in our reports, we are not involved in shaping these rec-ommendations. The opinions and recommendations expressed by our partners do not necessarily reflect those of NCoC.
Photo: Nine Network Public Media, American Graduate Teacher Town Hall

29
endnotes1 By state we are referring to the political authority within a territory that provides public
goods.
2 By market we are not referring to “marketplaces,” but to the mechanism that allocates the production and distribution of private goods.
3 By institution we refer to an established organization dedicated to addressing societal needs. For example, the institution of education provides students with the skills they need to be effective citizens and workers.
4 Bowles, S and Herbert Gintis. 2002. Social Capital and Community Governance. The Economic Journal. Vol. 112: F419-F436.
5 By private capital we are referring to the tools and resources used to produce commodities, which are exchanged in markets for private gain
6 By public capital we refer to those goods and services provided by states for the public good, such as schools, roads, safety, and public health.
7 For more detailed discussion on the different forms of capital see: Bourdieu, P. (1986) The forms of capital. In J. Richardson (Ed.) Handbook of Theory and Research for the Sociology of Education (New York, Greenwood), 241-258.
8 Putnam, R. 2000. Bowling Alone: The collapse and revival of American community. New York: Simon & Schuster.
9 Coleman, J.S. 1988. Social capital in the creation of human capital. American Journal of Sociology. Vol. 94 Supplement: Organizations and Institutions: Sociological and Economic Approaches to the Analysis of Social Structure: S95-S120.
10 Lin, N. 2002. Social Capital: A theory of social structure and action. Cambridge University Press.
11 Fukuyama, F. 1996. Trust: The social virtues and the creation of prosperity. Free Press.
12 Putnam, 2000.
13 Coleman, 1988.
14 National Conference on Citizenship. 2010. Civic Life in America: Key findings on the civic health of the nation. http://ncoc.net/CHAExecutiveSummary2010
15 Lipset, S.M. and Schneider, W. 1983. The decline of confidence in American institu-tions. Political Science Quarterly. Vol 98(3): 379-402.
16 The Kansas City Metro Area consists of 11 counties in Missouri and Kansas. In Missouri, the Kansas City metro area consists of Cass County, Clay County, Clinton County, Jackson County, Lafayette County, Platte County, and Ray County. In Kansas, the Kansas City metro area consists of Johnson County, Leavenworth County, Miami County, and Wyandotte County.
17 The St. Louis metro area consists of the Southern Illinois counties of Bond, Calhoun, Clinton, Jersey, Macoupin, Madison, Monroe, and St. Clair, which are collectively known as the Metro East; the Missouri counties of Franklin, Jefferson, Lincoln, St. Charles, St. Louis County, Warren, Washington, and part of Crawford County.
18 For technical documentation on the CPS data see: http://www.census.gov/cps/method-ology/techdocs.html
19 Source: Missouri Census Data Center. (2013). ACS Profiles [dataset application]. Available from http://mcdc.missouri.edu/acs/profiles/menu.php
20 The complete 2010 Missouri Civic Health Assessment report, “Civic Participation in the Show Me State: Challenges and Opportunities,” can be found at http://sociology.mis-souristate.edu/ and at http://www.ncoc.net/mochi2010.
21 p. 17.
22 p. 19.
23 The pooled-estimate refers to the 3-year average (2009-2011) for each indicator. The 3-year average is used when sample sizes are too small to obtain reliable 1-year averages.
24 See, for example: Verba, S., Schlozman, K.L., and Brady, H. 1995. Voice and Equality: Civic voluntarism in American politics. Harvard University Press.
25 Three-year estimate used due to small sample size.
26 From the American Association of Colleges and Universities (AAC&U) report, A Crucible Moment: College Learning and Democracy’s Future (available online at: http://www.aacu.org/civic_learning/crucible/documents/crucible_508F.pdf)
27 Verba et al, 1995.
28 http://www.volunteeringinamerica.gov/infographic.cfm
29 http://www.brennancenter.org/issues/restricting-vote
30 http://www.urban.org/UploadedPDF/411005_VolunteerManagement.pdf
31 Civic Health and Unemployment: Can Engagement Strengthen the Economy? http://ncoc.net/unemployment and Civic Health and Unemployment II: The Case Builds http://ncoc.net/unemployment2
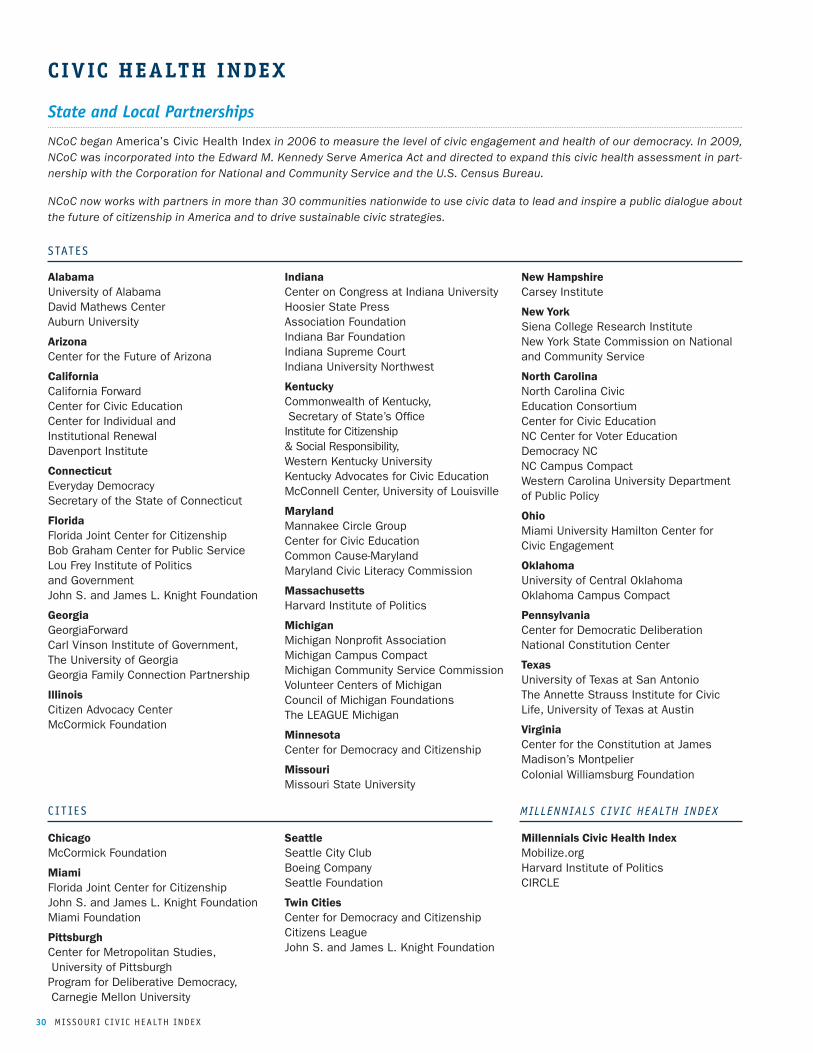
30 Mi ssour i c i v ic health inde x
civic health index
State and Local Partnerships
NCoC began America’s Civic Health Index in 2006 to measure the level of civic engagement and health of our democracy. In 2009, NCoC was incorporated into the Edward M. Kennedy Serve America Act and directed to expand this civic health assessment in part-nership with the Corporation for National and Community Service and the U.S. Census Bureau.
NCoC now works with partners in more than 30 communities nationwide to use civic data to lead and inspire a public dialogue about the future of citizenship in America and to drive sustainable civic strategies.
AlabamaUniversity of Alabama David Mathews CenterAuburn University
ArizonaCenter for the Future of Arizona
CaliforniaCalifornia ForwardCenter for Civic EducationCenter for Individual and Institutional RenewalDavenport Institute
ConnecticutEveryday DemocracySecretary of the State of Connecticut
FloridaFlorida Joint Center for CitizenshipBob Graham Center for Public Service Lou Frey Institute of Politics and Government John S. and James L. Knight Foundation
GeorgiaGeorgiaForwardCarl Vinson Institute of Government, The University of GeorgiaGeorgia Family Connection Partnership
IllinoisCitizen Advocacy CenterMcCormick Foundation
IndianaCenter on Congress at Indiana UniversityHoosier State Press Association Foundation
Indiana Bar FoundationIndiana Supreme CourtIndiana University Northwest
KentuckyCommonwealth of Kentucky, Secretary of State’s Office Institute for Citizenship & Social Responsibility, Western Kentucky UniversityKentucky Advocates for Civic Education McConnell Center, University of Louisville
MarylandMannakee Circle GroupCenter for Civic EducationCommon Cause-MarylandMaryland Civic Literacy Commission
MassachusettsHarvard Institute of Politics
MichiganMichigan Nonprofit AssociationMichigan Campus Compact Michigan Community Service CommissionVolunteer Centers of MichiganCouncil of Michigan FoundationsThe LEAGUE Michigan
MinnesotaCenter for Democracy and Citizenship
MissouriMissouri State University
New HampshireCarsey Institute
New YorkSiena College Research InstituteNew York State Commission on National and Community Service
North CarolinaNorth Carolina Civic Education ConsortiumCenter for Civic EducationNC Center for Voter EducationDemocracy NCNC Campus CompactWestern Carolina University Department of Public Policy
OhioMiami University Hamilton Center for Civic Engagement
OklahomaUniversity of Central OklahomaOklahoma Campus Compact
PennsylvaniaCenter for Democratic Deliberation National Constitution Center
TexasUniversity of Texas at San AntonioThe Annette Strauss Institute for Civic Life, University of Texas at Austin
VirginiaCenter for the Constitution at James Madison’s MontpelierColonial Williamsburg Foundation
ChicagoMcCormick Foundation
MiamiFlorida Joint Center for CitizenshipJohn S. and James L. Knight Foundation Miami Foundation
PittsburghCenter for Metropolitan Studies, University of Pittsburgh Program for Deliberative Democracy, Carnegie Mellon University
SeattleSeattle City ClubBoeing CompanySeattle Foundation
Twin CitiesCenter for Democracy and CitizenshipCitizens LeagueJohn S. and James L. Knight Foundation
Millennials Civic Health IndexMobilize.orgHarvard Institute of PoliticsCIRCLE
states
c i t ie s Millennials C iviC HealtH index
31
c iv ic health indicators WorK ing group
Justin BibbSpecial Assistant for Education and Economic Development for the County Executive, Cuyahoga County, Ohio
Harry BoyteDirector, Center for Democracy and Citizenship
John BridgelandCEO, Civic EnterprisesChairman, Board of Advisors, National Conference on CitizenshipFormer Assistant to the President of the United States & Director, Domestic Policy Council & USA Freedom Corps
Nelda BrownExecutive Director, National Service- Learning Partnership at the Academy for Educational Development
Kristen CambellChief Program Officer, National Conference on Citizenship
Jeff CoatesProgram Manager, National Conference on Citizenship
Doug DobsonExecutive Director, Florida Joint Center for Citizenship
David EisnerFormer President and CEO, National Constitution Center
Paula EllisFormer Vice President, Strategic Initia-tives, John S. and James L. Knight Foundation
Maya Enista SmithFormer CEO, Mobilize.org
William GalstonSenior Fellow, Brookings Institution Former Deputy Assistant to the President of the United States for Domestic Policy
Stephen GoldsmithFormer Deputy Mayor of New York CityDaniel Paul Professor of Government, Kennedy School of Government at Harvard UniversityDirector, Innovations in American GovernmentFormer Mayor of Indianapolis
Robert Grimm, Jr.Director of the Center for Philanthropy and Nonprofit Leadership, University of Maryland
Lloyd JohnstonResearch Professor and Distinguished Research Scientist at the University of Michigan’s Institute for Social ResearchPrincipal Investigator of the Monitoring the Future Study
Kei Kawashima-GinsbergDeputy Director, Center for Information and Research on Civic Learning and Engagement (CIRCLE) at the Jonathan M. Tisch College of Citizenship and Public Service at Tufts University
Peter LevineDirector, Center for Information and Research on Civic Learning and Engagement (CIRCLE) at the Jonathan M. Tisch College of Citizenship and Public Service at Tufts University
Chaeyoon LimAssistant Professor of Sociology, University of Wisconsin-Madison
Mark Hugo LopezAssociate Director of the Pew Hispanic CenterResearch Professor, University of Maryland’s School of Public Affairs
Sean ParkerCo-Founder and Chairman of Causes on Facebook/MySpaceFounding President of Facebook
Kenneth PrewittFormer Director of the United States Census BureauCarnegie Professor of Public Affairs and the Vice-President for Global Centers at Columbia University
Robert PutnamPeter and Isabel Malkin Professor of Pub-lic Policy, Kennedy School of Government at Harvard UniversityFounder, Saguaro SeminarAuthor of Bowling Alone: The Collapse and Revival of American Community
Thomas SanderExecutive Director, the Saguaro Seminar, Harvard University
David B. Smith Chief of Programs and Strategy, National Center for Service and Innovative Leadership Founder, Mobilize.org
Heather SmithExecutive Director, Rock the Vote
Max StierExecutive Director, Partnership for Public Service
Michael StoutAssociate Professor of Sociology, Missouri State University
Kristi TateDirector of Community Strategies, National Conference on Citizenship
Michael WeiserChairman, National Conference on Citizenship
Jonathan ZaffVice President for Research, America’s Promise Alliance
Ilir ZherkaExecutive Director, National Conference on Citizenship

Data Made Possible By: