Embed Size (px)
Citation preview
MISSOURI DEPARTMENT OF NATURAL RESOURCESAIR AND LAND PROTECTION DIVISION
ENVIRONMENTAL SERVICES PROGRAMProject Procedure
TITLE: Stream Habitat Assessment
EFFECTIVE DATE: August 12, 2003
WRITTEN BY: Randy Sarver, Environmental Specialist IV, WQMS, ESP
APPROVED BY: Earl Pabst, Director, ESP
SUMMARY OF REVISIONS: Updated names and changed title page
APPLICABILITY: Applies to WQMS personnel who perform community level surveys of aquatic macroinvertebrates in wadeable streams of Missouri.
DISTRIBUTION: MDNR Intranet ESP SOP Coordinator
RECERTIFICATION RECORD:
Date Reviewed
Initials
Page 1 of 40
Stream Habitat Assessment Project ProcedureEffective Date: August 12, 2003Page 2 of 40
Table of Contents1.0 Introduction__________________________________________________________42.0 Stream Reach Considerations ____________________________________________63.0 Riffle/Pool Prevalence _________________________________________________6
3.1 Epifaunal Substrate/Available Cover ________________________________63.2 Embeddedness__________________________________________________73.3 Velocity/Depth Regime __________________________________________93.4 Sediment Deposition_____________________________________________93.5 Channel Flow Status ____________________________________________103.6 Channel Alteration _____________________________________________113.7 Riffle Quality _________________________________________________113.8 Bank Stability _________________________________________________123.9 Bank Vegetative Protection ______________________________________133.10 Riparian Vegetative Zone Width _________________________________14
4.0 Glide/Pool Prevalence_________________________________________________154.1 Epifaunal Substrate/Available Cover _______________________________154.2 Pool Substrate Characterization ___________________________________164.3 Pool Variability________________________________________________164.4 Sediment Deposition____________________________________________164.5 Channel Flow Status ____________________________________________174.6 Channel Alteration _____________________________________________174.7 Channel Sinuosity ______________________________________________184.8 Bank Stability _________________________________________________184.9 Bank Vegetative Protection ______________________________________194.10 Riparian Vegetative Zone Width _________________________________20
5.0 Physical Characterization/Water Quality __________________________________215.1 General Information ____________________________________________21
5.1.1 Date _________________________________________________215.1.2 Time _________________________________________________215.1.3 Latitude/Longitude______________________________________215.1.4 USGS#/Reach# ________________________________________215.1.5 Waterbody #___________________________________________215.1.6 Legal Coordinates ______________________________________21
5.2 Physical Features ______________________________________________225.2.1 Drainage Area _________________________________________225.2.2 Gradient ______________________________________________225.2.3 Velocity and Discharge __________________________________225.2.4 Stream Order __________________________________________22
5.3 Water Quality _________________________________________________225.3.1 Temperature ___________________________________________225.3.2 Dissolved Oxygen ______________________________________225.3.3 pH___________________________________________________235.3.4 Conductivity___________________________________________235.3.5 Alkalinity _____________________________________________235.3.6 Hardness______________________________________________23
6.0 Literature Cited______________________________________________________24

Stream Habitat Assessment Project ProcedureEffective Date: August 12, 2003Page 3 of 40
List of Appendices
Appendix A - Riffle/Pool Habitat Assessment Form ____________________________29Appendix B - Glide/Pool Habitat Assessment Form ____________________________32Appendix C - Worksheet for Riffle/Pool or Glide/Pool Habitat Assessment Forms ____35Appendix D - Physical Characterization/Water Quality Data Form ________________38
List of Figures and Tables
Figure 1 – Habitat vs. Biological Condition____________________________________5Table 1 – Epifaunal Substrate/Available Cover Scoring Criteria____________________7Table 2 – Embeddedness Scoring Criteria _____________________________________7Figure 2 – Example of Embeddedness ________________________________________8Table 3 – Velocity/Depth Regime Scoring Criteria ______________________________9Table 4 – Sediment Deposition Scoring Criteria _______________________________10Table 5 – Channel Flow Status Scoring Criteria _______________________________10Figure 3 – Upper and Lower Bank __________________________________________11Table 6 – Channel Alteration Scoring Criteria _________________________________11Table 7 - Frequency of Riffle Scoring Criteria_________________________________12Table 8 – Bank Stability Scoring Criteria_____________________________________13Table 9 – Vegetative Protection Scoring Criteria_______________________________14Table 10 – Riparian Vegetative Zone Width Scoring Criteria _____________________14Table 11 – Epifaunal Substrate/Available Cover Scoring Criteria__________________15Table 12 – Pool Substrate Characterization Scoring Criteria______________________16Table 13 – Pool Variability Scoring Criteria __________________________________16Table 14 – Sediment deposition Scoring Criteria_______________________________17Table 15 – Channel Flow Status Scoring Criteria ______________________________17Table 16 – Channel Alteration Scoring Criteria ________________________________18Table 17 – Channel Sinuosity Scoring Criteria ________________________________18Table 18 – Bank Stability Scoring Criteria____________________________________19Table 19 – Vegetative Protection Scoring Criteria______________________________20Table 20 – Riparian Vegetative Zone Width Scoring Criteria _____________________20

Stream Habitat Assessment Project ProcedureEffective Date: August 12, 2003Page 4 of 40
1.0 Introduction
This procedure is designed to support the Semi-Quantitative Macroinvertebrate StreamBioassessment Project Procedure (MDNR 2003c) by providing a standardized manner ofassessing physical habitat quality in the permanent wadeable streams of Missouri. Theassessment of stream habitat supports understanding of the relationship between habitat qualityand the biological community. Such assessments identify obvious constraints on the attainablebiological potential of the site, assist in the selection of appropriate sampling stations andprovide basic information for interpreting biological survey results.
The act of estimating or determining the significance, importance or worth of an item on a scaleof values is the definition of an assessment. The basis of stream habitat assessment lies in themeasurement of quantitative and qualitative features that are recorded on the PhysicalCharacterization/Water Quality Data Form (Appendix D) and the Worksheet for Riffle/Pool orGlide/Pool Habitat Assessment Forms (Appendix C). The information collected is then used toscore a number of habitat parameters on the Riffle/Pool Habitat Assessment Form (Appendix A)or the Glide/Pool Habitat Assessment Form (Appendix B).
During macroinvertebrate surveys the physical habitat of a study location is compared to thephysical habitat of other locations that have as little disturbance as possible (reference sites). These reference sites may be selected from a nearby reference stream or from reference streams(Missouri Water Quality Standards 10 CSR 20-7, Table I) in the same ecoregion. Whenselecting reference sites the investigator must make a decision whether the habitat quality of astudy site is comparable to the habitat quality of a reference site. Until ongoing research iscompleted in Missouri, the total score from the physical habitat assessment of the study sites isexpected to be from 75% to 100% similar to the total score of the reference site in order to fullysupport a comparable biological community.
Temporary habitat assessment categories are as follows:1) Comparable to Reference >90%2) Supporting 75-89%3) Partially Supporting 60-74%4) Non-supporting <59%
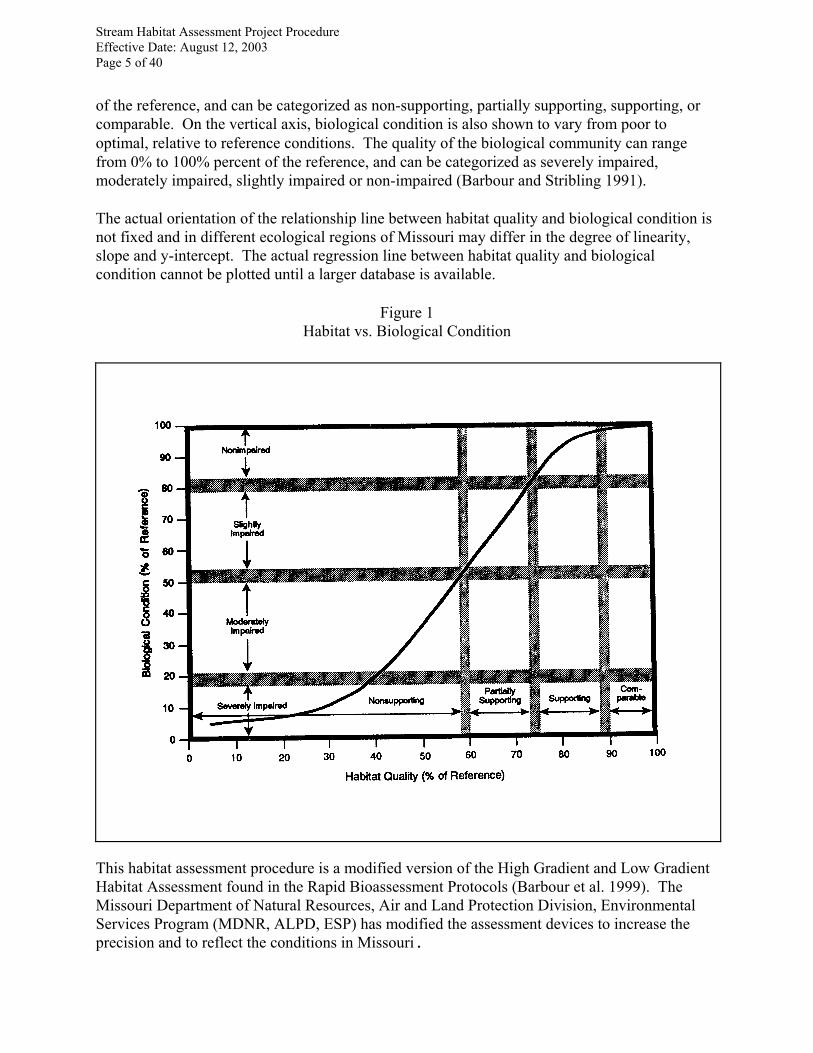
If the investigator has a concern that very similar total scores between sites were derived fromseveral widely different individual parameters, a percent parameter similarity can be calculatedfrom the Riffle/Pool or Glide/Pool Habitat Assessment Forms. The first step in determiningpercent parameter similarity is to convert all ten parameter scores on each habitat assessmentform to percent of the total. The lowest percent score from each parameter is selected and theten scores are added together. The percent parameter similarity will total between 0 and 100percent. Percent parameter similarity is to be used only as secondary support of total scorecomparability.Assuming that water quality and quantity remains constant over time, the theoretical relationshipbetween physical habitat quality and biological condition is somewhat linear, as illustrated inFigure 1 (Plafkin et al., 1989). On the horizontal axis, habitat is shown to vary from poor tooptimal, relative to reference conditions. The quality of the habitat can range from 0% to 100%
Stream Habitat Assessment Project ProcedureEffective Date: August 12, 2003Page 5 of 40
of the reference, and can be categorized as non-supporting, partially supporting, supporting, orcomparable. On the vertical axis, biological condition is also shown to vary from poor tooptimal, relative to reference conditions. The quality of the biological community can rangefrom 0% to 100% percent of the reference, and can be categorized as severely impaired,moderately impaired, slightly impaired or non-impaired (Barbour and Stribling 1991).
The actual orientation of the relationship line between habitat quality and biological condition isnot fixed and in different ecological regions of Missouri may differ in the degree of linearity,slope and y-intercept. The actual regression line between habitat quality and biologicalcondition cannot be plotted until a larger database is available.
Figure 1Habitat vs. Biological Condition
This habitat assessment procedure is a modified version of the High Gradient and Low GradientHabitat Assessment found in the Rapid Bioassessment Protocols (Barbour et al. 1999). TheMissouri Department of Natural Resources, Air and Land Protection Division, EnvironmentalServices Program (MDNR, ALPD, ESP) has modified the assessment devices to increase theprecision and to reflect the conditions in Missouri.
Stream Habitat Assessment Project ProcedureEffective Date: August 12, 2003Page 6 of 40
Minimum qualifications of individuals that perform assessments as described in this procedureshould be a Bachelor of Science in a biological field along with at least 1 year of training under asenior aquatic biologist. Assessments should be done only when flow and depth conditions donot impair the ability of the investigator to efficiently or safely work in the stream.
2.0 Stream Reach Considerations
The length of stream evaluated for habitat is equal to a distance of approximately twenty timesthe average width of the stream. The average width of a stream is arrived at by randomlyselecting five cross section transects. At each transect the width of the stream at the top of thelower bank is measured. See Section 3.5 (Figure 3) for an example of the lower bank. After theaverage width is calculated the study reach is defined by measuring and marking ten sections ofstream, each equal to two average stream widths.
3.0 Riffle/Pool Prevalence
Riffle/Pool habitat assessment is appropriate for wadeable streams having a high gradient and aprevalence of riffles and runs, such as streams found in the Ozarks aquatic region (MissouriResource Assessment Partnership 2000). Further explanation of each parameter is provided inthe following sections. Data gathered for some parameters are recorded on the Worksheet forRiffle/Pool or Glide/Pool Habitat Assessment Forms (Appendix C) and later converted to anumeric score on the Riffle/Pool Habitat Assessment Form (Appendix A). For consistency it ishelpful if all study team members are involved in the scoring process.
3.1 Epifaunal Substrate/Available Cover: Bottom substrate/instream cover refers to theavailability of adequate habitat for a variety of aquatic benthic macroinvertebrates. Good habitatis provided by substrate that is stable and/or substrate with adequate interstitial space. Thepresence of cobble and coarse gravel incorporated into a heterogeneous mixture with smallgravel is considered to be optimal for creating good interstitial space. Wentworth's (1922)substrate particle size classification system is used to define cobble as 6-26 cm (2.5-10 inches)and coarse gravel as 3-6 cm (1.25-2.5 inches). Instream materials such as boulders, large woodydebris, snags, tree roots, submerged and emergent vegetation, and undercut banks provide stablehabitat on which a diverse assemblage of macroinvertebrates can also be found.
Estimating the percent area of each of the ten stream sections that has stable substrate and/or acobble/large gravel mixture scores this parameter. Each estimate is recorded on the Worksheetfor Riffle/Pool or Glide/Pool Habitat Assessment Forms (Appendix C). After all ten sections arecompleted the numbers are summed to arrive at a number between 1 and 1,000, the sum ismultiplied by 0.1 to convert to percent of the total stream reach and an appropriate score isassigned to the Riffle/Pool Habitat Assessment Form using criteria from Table 1.
Selected References: Wesche et al. 1985, Pearsons et al. 1992, Gorman 1988, Rankin 1991,Barbour and Stribling 1991, Plafkin et al. 1989, Platts et al. 1983, Osborne et al. 1991, Benke etal. 1984, Wallace et al. 1996, Barbour et al. 1999.

Stream Habitat Assessment Project ProcedureEffective Date: August 12, 2003Page 7 of 40
Table 1 - Epifaunal Substrate/Available Cover Scoring Criteria
Percent of stream with stable substrate and/orcobble/large gravel substrate
Score
> 50% 16-20
50%-30.1% 15-11
30%-10.1% 10-6
10%-0% 5-0
3.2 Embeddedness: Embeddedness refers to how much of the surface area of large substrateparticles is surrounded by fine sediment or sand. Higher levels of sediment are thought to becorrelated with lower biotic productivity. Platts et al. (1983) first used the term embeddedness torate the degree that large channel or riffle particles (boulder, cobble, and large gravel) weresurrounded or covered by fine sediments. They initiated the use of a five point rating system toassess embeddedness based upon how much surface area of the larger particles were covered byfine sediments. A modified version of measuring embeddedness (Huggins and Moffett 1988) isto estimate the cross section area that is embedded. Often the embedded portion of the largeparticles are distinct due to the lack of periphyton growth or color differences resulting fromconditions associated with the fine sediment.
This parameter is scored by randomly selecting sixteen pieces of surface cobble or large gravelfrom at least two riffle areas. Each piece is evaluated by picking it up, viewing it from the sideand estimating the percent of the cross section that was embedded (see the example in Figure 2). The percentage embeddedness is recorded on the Worksheet for Riffle/Pool or Glide/PoolHabitat Assessment Forms, then each is assigned to one of four general categories. After allsixteen pieces have been evaluated the predominant category is selected and an appropriate scoreis assigned to the Riffle/Pool Habitat Assessment Form using criteria from Table 2:
Selected References: Ball 1982, Osborne et al. 1991, Barbour and Stribling 1991, Platts et al.1983, MacDonald et al. 1991, Rankin 1991, Reice 1980, Clements 1987, Benke et al. 1984,Hawkins et al. 1982, Burton and Harvey 1990, Barbour et al. 1999.
Table 2 - Embeddedness Scoring Criteria
Predominant Category Percent Score
I 0-25% 20-16
II 25.1-50% 15-11
III 50.1-75% 10-6
IV >75% 5-0

Stream Habitat Assessment Project ProcedureEffective Date: August 12, 2003Page 8 of 40
Figure 2 – Example of Embeddedness
The following figures demonstrate the categories of embeddedness. Examination ofeight surface-occurring cobble-sized stones reveals that individual stones may vary inembeddedness. The predominant level of embeddedness determines the score in thisexample.
Example (Category 2): Examination of eight, surface-occurring, cobble-sized stones reveal thatindividual stones may vary in embeddedness but the predominant level of embeddedness in thisexample equals Category 2 (26%-50%)
Individual Cobble 1 2 3 4 5 6 7 8Estimate of % Embeddedness 50 80 35 60 30 40 10 50Category 2 4 2 3 2 2 1 2

Stream Habitat Assessment Project ProcedureEffective Date: August 12, 2003Page 9 of 40
3.3 Velocity/Depth Regime: The size of a stream is known to influence the structure andfunction of its aquatic communities. This parameter rates the quality of stream flow with respectto 1) the amount of water in small streams and; 2) the variety of velocity-depth regimes in largerstreams and rivers. The presence of four general regimes of velocity and depth are optimal forbenthic and fish communities: 1) slow, shallow; 2) slow, deep; 3) fast, shallow; 4) fast, deep. Definitions of velocity and depth categories are: Slow, < 1 f/s; fast, > 1 f/s; shallow, < 1.6 ft; anddeep, > 1.6 ft. Habitat quality is reduced in the absence of one or more of these categories. Characteristics of water current largely determine substrate quality, and, by implication, thestructure and composition of benthic communities (Minshall 1984). See the Flow Measurementin Open Channels Standard Operating Procedure (MDNR 2003b) for information onmeasurement of stream velocity. Streams are scored on the Riffle/Pool Habitat AssessmentForm using criteria from Table 3.
Selected References: Hupp and Simon 1991, Ball 1982, Brown and Brussock 1991, Brussockand Brown 1991, Platts et al. 1983, Rankin 1991, Rosgen 1985, 1994, 1996, Osborne andHendricks 1983, Hughes and Omernik 1983, Cushman 1985, Gore and Judy 1981, Bain andBoltz 1989, Gislason 1985, Hawkins et al. 1982, Oswood and Barber 1982, Statzner et al. 1988,Barbour et al. 1999.
Table 3 - Velocity/Depth Regime Scoring Criteria
Velocity/Depth Regime Score
Slow-deep; slow-shallow; fast-deep and; fast-shallow 20-16
Three of the four regimes 15-11
Two of the four regimes 10-6
Dominated by one regime 5-0
3.4 Sediment Deposition: The character of above water sediment deposits is an indication of theseverity of watershed and bank erosion and allows a rough estimation of stream stability. Deposits are generally found on the downstream side of rocks and logs, on the inside of bends,below channel constrictions and where stream gradient flattens out. These deposits tend to growin depth and length with continued watershed disturbance. An actively growing deposit cangenerally be recognized by lack of vegetation and the loose consistency of the depositionalmaterials. This parameter is estimated along the entire stream reach, recorded on the worksheet,and scored on the Riffle/Pool Habitat Assessment Form using criteria from Table 4.
Selected References: MacDonald et al. 1991, Platts et al. 1983, Ball 1982, Armour et al. 1991,Barbour and Stribling 1991, Rosgen 1985, Barbour et al. 1999.

Stream Habitat Assessment Project ProcedureEffective Date: August 12, 2003Page 10 of 40
Table 4 - Sediment Deposition Scoring Criteria
Condition of island or point bar Score
Little or no enlargement of island or point bars, <5% of bottom affectedby sediment deposition.
20-16
Some new increase in bar formation, mostly from coarse gravel, 5-30%of bottom affected by sediment deposition.
15-11
Moderate deposition of new gravel and coarse sand on old and new bars,30.1-50% of bottom affected by sediment deposition.
10-6
Heavy deposits of fine material, increased bar development, >50% ofbottom affected by sediment deposition.
5-0
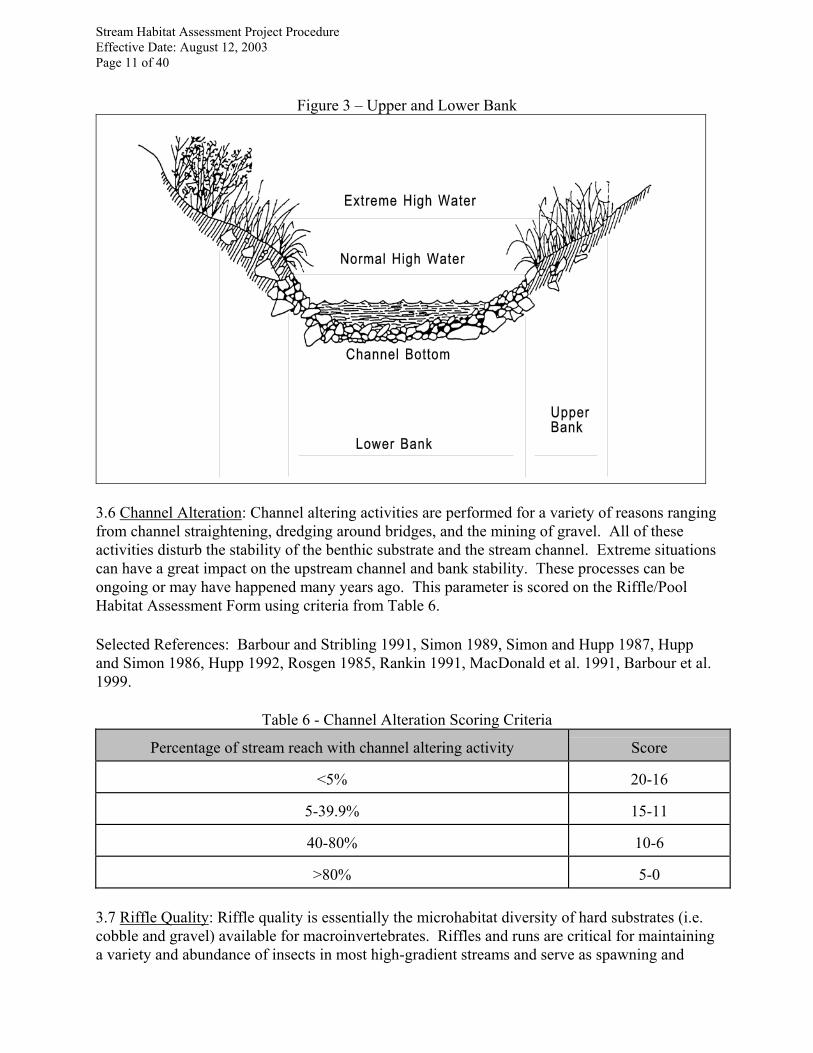
3.5 Channel Flow Status: Stream forms in Missouri vary from wide and shallow to narrow anddeep. The lower bank is the intermittently submerged portion of the stream cross-section fromthe normal high-water line to the channel bottom and is commonly unvegetated. Within thelower bank the water depth can exhibit a variety of width to depth ratios. The importantcomponent of stream integrity is the maintenance of a channel in which most of the availablesubstrate is in the wetted channel. Figure 3 is a diagram that demonstrates the lower and upperbanks. This parameter is scored on the Riffle/Pool Habitat Assessment Form using criteria fromTable 5.
Selected References: Rankin 1991, Rosgen 1985, Hupp and Simon 1986, MacDonald et al.1991, Ball 1982, Hicks et al. 1991, Barbour et al. 1999.
Table 5 - Channel Flow Status Scoring Criteria
Wetted channel Score
100% between lower banks 20-16
99.9-75% between lower banks 15-11
74.9 –25% 10-6
<25% 5-0
Stream Habitat Assessment Project ProcedureEffective Date: August 12, 2003Page 11 of 40
Figure 3 – Upper and Lower Bank
3.6 Channel Alteration: Channel altering activities are performed for a variety of reasons rangingfrom channel straightening, dredging around bridges, and the mining of gravel. All of theseactivities disturb the stability of the benthic substrate and the stream channel. Extreme situationscan have a great impact on the upstream channel and bank stability. These processes can beongoing or may have happened many years ago. This parameter is scored on the Riffle/PoolHabitat Assessment Form using criteria from Table 6.
Selected References: Barbour and Stribling 1991, Simon 1989, Simon and Hupp 1987, Huppand Simon 1986, Hupp 1992, Rosgen 1985, Rankin 1991, MacDonald et al. 1991, Barbour et al.1999.
Table 6 - Channel Alteration Scoring Criteria
Percentage of stream reach with channel altering activity Score
<5% 20-16
5-39.9% 15-11
40-80% 10-6
>80% 5-0
3.7 Riffle Quality: Riffle quality is essentially the microhabitat diversity of hard substrates (i.e.cobble and gravel) available for macroinvertebrates. Riffles and runs are critical for maintaininga variety and abundance of insects in most high-gradient streams and serve as spawning and

Stream Habitat Assessment Project ProcedureEffective Date: August 12, 2003Page 12 of 40
feeding refugia for certain fish. The extent and quality of the riffle is an important factor in thesupport of a healthy biological condition in high-gradient streams. This parameter is scored onthe Riffle/Pool Habitat Assessment Form using criteria from Table 7.
Selected References: Ball 1982, Osborne et al. 1991, Barbour and Stribling 1991, Platts et al.1983, MacDonald et al. 1991, Rankin 991, Reice 1980, Clements 1987, Hawkins et al. 1982,Barbour et al. 1999.
Table 7 – Riffle Quality Scoring Criteria
Riffle condition Score
Riffle as wide as stream and length extends two times the width ofstream; abundance of cobble.
20-16
Riffle as wide as stream but length is less than two times width,abundance of cobble; gravel common.
15-11
Run area may be lacking, riffle is wide as stream and its length is lessthan 2 times the stream width; gravel or bedrock prevalent, some cobble
present.
10-6
Riffles or runs virtually nonexistent; bedrock prevalent; cobble lacking. 5-0
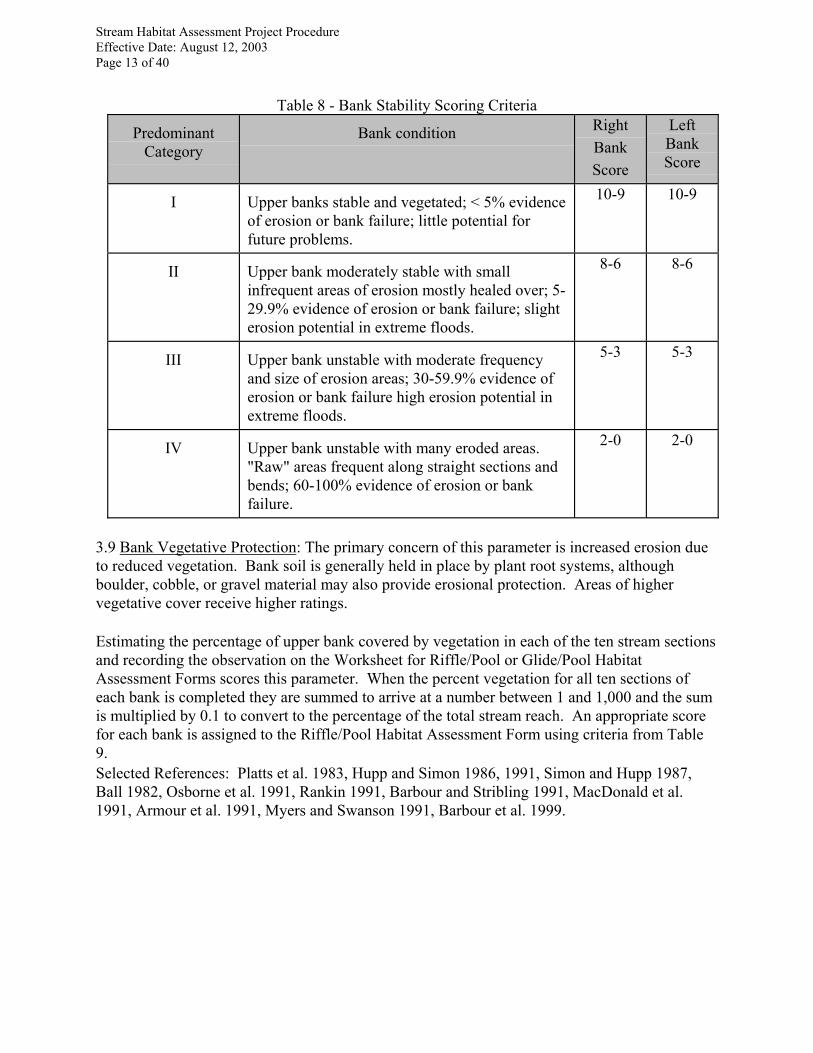
3.8 Bank Stability: The upper bank (Figure 3) is the land area from the break in the general slopeof the surrounding land to the top of the lower bank. It is normally vegetated and is covered bywater in only extreme high water periods. The likelihood of erosion is usually increased with thesteepness of the upper bank, since such banks often will not support vegetation. Streams withpoor banks will often have poor instream habitat. Minor adjustments can be made in areas whereclay composition, riprapping, or other human activities reduce erosion potential.
This parameter is evaluated by assigning both banks on each of the ten stream sections to one offour categories on the Worksheet for Riffle/Pool or Glide/Pool Habitat Assessment Forms. Afterall ten sections are assigned the predominant category is selected and scored on the Riffle/PoolHabitat Assessment Form using criteria from Table 8.
Selected References: Ball 1982, MacDonald et al. 1991, Armour et al. 1991, Barbour andStribling 1991, Hupp and Simon 1986, Simon 1989, Hupp 1992, Hicks et al. 1991, Osbourne etal. 1991, Rosgen 1994, 1996, Barbour et al. 1999.
Stream Habitat Assessment Project ProcedureEffective Date: August 12, 2003Page 13 of 40
Table 8 - Bank Stability Scoring Criteria
PredominantCategory
Bank condition RightBankScore
LeftBankScore
I Upper banks stable and vegetated; < 5% evidenceof erosion or bank failure; little potential forfuture problems.
10-9 10-9
II Upper bank moderately stable with smallinfrequent areas of erosion mostly healed over; 5-29.9% evidence of erosion or bank failure; slighterosion potential in extreme floods.
8-6 8-6
III Upper bank unstable with moderate frequencyand size of erosion areas; 30-59.9% evidence oferosion or bank failure high erosion potential inextreme floods.
5-3 5-3
IV Upper bank unstable with many eroded areas. "Raw" areas frequent along straight sections andbends; 60-100% evidence of erosion or bankfailure.
2-0 2-0
3.9 Bank Vegetative Protection: The primary concern of this parameter is increased erosion dueto reduced vegetation. Bank soil is generally held in place by plant root systems, althoughboulder, cobble, or gravel material may also provide erosional protection. Areas of highervegetative cover receive higher ratings.
Estimating the percentage of upper bank covered by vegetation in each of the ten stream sectionsand recording the observation on the Worksheet for Riffle/Pool or Glide/Pool HabitatAssessment Forms scores this parameter. When the percent vegetation for all ten sections ofeach bank is completed they are summed to arrive at a number between 1 and 1,000 and the sumis multiplied by 0.1 to convert to the percentage of the total stream reach. An appropriate scorefor each bank is assigned to the Riffle/Pool Habitat Assessment Form using criteria from Table9.Selected References: Platts et al. 1983, Hupp and Simon 1986, 1991, Simon and Hupp 1987,Ball 1982, Osborne et al. 1991, Rankin 1991, Barbour and Stribling 1991, MacDonald et al.1991, Armour et al. 1991, Myers and Swanson 1991, Barbour et al. 1999.

Stream Habitat Assessment Project ProcedureEffective Date: August 12, 2003Page 14 of 40
Table 9 - Vegetative Protection Scoring CriteriaVegetation Left Bank Score Right Bank Score
>90% 10-9 10-9
90-70% 8-6 8-6
69.9-50% 5-3 5-3
<50% 2-0 2-0
3.10 Riparian Vegetative Zone Width: The riparian vegetative zone width rates the entireriparian buffer zone on both sides of the stream. Decreasing buffer zone width is negativelycorrelated with shade (Lafferty 1987; Bartholow 1989), thus demonstrating its impact on watertemperature, photosynthetic activity, and other temperature-dependent enzyme-mediatedbiological processes. Buffer strips can also slow runoff and filter organic material and sedimentfrom entering the stream channel.
Assigning each of the ten stream sections to one of four categories and recording them on theWorksheet for Riffle/Pool or Glide/Pool Habitat Assessment Forms scores this parameter. Afterall ten sections for each bank have been recorded the predominant category is selected andscored on the Riffle/Pool Habitat Assessment Form using criteria from Table 10.
Selected References: Barton et al. 1985, Naiman et al. 1993, Hupp 1992, Gregory et al. 1991,Platts et al. 1983, Rankin 1991, Barbour and Stribling 1991, Barbour et al. 1999.
Table 10 - Riparian Vegetative Zone Width Scoring CriteriaPredominant
CategoryRiparian Vegetative Condition Left Bank
ScoreRight Bank
Score
I Riparian zone > 18 meters 10-9 10-9
II Riparian zone 17.9-12 meters 8-6 8-6
III Riparian zone 11.9-6 meters 5-3 5-3
IV Riparian zone < 6 meters 2-0 2-0
Stream Habitat Assessment Project ProcedureEffective Date: August 12, 2003Page 15 of 40
4.0 Glide/Pool Prevalence
Many of the parameters for Glide/Pool Prevalence are identical to those presented for assessmentof Riffle/Pool Prevalence, except for two primary parameters and one secondary parameter. Thishabitat assessment is used when evaluating low gradient streams such as those found in theMississippi Alluvial Plains and Prairie aquatic regions of Missouri (Missouri ResourceAssessment Partnership 2000). Information that is ascertained from most parameters is recordedon the Worksheet for Riffle/Pool or Glide/Pool Habitat Assessment Forms and later converted toa numeric score on the Glide/Pool Habitat Assessment Form (Appendix B). For consistency it ishelpful if all study team members are involved in the scoring process.
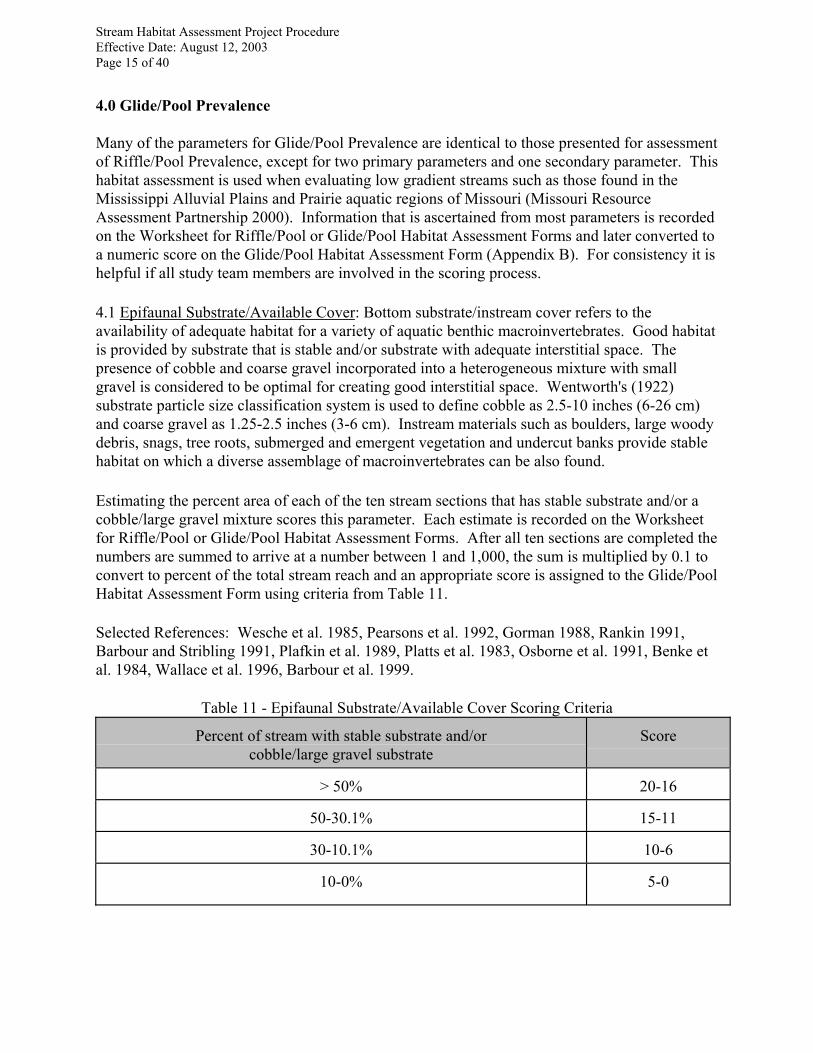
4.1 Epifaunal Substrate/Available Cover: Bottom substrate/instream cover refers to theavailability of adequate habitat for a variety of aquatic benthic macroinvertebrates. Good habitatis provided by substrate that is stable and/or substrate with adequate interstitial space. Thepresence of cobble and coarse gravel incorporated into a heterogeneous mixture with smallgravel is considered to be optimal for creating good interstitial space. Wentworth's (1922)substrate particle size classification system is used to define cobble as 2.5-10 inches (6-26 cm)and coarse gravel as 1.25-2.5 inches (3-6 cm). Instream materials such as boulders, large woodydebris, snags, tree roots, submerged and emergent vegetation and undercut banks provide stablehabitat on which a diverse assemblage of macroinvertebrates can be also found.
Estimating the percent area of each of the ten stream sections that has stable substrate and/or acobble/large gravel mixture scores this parameter. Each estimate is recorded on the Worksheetfor Riffle/Pool or Glide/Pool Habitat Assessment Forms. After all ten sections are completed thenumbers are summed to arrive at a number between 1 and 1,000, the sum is multiplied by 0.1 toconvert to percent of the total stream reach and an appropriate score is assigned to the Glide/PoolHabitat Assessment Form using criteria from Table 11.
Selected References: Wesche et al. 1985, Pearsons et al. 1992, Gorman 1988, Rankin 1991,Barbour and Stribling 1991, Plafkin et al. 1989, Platts et al. 1983, Osborne et al. 1991, Benke etal. 1984, Wallace et al. 1996, Barbour et al. 1999.
Table 11 - Epifaunal Substrate/Available Cover Scoring Criteria
Percent of stream with stable substrate and/orcobble/large gravel substrate
Score
> 50% 20-16
50-30.1% 15-11
30-10.1% 10-6
10-0% 5-0

Stream Habitat Assessment Project ProcedureEffective Date: August 12, 2003Page 16 of 40
4.2 Pool Substrate Characterization: Pools with a diverse mixture of substrates are rated higherthan those with a uniform substrate. This parameter is scored on the Glide/Pool HabitatAssessment Form using criteria from Table 12.
Selected References: Beschta and Platts 1986, U.S. EPA 1983, Barbour et al. 1999.
Table 12 - Pool Substrate Characterization Scoring Criteria
Pool substrate Score
Mixture of substrate materials with gravel and firm sand prevalent;rootmats, snags or submerged vegetation common.
20-16
Mixture of soft sand, mud or clay; mud may be dominant; some rootmats, snags or submerged vegetation.
15-11
All mud or clay or channelized with sand bottom; little or no root mat,snags or submerged vegetation.
10-6
Hardpan clay or bedrock; no root mat, snags or submerged vegetation. 5-0
4.3 Pool Variability: Pool variability rates the mixture of pool sizes within a stream reach. Thisvariability is essential in providing the habitat to support healthy aquatic communities (Platts etal. 1983). Colonization by benthic communities is in response to available habitat. A variety ofpool types will allow for a diversity of benthic macroinvertebrates, representing differentsensitivities and preferences. This parameter is scored on the Glide/Pool Habitat AssessmentForm using criteria from Table 13.
Selected References: Beschta and Platts 1986, U.S. EPA 1983, Barbour et al. 1999.
Table 13 - Pool Variability Scoring Criteria
Pool variability Score
Even mixture of deep, shallow, large and small pools present. 20-16
Majority of pools large and deep; very few shallow pools. 15-11
Shallow pools much more prevalent than deep pools. 10-6
Majority of pools small and shallow. 5-0
4.4 Sediment Deposition: The character of above water sediment deposits is an indication of theseverity of watershed and bank erosion and allows a rough estimation of stream stability. Deposits are generally found on the downstream side of rocks and logs, on the inside of bends,below channel constrictions and where stream gradient flattens out. These deposits tend to growin depth and length with continued watershed disturbance. An actively growing deposit cangenerally be recognized by lack of vegetation and the loose consistency of the depositionalmaterials. This parameter is estimated along the entire stream reach, recorded on the worksheet,

Stream Habitat Assessment Project ProcedureEffective Date: August 12, 2003Page 17 of 40
and scored on the Glide/Pool Habitat Assessment Form using criteria from Table 14.
Selected References: MacDonald et al. 1991, Platts et al. 1983, Ball 1982, Armour et al. 1991,Barbour and Stribling 1991, Rosgen 1985, Barbour et al. 1999.
Table 14 - Sediment Deposition Scoring Criteria
Condition of island or point bar Score
Little or no enlargement of island or point bars, <20% of bottom affectedby sediment deposition.
20-16
Some new increase in bar formation, mostly from coarse gravel, 20.1-50% of bottom affected by sediment deposition.
15-11
Moderate deposition of new gravel and coarse sand on old and new bars,50.1– 80% of bottom affected by sediment deposition.
10-6
Heavy deposits of fine material, increased bar development, >80%affected by sediment deposition.
5-0
4.5 Channel Flow Status: Stream forms in Missouri vary from wide and shallow to narrow anddeep. The lower bank is the intermittently submerged portion of the stream cross-section fromthe normal high-water line to the channel bottom and is commonly unvegetated. Within thelower bank the water depth can exhibit a variety of width to depth ratios. The importantcomponent of stream integrity is the maintenance of a channel in which most of the availablesubstrate is in the wetted channel. Figure 3 is a diagram that demonstrates the lower and upperbanks. This parameter is scored on the Glide/Pool Habitat Assessment Form using criteria fromTable 15.
Selected References: Rankin 1991, Rosgen 1985, Hupp and Simon 1986, MacDonald et al.1991, Ball 1982, Hicks et al. 1991, Barbour et al. 1999.
Table 15 - Channel Flow Status Scoring Criteria
Wetted channel Score
100% between lower banks 20-16
99.9-75% between lower banks 15-11
74.9-25% 10-6
<25% 5-0
4.6 Channel Alteration: Channel altering activities are performed for a variety of reasons rangingfrom channel straightening, dredging around bridges, and the mining of gravel. All of theseactivities disturb the stability of the benthic substrate and the stream channel. Extreme situationscan have a great impact on the upstream channel and bank stability. These processes can be
Stream Habitat Assessment Project ProcedureEffective Date: August 12, 2003Page 18 of 40
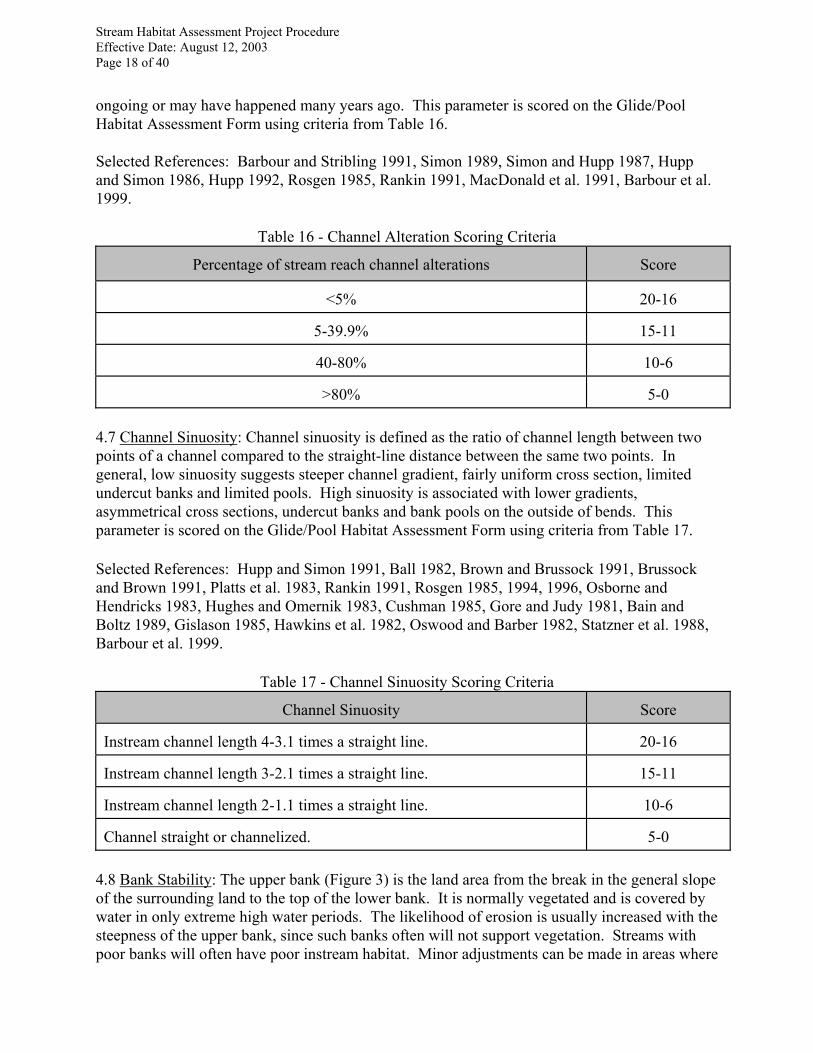
ongoing or may have happened many years ago. This parameter is scored on the Glide/PoolHabitat Assessment Form using criteria from Table 16.
Selected References: Barbour and Stribling 1991, Simon 1989, Simon and Hupp 1987, Huppand Simon 1986, Hupp 1992, Rosgen 1985, Rankin 1991, MacDonald et al. 1991, Barbour et al.1999.
Table 16 - Channel Alteration Scoring Criteria
Percentage of stream reach channel alterations Score
<5% 20-16
5-39.9% 15-11
40-80% 10-6
>80% 5-0
4.7 Channel Sinuosity: Channel sinuosity is defined as the ratio of channel length between twopoints of a channel compared to the straight-line distance between the same two points. Ingeneral, low sinuosity suggests steeper channel gradient, fairly uniform cross section, limitedundercut banks and limited pools. High sinuosity is associated with lower gradients,asymmetrical cross sections, undercut banks and bank pools on the outside of bends. Thisparameter is scored on the Glide/Pool Habitat Assessment Form using criteria from Table 17.
Selected References: Hupp and Simon 1991, Ball 1982, Brown and Brussock 1991, Brussockand Brown 1991, Platts et al. 1983, Rankin 1991, Rosgen 1985, 1994, 1996, Osborne andHendricks 1983, Hughes and Omernik 1983, Cushman 1985, Gore and Judy 1981, Bain andBoltz 1989, Gislason 1985, Hawkins et al. 1982, Oswood and Barber 1982, Statzner et al. 1988,Barbour et al. 1999.
Table 17 - Channel Sinuosity Scoring Criteria
Channel Sinuosity Score
Instream channel length 4-3.1 times a straight line. 20-16
Instream channel length 3-2.1 times a straight line. 15-11
Instream channel length 2-1.1 times a straight line. 10-6
Channel straight or channelized. 5-0
4.8 Bank Stability: The upper bank (Figure 3) is the land area from the break in the general slopeof the surrounding land to the top of the lower bank. It is normally vegetated and is covered bywater in only extreme high water periods. The likelihood of erosion is usually increased with thesteepness of the upper bank, since such banks often will not support vegetation. Streams withpoor banks will often have poor instream habitat. Minor adjustments can be made in areas where
Stream Habitat Assessment Project ProcedureEffective Date: August 12, 2003Page 19 of 40
clay composition, riprapping, or other human activities reduce erosion potential.
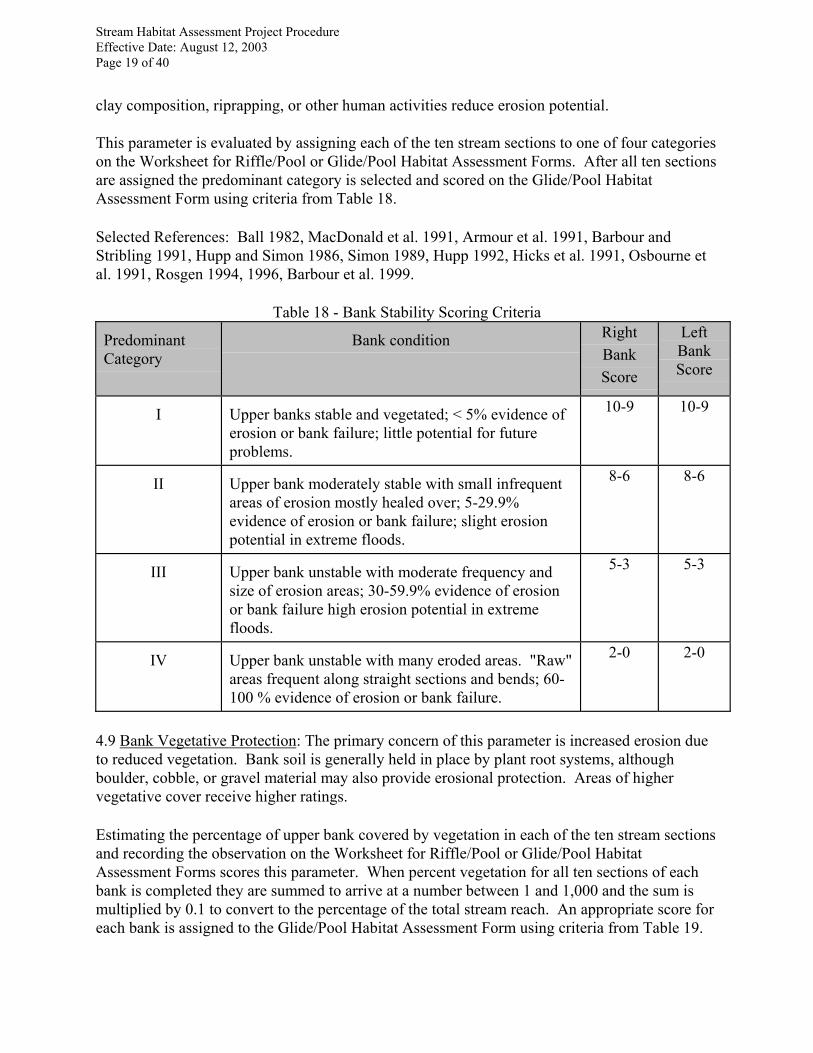
This parameter is evaluated by assigning each of the ten stream sections to one of four categorieson the Worksheet for Riffle/Pool or Glide/Pool Habitat Assessment Forms. After all ten sectionsare assigned the predominant category is selected and scored on the Glide/Pool HabitatAssessment Form using criteria from Table 18.
Selected References: Ball 1982, MacDonald et al. 1991, Armour et al. 1991, Barbour andStribling 1991, Hupp and Simon 1986, Simon 1989, Hupp 1992, Hicks et al. 1991, Osbourne etal. 1991, Rosgen 1994, 1996, Barbour et al. 1999.
Table 18 - Bank Stability Scoring Criteria
PredominantCategory
Bank condition RightBankScore
LeftBankScore
I Upper banks stable and vegetated; < 5% evidence oferosion or bank failure; little potential for futureproblems.
10-9 10-9
II Upper bank moderately stable with small infrequentareas of erosion mostly healed over; 5-29.9%evidence of erosion or bank failure; slight erosionpotential in extreme floods.
8-6 8-6
III Upper bank unstable with moderate frequency andsize of erosion areas; 30-59.9% evidence of erosionor bank failure high erosion potential in extremefloods.
5-3 5-3
IV Upper bank unstable with many eroded areas. "Raw"areas frequent along straight sections and bends; 60-100 % evidence of erosion or bank failure.
2-0 2-0
4.9 Bank Vegetative Protection: The primary concern of this parameter is increased erosion dueto reduced vegetation. Bank soil is generally held in place by plant root systems, althoughboulder, cobble, or gravel material may also provide erosional protection. Areas of highervegetative cover receive higher ratings.
Estimating the percentage of upper bank covered by vegetation in each of the ten stream sectionsand recording the observation on the Worksheet for Riffle/Pool or Glide/Pool HabitatAssessment Forms scores this parameter. When percent vegetation for all ten sections of eachbank is completed they are summed to arrive at a number between 1 and 1,000 and the sum ismultiplied by 0.1 to convert to the percentage of the total stream reach. An appropriate score foreach bank is assigned to the Glide/Pool Habitat Assessment Form using criteria from Table 19.

Stream Habitat Assessment Project ProcedureEffective Date: August 12, 2003Page 20 of 40
Selected References: Platts et al. 1983, Hupp and Simon 1986, 1991, Simon and Hupp 1987,Ball 1982, Osborne et al. 1991, Rankin 1991, Barbour and Stribling 1991, MacDonald et al.1991, Armour et al. 1991, Myers and Swanson 1991, Barbour et al. 1999.
Table 19 - Vegetative Protection Scoring CriteriaVegetation Left Bank Score Right Bank Score
>90% 10-9 10-9
90-70% 8-6 8-6
69.9-50% 5-3 5-3
<50% 2-0 2-0
4.10 Riparian Vegetative Zone Width: The riparian vegetative zone width rates the entireriparian buffer zone on the side of the stream nearest to disruption (row crop, pasture, highway,surface mines, housing development, golf course, etc.). Decreasing buffer zone width isnegatively correlated with shade (Lafferty 1987; Barthalow 1989), thus demonstrating its impacton water temperature, photosynthetic activity, and other temperature-dependent enzyme-mediated biological processes. Buffer strips can also slow runoff and filter organic material andsediment from entering the stream channel.
Assigning each of the ten stream sections to one of four categories and recording them on theWorksheet for Riffle/Pool or Glide/Pool Habitat Assessment Forms scores this parameter. Afterall ten sections for each bank have been recorded the predominant category is selected andscored on the Glide/Pool Habitat Assessment Form using criteria from Table 20.
Selected References: Barton et al. 1985, Naiman et al. 1993, Hupp 1992, Gregory et al. 1991,Platts et al. 1983, Rankin 1991, Barbour and Stribling 1991, Barbour et al. 1999.
Table 20 - Riparian Vegetative Zone Width Scoring CriteriaPredominant
CategoryRiparian Vegetative Condition Left Bank
ScoreRight Bank
Score
I Riparian zone > 18 meters 10-9 10-9
II Riparian zone 17.9-12 meters 8-6 8-6
III Riparian zone 11.9-6 meters 5-3 5-3
IV Riparian zone < 6 meters 2-0 2-0

Stream Habitat Assessment Project ProcedureEffective Date: August 12, 2003Page 21 of 40
5.0 Physical Characterization/Water Quality
As part of the habitat assessment a Physical Characterization/Water Quality Data Form(Appendix D) should be completed at all sites. This form has sections for recording generalinformation, physical features, sediment quality, substrate types, water quality, periphytoncharacteristics, macrophyte characteristics and photography/sketch information. Furtherexplanation is provided for the general information, physical features and water qualityparameters.
5.1 General Information
5.1.1 Date: The date format is Day/Month/Year (example: 15 September 1995).
5.1.2 Time: The time format is HH/MM (example: 14:05).
5.1.3 Latitude/Longitude: Latitude and Longitude data will be collected at each study site andwill be done in accordance with Federal Interagency Coordinating Committee for DigitalCartography (FICCDC) recommendations. Methods of determining coordinates may involveremote sensing techniques or map interpolation of 1:24,000 topographic maps. The format forrepresenting this information is +/- DD/MM/SS.SSSS (Latitude) and +/- DDD/MM/SS.SSSS(Longitude).
Where: 1) Latitude is always presented before longitude; 2) DD represents degrees of latitude, atwo digit decimal number ranging from 00 through 90; 3) DDD represents degrees of longitude,a three digit decimal number ranging from 000 through 180; 4) M represents minutes of latitudeor longitude, a two digit number ranging from 00 through 60; 5) SS.SSSS represents seconds oflatitude and longitude, with a format allowing possible precision to the ten thousandths ofseconds; 6) + Specifies latitude north of the equator or longitude east of the prime meridian; and 7) - Specifies latitude south of the equator or longitude west of the prime meridian.
5.1.4 USGS #/Reach #: When there is a need to refer to a stream segment which may be ofinterest the USGS Reach # can be used to identify the stream section. The USGS Reach # is aneight digit number (USGS #) followed by a six digit number (Reach #). The six-digit reachnumber will always have zeros in the first and fourth places. These numbers are used by MDNRin the NPDES permitting process and for location of data collected from the stream section.
5.1.5 Waterbody #: The Waterbody # is a MDNR number that corresponds to each section ofstream listed in the Missouri Water Quality Standards. In many cases the Waterbody #represents a smaller stream section than the USGS Reach #. The Waterbody # is a four digitnumber ranging from 0001 through 7358.
5.1.6 Legal Coordinates: Legal coordinates will be determined from the appropriate 1:24,000topographic maps. They will be reported in the standard format of Section/Township/Range(example: NW 1/4, NW 1/4, Sec. 24, T 24 N, R 5 W).
Stream Habitat Assessment Project ProcedureEffective Date: August 12, 2003Page 22 of 40
5.2 Physical Features
5.2.1 Drainage Area: The drainage area can be closely approximated from a 1:24,000topographic map. The drainage area can be traced on an acetate overlay by carefully outliningthe highest elevation surrounding the watershed of interest. A one square mile grid can then besuperimposed over the watershed area from which grids can be counted. Partial estimates can bemade at the 3/4, 1/2 and 1/4 square mile levels. The total area is rounded off and expressed tothe nearest square mile. If a computer and digitizing tablet are available the watershed area canbe digitized and the area computed.
5.2.2 Gradient: Gradient will be estimated using a 1:24,000 topographic map. The measurementstarting point is the first intersection of the stream and a contour line upstream from the samplingsite and the endpoint is the first intersection of the stream and a contour line downstream fromthe sampling point. Following the course of the stream, the distance between the two contourlines is measured using a planimeter and converted to miles. If computer and softwareequipment are available a digitizing tablet can be used to measure distance. The change inelevation between start and endpoint is divided by the segment length. The results are expressedas the number of feet per mile change in stream elevation.
5.2.3 Velocity and Discharge: See the Standard Operating Procedure, Flow Measurement inOpen Channels (MDNR 2003b) for information on the determination of velocity and discharge.
5.2.4 Stream Order: Stream Order is to be determined through the use of 1:24,000 topographicmaps. The first headwater stream shown is considered a first order stream. Thereafter, order issequentially increased when two streams of the same size join (example: two first order streamsjoining equals a second order stream; two second order streams joining equals a third orderstream; etc.). Stream orders range from one through six for permanent wadeable Missouristreams, with orders three through five being most common.
5.3 Water Quality
5.3.1 Temperature: Normal temperature measurements may be made with any good qualitymercury-filled Celsius thermometer. As a minimum, the thermometer should have a scalemarked for every 1.0 °C. Make the readings with the thermometer immersed in water longenough to complete equilibration and report the results to the nearest 0.5 C°. See StandardOperating Procedure, Field Measurement of Water Temperature (MDNR 2003a) for moreinformation.
5.3.2 Dissolved Oxygen: The ability of a body of water to support life is dependent on the levelof dissolved oxygen (DO) contained within it. The level of DO in natural water depends on thephysical, chemical and biochemical activities in the body of water. The optimal level of DO tosupport aquatic life is greater than 5.0 mg/l for cool-warm waters (6.0 mg/l for cold waters). Accurate DO levels can be determined with relative ease through the use of a membraneelectrode meter. The manufacturer’s directions for maintenance and use of the meter must befollowed. See Standard Operating Procedure, Sample Collection and Field Analysis forDissolved Oxygen Using A Membrane Electrode Meter (MDNR 2002) for more information.

Stream Habitat Assessment Project ProcedureEffective Date: August 12, 2003Page 23 of 40
5.3.3 pH: The pH value of a solution represents hydrogen ion activity. Natural waters usuallyhave pH values in the range of 4 to 9, and most are slightly basic because of the presence ofbicarbonates and carbonates of the alkali and alkaline earth metals. The most accurate fieldmeasurement is done by potentiometric measurement using a glass electrode and referenceelectrode. The manufacturer's directions for use and maintenance of the pH meter must befollowed. See Standard Operating Procedure, Field Analysis for pH (MDNR 2001) for moreinformation.
5.3.4 Conductivity: Conductivity is a numerical expression of the ability of an aqueous solutionto carry an electrical current. This ability depends upon the presence of ions, their totalconcentration, mobility, valence, relative concentrations, and the temperature of measurement.Solutions of most inorganic acids, bases, and salts are relatively good conductors. Freshlydistilled water, a poor conductor, has a conductivity of 0.5 to 2 umhos/cm. The conductivity ofpotable waters in the United States generally ranges from 50 to 1500 umhos/cm (StandardMethods for the Examination of Water and Wastewater 1992). The manufacturer's directions forthe use and maintenance of the selected conductivity meter must be followed. See StandardOperating Procedure, Field Analysis of Specific Conductance (MDNR 2000) for moreinformation.
5.3.5 Alkalinity: Alkalinity of water is its acid-neutralizing capacity. Because the alkalinity ofmany surface waters is primarily a function of carbonate, bicarbonate and hydroxide content, it istaken as an indicator of the concentration of these constituents. The measured value also mayinclude contributions from borates, phosphates, silicates or other bases if these are present. Accurate levels may be determined with relative ease through the use of compact titrimetric testkits which are based upon the procedures used in Standard Methods for the Examination ofWater and Wastewater. Test kits are available from many scientific supply companies.
5.3.6 Hardness: Total hardness is defined as the sum of the calcium and magnesiumconcentrations, both expressed as calcium carbonate, in milligrams per liter. When numericalhardness is greater than the sum of carbonate and bicarbonate alkalinity, the amount of hardnessequivalent to total alkalinity is called "carbonate hardness" and the amount of hardness in excessof this is called "noncarbonate hardness". When the numerical hardness is equal to or less thanthe sum of carbonate and bicarbonate alkalinity, all hardness is carbonate hardness and non-carbonate hardness is absent. Approximate levels of hardness can be determined through the useof EDTA titration test kits available from many scientific supply companies.
Stream Habitat Assessment Project ProcedureEffective Date: August 12, 2003Page 24 of 40
6.0 Literature Cited
Armour, C.L., D.A. Duff, and W. Elmore. 1991. The effects of livestock grazing on streamecosystems. Fisheries 16(1):7-11.
Bain, M.B. and J.M. Boltz. 1989. Regulated streamflow and warmwater stream fish: Ahypothesis and research agenda. U.S. Fish and Wildlife Service Biological Report 89(18):1-28.
Ball, J. 1982. Stream Classification Guidelines for Wisconsin. Wisconsin Department ofNatural Resources Technical Bulletin. Wisconsin Department of Natural Resources, Madison,Wisconsin.
Barbour, M.T., and J.B. Stribling. 1991. Use of habitat assessment in evaluating the biologicalintegrity of stream communities. In George Gibson, editor. Biological criteria: Research andregulation, proceedings of a symposium, 12-13 December 1990, Arlington, Virginia. Office ofWater, U.S. Environmental Protection Agency, Washington, D.C. EPA-440-5-91-005
Barbour, M., J. Gerritsen, B.D. Snyder, and J.B. Stribling. 1999. Rapid BioassessmentProtocols for Use in Streams and Wadeable rivers: Periphyton, Benthic Macroinvertebrates, andFish. Second Edition. EPA 841-B-99-002. United States Environmental Protection Agency.Office of Water, Washington, D.C.
Barthalow, J.M. 1989. Stream Temperature Investigations: Field and Analytical Methods. Instream flow information paper 13. Biological Report 89(17). Fish & Wildlife Service, U.S.Dept. Inter. Washington, DC.
Barton, D.R., W.D. Taylor, and R.M. Biette. 1985. Dimensions of riparian buffer stripsrequired to maintain trout habitat in southern Ontario streams. North American Journal ofFisheries Management 5:364-378.
Benke, A.C., T.C. Van Arsdall, Jr., and D.M. Gillespie. 1984. Invertebrate productivity in asubtropical blackwater river: The importance of habitat and life history. Ecological Monographs54(1):25-63.
Beschta, R.L. and W.S. Platts. 1986. Morphological features of small streams: Significance andfunction. Water Resources Bulletin 22(3):369-379.
Brown, A.V. and P.P. Brussock. 1991. Comparisons of benthic invertebrates between rifflesand pools. Hydrobiologia 220:99-108.
Brussock, P.P. and A.V. Brown. 1991. Riffle-pool geomorphology disrupts longitudinalpatterns of stream benthos. Hydrobiologia 220:109-117.
Buchanan, T.J. and W.P. Sommers. 1969. Discharge measurements at gauging stations. Techniques of Water-Resources Investigators of the U.S. Geological Survey, Book 3, ChapterA8. U.S. Geological Survey, Washington, DC. 65pp.

Stream Habitat Assessment Project ProcedureEffective Date: August 12, 2003Page 25 of 40
Burton, T.A. and G.W. Harvey. 1990. Estimating intergravel salmonid living space using thecobble embeddedness sampling procedure. Water Quality Monitoring Protocols - Report No. 2.Idaho Department of Health and Welfare, Division of Environmental Quality, Water QualityBureau, Boise, Idaho. September.
Clements, W.H. 1987. The effect of rock surface area on distribution and abundance of streaminsects. Journal of Freshwater Ecology 4(1): 83-91.
Cushman, R.M. 1985. Review of ecological effects of rapidly varying flows downstream fromhydroelectric facilities. North American Journal of Fisheries Management 5:330-339.
Gislason, J.C. 1985. Aquatic insect abundance in a regulated stream under fluctuating andstable diel flow patterns. North American Journal of Fisheries Management 5:39-46.
Gore, J.A. and R.D. Judy, Jr. 1981. Predictive models of benthic macroinvertebrate density foruse in instream flow studies and regulated flow management. Canadian Journal of Fisheries andAquatic Sciences 38:1363-1370.
Gorman, O.T. 1988. The dynamics of habitat use in a guild of Ozark minnows. EcologicalMonographs 58(1):1-18.
Gregory, S.V., F.J. Swanson, W.A. McKee, and K.W. Cummins. 1991. An ecosystemperspective of riparian zones. BioScience 41(8):540-551.
Hamilton, K., and E.P. Bergersen. 1984. Methods to Estimate Aquatic Habitat Variables. Environmental Evaluation Project N. DPTS-35-9. Bureau of Reclamation, Denver FederalCenter, Denver, CO.
Hawkins, C.P., M.L. Murphy, and N.H. Anderson. 1982. Effects of canopy, substratecomposition, and gradient on the structure of macroinvertebrate communities in Cascade Rangestreams of Oregon. Ecology 63(6):1840-1856.
Hicks, B.J., R.L. Beschta, and R. D. Harr. 1991. Long-term changes in streamflow followinglogging in western Oregon and associated fisheries implications. Water Resources Bulletin27(2):217-226.
Huggins, D.C., and M.F. Moffett. 1988. Proposed Biotic and Habitat Indices for Use in KansasStreams. Report No. 35 of the Kansas Biological Survey, Lawrence, Kansas.
Hughes, R.M. and J.M. Omernik. 1983. An alternative for characterizing stream size. Pages 87-101 in T.D. Fontaine, III and S.M. Bartell (editors). Dynamics of Lotic Ecosystems. Ann ArborScience Publishers, Ann Arbor, Michigan.
Hupp, C.R. 1992. Riparian vegetation recovery patterns following stream channelization: Ageomorphic perspective. Ecology 73(4):1209-1226.

Stream Habitat Assessment Project ProcedureEffective Date: August 12, 2003Page 26 of 40
Hupp, C.R. and A. Simon. 1986. Vegetation and bank-slope development. Proceedings of theFourth Federal Interagency Sedimentation Conference 4:83-92.
Hupp, C.R. and A. Simon. 1991. Bank accretion and the development of vegetated depositionalsurfaces along modified alluvial channels. Geomorphology 4:111-124.
Lafferty, B. 1987. A procedure for evaluating buffer strips for stream temperature protectionunder the Forest Practices Act. Pages 70-77. In: Managing Oregon's Riparian Zone for Timber,Fish and Wildlife. Tech. Bull. No. 514. Nat. Coun. Air Stream Improvement. New York.
MacDonald, L.H., A.W. Smart, and R.C. Wissmar. 1991. Monitoring guidelines to evaluateeffects of forestry activities on streams in the Pacific Northwest and Alaska. Prepared for Region10, U.S. Environmental Protection Agency, Seattle, Washington. EPA 910/9-91-001.
Minshall, G.W. 1984. Aquatic insect substratum relationships. Page 358-400. In: V.H. Reshand D.M. Rosenburg, eds. The Ecology of Aquatic Insects. Praeger Publ, New York, N.Y.
Missouri Department of Natural Resources. 2003a. MDNR-FSS-101. Field Measurement ofWater Temperature. Air and Land Protection Division, Environmental Services Program,Jefferson City, MO. 3 pp.
Missouri Department of Natural Resources. 2003b. MDNR-WQMS-113. Flow Measurementin Open Channels. Air and Land Protection Division, Environmental Services Program,Jefferson City, MO. 9 pp.
Missouri Department of Natural Resources. 2003c. Semi-Quantitative MacroinvertebrateStream Bioassessment Project Procedure. Air and Land Protection Division, EnvironmentalServices Program, Jefferson City, MO. 24 pp.
Missouri Department of Natural Resources. 2002. MDNR-WQMS-103. Sample Collection andField Analysis for Dissolved Oxygen Using A Membrane Electrode Meter. Air and LandProtection Division, Environmental Services Program, Jefferson City, MO. 13 pp.
Missouri Department of Natural Resources. 2001. MDNR-FSS-100. Field Analysis of WaterSamples for pH. Air and Land Protection Division, Environmental Services Program, JeffersonCity, MO. 10 pp.
Missouri Department of Natural Resources. 2000. MDNR-FSS-102. Field Analysis of SpecificConductance. Air and Land Protection Division, Environmental Services Program, JeffersonCity, MO. 15 pp.
Missouri Department of Natural Resources. 1996. Rules of the Department of NaturalResources, Clean Water Commission, Water Quality 10 CSR 20-7. Division of EnvironmentalQuality, Water Pollution Control Program, Jefferson City, Mo. 136 pp.

Stream Habitat Assessment Project ProcedureEffective Date: August 12, 2003Page 27 of 40
Missouri Resource Assessment Partnership. 2000. Missouri Ecological Drainage Units (EDU). MoRAP map series 2000-001.
Myers, T.J. and S. Swanson. 1991. Aquatic habitat condition index, stream type, and livestockbank damage in northern Nevada. Water Resources Bulletin 27(4):667-677.
Naiman, R.J., H. Decamps, and M. Pollack. 1993. The role of riparian corridors in maintainingregional biodiversity. Ecological Applications 3(2):209-212.
Osborne, L.L. and E.E. Hendricks. 1983. Streamflow and Velocity as Determinants of AquaticInsect Distribution and Benthic Community Structure in Illinois. Water Resources Center,University of Illinois. U.S. Department of the Interior, Bureau of Reclamation. UILU-WRC-83-183.
Osborne, L.L., B. Dickson, M. Ebbers, R. Ford, J. Lyons, D. Kline, E. Rankin, D. Ross, R.Sauer, P. Seelbach, C. Speas, T. Stefanavage, J. Waite, and S. Walker. 1991. Stream habitatassessment programs in states of the AFS North Central Division. Fisheries 16(3):28-35.
Oswood, M.E. and W.E. Barber. 1982. Assessment of fish habitat in streams: Goals,constraints, and a new technique. Fisheries 7(3):8-11.
Pearsons, T.N., H.W. Li, and G.A. Lamberti. 1992. Influence of habitat complexity onresistance to flooding and resilience of stream fish assemblages. Transactions of the AmericanFisheries Society 121:427-436.
Plafkin, J.L., M.T. Barbour, K.D. Porter, S.K. Gross, and R.M. Hughes. 1989. RapidBioassessment Protocols for Use in Streams and Rivers: Benthic Macroinvertebrate and Fish. EPA/444/4-89-001. Washington, D.C.
Platts, W.S., W.F. Megahan, and G.W. Minshall. 1983. Methods for Evaluating StreamRiparian and Biotic Conditions. Gen. Tech. Rep. INT-138. Forest Service, U.S. Dept.Agriculture, Ogden, Utah. 177 pp.
Rankin, E.T. 1991. The use of the qualitative habitat evaluation index for use attainabilitystudies in streams and Rivers in Ohio. In George Gibson, editor. Biological Criteria: Researchand Regulation, Office of Water, U.S. Environmental Protection Agency, Washington, D.C. EPA440/5-91-005.
Reice, S.R. 1980. The role of substratum in benthic macroinvertebrate microdistribution andlitter decomposition in a woodland stream. Ecology 61:580-590.
Rosgen, D.L. 1985. A stream classification system. In Proceedings of the First North AmericanRiparian Conference Riparian Ecosystem and their Management: reconciling conflicting uses.U.S. Department of Agriculture Forest Service, Tucson, Arizona. General Technical Report RM-120.
Stream Habitat Assessment Project ProcedureEffective Date: August 12, 2003Page 28 of 40
Rosgen, D.L. 1994. A classification of natural rivers. Catena 22:169-199.
Rosgen, D. 1996. Applied river morphology. Wildland Hydrology Books, Pagosa Springs,Colorado.
Schuder, T.R. 1987. Controlling Urban Runoff: A Practical Manual for Planning and DesigningUrban BMPs. Publ. No. 87703. Metro. Washington Counc. Govts. Washington, DC.
Simon, A. 1989. The discharge of sediment in channelized alluvial streams. Water ResourcesBulletin 25(6):1177-1187.
Standard Methods for the Examination of Water and Wastewater. 1992. Published by theAmerican Health Association, American Water Works Association, and Water EnvironmentFederation, 18th edition. Washington, DC.
Statzner, B., J.A. Gore, and V.H. Resh. 1988. Hydraulic stream ecology: Observed patterns andpotential applications. Journal of the North American Benthological Society 7(4):307-360.
U.S. Environmental Protection Agency (U.S. EPA). 1983. Technical support manual:Waterbody surveys and assessments for conducting use attainability analyses. U.S.Environmental Protection Agency, Office of Water Regulations and Standards, Washington,D.C. Volumes 1-3.
United States Environmental Protection Agency. 1991. Biological Criteria: Guide to TechnicalLiterature. Office of Science and Technology, EPA-440/5-91-004, Washington, D.C.
Wallace, J.B., J.W. Grubaugh, and M.R. Whiles. 1996. Biotic indices and stream ecosystemprocesses: results from an experimental study. Ecological Applications (6):140-151.
Wesche, T.A., C.M. Goertler, C. B. Frye. 1985. Importance and evaluation of instream andriparian cover in smaller trout streams. Pages 325-328 in The Proceedings of the First NorthAmerican Riparian Conference Riparian Ecosystems and their Management: Reconcilingconflicting uses. U.S. Department of Agriculture Forest Service, General Technical Report TM-120. Tucson, Arizona.
Wentworth, C.K. 1922. A scale of grade and class terms for classic sediment. J. Geol. 30:377-392.

Stream Habitat Assessment Project ProcedureEffective Date: August 12, 2003Page 29 of 40
APPENDIX A
Riffle/Pool Habitat Assessment Form

Stream Habitat Assessment Project ProcedureEffective Date: August 12, 2003Page 30 of 40
Missouri Department of Natural ResourcesStream Habitat Assessment ProcedureRiffle/Pool Habitat Assessment Form
Date: Analyst: Station #:Sample #:
Location:
Habitat Parameter Optimal Suboptimal Marginal PoorA. Epifaunal substrate/ available cover
Greater than 50% mix ofcobble, large gravel,submerged logs, undercutbanks, or other stablehabitat.
20-16
A 50-30.1% mix ofcobble, large gravel, orother stable habitat. Habitat adequate formaintenance ofpopulations.
15-11
A 30-10.1% mix ofcobble, large gravel, orother stable habitat. Habitat less thandesirable. Substratefrequently disturbed orremoved.
10-6
Less than 10% mix ofcobble, large gravel, orother stable habitat. Lackof habitat is obvious. Substrate unstable orlacking.
5-0
B. Embeddedness
Gravel, cobble, orboulders are between 0-25% surrounded by finesediment or sand.
20-16
Gravel, cobble, orboulders are between25.1-50% surrounded byfine sediment or sand.
15-11
Gravel, cobble, orboulders are between50.1-75% surrounded byfine sediment or sand.
10-6
Gravel, cobble, orboulders are over 75%surrounded by finesediment or sand.
5-0
C Velocity/ depth regime
All four velocity/depthregimes present. Slow(<0.3 m/s) - deep (> 0.5 m); slow- shallow (< 0.5 m); fast(> 0.3 m/s) - deep ;fast-shallow.
20-16
Only 3 of the 4 regimespresent (if fast-shallow ismissing score lower thanif missing other regimes).
15-11
Only 2 of the 4 regimespresent (if fast-shallow orslow-shallow are missingreceive lower score).
10-6
Dominated by onevelocity/depth regime(usually slow-deep).
5-0
D. Sediment deposition
Little or no enlargementof islands or point bar andless than 5% of bottomaffected by sedimentdeposition.
20-16
Some new increase in barformation, mostly fromcoarse gravel, sand orfine sediment From 5-30% of bottom affectedby sediment deposits.Slight sedimentdeposition in pools.
15-11
Moderate deposition ofnew gravel, sand, orsediment on old and newbars; pools partially filledwith silt. From 30.1-50%of bottom affected.Deposits at obstructions,constrictions, and bends. Moderate deposition ofpools prevalent
10-6
Heavy deposits of finematerial, increased bardevelopment. More than50% of the bottomchanging frequently. Pools almost absent dueto substantial deposition.
5-0
E. Channel flow status
Water reaches base ofboth lower banks, andminimal amount ofchannel substrate isexposed
20-16
Water fills 99.9-75% ofthe available channel; or<25% of channelsubstrate exposed.
15-11
Water fills 74.9-25% ofthe available channel,and/or riffle substrates aremostly exposed
10-6
Very little water inchannel (<25%) andmostly present asstanding pools
5-0
F. Channel alteration
Channelization ordredging absent orminimal (<5%) streamwith normal pattern
20-16
Some channelizationpresent (5-39.9%),usually in areas of bridgeabutments; evidence ofpast channelization, i.e.dredging (greater than 20years) may be present,but recent channelizationis not present.
15-11
Channelization may beextensive; embankmentsor shoring structurespresent on both banks;and 40- 80% of streamreach channelizes ordisrupted.
10-6
Banks shored with gabionor cement; over 80% ofthe stream reachchannelized or disrupted. Instream habitat greatlyaltered or removedentirely
5-0

Stream Habitat Assessment Project ProcedureEffective Date: August 12, 2003Page 31 of 40
G. Riffle Quality Well developed riffle andrun; riffle is as wide asstream and length extendstwo times the width ofstream; abundance ofcobble.
20-16
Riffle is as wide asstream but length is lessthan two times width;abundance of cobble;gravel common.
15-11
Run area may be lacking;riffle not as wide asstream and its length isless than 2 times thestream width; gravel orbedrock prevalent; somecobble present.
10-6
Riffles or runs virtuallynonexistent; bedrockprevalent; cobble lacking.
5-0
H. Bank stability - Score each bank
Left Bank
Right Bank
Bank stable; evidence oferosion or bank failureabsent or minimal; littlepotential for futureproblems; <5% of bankaffected.
10-9
10-9
Moderately stable;infrequent, small areas oferosion, mostly healedover; 5-29.9% of bank inreach has areas oferosion.
8-6
8-6
Moderate unstable; 30-59.9% of bank in reachhas areas of erosion; higherosion potential duringfloods.
5-3
5-3
Unstable; many erodedareas; "Raw" areasfrequent along straightsections and bends;obvious bank sloughing ;60- 100% of bank haserosion scars.
2-0
2-0
I. Vegetative protection – Score each bank
Left Bank
Right Bank
More than 90% of thestreambank surfaces andimmediate riparian zonecovered by nativevegetation, includingtrees, understory, orherbaceous growth;vegetative disruptionthrough grazing ormowing minimal or notevident; almost all plantsallowed to grownaturally.
10-9
10-9
90-70% of thestreambank surfacecovered by nativevegetation; but one classof plants is not wellrepresented; disruptionevident but not affectingfull plant growthpotential to any greatextent; more than one-half of the potential plantstubble height remaining.
8-6
8-6
69.9-50% of thestreambank surfacecovered by vegetation;disruption obvious;patches of bare soil orclosely croppedvegetation common; lessthan one-half of thepotential plant stubbleheight remaining.
5-3
5-3
Less than 50% of thestream bank surfacecovered by vegetation;disruption of streambankvegetation is very high;vegetation has beenremoved to 5 centimetersor less in average stubbleheight.
2-0
2-0
J. Riparian vegetative zonewidth - Score each bank
Left Bank
Right Bank
Width of riparian zones >18 meters; humanactivities (i.e., parkinglots, roadbeds, clear-cuts,lawns, or crops) have notimpacted zone.
10-9
10-9
Width of riparian zones17.9-12 meters; humanactivities have impactedzone minimally.
8-6
8-6
Width of riparian zones11.9-6 meters; humanactivities have impactedzone a great deal.
3-5
3-5
Width of riparian zones<6 meters; little or noriparian vegetation due tohuman activities.
2-0
2-0
Total
Stream Habitat Assessment Project ProcedureEffective Date: August 12, 2003Page 32 of 40
APPENDIX B
Glide/Pool Habitat Assessment Form

Stream Habitat Assessment Project ProcedureEffective Date: August 12, 2003Page 33 of 40
Missouri Department of Natural ResourcesStream Habitat Assessment ProcedureGlide/Pool Habitat Assessment Form
Date: Analyst: Station #:
Sample #:
Location:
Habitat Parameter Optimal Suboptimal Marginal PoorA. Epifaunal substrate/ available cover
Greater than 50% mix ofcobble, gravel,submerged logs, undercutbanks, or other stablehabitat.
20-16
A 50-30.1% mix ofcobble, gravel, or otherstable habitat.Adequate habitat formaintenance ofpopulation.
15-11
A 30-10.1% mix ofcobble, gravel, or otherstable habitat; habitatavailability less thandesirable.
10-6
Less than 10% cobble,gravel, or other stablehabitat; lack of habitat isobvious; substrateunstable or lacking.
5-0
B. Pool substrate characterization
Mixture of substratematerials with gravel andfirm sand prevalent; rootmats, snags or submergedvegetation common.
20-16
Mixture of soft sand,mud, or clay; mud maybe dominant; some rootmats, snags or submergedvegetation.
15-11
All mud or clay orchannelized with sandbottom; little or no rootmat, snags or submergedvegetation.
10-6
Hardpan clay or bedrock;no root mat, snags orsubmerged vegetation.
5-0
C. Pool variability
Even mix of large-deep,large- shallow, small-shallowl , and small-deeppools present.
20-16
Majority of pools large-deep; very few shallow pools.
15-11
Shallow pools muchmore prevalent than deeppools.
10-6
Majority of pools small-shallow or pools absent.
5-0
D. Sediment deposition
Little or no enlargementof islands or point barsand less than 20% ofbottom affected bysediment deposition.
20-16
Some new increase in barformation, mostly fromgravel sand or finesediment; 20.1-50 % ofbottom affected; slightdeposition in pools.
15-11
Moderate deposition ofnew gravel, sand or finesediment on old and newbars; 50.1-80% of thebottom affected;sediment deposits atobstructions,constrictions, and bends;moderate deposition ofpools.
10-6
Heavy deposits of finematerial, increased bardevelopment; more than80% of bottom affected;changing frequently,pools almost absent dueto substantial sedimentdeposition.
5-0
E. Channel flow status
Water reaches base ofboth lower banks, andminimal amount ofchannel substrate isexposed
20-16
Water fills 99.9-75% ofthe available channel; or<25% of channelsubstrate exposed.
15-11
Water fills 74.9-25% ofthe available channel,and/or riffle substratesare mostly exposed
10-6
Very little water inchannel (<25%) andmostly present asstanding pools
5-0
F. Channel alteration
Channelization ordredging absent orminimal (<5%) streamwith normal pattern
20-16
Some channelizationpresent (5-39.9%),usually in areas of bridgeabutments; evidence ofpast channelization, i.e.dredging (greater than 20years) may be present,but recent channelizationis not present.
15-11
Channelization may beextensive; embankmentsor shoring structurespresent on both banks;and 40- 80% of streamreach channelizes ordisrupted.
10-6
Banks shored withgabion or cement; over80% of the stream reachchannelized or disrupted. Instream habitat greatlyaltered or removedentirely
5-0

Stream Habitat Assessment Project ProcedureEffective Date: August 12, 2003Page 34 of 40
G. Channel sinuosity
The bends in the streamincrease the streamlength 4-3.1 longer thanif it was a straight line.
20-16
The bends in the streamincrease the streamlength 3-2.1 times longerthan if it was a straightline.
15-11
The bends in the streamincrease the streamlength 2-1.1 times longerthan if it was a straightline.
10-6
Channel straight; waterway has beenchannelized for a longdistance.
5-0
H. Bank stability - Score each bank
Left Bank
Right Bank
Bank stable; evidence oferosion or bank failureabsent or minimal; littlepotential for futureproblems; <5% of bankaffected.
10-9
10-9
Moderately stable;infrequent, small areas oferosion, mostly healedover; 5-29.9% of bank inreach has areas oferosion.
8-6
8-6
Moderate unstable; 30-59.9% of bank in reachhas areas of erosion; higherosion potential duringfloods.
5-3
5-3
Unstable; many erodedareas; "Raw" areasfrequent along straightsections and bends;obvious bank sloughing ;60- 100% of bank haserosion scars.
2-0
2-0
I. Vegetative protection – Score each bank
Left Bank
Right Bank
More than 90% of thestreambank surfaces andimmediate riparian zonecovered by nativevegetation, includingtrees, understory, orherbaceous growth;vegetative disruptionthrough grazing ormowing minimal or notevident; almost all plantsallowed to grownaturally.
10-9
10-9
90-70% of thestreambank surfacecovered by nativevegetation; but one classof plants is not wellrepresented; disruptionevident but not affectingfull plant growthpotential to any greatextent; more than one-half of the potential plantstuble height remaining.
8-6
8-6
69.9-50% of thestreambank surfacecovered by vegetation;disruption obvious;patches of bare soil orclosely croppedvegetation common; lessthan one-half of thepotential plant stubbleheight remaining.
5-3
5-3
Less than 50% of thestream bank surfacecovered by vegetation;disruption of streambankvegetation is very high;vegetation has beenremoved to 5 centimetersor less in average stubbleheight.
2-0
2-0
J. Riparian vegetative zonewidth - Score each bank
Left Bank
Right Bank
Width of riparian zones> 18 meters; humanactivities (i.e., parkinglots, roadbeds, clear-cuts,lawns, or crops) have notimpacted zone.
10-9
10-9
Width of riparian zones17.9-12 meters; humanactivities have impactedzone minimally.
8-6
8-6
Width of riparian zones11.9-6 meters; humanactivities have impactedzone a great deal.
3-5
3-5
Width of riparian zones<6 meters; little or noriparian vegetation due tohuman activities.
2-0
2-0
Total
Stream Habitat Assessment Project ProcedureEffective Date: August 12, 2003Page 35 of 40
APPENDIX C
Worksheet for Riffle/Pool or Glide/Pool Habitat Assessment Forms

Stream Habitat Assessment Project ProcedureEffective Date: August 12, 2003Page 36 of 40
Missouri Department of Natural ResourcesStream Habitat Assessment Procedure
Worksheet for Riffle/Pool or Glide/Pool Habitat Assessment Forms
Date: Analyst: Station #:Sample #:
Location:
A. Epifaunal Substrate\Available Cover
Section 1 2 3 4 5 6 7 8 9 10
%
Total (Sections 1-10) x .1 = Total Stream Reach Percentage
B. Embeddedness
Cobble 1 2 3 4 5 6 7 8 9 10 11 12 13 14 15 16
%Emb
Cat.
Category I = 0-25% Embedded Predominant Category Category II = 25.1-50% EmbeddedCategory III = 50.1-75% EmbeddedCategory IV = > 75% Embedded
D. Sediment Deposition
Section 1 2 3 4 5 6 7 8 9 10
%
Total Sections (1-10) x .1 = Total Stream Reach Percentage
H. Bank Stability
LBSection
1 2 3 4 5 6 7 8 9 10
Category
RBSection
1 2 3 4 5 6 7 8 9 10
Category
Category I = Stable. < 5% bank affected.Category II = Moderately stable. 5-29.9% of bank reach has erosion.Category III = Moderately unstable. 30-59.9% of bank reach has erosion.Category IV = Unstable. Many eroded areas; 60-100% of bank reach has erosion.
LB Predominant Category RB Predominant Category

Stream Habitat Assessment Project ProcedureEffective Date: August 12, 2003Page 37 of 40
I. Vegatative Protection
LBSection
1 2 3 4 5 6 7 8 9 10
%
RBSection
1 2 3 4 5 6 7 8 9 10
%
LB Total Sections (1-10) x 0.1 = LB Stream Reach Percentage RB Total Sections (1-10) x 0.1 = RB Stream Reach Percentage
J. Riparian Vegetative Zone Width
LBSection
1 2 3 4 5 6 7 8 9 10
Category
RBSection
1 2 3 4 5 6 7 8 9 10
Category
Category I = > 18 metersCategory II = 17.9-12 metersCategory III = 11.9-6 meters LB Predominant Category Category IV = < 6 meters RB Predominant Category
Lower bank width measurements are used to figure the 20X width sampling reach and the 10 transect segments forthe Riffle/Pool or Glide/Pool worksheet. Five well-spaced measurements are taken within a stream segment.
Transect 1 2 3 4 5
Lower Bank Width
Average Width = Average width x 20 = sampling reach lengthAverage width x 2 = transect segment length
Stream Habitat Assessment Project ProcedureEffective Date: August 12, 2003Page 38 of 40
APPENDIX D
Physical Characterization/Water Quality Data Form

Stream Habitat Assessment Project ProcedureEffective Date: August 12, 2003Page 39 of 40
Missouri Department of Natural ResourcesStream Habitat Assessment Procedure
Physical Characterization / Water Quality Data Form
General Information
Waterbody Name: Station #:Investigators:
Date:Time:
Latitude:Longitude:
USGS#:Reach #:
MDNR Reach #: Legal Coordinates:
Physical Features
Drainage Area (sq. mi.): Gradient (ft./mi.): Velocity (ft./sec.) Discharge (cu. ft./sec.)
Average Riffle Width (ft.) Average Run Width (ft.) Average Pool Width (ft.)
Average Riffle Depth (ft.) Average Run Width (ft.) Average Pool Depth (ft.)
High Water Mark (ft.) Stream Order:
Predominant Land Use: Forest Hayfield Row Crop Pasture Animal Confinement
Urban Commercial Urban Industrial Suburban Residential Suburban Commercial Other: Human Disturbance: Access Roads Footpaths Trash Livestock Watering RV Tracks
Gravel Mining Camping Sites Other:
Local Watershed Erosion: None Moderate Heavy
Canopy Cover: Open Partly Shaded Shaded
Estimated Water Level: Low Flow Within Lower Bank Over Lower Bank
Stream Bank Vegetation: Raw Bare Areas Grasses and Forbes Large Trees Trees and Shrubs
Major Habitats Present: Flow Coarse Substrate Non-flow over Deposition Snags/Woody Debris Flow Fine Substrate Leaf Packs Root Mats
Channel: Dam Present Dam Absent Channelized Natural
Point Source Pollution: Discharge No Discharge Estimated Flow: Type of Discharge:
Non-point Source Pollution (excluding erosion): Obvious Potential No ObservableType of NPS Pollution: Source of NPS Pollution:
Sediment
Sediment Deposits: No Deposits Sewage Sludge Silt Sand GravelOther Types of Deposits: Deposit thickness: Deposit Area:
Sediment Odors: Normal Sewage Petroleum Chemical AnaerobicOther:
Sediment Odor Severity: Not Offensive Moderately Offensive Grossly Offensive
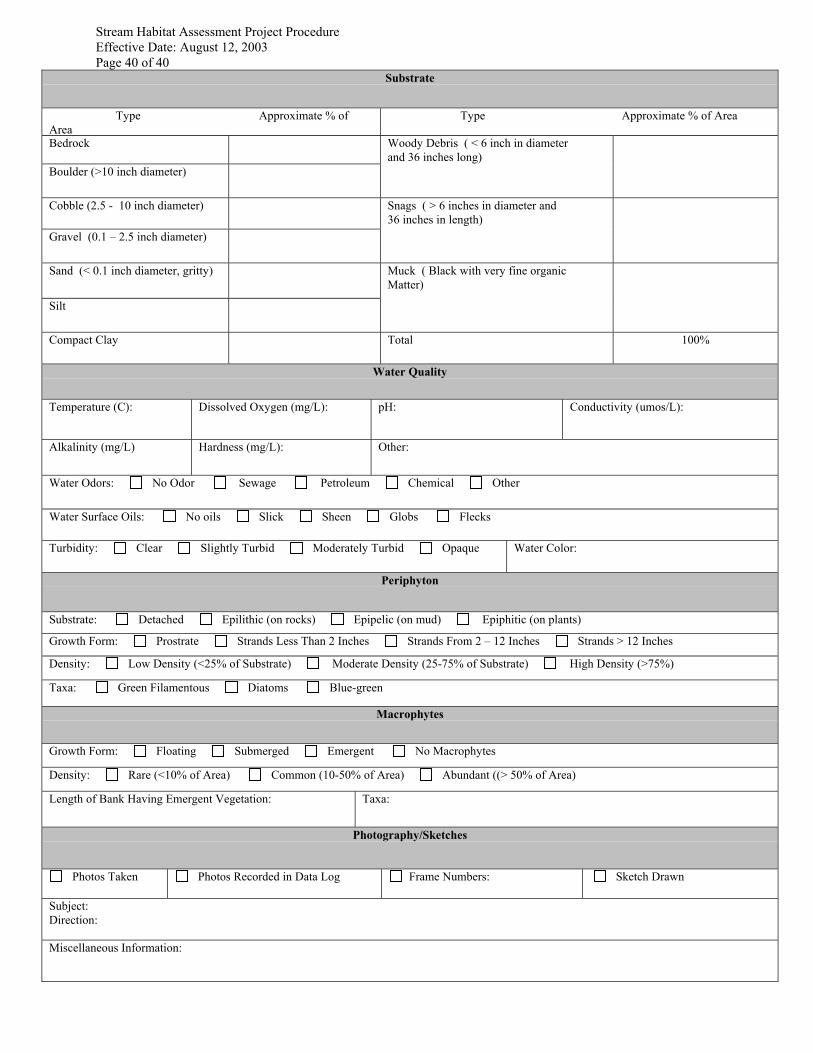
Stream Habitat Assessment Project ProcedureEffective Date: August 12, 2003Page 40 of 40
Substrate
Type Approximate % ofArea
Type Approximate % of Area
Bedrock
Boulder (>10 inch diameter)
Woody Debris ( < 6 inch in diameterand 36 inches long)
Cobble (2.5 - 10 inch diameter)
Gravel (0.1 – 2.5 inch diameter)
Snags ( > 6 inches in diameter and36 inches in length)
Sand (< 0.1 inch diameter, gritty)
Silt
Muck ( Black with very fine organicMatter)
Compact Clay Total 100%
Water Quality
Temperature (C): Dissolved Oxygen (mg/L): pH: Conductivity (umos/L):
Alkalinity (mg/L) Hardness (mg/L): Other:
Water Odors: No Odor Sewage Petroleum Chemical Other
Water Surface Oils: No oils Slick Sheen Globs Flecks
Turbidity: Clear Slightly Turbid Moderately Turbid Opaque Water Color:
Periphyton
Substrate: Detached Epilithic (on rocks) Epipelic (on mud) Epiphitic (on plants)
Growth Form: Prostrate Strands Less Than 2 Inches Strands From 2 – 12 Inches Strands > 12 Inches
Density: Low Density (<25% of Substrate) Moderate Density (25-75% of Substrate) High Density (>75%)
Taxa: Green Filamentous Diatoms Blue-green
Macrophytes
Growth Form: Floating Submerged Emergent No Macrophytes
Density: Rare (<10% of Area) Common (10-50% of Area) Abundant ((> 50% of Area)
Length of Bank Having Emergent Vegetation: Taxa:
Photography/Sketches
Photos Taken Photos Recorded in Data Log Frame Numbers: Sketch Drawn
Subject:Direction:
Miscellaneous Information:


![CPCB-LK.ppt [Read-Only]](https://img.pdfslide.net/doc/110x75/589aef8e1a28abd2468bca04/cpcb-lkppt-read-only.jpg)