Embed Size (px)
Citation preview
2013
MO Department of Economic Development
Division of Energy
Revised June 2014
Missouri Energy Resource Assessment

Table of Contents
Introduction ............................................................................................................ 1
Coal ............................................................................................................................................................. 3
Oil and Gas ........................................................................................................... 17
Landfill Gas ........................................................................................................... 27
Biomass .................................................................................................................................................. 33
Biofuels ................................................................................................................. 49
Ethanol…………………………………………………………………………………………………………………………………………49 Biodiesel………………………………………………………………………………………………………………………….. 52
Wind………………………………………………………………………………………………………………….. 57
Solar………………………………………………………………………………………………………………….. 65
Geothermal……………………………………………………………………………………………………….. 69
Hydropower………………………………………………………………………………………………………. 75
Demand Side Management: Energy Efficiency & Demand Response…………………. 81


1
1. Introduction
Missouri spends nearly $23 billion on energy annually. Most of these expenditures (52
percent) are in the transportation sector. Another 22 percent are expenditures by the residential
sector, 14 percent in the commercial sector and 12 percent by the industrial sector. Missouri
spent $6.7 billion, or 20 percent, of expenditures on the production of electricity in 2010.
Between 2009 and 2010, the energy expenditure level per dollar of economic output, measured
by state gross domestic product, rose by 12 percent. In 2011, the weighted-average price of
electricity across economic sectors ranks Missouri as 34th
lowest in the country.
Missouri’s energy profile is very diverse, with supplies of both traditional fossil fuel
resources and alternative resources. Included in our state’s energy resource portfolio are coal,
oil, natural gas, hydroelectric, landfill gas, ethanol, biodiesel, wind, solar, biomass and
geothermal sources. Energy efficiency is also an energy resource – often the lowest cost resource
– that is increasingly becoming an important part of meeting our state’s energy needs. The
development of each energy resource depends on many factors, including the location of the
resource, national and state policy, environmental regulations, transportation issues and national
and international market factors. Missouri’s ability to sustain energy production from each of
these sources depends on the interplay among these factors.
Electricity in Missouri is generated from a mix of coal, hydroelectric power, natural gas,
nuclear and renewable resources. Missouri is most dependent upon coal, which produces 82
percent of the total electricity consumed. The next largest source of electricity is nuclear, which
accounts for 10 percent. Natural gas, hydropower and wind sources combine to produce the
remaining 8 percent of electricity generation.
This first energy assessment catalogs publicly available information about the variety of
Missouri’s energy resources including fossil fuel resources, as well as energy efficiency and
renewable resources. The Department of Economic Development/Division of Energy used the
most current data available in the development of this report, but recognizes that new data may
be available when it is published. We look forward to annual updates and welcome comments to
improve the report. We hope the information in this document is useful and provides a basis for
discussions about Missouri’s energy and economic future.

2

3
2. Coal
2.1 Background and History
Coal production in the state of Missouri has been continuous since 1806. The first site to
be mined for coal in Missouri is located near Prairie City in Bates County. As the first state west
of the Mississippi River to produce coal on a commercial level, coal mining became a notable
part of the state economy by the 1880’s.1 Once coal mining began in earnest in the 1840’s, it
continued to operate effectively unregulated until 1971. The first legislation in Missouri to
regulate coal mining passed in 1971; by 1978, state law conformed to federal law (Public Law
95-87), which placed restrictions on coal mining activities.2 The enactment of the Surface
Mining Control and Reclamation Act of 1977 (SMCRA) impacted about 67,000 acres in 48
counties. Coal mines in Missouri were underground until the late 1920’s. The method used to
mine coal in Missouri gradually changed from underground mining to strip mining during the
1930’s to 1960’s.3
2.2 Resource Overview
The majority of coal in the state is located in the western, northern and central regions.
Most coal in Missouri ranges from lignite to bituminous. Lignite coal is also called brown coal.
It is a brown carbonaceous sedimentary rock with a woody texture that consists of accumulated
layers of partially decomposed vegetation. Lignite is located in the Bootheel or southeastern
corner of the state (Figure 1-1).
Bituminous coal is a soft black coal, rich in volatile hydrocarbons that burn with a smoky
yellow flame. It has high sulfur content and when burned, gives off sulfurous compounds that
contribute to air pollution and acid rain. Bituminous coal is located on the western edge and
northern half of the state. Missouri’s coal typically has relatively high sulfur content, averaging
1 “Missouri Coal”, Missouri Department of Natural Resources, Division of Geology and Land Survey. N.d. Web.
August 28, 2012. <http://www.dnr.mo.gov/geology/docs/BRO006MissouriCoal.pdf>. 2 “Regulated Mining Activity”, Missouri Department of Natural Resources, Land Reclamation Program. N.d. Web.
August 28, 2012. < http://www.dnr.mo.gov/env/lrp/mininfo.htm>. 3 “Missouri Coal”, Missouri Department of Natural Resources, Division of Geology and Land Survey. N.d. Web.
August 28, 2012. <http://www.dnr.mo.gov/geology/docs/BRO006MissouriCoal.pdf>.
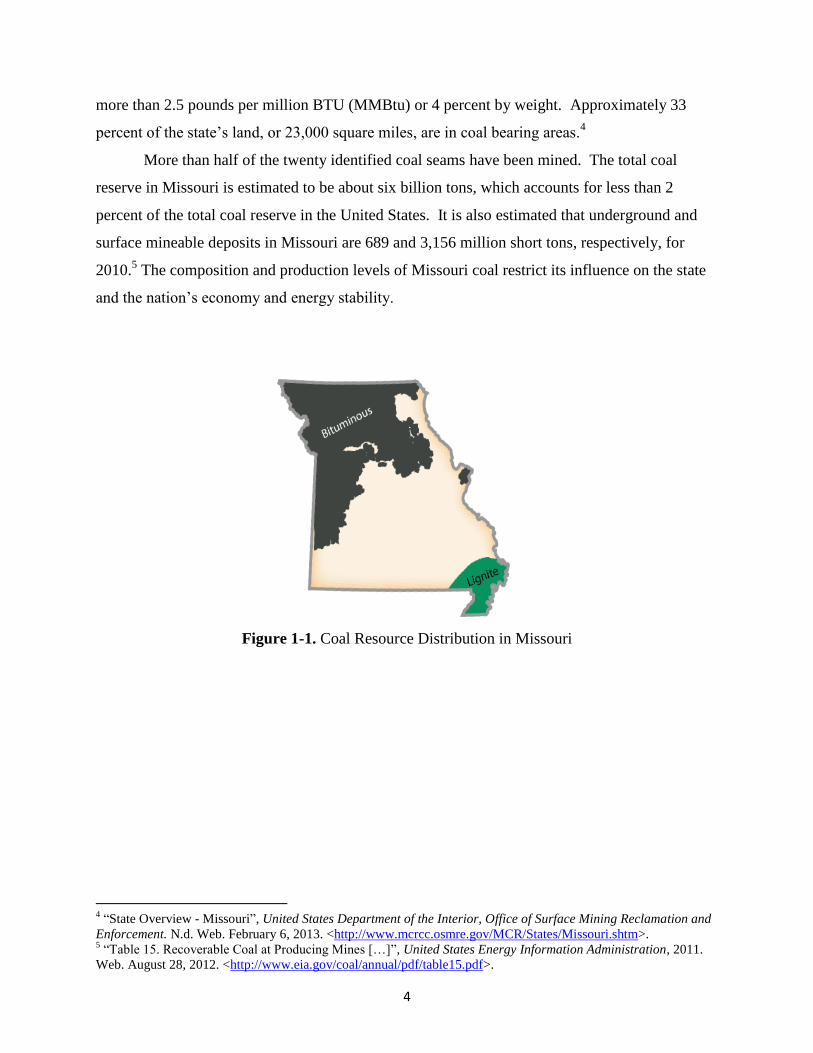
more than 2.5 pounds per million BTU (MMBtu) or 4 percent by weight. Approximately 33
percent of the state’s land, or 23,000 square miles, are in coal bearing areas.4
More than half of the twenty identified coal seams have been mined. The total coal
reserve in Missouri is estimated to be about six billion tons, which accounts for less than 2
percent of the total coal reserve in the United States. It is also estimated that underground and
surface mineable deposits in Missouri are 689 and 3,156 million short tons, respectively, for
2010.5 The composition and production levels of Missouri coal restrict its influence on the state
and the nation’s economy and energy stability.
Figure 1-1. Coal Resource Distribution in Missouri
4 “State Overview - Missouri”, United States Department of the Interior, Office of Surface Mining Reclamation and
Enforcement. N.d. Web. February 6, 2013. <http://www.mcrcc.osmre.gov/MCR/States/Missouri.shtm>. 5 “Table 15. Recoverable Coal at Producing Mines […]”, United States Energy Information Administration, 2011.
Web. August 28, 2012. <http://www.eia.gov/coal/annual/pdf/table15.pdf>.
4
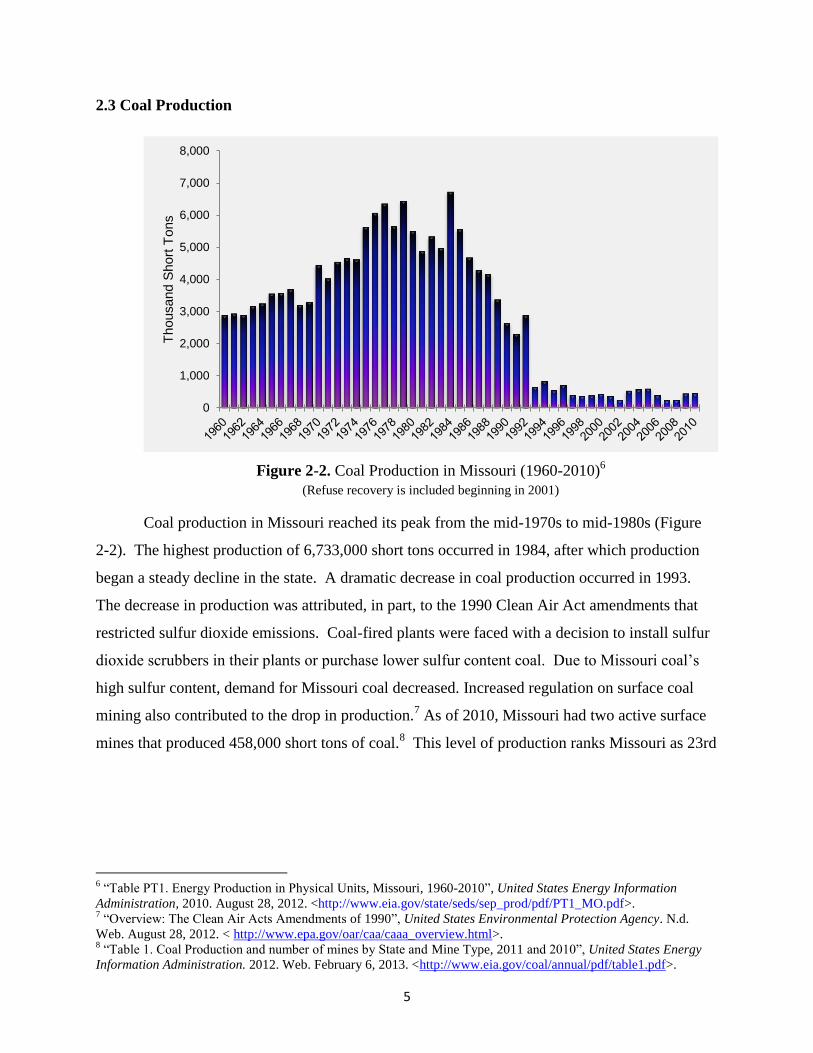
2.3 Coal Production
Figure 2-2. Coal Production in Missouri (1960-2010)6
(Refuse recovery is included beginning in 2001)
Coal production in Missouri reached its peak from the mid-1970s to mid-1980s (Figure
2-2). The highest production of 6,733,000 short tons occurred in 1984, after which production
began a steady decline in the state. A dramatic decrease in coal production occurred in 1993.
The decrease in production was attributed, in part, to the 1990 Clean Air Act amendments that
restricted sulfur dioxide emissions. Coal-fired plants were faced with a decision to install sulfur
dioxide scrubbers in their plants or purchase lower sulfur content coal. Due to Missouri coal’s
high sulfur content, demand for Missouri coal decreased. Increased regulation on surface coal
mining also contributed to the drop in production.7 As of 2010, Missouri had two active surface
mines that produced 458,000 short tons of coal.8 This level of production ranks Missouri as 23rd
6 “Table PT1. Energy Production in Physical Units, Missouri, 1960-2010”, United States Energy Information
Administration, 2010. August 28, 2012. <http://www.eia.gov/state/seds/sep_prod/pdf/PT1_MO.pdf>. 7 “Overview: The Clean Air Acts Amendments of 1990”, United States Environmental Protection Agency. N.d.
Web. August 28, 2012. < http://www.epa.gov/oar/caa/caaa_overview.html>. 8 “Table 1. Coal Production and number of mines by State and Mine Type, 2011 and 2010”, United States Energy
Information Administration. 2012. Web. February 6, 2013. <http://www.eia.gov/coal/annual/pdf/table1.pdf>.
5
0
1,000
2,000
3,000
4,000
5,000
6,000
7,000
8,000
Thousand S
hort
Tons
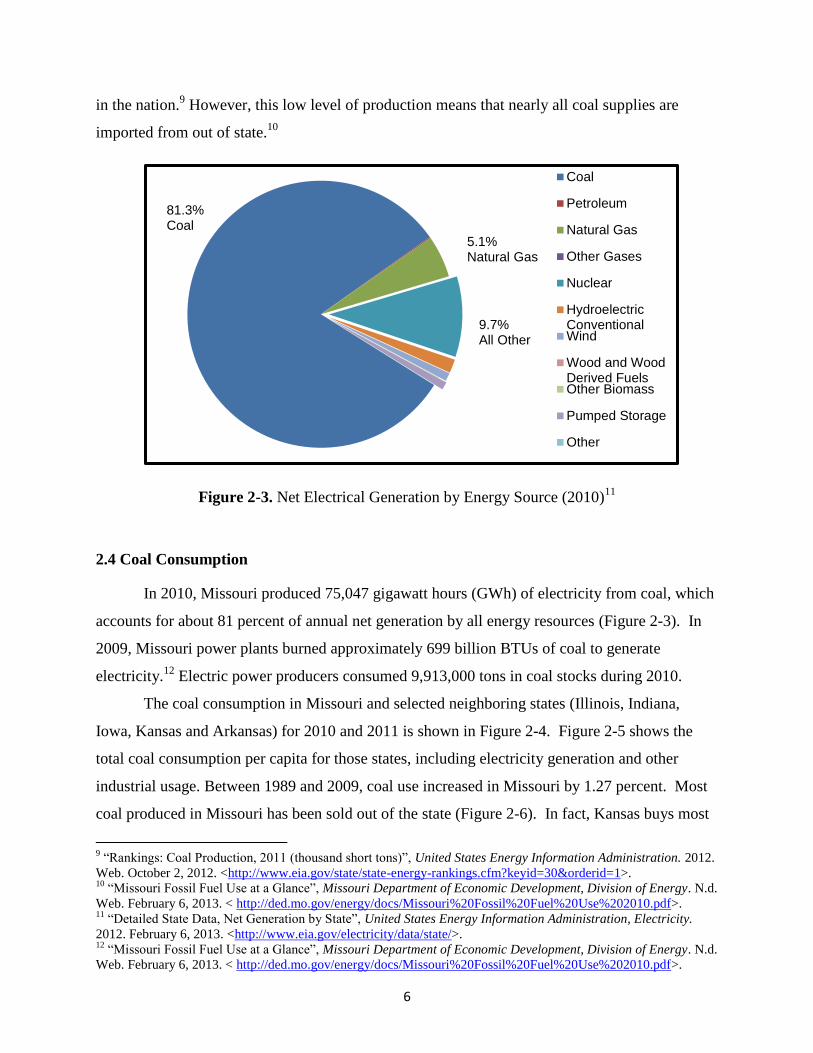
in the nation.9 However, this low level of production means that nearly all coal supplies are
imported from out of state.10
Figure 2-3. Net Electrical Generation by Energy Source (2010)11
2.4 Coal Consumption
In 2010, Missouri produced 75,047 gigawatt hours (GWh) of electricity from coal, which
accounts for about 81 percent of annual net generation by all energy resources (Figure 2-3). In
2009, Missouri power plants burned approximately 699 billion BTUs of coal to generate
electricity.12
Electric power producers consumed 9,913,000 tons in coal stocks during 2010.
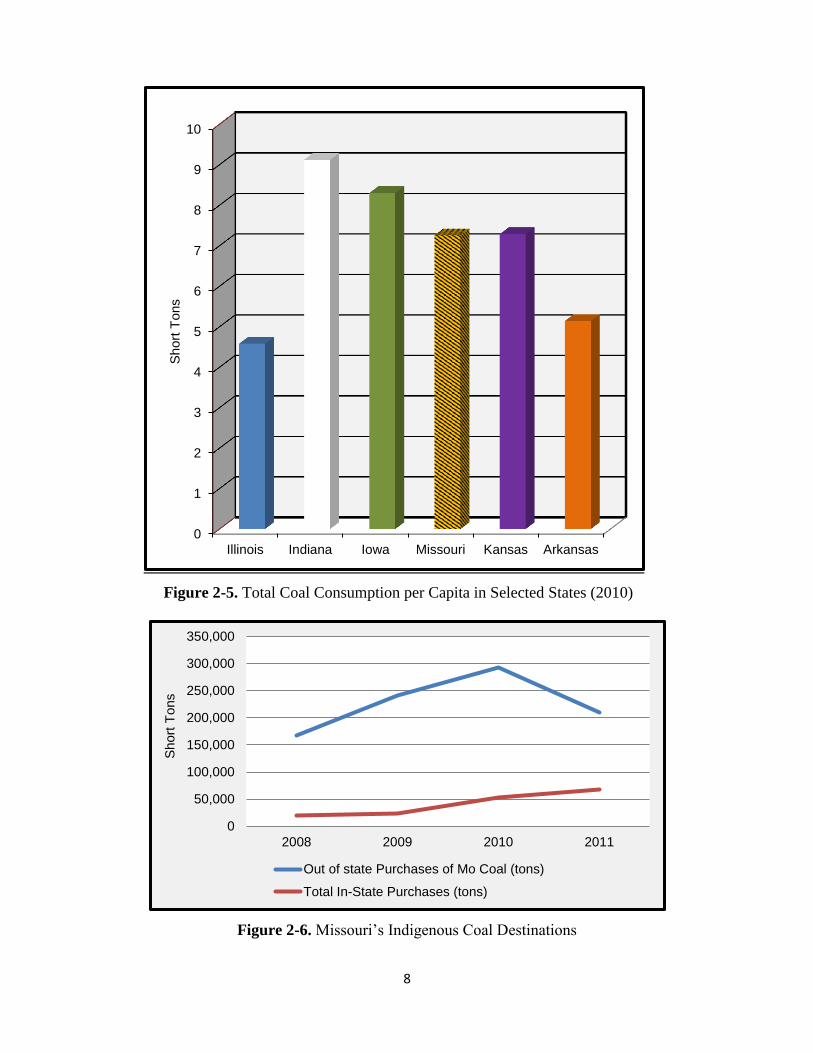
The coal consumption in Missouri and selected neighboring states (Illinois, Indiana,
Iowa, Kansas and Arkansas) for 2010 and 2011 is shown in Figure 2-4. Figure 2-5 shows the
total coal consumption per capita for those states, including electricity generation and other
industrial usage. Between 1989 and 2009, coal use increased in Missouri by 1.27 percent. Most
coal produced in Missouri has been sold out of the state (Figure 2-6). In fact, Kansas buys most
9 “Rankings: Coal Production, 2011 (thousand short tons)”, United States Energy Information Administration. 2012.
Web. October 2, 2012. <http://www.eia.gov/state/state-energy-rankings.cfm?keyid=30&orderid=1>. 10
“Missouri Fossil Fuel Use at a Glance”, Missouri Department of Economic Development, Division of Energy. N.d.
Web. February 6, 2013. < http://ded.mo.gov/energy/docs/Missouri%20Fossil%20Fuel%20Use%202010.pdf>. 11
“Detailed State Data, Net Generation by State”, United States Energy Information Administration, Electricity.
2012. February 6, 2013. <http://www.eia.gov/electricity/data/state/>. 12
“Missouri Fossil Fuel Use at a Glance”, Missouri Department of Economic Development, Division of Energy. N.d.
Web. February 6, 2013. < http://ded.mo.gov/energy/docs/Missouri%20Fossil%20Fuel%20Use%202010.pdf>.
6
Coal
Petroleum
Natural Gas
Other Gases
Nuclear
HydroelectricConventionalWind
Wood and WoodDerived FuelsOther Biomass
Pumped Storage
Other
81.3% Coal
5.1% Natural Gas
9.7% All Other

of the coal produced in Missouri. Due to the state’s heavy reliance upon coal and its low
production levels, Missouri’s ability to import a reliable supply of coal is vital for the production
of electricity and supporting the state’s overall economy. In 2011, Missouri purchased more than
44.5 million tons of coal in order to generate this power (Figure 2-7).13
In 2010, 97 percent of
the coal purchased was imported from Wyoming (Figure 2-8).
Figure 2-4. Coal Consumption in Missouri and Neighboring States
13
“Missouri Electricity Profile 2010”, United States Energy Information Administration. January 2012. Web.
August 28, 2012. <http://www.eia.gov/electricity/state/missouri/>.
7
0
10,000
20,000
30,000
40,000
50,000
60,000
Thousands o
f S
hort
Tons
Illinois
Indiana
Iowa
Missouri
Kansas
ArkansasElectric Power Other Industries Electric Power Other Industries
2009 2010
8
Figure 2-5. Total Coal Consumption per Capita in Selected States (2010)
Figure 2-6. Missouri’s Indigenous Coal Destinations
0
1
2
3
4
5
6
7
8
9
10
Illinois Indiana Iowa Missouri Kansas Arkansas
Short
Tons
0
50,000
100,000
150,000
200,000
250,000
300,000
350,000
2008 2009 2010 2011
Short
Tons
Out of state Purchases of Mo Coal (tons)
Total In-State Purchases (tons)
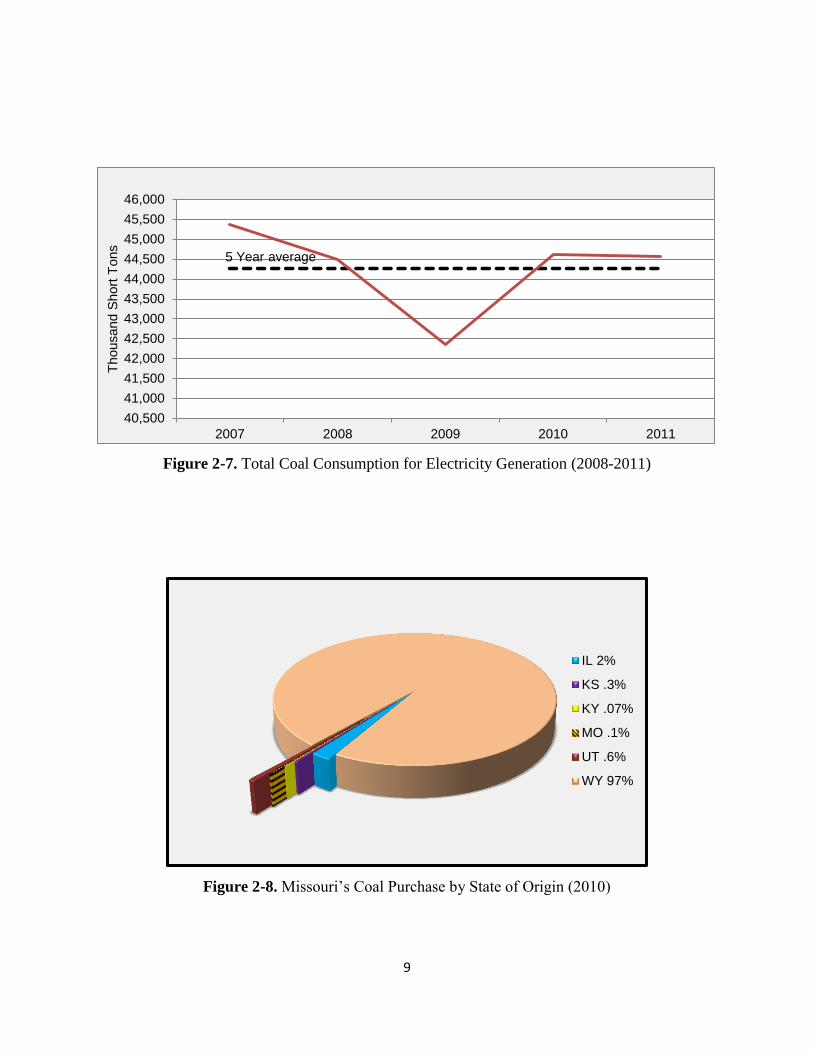
Figure 2-7. Total Coal Consumption for Electricity Generation (2008-2011)
Figure 2-8. Missouri’s Coal Purchase by State of Origin (2010)
9
40,500
41,000
41,500
42,000
42,500
43,000
43,500
44,000
44,500
45,000
45,500
46,000
2007 2008 2009 2010 2011
Thousand S
hort
Tons
5 Year average
IL 2%
KS .3%
KY .07%
MO .1%
UT .6%
WY 97%

Missouri ranks 6th
in the nation for the total coal consumption used in electric power
generation.14
Nearly all coal purchased by Missouri, either in-state or out-of-state, is used to fire
generation plants for electric utilities (Figure 2-9 and Figure 2-10).15
In 2009, Missouri power
plants burned approximately 699 billion BTUs of coal to generate electricity.16
In April 2012,
coal generated slightly less than 22,500 megawatt hours of electricity compared to April 2011,
which produced slightly over 25,000 megawatt hours.
Figure 2-9. Coal Consumption - State, Region and U.S. (2009 and 2010)
14
“Coal: Consumption By End Use Sector, by Census Division and State”, United States Energy Information
Administration. November-December 2012. Web. October 2, 2012.
<http://www.eia.gov/coal/data.cfm#consumption>. 15
“Missouri: Profile Overview”, United States Energy Information Administration. July 2012. Web. February 6,
2013. <http://www.eia.gov/state/state-energy-profiles.cfm?sid=MO>. 16
“Missouri Fossil Fuel Use at a Glance”, Missouri Department of Economic Development, Division of Energy. N.d.
Web. February 6, 2013. < http://ded.mo.gov/energy/docs/Missouri%20Fossil%20Fuel%20Use%202010.pdf>.
10
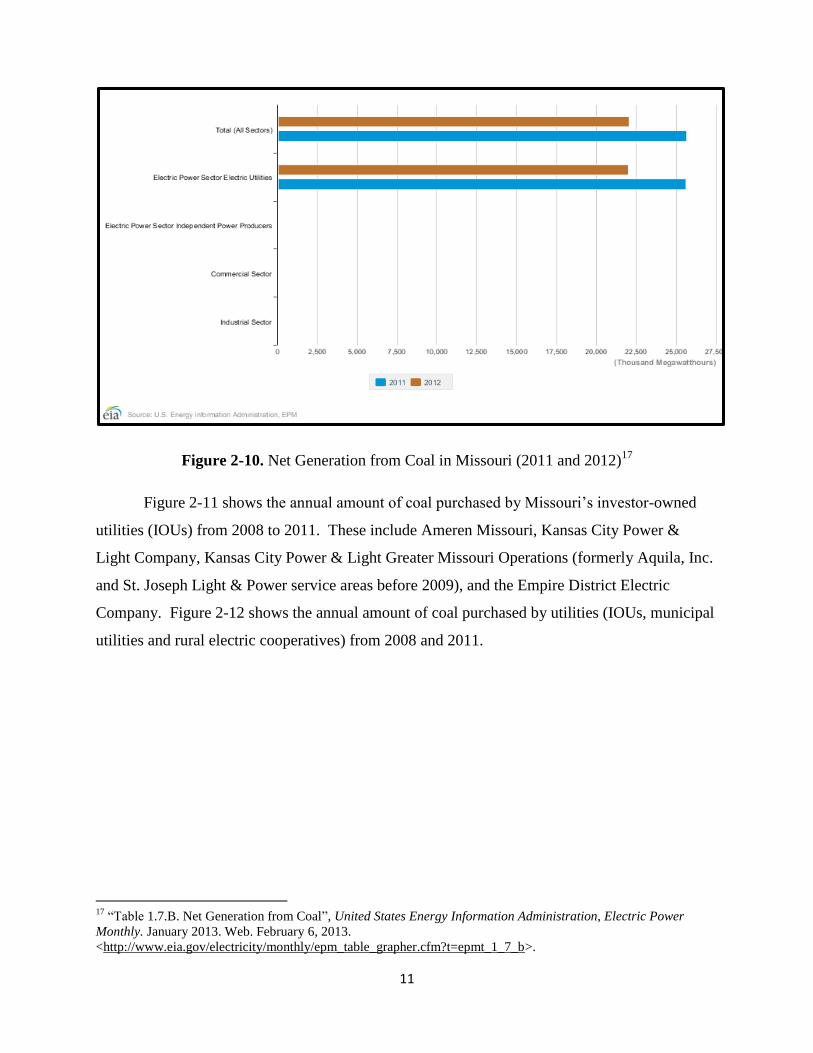
Figure 2-10. Net Generation from Coal in Missouri (2011 and 2012)17
Figure 2-11 shows the annual amount of coal purchased by Missouri’s investor-owned
utilities (IOUs) from 2008 to 2011. These include Ameren Missouri, Kansas City Power &
Light Company, Kansas City Power & Light Greater Missouri Operations (formerly Aquila, Inc.
and St. Joseph Light & Power service areas before 2009), and the Empire District Electric
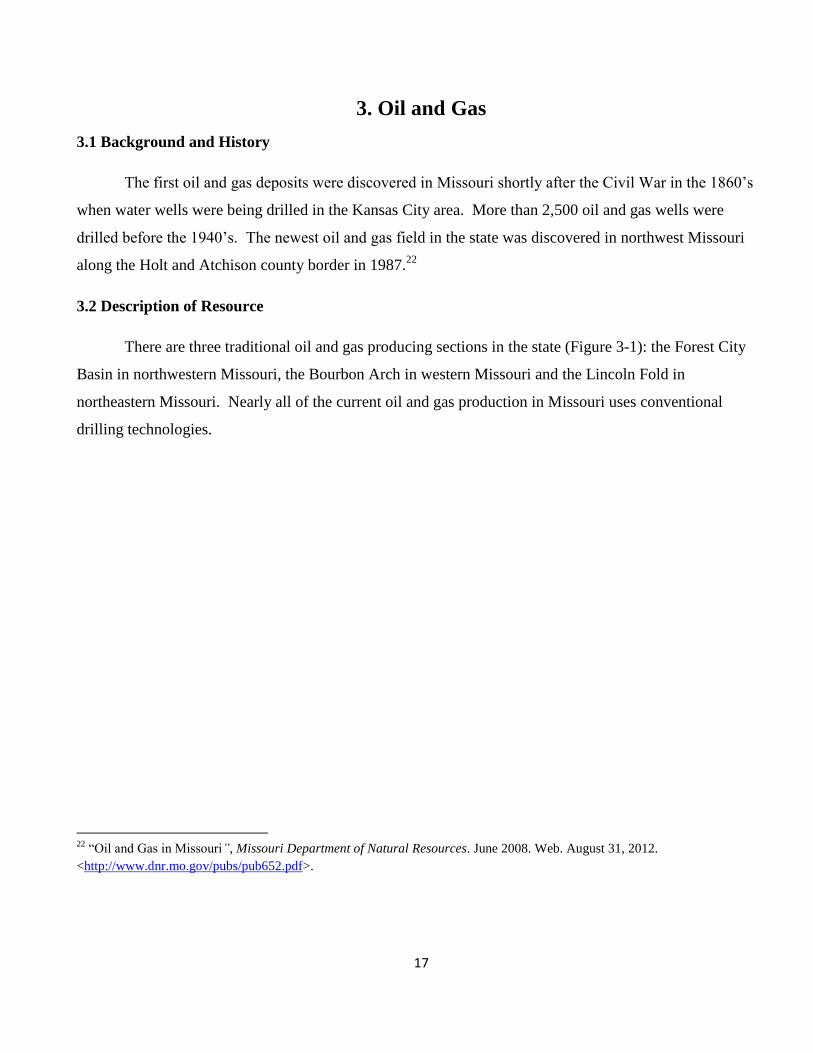
Company. Figure 2-12 shows the annual amount of coal purchased by utilities (IOUs, municipal
utilities and rural electric cooperatives) from 2008 and 2011.
17
“Table 1.7.B. Net Generation from Coal”, United States Energy Information Administration, Electric Power
Monthly. January 2013. Web. February 6, 2013.
<http://www.eia.gov/electricity/monthly/epm_table_grapher.cfm?t=epmt_1_7_b>.
11
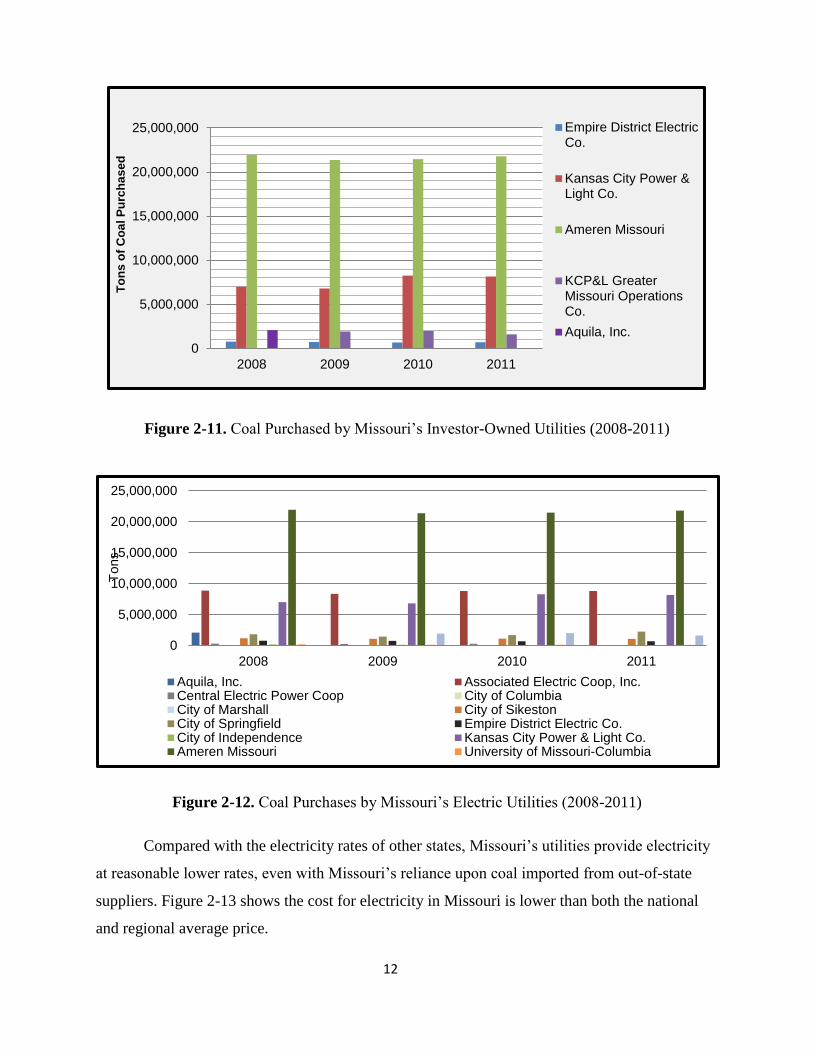
Figure 2-11. Coal Purchased by Missouri’s Investor-Owned Utilities (2008-2011)
Figure 2-12. Coal Purchases by Missouri’s Electric Utilities (2008-2011)
Compared with the electricity rates of other states, Missouri’s utilities provide electricity
at reasonable lower rates, even with Missouri’s reliance upon coal imported from out-of-state
suppliers. Figure 2-13 shows the cost for electricity in Missouri is lower than both the national
and regional average price.
12
0
5,000,000
10,000,000
15,000,000
20,000,000
25,000,000
2008 2009 2010 2011
To
ns
of
Co
al P
urc
ha
se
d
Empire District ElectricCo.
Kansas City Power &Light Co.
Ameren Missouri
KCP&L GreaterMissouri OperationsCo.
Aquila, Inc.
0
5,000,000
10,000,000
15,000,000
20,000,000
25,000,000
2008 2009 2010 2011
Tons
Aquila, Inc. Associated Electric Coop, Inc.Central Electric Power Coop City of ColumbiaCity of Marshall City of SikestonCity of Springfield Empire District Electric Co.City of Independence Kansas City Power & Light Co.Ameren Missouri University of Missouri-Columbia

Figure 2-13. Average Retail Price of Electricity to Customers
Figure 2-14. Average Retail Price of Electricity to Customers18
18
“Table 5.6.A. Average Retail Price of Electricity to Ultimate Consumer by End-Use Sector”, United States
Energy Information Administration, Electric Power Monthly. January 2013. Web. February 6,
2013.<http://www.eia.gov/electricity/monthly/epm_table_grapher.cfm?t=epmt_5_6_a>.
13
MissouriWestNorth
CentralU.S. Total
All Sectors April 2012 7.74 8.09 9.52
All Sectors April 2011 7.58 7.91 9.64
0
2
4
6
8
10
12
Cents/KWh

Figure 2-14 shows the average retail price of electricity to different sectors, including
customers from residential, commercial, industrial and transportation. Based on the U.S.
Department of Energy’s Energy Information Administration (EIA) rankings, Missouri is
currently ranked 38th
for average retail price for electricity with a price of 7.78 cents/kWh in
2010.19
In 2012, the average price of electricity was 9.83 cents/kWh for the United States and
7.74 cents/kWh for Missouri.20
The average sales price of coal in Missouri has been withheld in EIA data for the most
recent years (2009 and 2010) due to proprietary classification. The average cost of coal
delivered for electricity generation in Missouri increased by 6.9 percent between 2011 ($1.74 per
MMBTU) and 2012 ($1.86 per MMBTU).21
Historical electricity prices by sector are shown in
Figure 2-15 (nominal price) and Figure 2-16 (inflation adjusted price).
Figure 2-15. Missouri Average Electricity Price, 1970-2011 (nominal price)
19
“Table 1. 2010 Summary Statistics (Missouri)”, United States Energy Information Administration. 30 January
2012. Web. 2 October 2012. <http://www.eia.gov/electricity/state/missouri/>. 20
“State Electricity Profiles.” United States Energy Information Administration. January 2012. Web. October 2,
2012. <http://www.eia.gov/electricity/state/>. 21
“Missouri Data: Prices”, United States Energy Information Administration. January 2013. Web. February 6, 2013.
<http://www.eia.gov/state/state-energy-profiles-data.cfm?sid=MO#Prices>.
14

Figure 2-16. Missouri Average Electricity Price, 1970-2011 (inflation adjusted price)
15

16
3. Oil and Gas
3.1 Background and History
The first oil and gas deposits were discovered in Missouri shortly after the Civil War in the 1860’s
when water wells were being drilled in the Kansas City area. More than 2,500 oil and gas wells were
drilled before the 1940’s. The newest oil and gas field in the state was discovered in northwest Missouri
along the Holt and Atchison county border in 1987.22
3.2 Description of Resource
There are three traditional oil and gas producing sections in the state (Figure 3-1): the Forest City
Basin in northwestern Missouri, the Bourbon Arch in western Missouri and the Lincoln Fold in
northeastern Missouri. Nearly all of the current oil and gas production in Missouri uses conventional
drilling technologies.
22
“Oil and Gas in Missouri”, Missouri Department of Natural Resources. June 2008. Web. August 31, 2012.
<http://www.dnr.mo.gov/pubs/pub652.pdf>.
17

Figure 3-1. Oil and Gas Producing Areas in Missouri23
Even though Missouri has historically had limited supplies of traditional hydrocarbons, relatively
large deposits of “heavy oil” exist. Missouri potentially possesses large deposits of unconventional oil and
gas. The three primary unconventional resources of oil and gas include24
:
1) Tar sand
Tar sand heavy oil can be found in the Bourbon Arch south of Kansas City. Nearly 800,000 barrels
of oil have been produced in Vernon County since 1960. It is estimated the Bourbon Arch has 1.4
to 1.9 billion barrels of oil from tar sands.
2) Coalbed methane gas
23
“Oil and Gas in Missouri”, Missouri Department of Natural Resources. June 2008. Web. August 31, 2012.
<http://www.dnr.mo.gov/pubs/pub652.pdf>. 24
“Oil and Gas in the Show-Me State”, The Geologic Column of Missouri, Volume 2, Issue 1, Summer 2007. Web. August 31,
2012. < http://www.dnr.mo.gov/geology/docs/gcsummer7.pdf>.
18
Coalbed methane gas is found within deeply buried coal seams and is located primarily in
northwest, north central and west central Missouri. In 2006, more than 3,200 coalbed methane
wells in Kansas produced nearly 24 billion cubic feet of gas. Many of these wells are located in the
same coal seams that occur in western Missouri. While coalbed methane has not yet been produced
economically in Missouri, it is likely that the methane will be extracted, given Missouri’s extensive
coal deposits.
3) Oil shale
Oil shale has been found overlying some coal beds in northern Missouri and in portions of the
Chattanooga Shale formation in the extreme southwest part of the state. Only the most preliminary
analyses have been conducted on Missouri oil shale. Even though the possibility remains that a
certain level of oil shale is present, many technical, economic and environmental issues need to be
solved before the resource can be developed commercially.
3.3 Current Production and Usage
Missouri historically has limited oil and gas production. In 2012, 172,512 barrels of crude oil were
produced from 405 oil wells in the state, which ranks as the third least among all 33 oil-producing states
(Figure 3-2)25
. With the price range between $65.00 and $99.25 per barrel, the sale of crude oil was valued
at over $14.3 million, which almost tripled the oil value of $4.8 million in 200626
. Figure 3-3 illustrates the
trend for field production of monthly crude oil from January 1981 to November 2013. Figures 3-4 shows
the oil production in the state over the past 30 years.
25
“Crude Oil Production, 1981-2012”, United States Energy Information Administration. September 2013.Web. January 30,
2014. < http://www.eia.gov/dnav/pet/pet_crd_crpdn_adc_mbbl_a.htm>. 26
“2012 Oil and Gas Activities and Production Report”, Missouri Department of Natural Resources, Division of Geology and
Land Survey. April 2013. Web. January 30, 2014. <http://www.dnr.mo.gov/geology/docs/2012-OGC-report-April-2013.pdf>.
19

Figure 3-2. Crude Oil Producing States Under 20 Million Barrels (2012)
Figure 3-3. Missouri Monthly Field Production of Crude Oil (Jan. 1981~ Nov. 2013)27
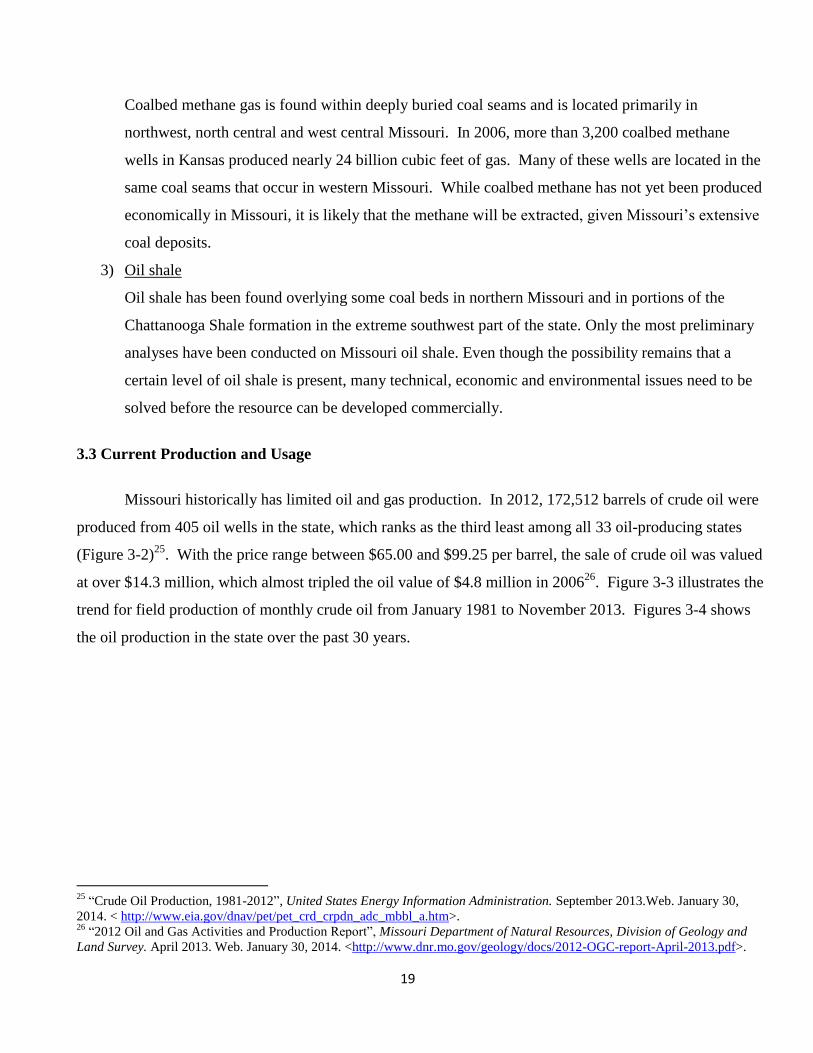
Oil is currently produced by 18 companies in six counties (Figure 3-5). Figure 3-6 shows the oil
production along with its respective percentage and sale value for each county. Cass County is the largest
oil producing county in the state with 94,950 barrels in 2012, which accounts for 55 percent of the total
27
“Missouri Field Production of Crude Oil (Monthly)”, United States Energy Information Administration. January 2014. Web.
January 30, 2014. <http://www.eia.gov/dnav/pet/hist/LeafHandler.ashx?n=pet&s=mcrfpmo1&f=m>.
20
0
1,000
2,000
3,000
4,000
5,000
6,000
7,000
8,000
9,000
10,000
Virg
inia
Arizo
na
Mis
so
uri
Ten
ne
ssee
Ne
w Y
ork
Ne
vad
a
So
uth
Da
kota
Flo
rida
India
na
We
st V
irg
inia
Ne
bra
ska
Ke
ntu
cky
Pe
nn
sylv
ania
Oh
io
Ark
ansa
s
Mic
hig
an
Ala
ba
ma
Illin
ois
Th
ou
san
d B
arr
els
Missouri
0
5
10
15
20
25
30
35
Jan
-81
Se
p-8
1M
ay-8
2Jan
-83
Se
p-8
3M
ay-8
4Jan
-85
Se
p-8
5M
ay-8
6Jan
-87
Se
p-8
7M
ay-8
8Jan
-89
Se
p-8
9M
ay-9
0Jan
-91
Se
p-9
1M
ay-9
2Jan
-93
Se
p-9
3M
ay-9
4Jan
-95
Se
p-9
5M
ay-9
6Jan
-97
Se
p-9
7M
ay-9
8Jan
-99
Se
p-9
9M
ay-0
0Jan
-01
Se
p-0
1M
ay-0
2Jan
-03
Se
p-0
3M
ay-0
4Jan
-05
Se
p-0
5M
ay-0
6Jan
-07
Se
p-0
7M
ay-0
8Jan
-09
Se
p-0
9M
ay-1
0Jan
-11
Se
p-1
1M
ay-1
2Jan
-13
Se
p-1
3
Th
ou
sa
nd
Ba
rre
ls

crude oil produced in Missouri.28
Table 3-1 and Figure 3-7 give the oil production in 2012 by each
operator.
Figure 3-4. Missouri Annual Crude Oil Production (1981~ 2012)29
28
“2012 Oil and Gas Activities and Production Report”, Missouri Department of Natural Resources, Division of Geology and
Land Survey. April 2013. Web. January 30, 2014. <http://www.dnr.mo.gov/geology/docs/2012-OGC-report-April-2013.pdf>. 29
“Missouri Field Production of Crude Oil (Annual)”, United States Energy Information Administration. January 2013. Web.
January 30, 2014. <http://www.eia.gov/dnav/pet/hist/LeafHandler.ashx?n=pet&s=mcrfpmo1&f=a>.
21
0
50
100
150
200
250
300Th
ou
san
d o
f B
arre
ls
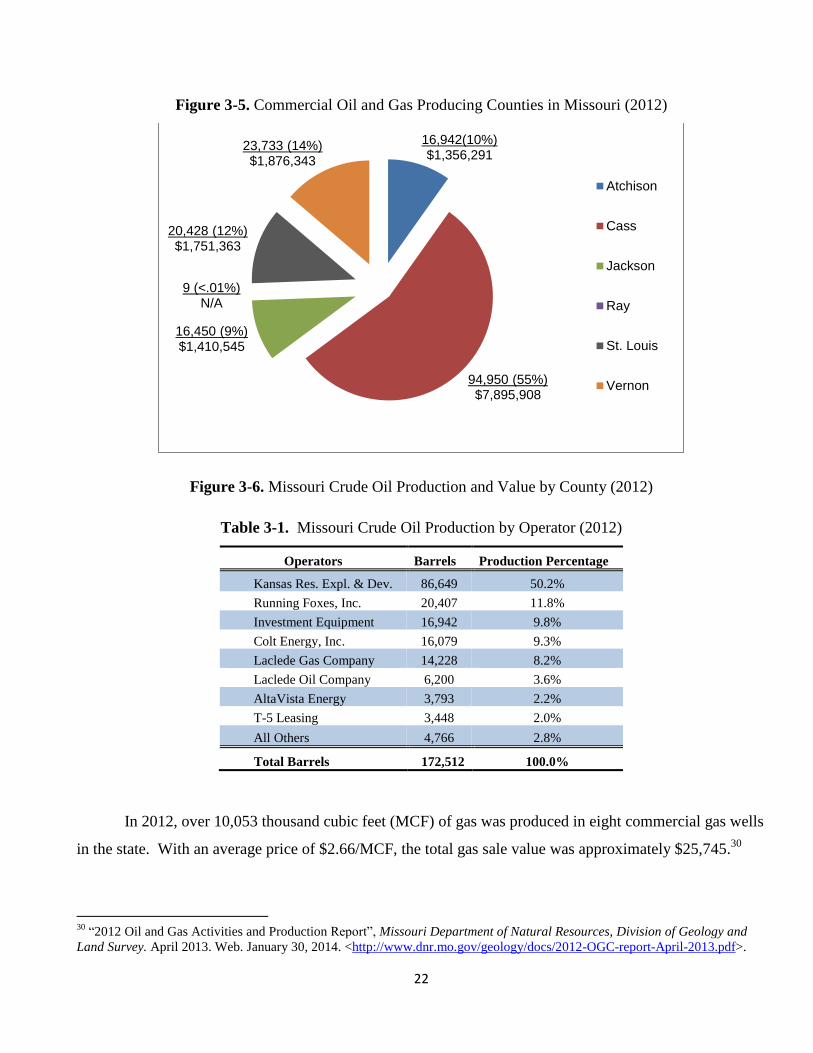
Figure 3-5. Commercial Oil and Gas Producing Counties in Missouri (2012)
Figure 3-6. Missouri Crude Oil Production and Value by County (2012)
Table 3-1. Missouri Crude Oil Production by Operator (2012)
Operators Barrels Production Percentage
Kansas Res. Expl. & Dev. 86,649 50.2%
Running Foxes, Inc. 20,407 11.8%
Investment Equipment 16,942 9.8%
Colt Energy, Inc. 16,079 9.3%
Laclede Gas Company 14,228 8.2%
Laclede Oil Company 6,200 3.6%
AltaVista Energy 3,793 2.2%
T-5 Leasing 3,448 2.0%
All Others 4,766 2.8%
Total Barrels 172,512 100.0%
In 2012, over 10,053 thousand cubic feet (MCF) of gas was produced in eight commercial gas wells
in the state. With an average price of $2.66/MCF, the total gas sale value was approximately $25,745.30
30
“2012 Oil and Gas Activities and Production Report”, Missouri Department of Natural Resources, Division of Geology and
Land Survey. April 2013. Web. January 30, 2014. <http://www.dnr.mo.gov/geology/docs/2012-OGC-report-April-2013.pdf>.
22
16,942(10%) $1,356,291
94,950 (55%) $7,895,908
16,450 (9%) $1,410,545
9 (<.01%) N/A
20,428 (12%) $1,751,363
23,733 (14%) $1,876,343
Atchison
Cass
Jackson
Ray
St. Louis
Vernon

Commercial gas production activities currently occur only in Vernon County. However, permits have been
issued to construct new commercial gas wells in Clinton County.
Four counties (Cass, Clay, Clinton and Jackson) have approximately 500 private gas wells in the
state. The status of most of those wells is unknown due to the lack of required production reporting. Of the
50 known active private gas wells in use, 32 wells are located in Cass County. Almost all of the gas from
private gas wells is being used in private homes and small businesses to fuel heating appliances. The total
marketed production for the state from 1960-2010 is illustrated in Figure 3-8.31
The cumulative natural gas
production for the top six counties in Missouri from 1928 through 2013 is represented in Figure 3-9.32
Figure 3-7. Missouri Crude Oil Production by Operator (2012)
31
“Table 13. Natural Gas Production, Transmission, and Consumption by State, 1967-2000”, United States Energy Information
Administration. N.D.Web. January 30, 2014.
<http://www.eia.gov/pub/oil_gas/natural_gas/data_publications/historical_natural_gas_annual/current/pdf/table_13.pdf). 32
“Gas Production by Gas Field”, Missouri Department of Natural Resources, Division of Geology and Land Survey. Web.
January 30, 2014. <http://www.dnr.mo.gov/geology/docs/CumulativeGasProductionthru2010.xls>.
23
0
10
20
30
40
50
60
70
80
90
100
Thousand o
f B
arr
els

Figure 3-8. Missouri Natural Gas Marketed Production (1960-2010)
Figure 3-9. Total Cumulative Natural Gas Production by County (1928-2012)
24
0
20
40
60
80
100
120
140
1960 1970 1980 1990 2000 2010
Mill
ion C
ubic
Feet
0
2,000
4,000
6,000
8,000
10,000
12,000
Clay Jackson Cass Clinton Vernon Caldwell
MM
CF

Figure 3-10. Estimated Recoverable Shale Gas Reserves in Selected U.S. States
Even though hydraulic fracturing has been utilized by the gas industry for decades, it has
experienced a resurgence in popularity with the development of horizontal drilling. Technological
advancements in drilling techniques have made previously unavailable gas deposits within reach. The
development of horizontal drilling has increased the productivity of individual wells. The Bureau of
Economic Analysis estimates that Missouri has two trillion cubic feet (TCF) of shale gas deposits that are
currently economically recoverable, amounting to $217 billion in 2010 real state GDP (at a price of
$4/mcf).33
Figure 3-10 displays a comparison of estimated recoverable shale gas deposits for the top 24
states. This amount of potential shale gas is comparable to what is found in Nebraska, Iowa and Virginia,
but still is small on the national scale with several states having hundreds and into the thousands of TCF.
33
“Potential Impact of Natural Gas Fracking on Municipal Bond Issuers”, Kroll Bond Rating Agency, Inc. January 2012. Web.
August 28, 2012. < http://www.magny.org/event-presentations/01-20-12_potential_impact_of_%20natural_gas_fracking.pdf>.
25
0
20
40
60
80
100
120
140
160
Texas
Ark
an
sa
s
Penn
sylv
an
ia
Lo
uis
iana
Okla
hom
a
Co
lora
do
Ne
w Y
ork
Wyo
min
g
Uta
h
Mic
hig
an
Ohio
Ne
w M
exic
o
Kentu
cky
India
na
No
rth
Dakota
*
Ala
bam
a
Illin
ois
Ne
bra
ska
Iow
a
Mis
so
uri
Virgin
ia
Ca
liforn
ia
Mo
nta
na
Ma
ryla
nd
Trilli
on C
ubic
Feet

26
4. Landfill Gas
4.1 Landfill Gas Production
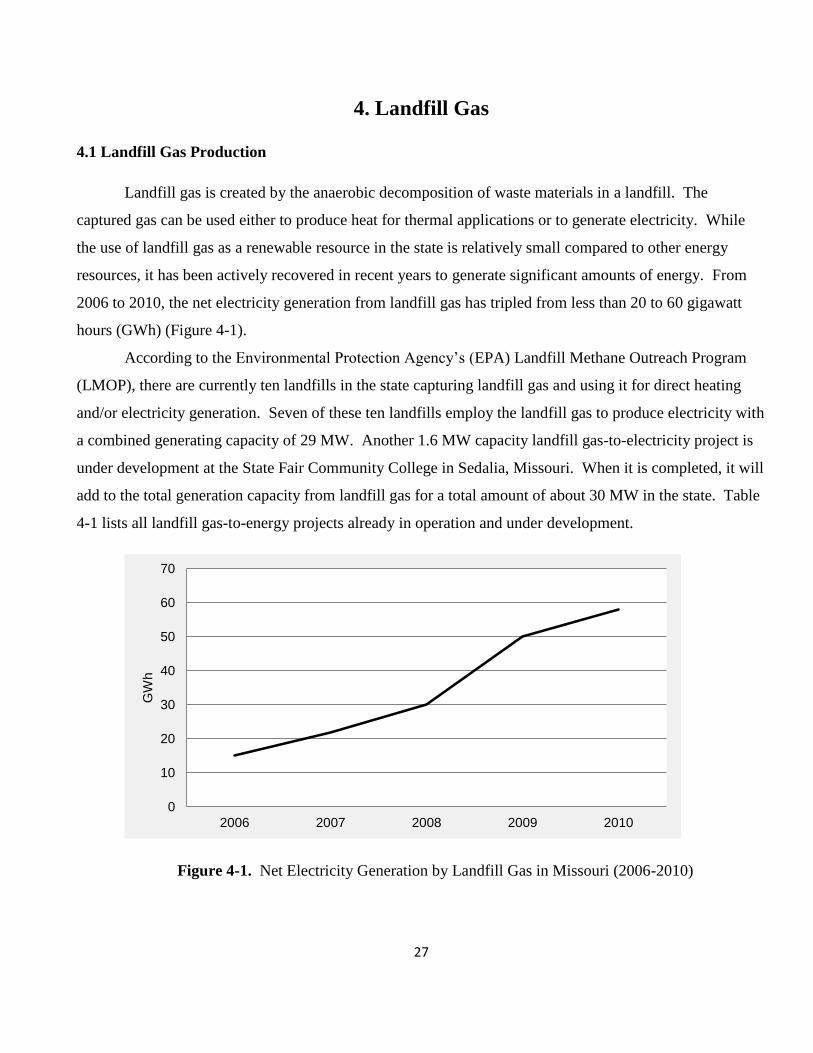
Landfill gas is created by the anaerobic decomposition of waste materials in a landfill. The
captured gas can be used either to produce heat for thermal applications or to generate electricity. While
the use of landfill gas as a renewable resource in the state is relatively small compared to other energy
resources, it has been actively recovered in recent years to generate significant amounts of energy. From
2006 to 2010, the net electricity generation from landfill gas has tripled from less than 20 to 60 gigawatt
hours (GWh) (Figure 4-1).
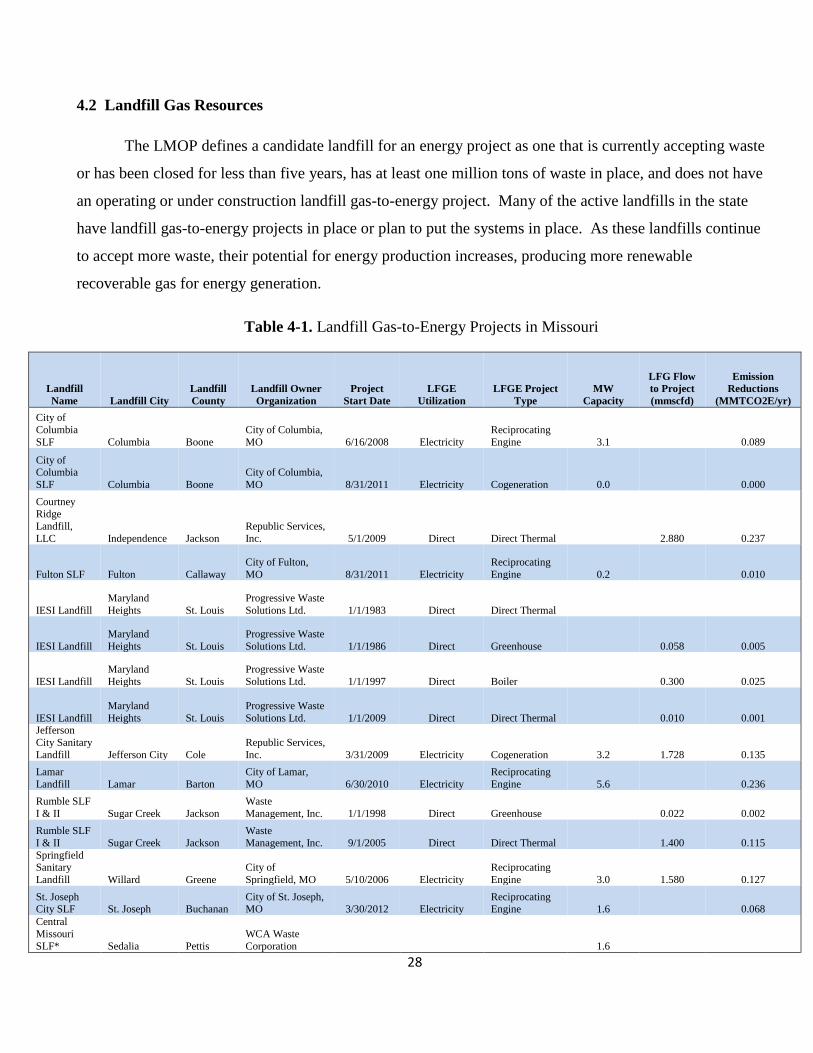
According to the Environmental Protection Agency’s (EPA) Landfill Methane Outreach Program
(LMOP), there are currently ten landfills in the state capturing landfill gas and using it for direct heating
and/or electricity generation. Seven of these ten landfills employ the landfill gas to produce electricity with
a combined generating capacity of 29 MW. Another 1.6 MW capacity landfill gas-to-electricity project is
under development at the State Fair Community College in Sedalia, Missouri. When it is completed, it will
add to the total generation capacity from landfill gas for a total amount of about 30 MW in the state. Table
4-1 lists all landfill gas-to-energy projects already in operation and under development.
Figure 4-1. Net Electricity Generation by Landfill Gas in Missouri (2006-2010)
27
0
10
20
30
40
50
60
70
2006 2007 2008 2009 2010
GW
h
4.2 Landfill Gas Resources
The LMOP defines a candidate landfill for an energy project as one that is currently accepting waste
or has been closed for less than five years, has at least one million tons of waste in place, and does not have
an operating or under construction landfill gas-to-energy project. Many of the active landfills in the state
have landfill gas-to-energy projects in place or plan to put the systems in place. As these landfills continue
to accept more waste, their potential for energy production increases, producing more renewable
recoverable gas for energy generation.
Table 4-1. Landfill Gas-to-Energy Projects in Missouri
Landfill
Name Landfill City
Landfill
County
Landfill Owner
Organization
Project
Start Date
LFGE
Utilization
LFGE Project
Type
MW
Capacity
LFG Flow
to Project
(mmscfd)
Emission
Reductions
(MMTCO2E/yr)
City of
Columbia
SLF Columbia Boone
City of Columbia,
MO 6/16/2008 Electricity
Reciprocating
Engine 3.1 0.089
City of Columbia
SLF Columbia Boone
City of Columbia,
MO 8/31/2011 Electricity Cogeneration 0.0 0.000
Courtney Ridge
Landfill,
LLC Independence Jackson
Republic Services,
Inc. 5/1/2009 Direct Direct Thermal 2.880 0.237
Fulton SLF Fulton Callaway
City of Fulton,
MO 8/31/2011 Electricity
Reciprocating
Engine 0.2 0.010
IESI Landfill
Maryland
Heights St. Louis
Progressive Waste
Solutions Ltd. 1/1/1983 Direct Direct Thermal
IESI Landfill
Maryland
Heights St. Louis
Progressive Waste
Solutions Ltd. 1/1/1986 Direct Greenhouse 0.058 0.005
IESI Landfill
Maryland
Heights St. Louis
Progressive Waste
Solutions Ltd. 1/1/1997 Direct Boiler 0.300 0.025
IESI Landfill
Maryland
Heights St. Louis
Progressive Waste
Solutions Ltd. 1/1/2009 Direct Direct Thermal 0.010 0.001 Jefferson
City Sanitary
Landfill Jefferson City Cole
Republic Services,
Inc. 3/31/2009 Electricity Cogeneration 3.2 1.728 0.135
Lamar
Landfill Lamar Barton
City of Lamar,
MO 6/30/2010 Electricity
Reciprocating
Engine 5.6 0.236
Rumble SLF
I & II Sugar Creek Jackson
Waste
Management, Inc. 1/1/1998 Direct Greenhouse 0.022 0.002
Rumble SLF
I & II Sugar Creek Jackson
Waste
Management, Inc. 9/1/2005 Direct Direct Thermal 1.400 0.115
Springfield Sanitary
Landfill Willard Greene
City of
Springfield, MO 5/10/2006 Electricity
Reciprocating
Engine 3.0 1.580 0.127
St. Joseph City SLF St. Joseph Buchanan
City of St. Joseph, MO 3/30/2012 Electricity
Reciprocating Engine 1.6 0.068
Central
Missouri
SLF* Sedalia Pettis
WCA Waste
Corporation 1.6
28
Landfill
Name Landfill City
Landfill
County
Landfill Owner
Organization
Project
Start Date
LFGE
Utilization
LFGE Project
Type
MW
Capacity
LFG Flow
to Project
(mmscfd)
Emission
Reductions
(MMTCO2E/yr)
Veolia ES
Oak Ridge
Landfill, Inc. Ballwin St. Louis
Veolia ES Solid
Waste, Inc. 6/1/2009 Direct Direct Thermal 1.150 0.094
IESI Landfill
Maryland
Heights St. Louis
Progressive Waste
Solutions Ltd.
Ameren
Missouri Electricity
Reciprocating
Engine 14.7 0.635
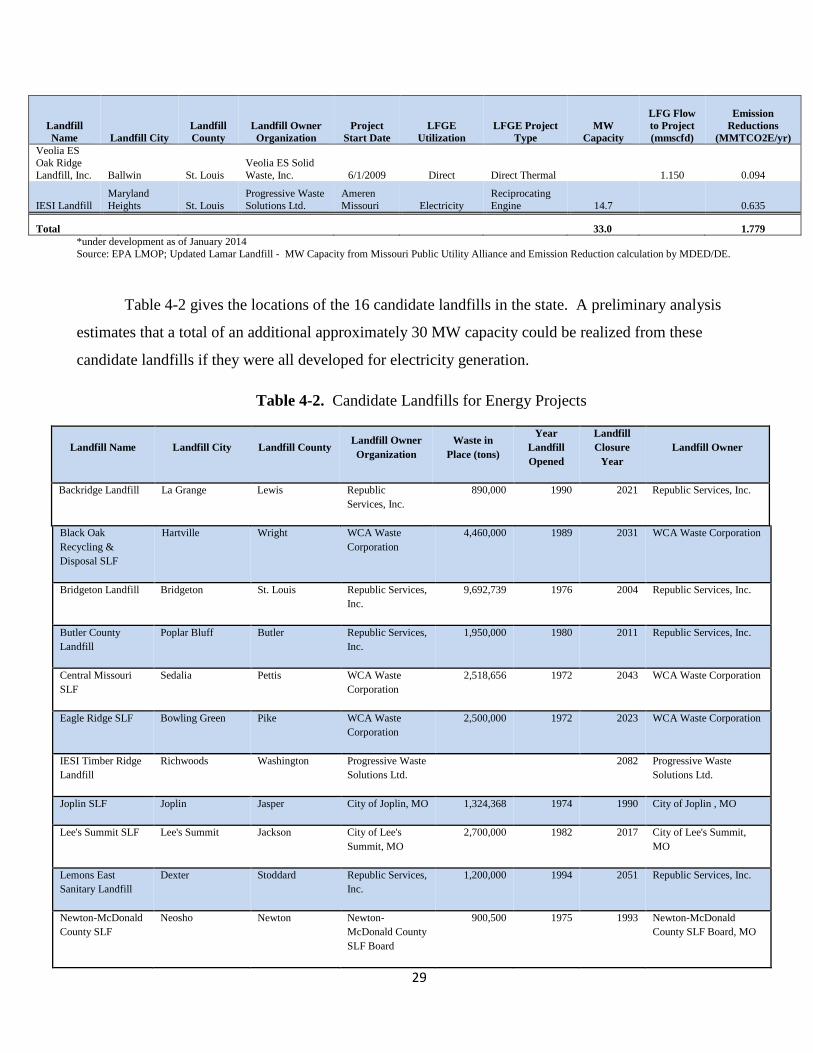
Total 33.0 1.779
*under development as of January 2014
Source: EPA LMOP; Updated Lamar Landfill - MW Capacity from Missouri Public Utility Alliance and Emission Reduction calculation by MDED/DE.
Table 4-2 gives the locations of the 16 candidate landfills in the state. A preliminary analysis
estimates that a total of an additional approximately 30 MW capacity could be realized from these
candidate landfills if they were all developed for electricity generation.
Table 4-2. Candidate Landfills for Energy Projects
Landfill Name Landfill City Landfill County Landfill Owner
Organization
Waste in
Place (tons)
Year
Landfill
Opened
Landfill
Closure
Year
Landfill Owner
Backridge Landfill La Grange Lewis Republic
Services, Inc.
890,000 1990 2021 Republic Services, Inc.
Black Oak
Recycling &
Disposal SLF
Hartville Wright WCA Waste
Corporation
4,460,000 1989 2031 WCA Waste Corporation
Bridgeton Landfill Bridgeton St. Louis Republic Services,
Inc.
9,692,739 1976 2004 Republic Services, Inc.
Butler County
Landfill
Poplar Bluff Butler Republic Services,
Inc.
1,950,000 1980 2011 Republic Services, Inc.
Central Missouri
SLF
Sedalia Pettis WCA Waste
Corporation
2,518,656 1972 2043 WCA Waste Corporation
Eagle Ridge SLF Bowling Green Pike WCA Waste
Corporation
2,500,000 1972 2023 WCA Waste Corporation
IESI Timber Ridge
Landfill
Richwoods Washington Progressive Waste
Solutions Ltd.
2082 Progressive Waste
Solutions Ltd.
Joplin SLF Joplin Jasper City of Joplin, MO 1,324,368 1974 1990 City of Joplin , MO
Lee's Summit SLF Lee's Summit Jackson City of Lee's
Summit, MO
2,700,000 1982 2017 City of Lee's Summit,
MO
Lemons East
Sanitary Landfill
Dexter Stoddard Republic Services,
Inc.
1,200,000 1994 2051 Republic Services, Inc.
Newton-McDonald
County SLF
Neosho Newton Newton-
McDonald County
SLF Board
900,500 1975 1993 Newton-McDonald
County SLF Board, MO
29

Landfill Name Landfill City Landfill County Landfill Owner
Organization
Waste in
Place (tons)
Year
Landfill
Opened
Landfill
Closure
Year
Landfill Owner
Show-Me Regional
Landfill
Warrensburg Johnson Republic Services,
Inc.
1,017,600 1992 2044 Republic Services, Inc.
Southeast SLF Kansas City Jackson Republic Services,
Inc.
8,071,606 1974 2002 Republic Services, Inc.
St. Francois County
SLF
Park Hills St. Francois St. Francois
Environmental
Corporation
894,820 1974 1993 St. Francois
Environmental
Corporation
Veolia ES Maple
Hill Landfill, Inc.
Macon Macon Veolia ES Solid
Waste, Inc.
2,274,141 1976 2079 Veolia ES Solid Waste,
Inc.
Woods Chapel SLF Blue Springs Jackson The Links at Stone Canyon, Inc.
2,100,000 1974 1994 The Links at Stone Canyon, Inc.
4.3 Spotlight on Missouri’s Landfill Gas Facilities
Columbia Landfill Gas Energy Plant, Columbia, Missouri
In 2004, Columbia voters passed a proposal to adopt a renewable portfolio standard. The goals are
a stepped program requiring Columbia to increase its use of renewable energy sources to 15 percent of
electric retail sales by December 31, 2022. In January 2014, Columbia voted to increase its goals to reach
15 percent by 2017 and 25 percent by 2022. The City of Columbia partnered with Sexton Energy, LLC in
2008 to complete a landfill gas-to-energy project. With the addition of the third generator in 2013, the
plant’s generation capacity currently reaches 3.1 MW. In 2013, Columbia’s landfill gas operations
generated 13,326 MWh of consistent power accounting for 1.12 percent of Columbia’s electric power at
$47.38 per megawatt hour.
Of all of the resources in Columbia’s renewable energy portfolio, landfill gas has had one of the
lowest impacts on rates. The average non-renewable cost in 2013 was $54.88 per megawatt hour. The
fourth generator may be added in the future that will allow enough electricity production to account for
approximately 2.5 percent of Columbia’s energy profile for the next ten years. Additionally, Columbia’s
landfill gas generation serves as a renewable base load resource.34
34
“2013 Renewable Energy Report.” Columbia Water & Light. February 2013. Web. February 6, 2013.
<http://www.gocolumbiamo.com/WaterandLight/Documents/RenewReport.pdf>.
30

St. Joseph Landfill Gas Electricity Plant, St. Joseph, Missouri
In 2010, the Kansas City Power & Light Greater Missouri Operations Company (KCP&L GMO)
partnered with the City of St. Joseph and Burns & McDonnell to develop a landfill gas–to-electricity
project at the St. Joseph Sanitary Landfill. The project was awarded a $450,000 Energize Missouri
Renewable Energy Biogas subgrant from the Missouri Division of Energy using American Recovery and
Reinvestment Act funds. This $6 million dollar project became fully operational in March of 201235
with a
1.6 MW generator and the capacity to power nearly 1,000 homes annually.36
Jefferson City Landfill Gas Utilization Project, Jefferson City, Missouri
The Jefferson City landfill gas project brought together the City of Jefferson, the City of Columbia,
the State of Missouri’s Department of Corrections, Ameresco and Republic Services (the landfill owner) to
meet the needs of all parties. This 3.2 MW facility saves approximately $500,000 annually and has the
carbon reduction equivalent of the removal of nearly 1,000 cars from the road. The power is purchased by
Columbia Water & Light through a 20-year contract, which helps the city meet its renewable portfolio
standard requirements. Additionally, Ameresco developed a system that utilizes the heat waste generated
from the facility for steam and hot water in the Jefferson City Correctional Center and Algoa Correctional
Center.37
IESI Champ Landfill, Champ, Missouri
The IESI Champ Sanitary Landfill has one of the longest histories in Missouri of utilizing landfill
gas for energy generation. This sanitary landfill has collected landfill gas and used it for fuel in its asphalt
plant burner and concrete ready mix plant boiler since 1992. In 1997, the nearby Pattonville High School
partnered with Fred Weber (the previous landfill owner) to utilize the landfill gas to power the school’s
boilers after the recommendation was made by the school’s ecology club. The project was funded by the
Missouri Division of Energy’s Energy Loan Program, a grant from St. Louis County Solid Waste
Commission and Fred Weber. The savings amount to approximately $27,000 annually, due in part to the
fact that Fred Weber provided the gas free of charge to the school. The environmental benefits are equal to
35
“American Recovery and Reinvestment Act, Energize Missouri Renewable Energy Biogas Grants.” Missouri Department of
Natural Resources. N.d. Web. 6 February 2013. <http://www.dnr.mo.gov/transform/energizemissourirenewablebiogas.htm>. 36
“Landfill gas-to-energy project will create enough renewable energy to power nearly 1,000 homes.” Missouri Governor Jay
Nixon News Releases, Office of Missouri Governor Jay Nixon. 2010. Web. February 6, 2013.
<http://governor.mo.gov/newsroom/2012/Gov_Nixon_and_KCP_L_cut_ribbon_on_renewable_energy_project_in_St_Joseph>. 37
“Algoa and Jefferson City Correction Centers.” Ameresco. 2011. Web. February 6, 2013.
<http://www.ameresco.com/sites/default/files/jefferson_city_0.pdf>.
31
the carbon sequestered annually by 22,700 acres of pine or fir forest and the annual energy savings equal to
heating 3,100 homes.38
The landfill was producing more gas than was used by the school, and it was being burned off or
flared. To capture and utilize this unused gas, Ameren Missouri partnered with the new landfill owner,
IESI Inc., to develop an additional landfill gas utilization project in 2010, frequently referred to as
Ameren’s Maryland Heights Renewable Energy Center. This landfill gas electricity generation project is
one of the largest in the nation and became operational in the summer of 2012. It consists of three 4.9 MW
turbines with the capacity to power 10,000 homes. The landfill is expected to last into 2070, providing
consistent power to the St. Louis area and allowing Ameren to use the power generated for compliance
with Missouri’s renewable energy standard. 39
State Fair Community College, Sedalia, Missouri
State Fair Community College partnered with the West Corporation, which owns the Missouri
Central Landfill, various local, state and federal government agencies and private businesses to develop the
landfill gas project to generate electricity for the college and to provide training opportunities for students.
The initial phase of the operation is expected to have a 1.6 MW capacity. The second phase seeks to
develop an energy technology incubator to assist emerging businesses with exploring next generation
energy technologies and allow training opportunities for students.40
This project was under development as
of early 2014.
38
“Landfill Methane Outreach Program, Project profile: Fred Weber”, United States Environmental Protection Agency. 15 July
2010. Web. February 6, 2013. <http://www.epa.gov/lmop/projects-candidates/profiles/fredweberpattonvillehighs.html>. 39
Tomich, Jeffrey. “Five Questions with Ameren Missouri’s Bill Barbieri”. St. Louis Post-Dispatch. April 27, 2012. Web.
February 6, 2013. <http://www.stltoday.com/business/local/five-questions-with-ameren-missouri-s-bill-
barbieri/article_6426b2f6-8fb8-11e1-aac1-0019bb30f31a.html>. 40
“Missouri Center for Waste to Energy”, State Fair Community College. 2010. Web. February 6, 2013.
<http://www.sfccmo.edu/pages/1446.asp>.
32
33
5. Biomass
5.1 Resource Overview
Biomass typically means any organic matter from plants or animals. Domestic biomass resources
include agricultural crops and residues, manure and wastes from animal feeding facilities, forest and wood
processing residues, municipal wastes and terrestrial and aquatic energy crops grown solely for energy
purposes. As a valuable renewable resource, biomass provides a wide range of products such as food,
fiber, heat, power, fuels and chemicals. In addition, biomass, like field crop and forest residues, can
provide necessary organic matter and nutrients for plant growth and reduce soil erosion.
As a major producer of agricultural and forest commodities in the nation, Missouri has an abundant
and diverse biomass resource base, which holds a significant potential for bioenergy, biofuels and
biochemicals. Various uncertainties like availability, sustainable management and technical and economic
constraints, have resulted in limited scale development of Missouri’s biomass resources. However,
increasing environmental and energy independence concerns make biomass production, conversion and use
a more promising option for Missouri. Increased use of biomass resources can reduce dependence on
imported fossil energy sources, create more job opportunities and stimulate the rural economy.
The types of biomass currently produced in the state include agricultural biomass, forest biomass
and municipal wastes. The agricultural biomass comes primarily from field and seed crops and their
residue, animal manure and wastes and food processing operations. Forest biomass is the residue and
waste produced mostly from timber harvesting and processing and from forest thinning and other forest
management practices. In addition, municipal solid waste (MSW) generates a large quantity of biomass.
According to the Missouri Department of Natural Resources’ Solid Waste Management Program, the
average MSW generation rate per capita in Missouri is approximately seven pounds per day, which is much
higher than the national average of 4.6 pounds.41
Dedicated energy crops and algae are also attracting more
interest in the state.
41
“The 2006-2007 Missouri Municipal Solid Waste Composition Study,” Missouri Department of Natural Resources, Solid
Waste Management Program. October 2007. Web. February 6, 2013.
<http://www.dnr.mo.gov/env/swmp/docs/wcsintroduction.pdf>.
5.2 Biomass Resources Availability and Opportunities
A 2005 study from the National Renewable Energy Laboratory (NREL)42
examined the availability
of technical biomass resources in the United States. The biomass categories in this study include
agricultural residues (crop residues and animal manure), wood residues (forest residues, primary mill
residues, secondary mill residues and urban wood residues), methane from landfills and domestic
wastewater treatment and dedicated energy crops in the Conservation Reserve Program (CRP) lands.
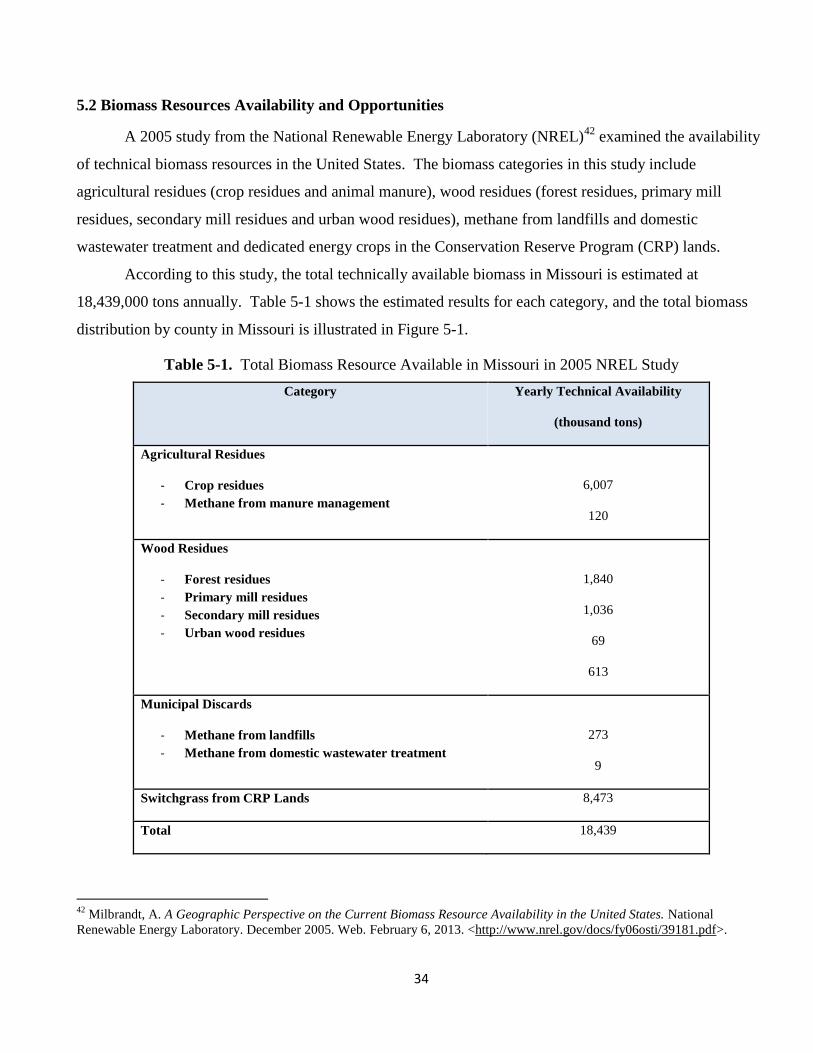
According to this study, the total technically available biomass in Missouri is estimated at
18,439,000 tons annually. Table 5-1 shows the estimated results for each category, and the total biomass
distribution by county in Missouri is illustrated in Figure 5-1.
Table 5-1. Total Biomass Resource Available in Missouri in 2005 NREL Study
Category Yearly Technical Availability
(thousand tons)
Agricultural Residues
- Crop residues
- Methane from manure management
6,007
120
Wood Residues
- Forest residues
- Primary mill residues
- Secondary mill residues
- Urban wood residues
1,840
1,036
69
613
Municipal Discards
- Methane from landfills
- Methane from domestic wastewater treatment
273
9
Switchgrass from CRP Lands 8,473
Total 18,439
42
Milbrandt, A. A Geographic Perspective on the Current Biomass Resource Availability in the United States. National
Renewable Energy Laboratory. December 2005. Web. February 6, 2013. <http://www.nrel.gov/docs/fy06osti/39181.pdf>.
34
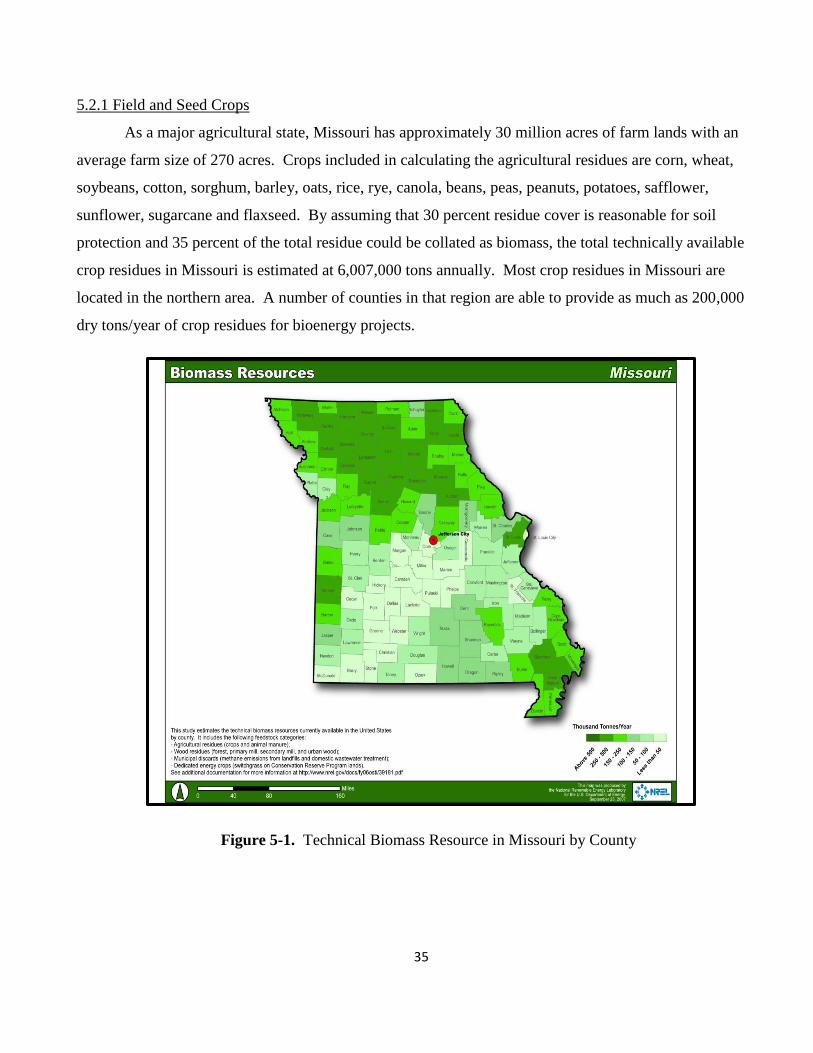
5.2.1 Field and Seed Crops
As a major agricultural state, Missouri has approximately 30 million acres of farm lands with an
average farm size of 270 acres. Crops included in calculating the agricultural residues are corn, wheat,
soybeans, cotton, sorghum, barley, oats, rice, rye, canola, beans, peas, peanuts, potatoes, safflower,
sunflower, sugarcane and flaxseed. By assuming that 30 percent residue cover is reasonable for soil
protection and 35 percent of the total residue could be collated as biomass, the total technically available
crop residues in Missouri is estimated at 6,007,000 tons annually. Most crop residues in Missouri are
located in the northern area. A number of counties in that region are able to provide as much as 200,000
dry tons/year of crop residues for bioenergy projects.
Figure 5-1. Technical Biomass Resource in Missouri by County
35
36
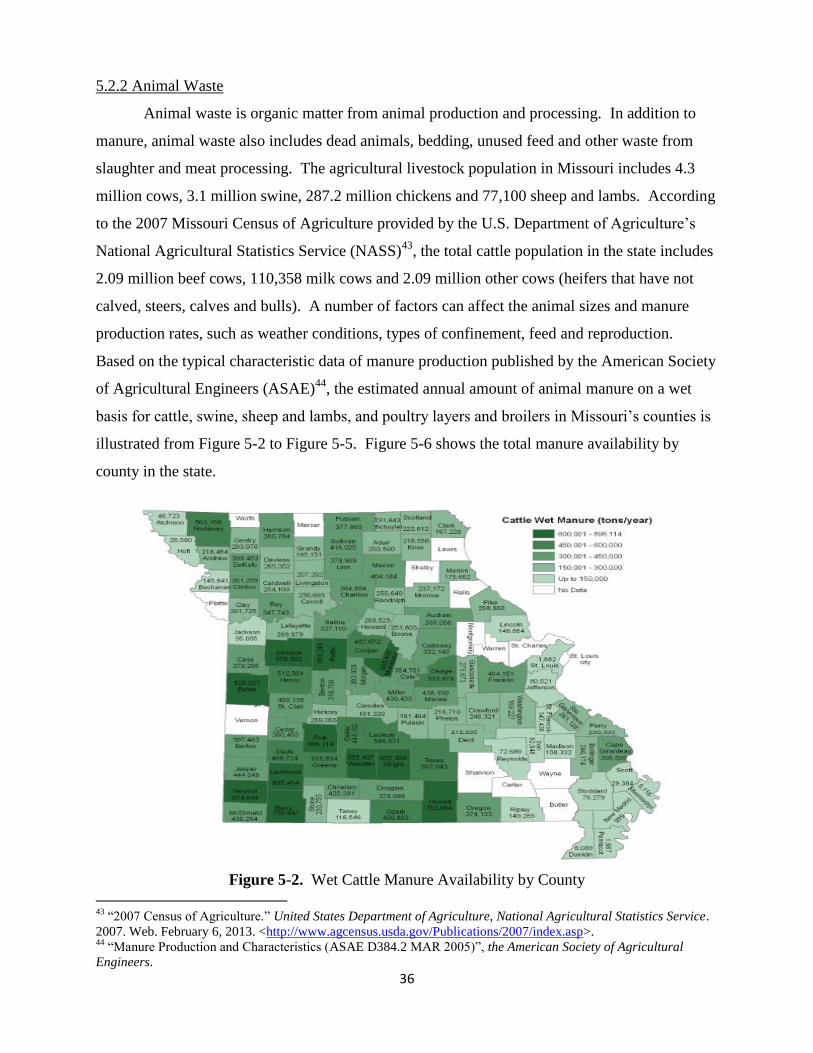
5.2.2 Animal Waste
Animal waste is organic matter from animal production and processing. In addition to
manure, animal waste also includes dead animals, bedding, unused feed and other waste from
slaughter and meat processing. The agricultural livestock population in Missouri includes 4.3
million cows, 3.1 million swine, 287.2 million chickens and 77,100 sheep and lambs. According
to the 2007 Missouri Census of Agriculture provided by the U.S. Department of Agriculture’s
National Agricultural Statistics Service (NASS)43
, the total cattle population in the state includes
2.09 million beef cows, 110,358 milk cows and 2.09 million other cows (heifers that have not
calved, steers, calves and bulls). A number of factors can affect the animal sizes and manure
production rates, such as weather conditions, types of confinement, feed and reproduction.
Based on the typical characteristic data of manure production published by the American Society
of Agricultural Engineers (ASAE)44
, the estimated annual amount of animal manure on a wet
basis for cattle, swine, sheep and lambs, and poultry layers and broilers in Missouri’s counties is
illustrated from Figure 5-2 to Figure 5-5. Figure 5-6 shows the total manure availability by
county in the state.
Figure 5-2. Wet Cattle Manure Availability by County
43
“2007 Census of Agriculture.” United States Department of Agriculture, National Agricultural Statistics Service.
2007. Web. February 6, 2013. <http://www.agcensus.usda.gov/Publications/2007/index.asp>. 44
“Manure Production and Characteristics (ASAE D384.2 MAR 2005)”, the American Society of Agricultural
Engineers.
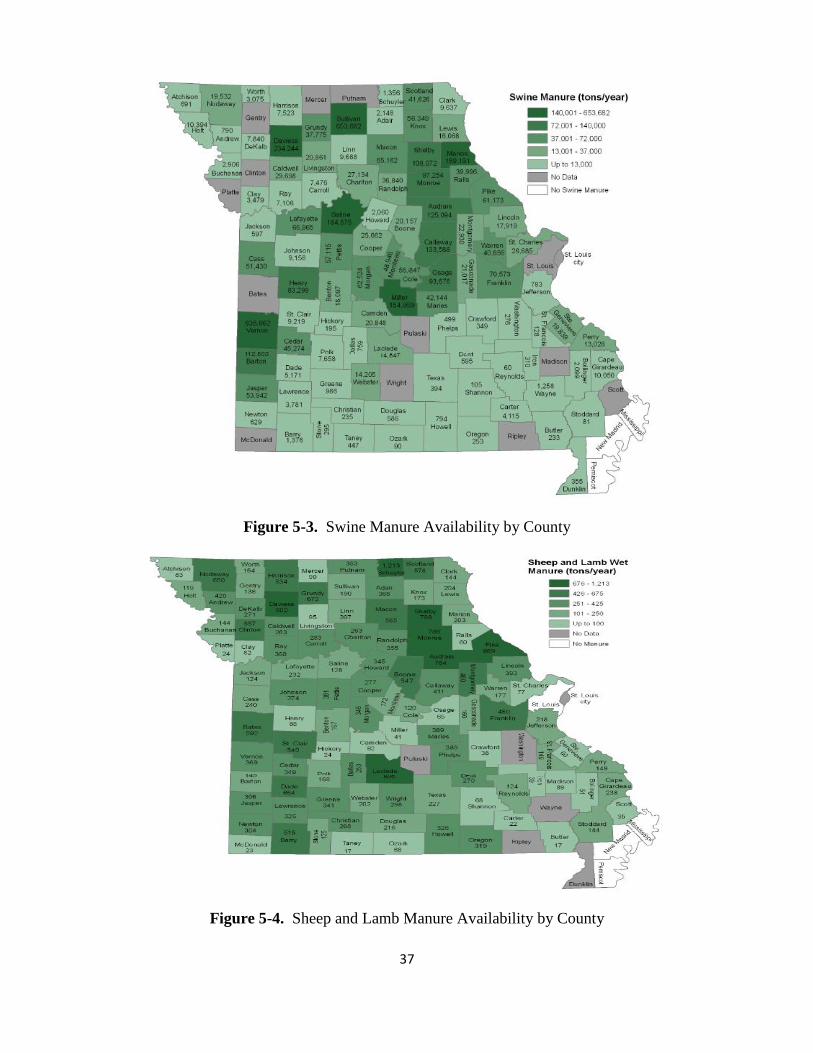
Figure 5-3. Swine Manure Availability by County
Figure 5-4. Sheep and Lamb Manure Availability by County
37

Figure 5-5. Poultry Layer and Broiler Manure Availability by County
Figure 5-6. Total Animal Manure Availability by County
38

5.2.3 Woody Biomass
Forest residues include logging residues and other removals after carrying out silviculture
operations and site conversion. Logging residues are the unused portions of trees cut or killed by
logging and left in the woods. Other removals are considered trees cut or otherwise killed by
cultural operations (e.g. pre-commercial thinning, weeding, etc.) or land clearings and forest uses
that are not directly associated with round wood product harvests. Most southeast and southeast
central counties in Missouri have at least 25,000 dry tons/year forest residues and more than ten
counties are even in the range of 50-100,000 dry tons/year. Furthermore, the U.S. Billion-Ton
report update in 201145
estimated the economic availability of logging residues. About one
million dry tons of logging residues are available annually at $80 per dry ton in the next 20 years
in Missouri. A simulation model also indicated that annual biomass from forest thinning are
300,000, 560,000 and 810,000 dry tons for the price of $20, $40 and $100, respectively.
Primary mill residues are composed of wood materials (coarse and fine) and bark
generated at manufacturing plants (primary wood-using mills) when round wood products are
processed into primary wood products like slabs, edgings, trimmings, sawdust, veneer clippings
and cores and pulp screenings. It includes mill residues recycled as by-products as well as those
left unutilized and disposed of as waste. Secondary mill residues include wood scraps and
sawdust from woodworking shops— furniture factories, wood container and pallet mills and
wholesale lumberyards. Those resources are located in southeast Missouri. Combining all forest
residues and primary and secondary mill residues, the forest and its product industry are able to
provide as much as 2,945,000 dry tons of biomass every year.
Urban wood waste includes wood residues from municipal solid waste (wood chips,
pallets and yard waste), utility tree trimming and/or private tree companies and
construction/demolition wood. The availability of urban wood waste largely depends on
population density, economic condition and industrial structure. The recently updated national
urban wood waste availability shows Kansas City and St. Louis areas are still the primary
sources for urban wood wastes. Both areas can provide more than 50,000 dry tons/year of urban
wood wastes. The Springfield area can also provide considerable amounts of this biomass
resource. The amount of urban wood waste is increasing in the Columbia area due to city
expansion.
45
“U.S. Billion-Ton Update”, United States Department of Energy. August 2011. Web. February 6, 2013.
<http://www1.eere.energy.gov/biomass/pdfs/billion_ton_update.pdf>.
39
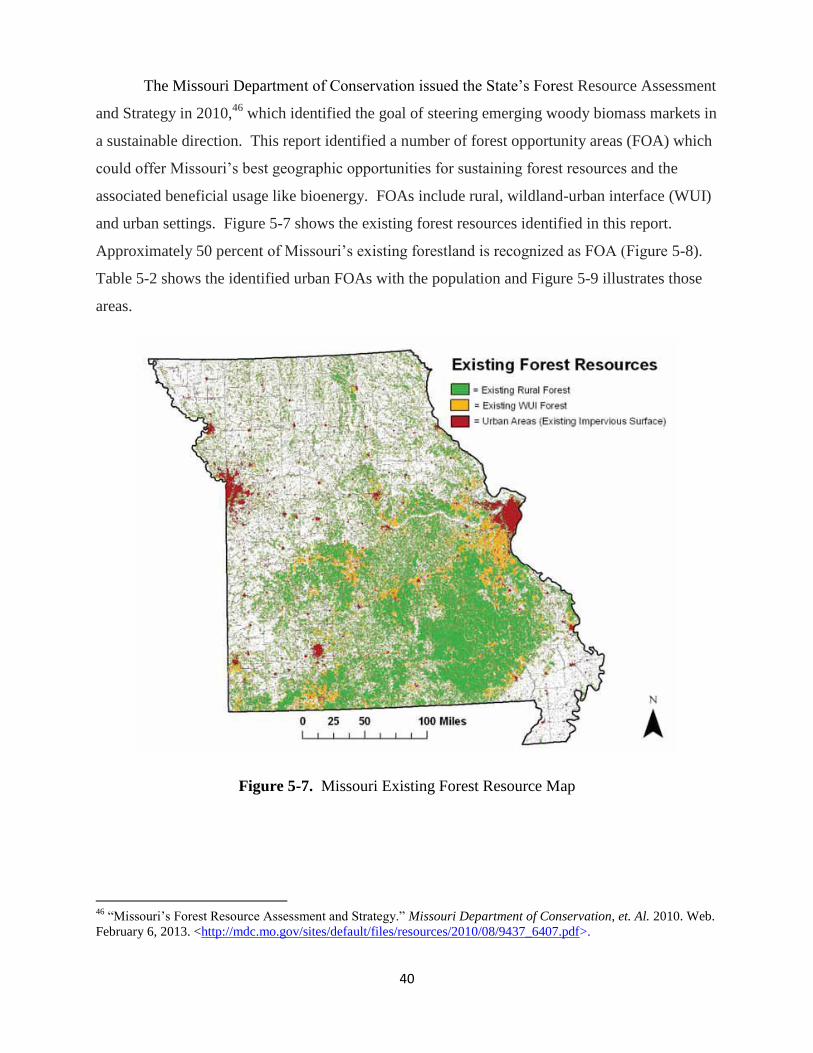
The Missouri Department of Conservation issued the State’s Forest Resource Assessment
and Strategy in 2010,46
which identified the goal of steering emerging woody biomass markets in
a sustainable direction. This report identified a number of forest opportunity areas (FOA) which
could offer Missouri’s best geographic opportunities for sustaining forest resources and the
associated beneficial usage like bioenergy. FOAs include rural, wildland-urban interface (WUI)
and urban settings. Figure 5-7 shows the existing forest resources identified in this report.
Approximately 50 percent of Missouri’s existing forestland is recognized as FOA (Figure 5-8).
Table 5-2 shows the identified urban FOAs with the population and Figure 5-9 illustrates those
areas.
Figure 5-7. Missouri Existing Forest Resource Map
46
“Missouri’s Forest Resource Assessment and Strategy.” Missouri Department of Conservation, et. Al. 2010. Web.
February 6, 2013. <http://mdc.mo.gov/sites/default/files/resources/2010/08/9437_6407.pdf>.
40
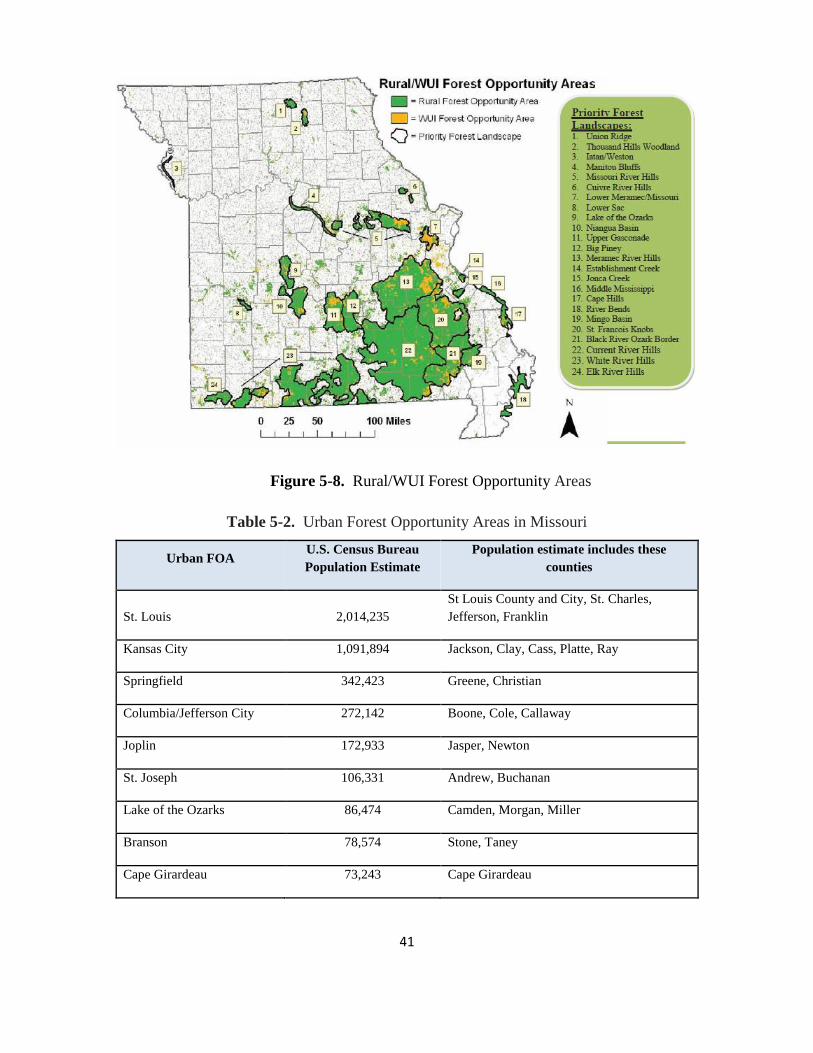
Figure 5-8. Rural/WUI Forest Opportunity Areas
Table 5-2. Urban Forest Opportunity Areas in Missouri
Urban FOA U.S. Census Bureau
Population Estimate
Population estimate includes these
counties
St. Louis 2,014,235
St Louis County and City, St. Charles,
Jefferson, Franklin
Kansas City 1,091,894 Jackson, Clay, Cass, Platte, Ray
Springfield 342,423 Greene, Christian
Columbia/Jefferson City 272,142 Boone, Cole, Callaway
Joplin 172,933 Jasper, Newton
St. Joseph 106,331 Andrew, Buchanan
Lake of the Ozarks 86,474 Camden, Morgan, Miller
Branson 78,574 Stone, Taney
Cape Girardeau 73,243 Cape Girardeau
41
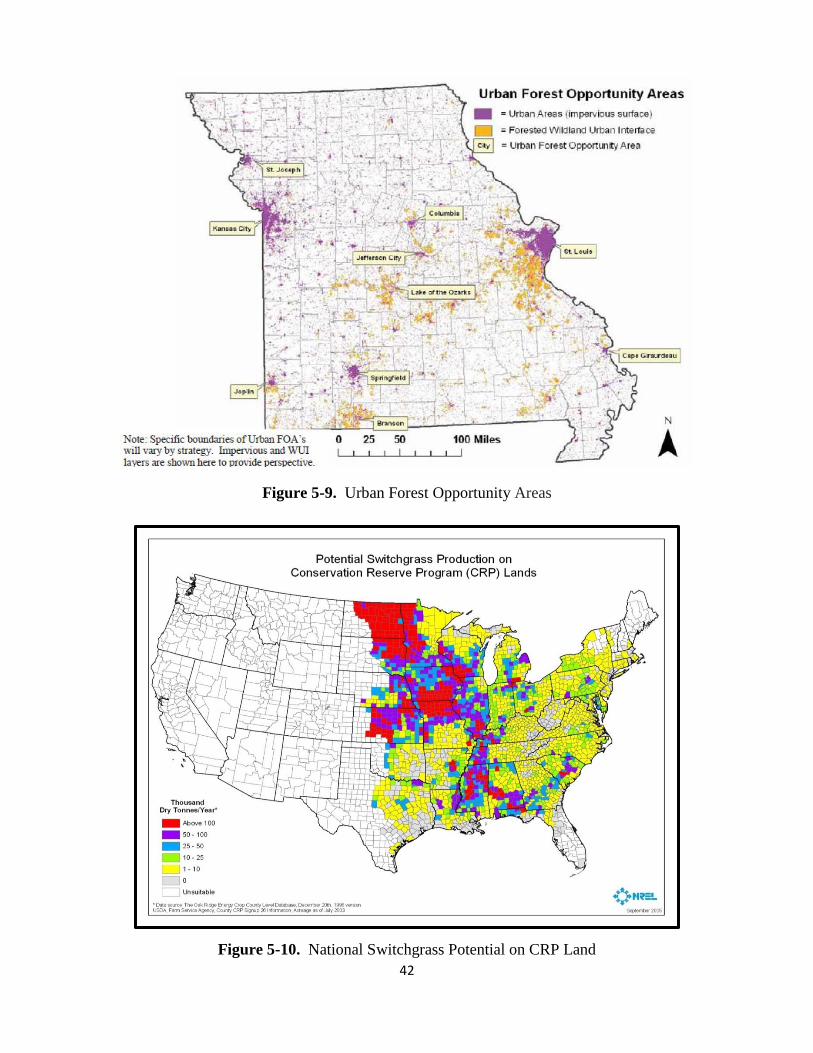
Figure 5-9. Urban Forest Opportunity Areas
Figure 5-10. National Switchgrass Potential on CRP Land
42

5.2.4 Energy Crops
As a promising herbaceous energy crop, switchgrass has been increasingly attractive as a
feedstock for biomass pellets and biofuels production over the past decade. Missouri,
particularly in the northern region, has a great potential for growing switchgrass on Conservation
Reserve Program (CRP) lands. It was estimated that the state can supply nearly nine million dry
tons of switchgrass annually, which accounts for more than 10 percent of national switchgrass
potential. Woody energy crops like willow or hybrid poplar can potentially be grown on CRP
land, too. A rough estimate indicates that the potential production of seven million dry tons of
willow or hybrid poplar yearly can be achieved from CRP lands in Missouri. It accounts for over
15 percent of national potential.
5.2.5 Municipal Waste
Municipal wastes include mostly municipal solid waste (MSW) along with municipal
wastewater sludge from treatment facilities. Municipal solid waste includes primarily household
wastes in addition to some commercial wastes collected by a municipality within a given area.
Municipal solid waste normally excludes industrial hazardous wastes even though household
hazardous waste, such as batteries and light bulbs, is considered as municipal solid waste in
some definitions, considering the very limited amount. Municipal solid waste can be categorized
as biodegradable waste (food, kitchen waste and paper), recyclable material (paper, glass, metals,
cans and some plastics), inert waste (construction and demolition waste, concrete and dirt) and
composite wastes (clothing and waste plastics).
The quantity and composition of municipal solid waste varies significantly with
population, size and economic activities conducted in a specific area. For instance, rapidly
growing areas will typically have larger scale construction activities, which would result in
greater amounts of construction wastes, like wood and dirt. In contrast, if tourism is a major
local industry, municipal solid waste in that area may contain more vegetable and food wastes.
Thus, project developers should consider those factors when evaluating the local biomass
availability derived from MSW.
According to the Missouri Department of Natural Resources’ Solid Waste Management
Program, it is estimated that the total amount of waste disposed in Missouri landfills during 2006
43
was 4,500,160 tons, which is equivalent to 1,698 pounds per capita annually. Since around 60
percent of the waste stream generated in the state is MSW, the quantity of MSW in the Missouri
waste stream for disposal in 2006 was estimated to be 2.7 million tons. The annual waste
generation per capita is around 2.14 tons, which corresponds to 7.0 pounds MSW per capita per
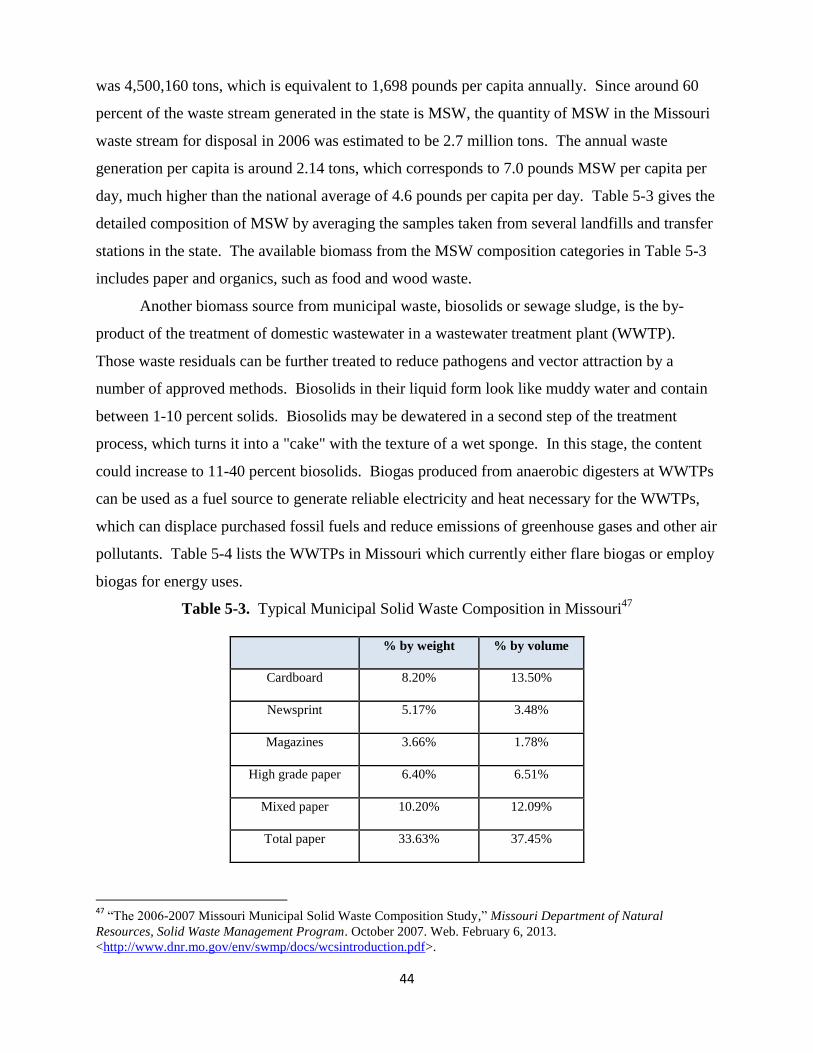
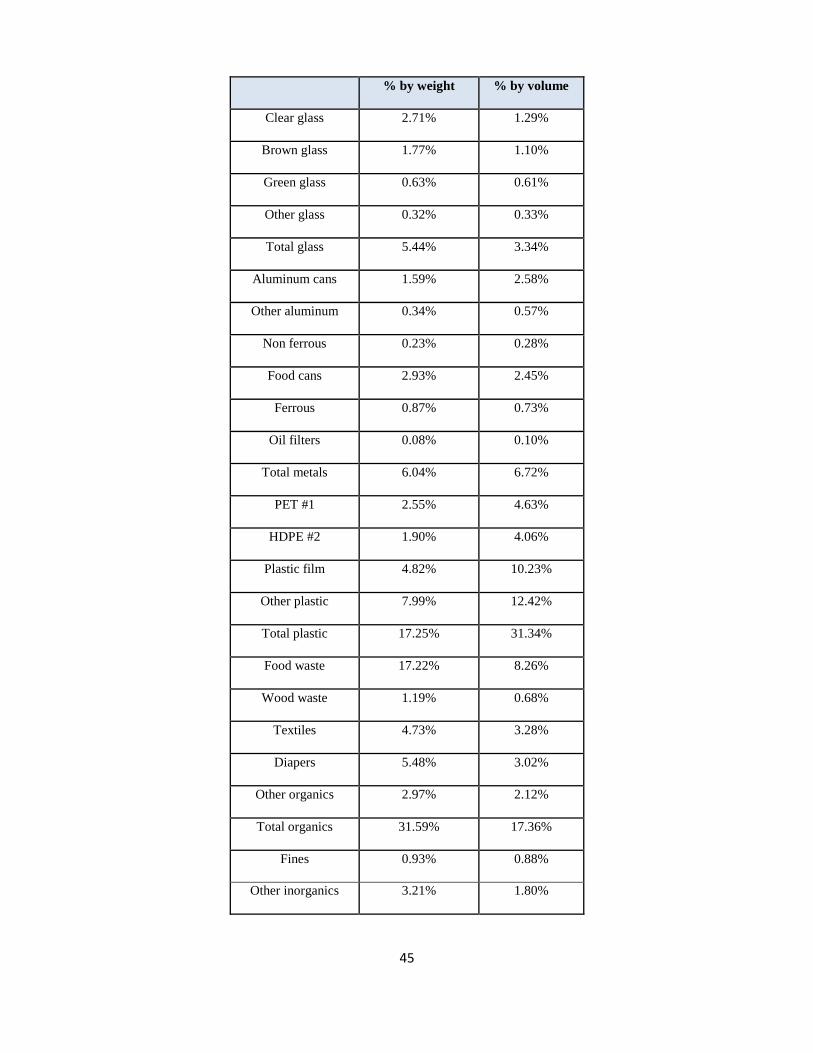
day, much higher than the national average of 4.6 pounds per capita per day. Table 5-3 gives the
detailed composition of MSW by averaging the samples taken from several landfills and transfer
stations in the state. The available biomass from the MSW composition categories in Table 5-3
includes paper and organics, such as food and wood waste.
Another biomass source from municipal waste, biosolids or sewage sludge, is the by-
product of the treatment of domestic wastewater in a wastewater treatment plant (WWTP).
Those waste residuals can be further treated to reduce pathogens and vector attraction by a
number of approved methods. Biosolids in their liquid form look like muddy water and contain
between 1-10 percent solids. Biosolids may be dewatered in a second step of the treatment
process, which turns it into a "cake" with the texture of a wet sponge. In this stage, the content
could increase to 11-40 percent biosolids. Biogas produced from anaerobic digesters at WWTPs
can be used as a fuel source to generate reliable electricity and heat necessary for the WWTPs,
which can displace purchased fossil fuels and reduce emissions of greenhouse gases and other air
pollutants. Table 5-4 lists the WWTPs in Missouri which currently either flare biogas or employ
biogas for energy uses.
Table 5-3. Typical Municipal Solid Waste Composition in Missouri47
% by weight % by volume
Cardboard 8.20% 13.50%
Newsprint 5.17% 3.48%
Magazines 3.66% 1.78%
High grade paper 6.40% 6.51%
Mixed paper 10.20% 12.09%
Total paper 33.63% 37.45%
47
“The 2006-2007 Missouri Municipal Solid Waste Composition Study,” Missouri Department of Natural
Resources, Solid Waste Management Program. October 2007. Web. February 6, 2013.
<http://www.dnr.mo.gov/env/swmp/docs/wcsintroduction.pdf>.
44
% by weight % by volume
Clear glass 2.71% 1.29%
Brown glass 1.77% 1.10%
Green glass 0.63% 0.61%
Other glass 0.32% 0.33%
Total glass 5.44% 3.34%
Aluminum cans 1.59% 2.58%
Other aluminum 0.34% 0.57%
Non ferrous 0.23% 0.28%
Food cans 2.93% 2.45%
Ferrous 0.87% 0.73%
Oil filters 0.08% 0.10%
Total metals 6.04% 6.72%
PET #1 2.55% 4.63%
HDPE #2 1.90% 4.06%
Plastic film 4.82% 10.23%
Other plastic 7.99% 12.42%
Total plastic 17.25% 31.34%
Food waste 17.22% 8.26%
Wood waste 1.19% 0.68%
Textiles 4.73% 3.28%
Diapers 5.48% 3.02%
Other organics 2.97% 2.12%
Total organics 31.59% 17.36%
Fines 0.93% 0.88%
Other inorganics 3.21% 1.80%
45

% by weight % by volume
Total inorganics 4.14% 2.68%
HHW 0.92% 0.88%
Electronic waste 0.99% 0.50%
Total special waste 1.91% 1.10%
Total composition 100% 100%
Table 5-4. WWTPs Employing Biogas Technology in Missouri (million gallons per day)48
Name City County Flow Design
(MGD)
Flow Average
(MGD)
Carrollton WWTP Carrollton Carroll 3.3 0.7
Shoal Creek Facility Joplin Newton 6.5 3.5
Kirksville WWTP Kirksville Adair 3.16 2.35
Springfield SW WWTP Springfield Greene 42.5 35
Turkey Creek WWTP Joplin Jasper 15 9.3
Missouri River WWTP St. Louis St. Louis 28 30
Columbia WWTP Columbia Boone 20.6 15.5
St. Joseph WWTP St. Joseph Buchanan 27 19
Mexico WWTP Mexico Audrain 6 2.2
K.C. Blue River STP Kansas City Jackson 105 70
Sedalia North WWTP Sedalia Pettis 2.5 1
5.2.6 Algae
Algal biofuels have been generating considerable interest over the past few years in the
state and hold the potential to solve many of the sustainability challenges facing other biofuels
today. The Missouri Technology Corporation (MTC) conducted a study in 2011 that developed a
roadmap for algae research, development, demonstration and commercialization in Missouri,
with a $180,000 grant using American Recovery and Reinvestment Act funds awarded by the
48
Biogas Data. 2012. Web. February 6, 2013. <http://www.biogasdata.org>.
46
Missouri Division of Energy. The final report, titled “Energize Missouri: Algae-based
Renewable Energy Study,” 49
assesses the potential benefits to the state economy from a healthy
and robust algae industry, and makes a number of recommendations to maintain and strengthen
Missouri’s leadership in the algae biofuels area.
As indicated in this report, a host of Missouri-based institutions are active in addressing
research needs in the algal biofuels field. Missouri excels in algae research and development and
is one of only two algae hubs supported by the U.S. Department of Energy. The report
concluded that the Bootheel is the most favorable area of the state and capable of
accommodating large or smaller scale facilities for algae production.
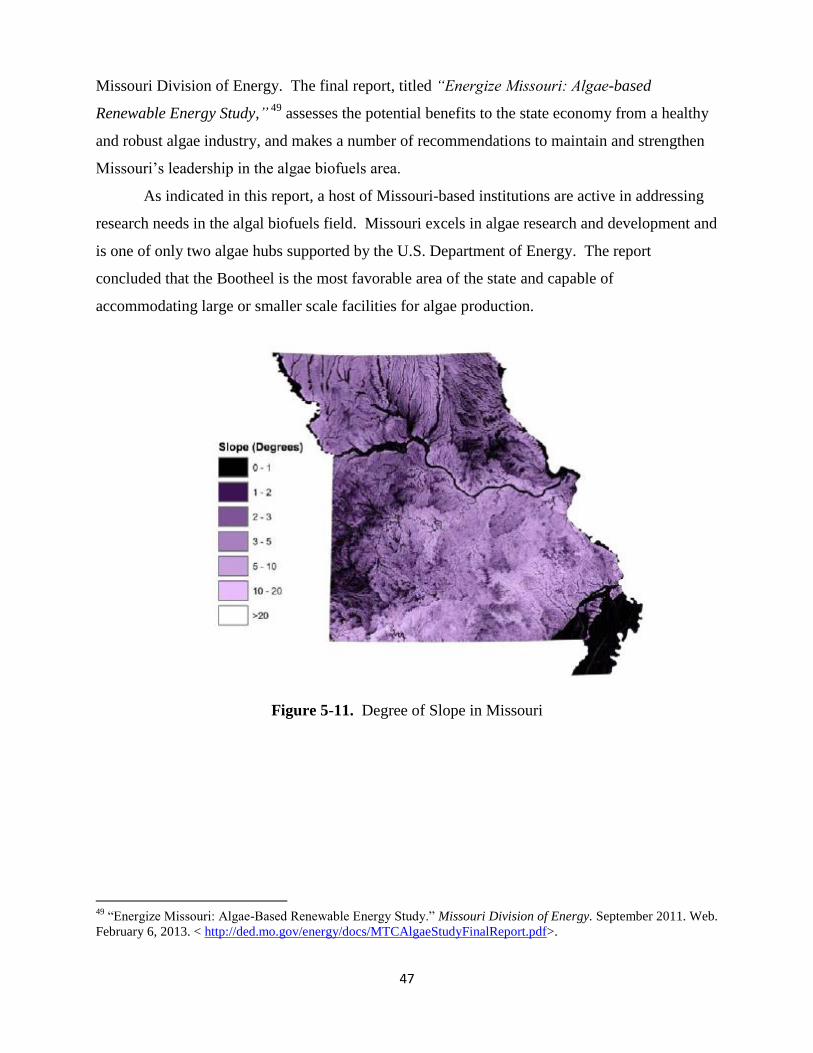
Figure 5-11. Degree of Slope in Missouri
49
“Energize Missouri: Algae-Based Renewable Energy Study.” Missouri Division of Energy. September 2011. Web.
February 6, 2013. < http://ded.mo.gov/energy/docs/MTCAlgaeStudyFinalReport.pdf>.
47
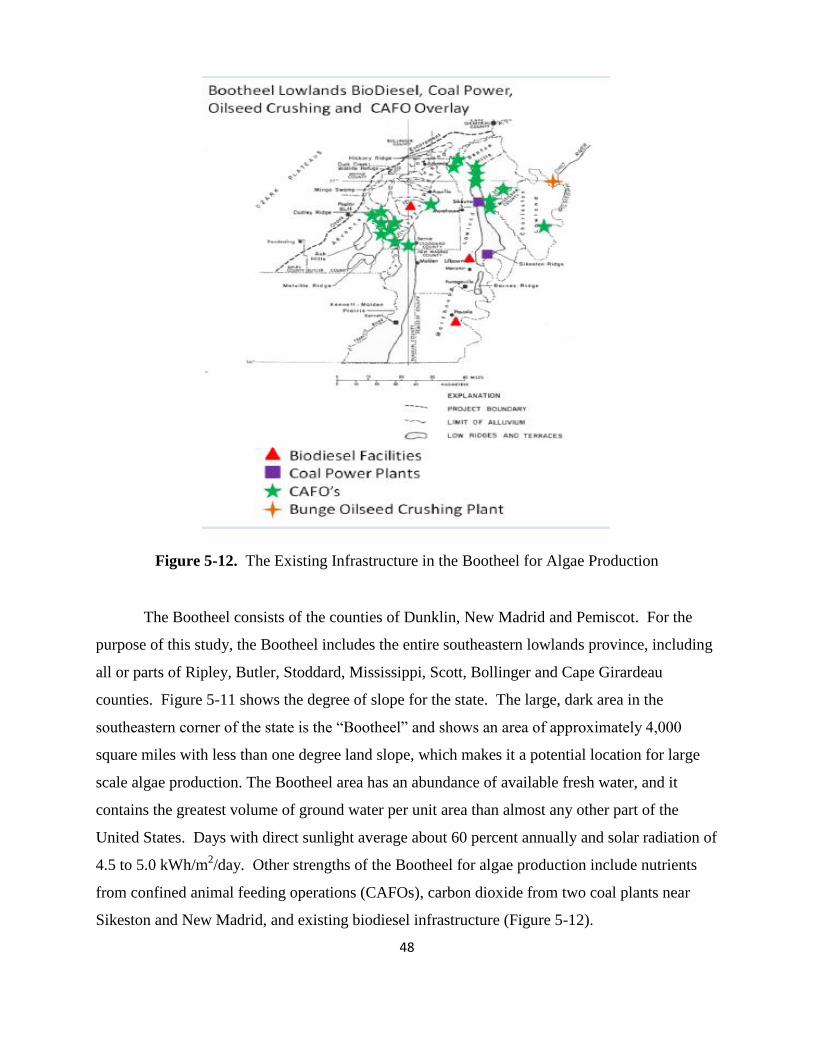
Figure 5-12. The Existing Infrastructure in the Bootheel for Algae Production
The Bootheel consists of the counties of Dunklin, New Madrid and Pemiscot. For the
purpose of this study, the Bootheel includes the entire southeastern lowlands province, including
all or parts of Ripley, Butler, Stoddard, Mississippi, Scott, Bollinger and Cape Girardeau
counties. Figure 5-11 shows the degree of slope for the state. The large, dark area in the
southeastern corner of the state is the “Bootheel” and shows an area of approximately 4,000
square miles with less than one degree land slope, which makes it a potential location for large
scale algae production. The Bootheel area has an abundance of available fresh water, and it
contains the greatest volume of ground water per unit area than almost any other part of the
United States. Days with direct sunlight average about 60 percent annually and solar radiation of
4.5 to 5.0 kWh/m2/day. Other strengths of the Bootheel for algae production include nutrients
from confined animal feeding operations (CAFOs), carbon dioxide from two coal plants near
Sikeston and New Madrid, and existing biodiesel infrastructure (Figure 5-12).
48
49
6. Biofuels 6.1 Ethanol
6.1.1 Background and History
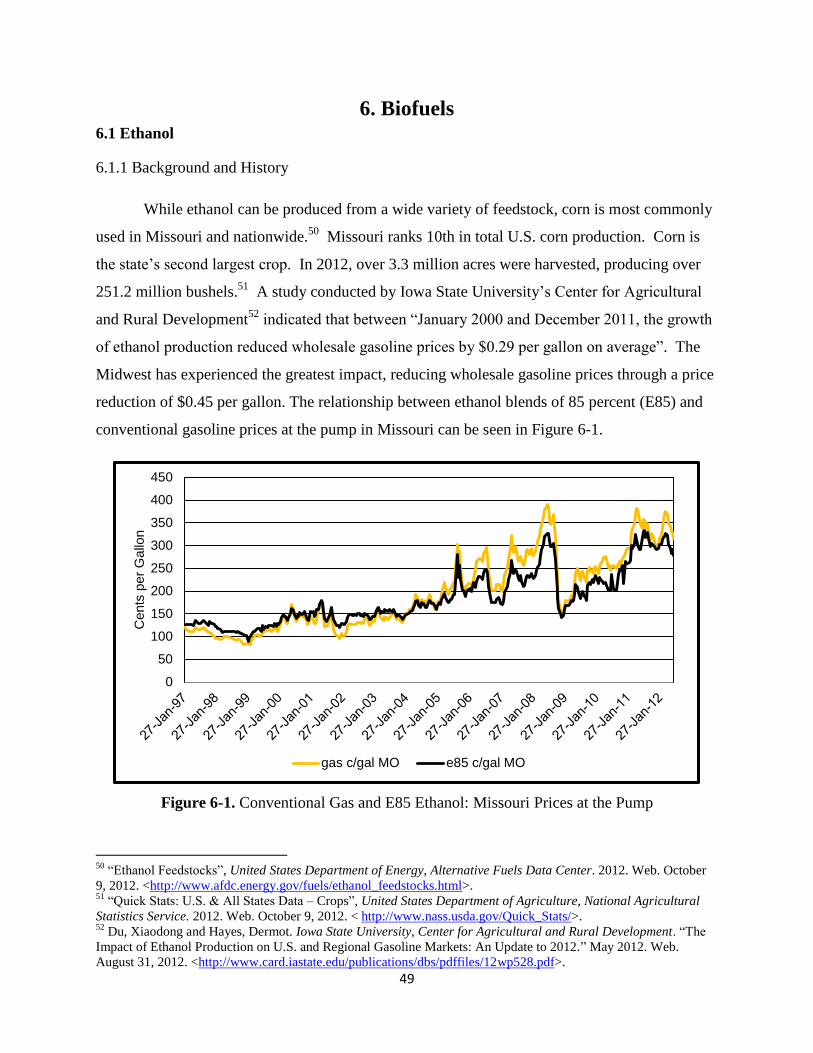
While ethanol can be produced from a wide variety of feedstock, corn is most commonly
used in Missouri and nationwide.50
Missouri ranks 10th in total U.S. corn production. Corn is
the state’s second largest crop. In 2012, over 3.3 million acres were harvested, producing over
251.2 million bushels.51
A study conducted by Iowa State University’s Center for Agricultural
and Rural Development52
indicated that between “January 2000 and December 2011, the growth
of ethanol production reduced wholesale gasoline prices by $0.29 per gallon on average”. The
Midwest has experienced the greatest impact, reducing wholesale gasoline prices through a price
reduction of $0.45 per gallon. The relationship between ethanol blends of 85 percent (E85) and
conventional gasoline prices at the pump in Missouri can be seen in Figure 6-1.
Figure 6-1. Conventional Gas and E85 Ethanol: Missouri Prices at the Pump
50
“Ethanol Feedstocks”, United States Department of Energy, Alternative Fuels Data Center. 2012. Web. October
9, 2012. <http://www.afdc.energy.gov/fuels/ethanol_feedstocks.html>. 51
“Quick Stats: U.S. & All States Data – Crops”, United States Department of Agriculture, National Agricultural
Statistics Service. 2012. Web. October 9, 2012. < http://www.nass.usda.gov/Quick_Stats/>. 52
Du, Xiaodong and Hayes, Dermot. Iowa State University, Center for Agricultural and Rural Development. “The
Impact of Ethanol Production on U.S. and Regional Gasoline Markets: An Update to 2012.” May 2012. Web.
August 31, 2012. <http://www.card.iastate.edu/publications/dbs/pdffiles/12wp528.pdf>.
0
50
100
150
200
250
300
350
400
450
Cents
per
Gallo
n
gas c/gal MO e85 c/gal MO
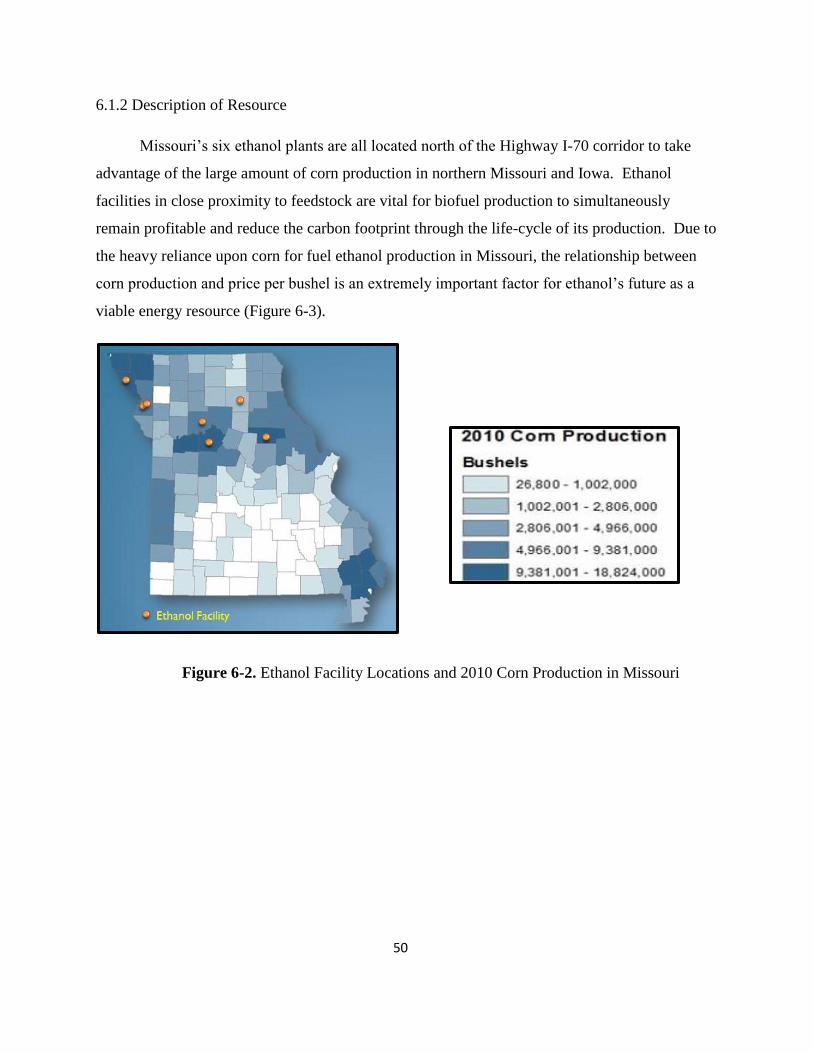
6.1.2 Description of Resource
Missouri’s six ethanol plants are all located north of the Highway I-70 corridor to take
advantage of the large amount of corn production in northern Missouri and Iowa. Ethanol
facilities in close proximity to feedstock are vital for biofuel production to simultaneously
remain profitable and reduce the carbon footprint through the life-cycle of its production. Due to
the heavy reliance upon corn for fuel ethanol production in Missouri, the relationship between
corn production and price per bushel is an extremely important factor for ethanol’s future as a
viable energy resource (Figure 6-3).
Figure 6-2. Ethanol Facility Locations and 2010 Corn Production in Missouri
50

Figure 6-3. Corn Production and Price in Missouri: 1979-2009
6.1.3. Current State of Ethanol Production
As of August 2012, Missouri had nameplate ethanol production capacity of 271 million
gallons a year (MMGY) and ranked 13th
in the nation in ethanol production (Figure 6-4).53
The breakdown of six individual Missouri ethanol plants in production capacity is shown
in Figure 6-5. Missouri legislation has encouraged the expansion of the ethanol industry by
providing financial incentives to Missouri citizen majority-owned plants and by requiring
conventional gasoline to be blended with ethanol as long as the price of ethanol does not exceed
that of conventional gasoline.54
53
“Ethanol Facilities’ Capacity by State”, State of Nebraska, Nebraska Energy Office. August 2012. Web. October
9, 2012. <http://www.neo.ne.gov/statshtml/121.htm>. 54
“The Missouri Renewable Fuel Standard Act.” Missouri Department of Agriculture. 2012. Web. August 31, 2012.
<http://mda.mo.gov/weights/fuel/renewablefuelstandard.php>.
51
0
0.5
1
1.5
2
2.5
3
3.5
4
4.5
0
50,000
100,000
150,000
200,000
250,000
300,000
350,000
400,000
450,000
500,000
$/B
ushel
Thousand B
ushels
Production (1,000 Bushels) Price ($ per Bushel)

Figure 6-4. U.S. Ethanol Nameplate Capacities by State (2012)
Figure 6-5. Missouri Ethanol Refineries (2012)
6.2 Biodiesel
6.2.1 Description of Resource
In 2002, the Missouri Department of Agriculture (MDA) established and implemented
the first fund to encourage biodiesel production.55
The Biodiesel Producers Incentive Fund was
established to encourage Missouri-owned biodiesel production from 100 percent U.S. originated
55
“Missouri Biodiesel Producer Incentive Fund”, Missouri Department of Agriculture, Assistance for Producer.
2012. Web. August 31, 2012. <http://mda.mo.gov/abd/financial/biodiesel.php>.
52
0
500
1,000
1,500
2,000
2,500
3,000M
MG
Y
0
20
40
60
MM
GY
Nameplate Capacity (mgy) Operating Production (mgy)
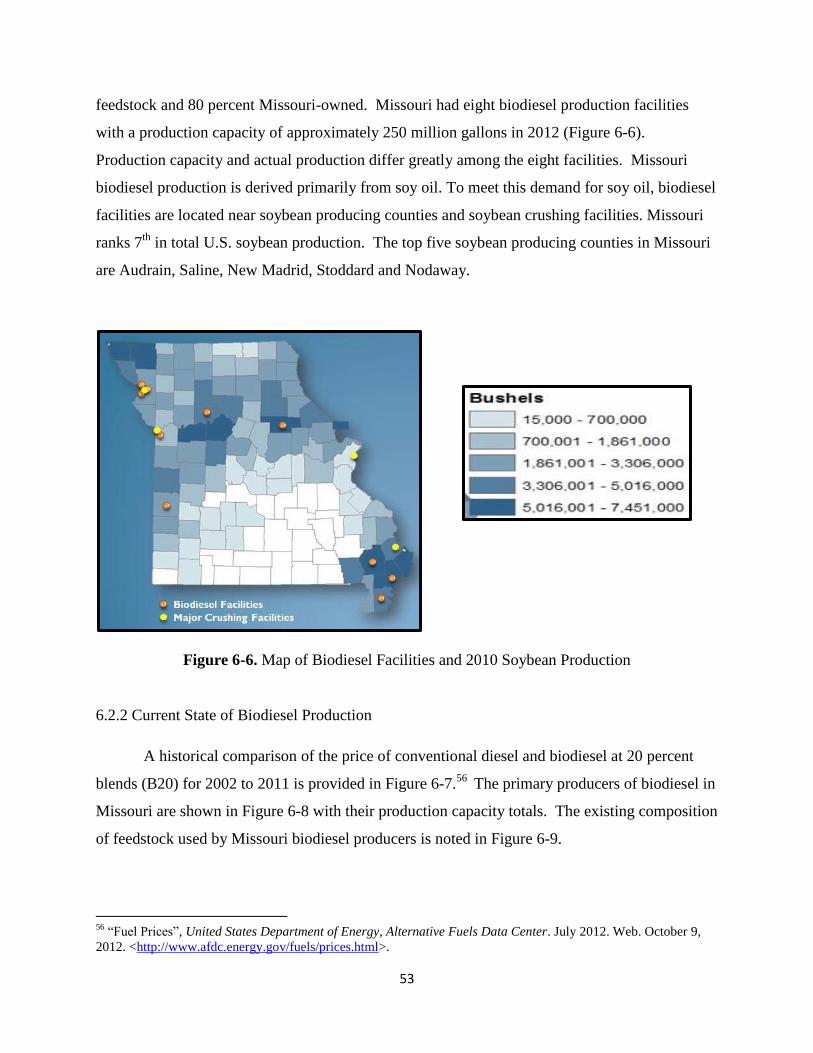
feedstock and 80 percent Missouri-owned. Missouri had eight biodiesel production facilities
with a production capacity of approximately 250 million gallons in 2012 (Figure 6-6).
Production capacity and actual production differ greatly among the eight facilities. Missouri
biodiesel production is derived primarily from soy oil. To meet this demand for soy oil, biodiesel
facilities are located near soybean producing counties and soybean crushing facilities. Missouri
ranks 7th
in total U.S. soybean production. The top five soybean producing counties in Missouri
are Audrain, Saline, New Madrid, Stoddard and Nodaway.
Figure 6-6. Map of Biodiesel Facilities and 2010 Soybean Production
6.2.2 Current State of Biodiesel Production
A historical comparison of the price of conventional diesel and biodiesel at 20 percent
blends (B20) for 2002 to 2011 is provided in Figure 6-7.56
The primary producers of biodiesel in
Missouri are shown in Figure 6-8 with their production capacity totals. The existing composition
of feedstock used by Missouri biodiesel producers is noted in Figure 6-9.
56
“Fuel Prices”, United States Department of Energy, Alternative Fuels Data Center. July 2012. Web. October 9,
2012. <http://www.afdc.energy.gov/fuels/prices.html>.
53
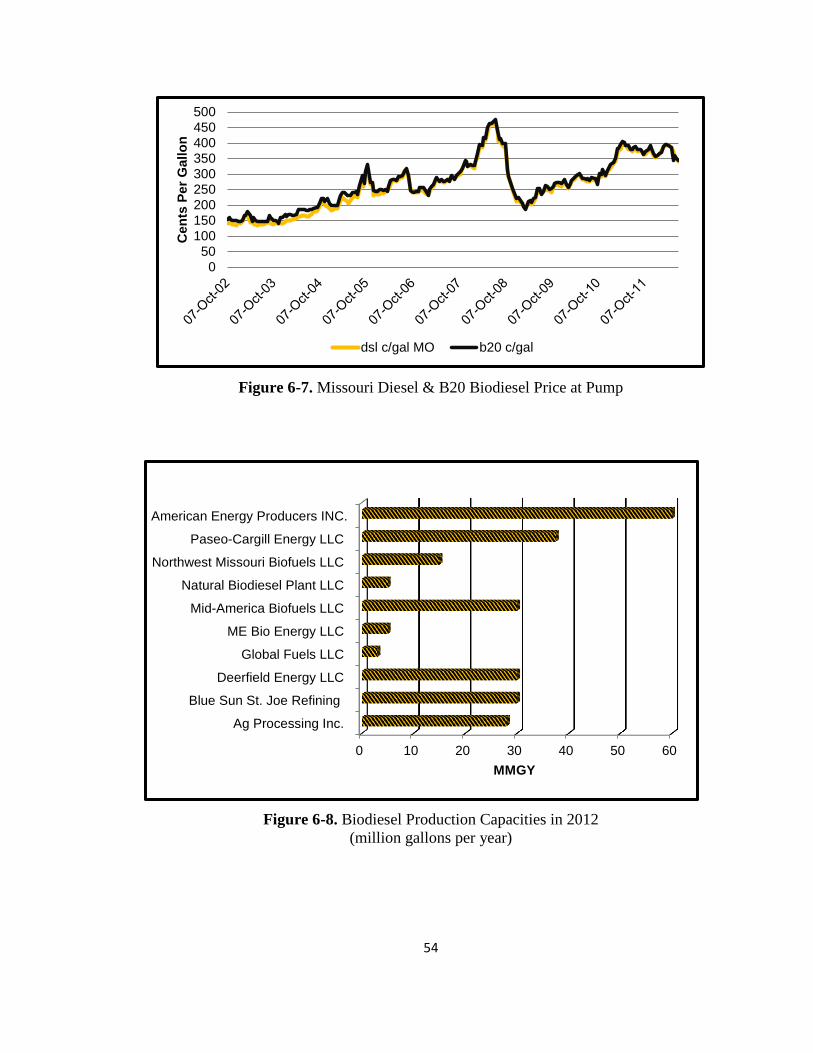
Figure 6-7. Missouri Diesel & B20 Biodiesel Price at Pump
Figure 6-8. Biodiesel Production Capacities in 2012
(million gallons per year)
54
050
100150200250300350400450500
Cen
ts P
er
Gallo
n
dsl c/gal MO b20 c/gal
0 10 20 30 40 50 60
Ag Processing Inc.
Blue Sun St. Joe Refining
Deerfield Energy LLC
Global Fuels LLC
ME Bio Energy LLC
Mid-America Biofuels LLC
Natural Biodiesel Plant LLC
Northwest Missouri Biofuels LLC
Paseo-Cargill Energy LLC
American Energy Producers INC.
MMGY

Figure 6-9. MO Biodiesel Feedstock by MMGY Nameplate in 2012
(million gallons per year)
The future of the biofuels industry in Missouri and the nation relies heavily on several
factors including conventional fuel prices, state and federal renewable fuel standards, commodity
prices and emerging technology. New non-food feed stocks, such as switchgrass and algae, are
being studied as possible alternatives to food-based feed stocks for biofuel production.
55
186
43
15
soy oil multifeedstock animal fats

56
7. Wind
7.1 Background and History
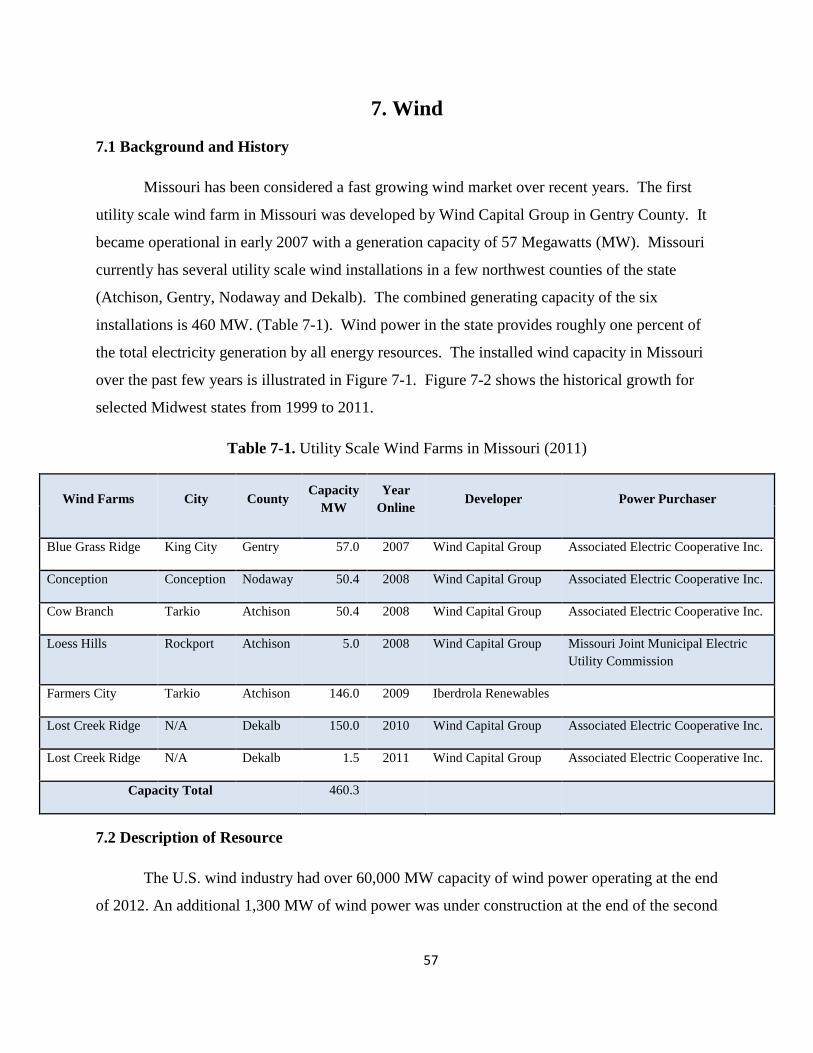
Missouri has been considered a fast growing wind market over recent years. The first
utility scale wind farm in Missouri was developed by Wind Capital Group in Gentry County. It
became operational in early 2007 with a generation capacity of 57 Megawatts (MW). Missouri
currently has several utility scale wind installations in a few northwest counties of the state
(Atchison, Gentry, Nodaway and Dekalb). The combined generating capacity of the six
installations is 460 MW. (Table 7-1). Wind power in the state provides roughly one percent of
the total electricity generation by all energy resources. The installed wind capacity in Missouri
over the past few years is illustrated in Figure 7-1. Figure 7-2 shows the historical growth for
selected Midwest states from 1999 to 2011.
Table 7-1. Utility Scale Wind Farms in Missouri (2011)
Wind Farms City County Capacity
MW
Year
Online Developer Power Purchaser
Blue Grass Ridge King City Gentry 57.0 2007 Wind Capital Group Associated Electric Cooperative Inc.
Conception Conception Nodaway 50.4 2008 Wind Capital Group Associated Electric Cooperative Inc.
Cow Branch Tarkio Atchison 50.4 2008 Wind Capital Group Associated Electric Cooperative Inc.
Loess Hills Rockport Atchison 5.0 2008 Wind Capital Group Missouri Joint Municipal Electric
Utility Commission
Farmers City Tarkio Atchison 146.0 2009 Iberdrola Renewables
Lost Creek Ridge N/A Dekalb 150.0 2010 Wind Capital Group Associated Electric Cooperative Inc.
Lost Creek Ridge N/A Dekalb 1.5 2011 Wind Capital Group Associated Electric Cooperative Inc.
Capacity Total 460.3
7.2 Description of Resource
The U.S. wind industry had over 60,000 MW capacity of wind power operating at the end
of 2012. An additional 1,300 MW of wind power was under construction at the end of the second
57

quarter of 2013.57
The average turbine capacity at planned wind farms is between 1.0 and 1.5
MW. The turbines are typically on towers that reach hub heights of 70 meters. These utility
scale wind installations produce more energy than needed by the surrounding communities and
have been connected to distribution networks through high voltage transmission lines.
Figure 7-1. Missouri's Installed Wind Capacity (2006-2011)
57
“Wind Energy Facts: Missouri”, American Wind Energy Association. Third Quarter of 2011. Web. September 7,
2012. <http://www.awea.org/learnabout/publications/upload/Missouri.pdf>.
58
0
50
100
150
200
250
300
350
400
450
500
2006 2007 2008 2009 2010 2011
MW
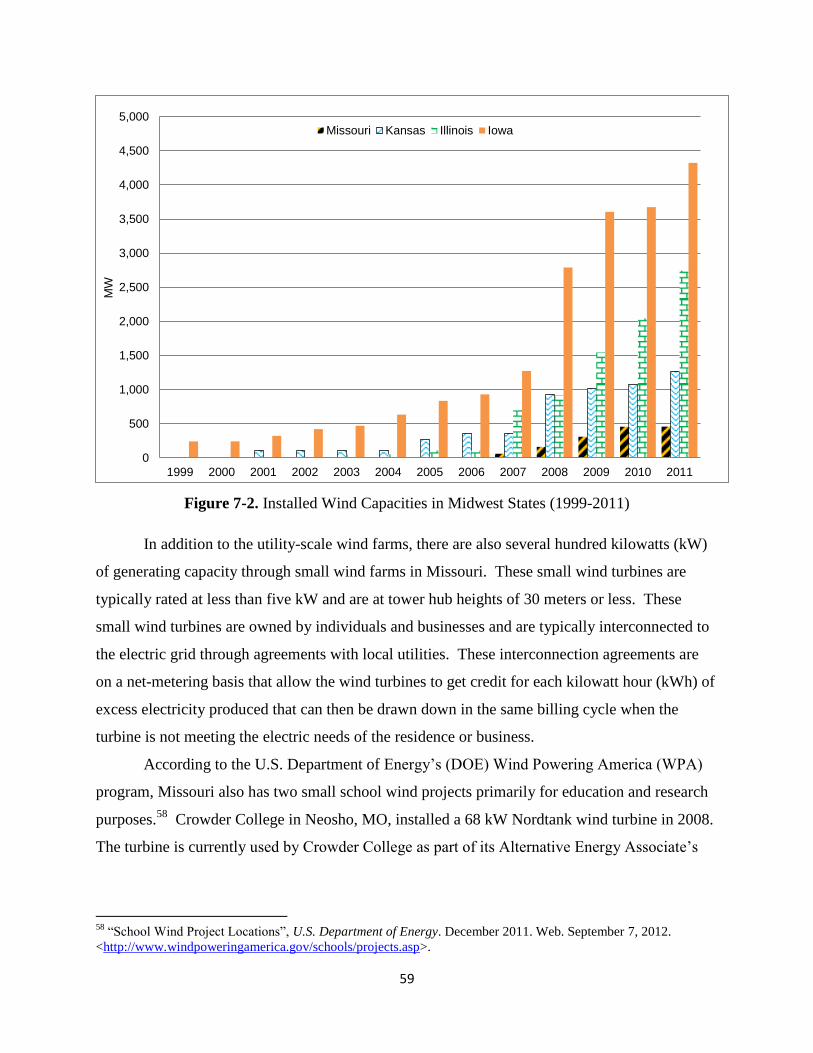
Figure 7-2. Installed Wind Capacities in Midwest States (1999-2011)
In addition to the utility-scale wind farms, there are also several hundred kilowatts (kW)
of generating capacity through small wind farms in Missouri. These small wind turbines are
typically rated at less than five kW and are at tower hub heights of 30 meters or less. These
small wind turbines are owned by individuals and businesses and are typically interconnected to
the electric grid through agreements with local utilities. These interconnection agreements are
on a net-metering basis that allow the wind turbines to get credit for each kilowatt hour (kWh) of
excess electricity produced that can then be drawn down in the same billing cycle when the
turbine is not meeting the electric needs of the residence or business.
According to the U.S. Department of Energy’s (DOE) Wind Powering America (WPA)
program, Missouri also has two small school wind projects primarily for education and research
purposes.58
Crowder College in Neosho, MO, installed a 68 kW Nordtank wind turbine in 2008.
The turbine is currently used by Crowder College as part of its Alternative Energy Associate’s
58
“School Wind Project Locations”, U.S. Department of Energy. December 2011. Web. September 7, 2012.
<http://www.windpoweringamerica.gov/schools/projects.asp>.
59
0
500
1,000
1,500
2,000
2,500
3,000
3,500
4,000
4,500
5,000
1999 2000 2001 2002 2003 2004 2005 2006 2007 2008 2009 2010 2011
MW
Missouri Kansas Illinois Iowa
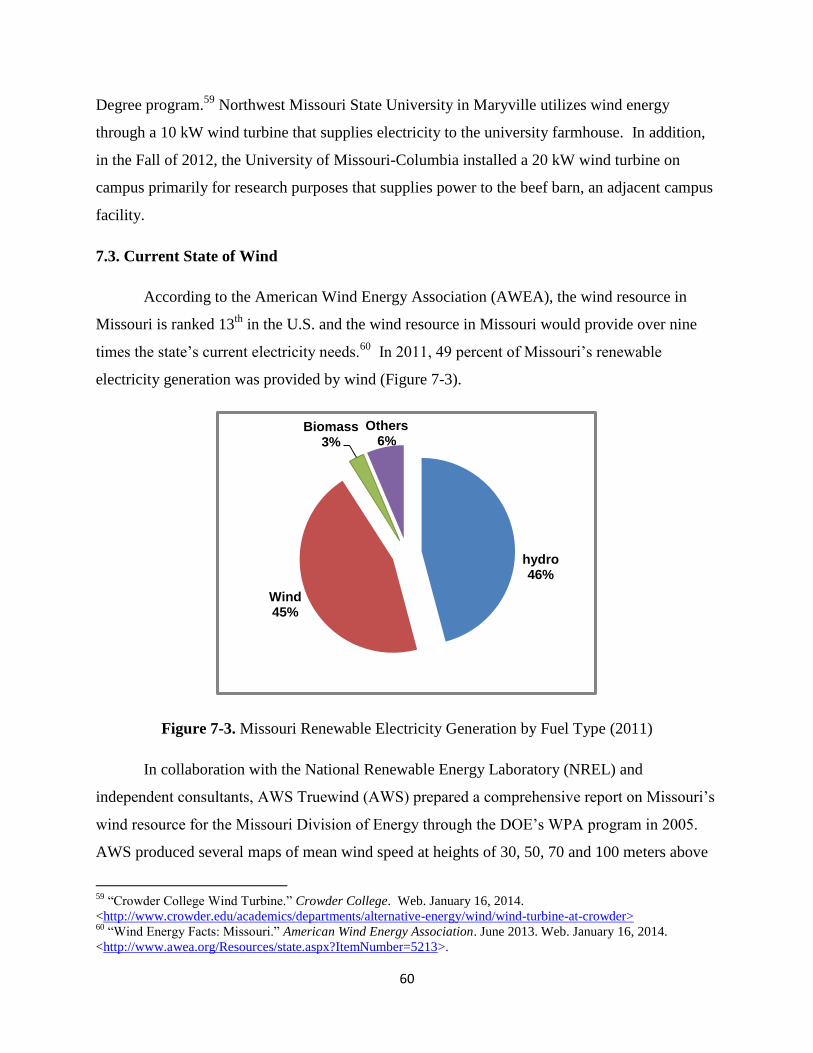
Degree program.59
Northwest Missouri State University in Maryville utilizes wind energy
through a 10 kW wind turbine that supplies electricity to the university farmhouse. In addition,
in the Fall of 2012, the University of Missouri-Columbia installed a 20 kW wind turbine on
campus primarily for research purposes that supplies power to the beef barn, an adjacent campus
facility.
7.3. Current State of Wind
According to the American Wind Energy Association (AWEA), the wind resource in
Missouri is ranked 13th
in the U.S. and the wind resource in Missouri would provide over nine
times the state’s current electricity needs.60
In 2011, 49 percent of Missouri’s renewable
electricity generation was provided by wind (Figure 7-3).
Figure 7-3. Missouri Renewable Electricity Generation by Fuel Type (2011)
In collaboration with the National Renewable Energy Laboratory (NREL) and
independent consultants, AWS Truewind (AWS) prepared a comprehensive report on Missouri’s
wind resource for the Missouri Division of Energy through the DOE’s WPA program in 2005.
AWS produced several maps of mean wind speed at heights of 30, 50, 70 and 100 meters above
59
“Crowder College Wind Turbine.” Crowder College. Web. January 16, 2014.
<http://www.crowder.edu/academics/departments/alternative-energy/wind/wind-turbine-at-crowder> 60
“Wind Energy Facts: Missouri.” American Wind Energy Association. June 2013. Web. January 16, 2014.
<http://www.awea.org/Resources/state.aspx?ItemNumber=5213>.
60
hydro 46%
Wind 45%
Biomass 3%
Others 6%

ground, maps of wind power density at 50 and 100 meters, and maps of county level 30 meter
average annual wind speed. The predicted wind speed frequency distribution and speed and
energy by direction were also produced. The final report and high resolution maps can be
downloaded from the Division of Energy’s website.61
Figure 7-4. 50 Meter Wind Power Resource
The DOE’s WPA Program and NREL have published two maps of 50 and 80 meter
height wind resources for Missouri. The 80-meter wind resource map (Figure 7-4) shows the
predicted mean annual wind speeds, presented at a spatial resolution of about two kilometers that
is interpolated to a finer scale for display.62
Areas with annual average wind speeds around 6.5
meters per second and greater at 80-meter height are generally considered to have a resource
suitable for wind development. Utility-scale, land-based wind turbines are typically installed
between 80 and 100 meters high. The 50-meter resource map (Figure 7-5) shows estimates of
61
“Wind Energy Resources”, Missouri Department of Economic Development, Division of Energy. 2014. Web.
January 16, 2014. <http://ded.mo.gov/division-of-energy/renewables/wind-energy-resources>. 62
“Missouri 80-Meter Wind Map and Wind Resource Potential”, U.S. Department of Energy, Wind Powering
America. May 2012. Web. September 7, 2012.
<http://www.windpoweringamerica.gov/wind_resource_maps.asp?stateab=mo>.
61
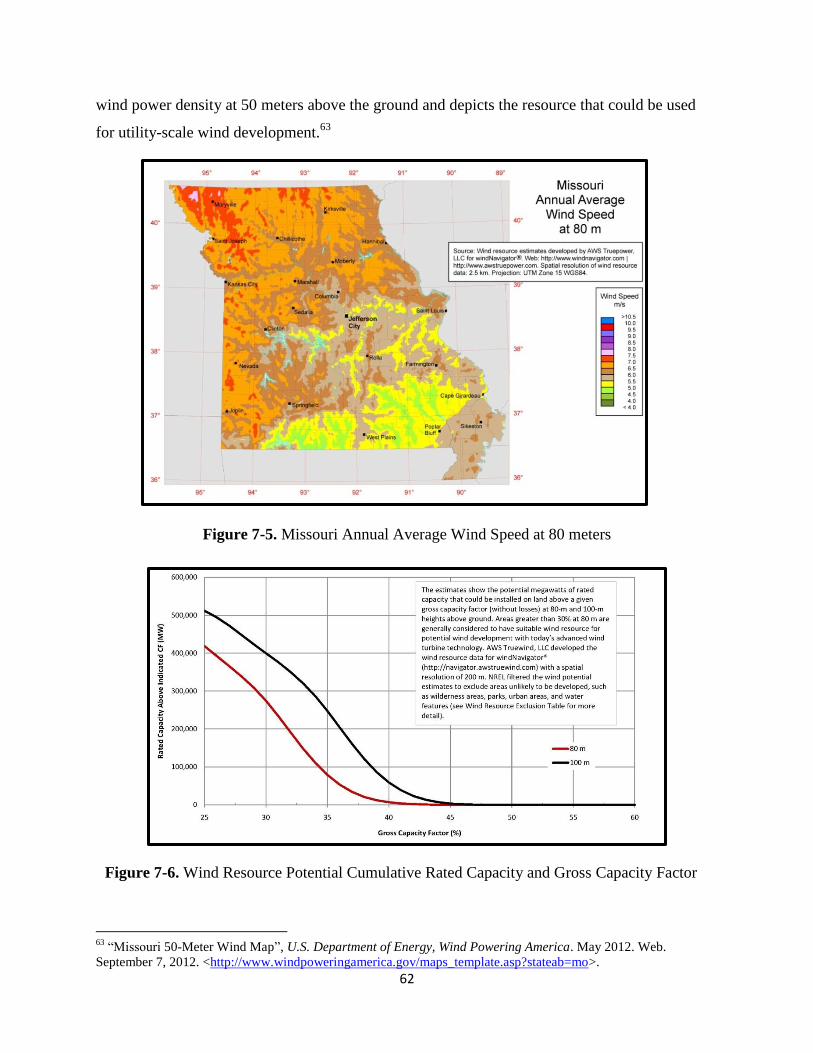
wind power density at 50 meters above the ground and depicts the resource that could be used
for utility-scale wind development.63
Figure 7-5. Missouri Annual Average Wind Speed at 80 meters
Figure 7-6. Wind Resource Potential Cumulative Rated Capacity and Gross Capacity Factor
63
“Missouri 50-Meter Wind Map”, U.S. Department of Energy, Wind Powering America. May 2012. Web.
September 7, 2012. <http://www.windpoweringamerica.gov/maps_template.asp?stateab=mo>.
62

NREL also estimated the wind energy potential in various capacity factor ranges for
Missouri using AWS’s gross capacity factor data from development of the “available” windy
land area after exclusions. The chart in Figure 7-6 shows the wind resource potential above a
given gross capacity factor at both 80-meter and 100-meter heights for Missouri.64
It is estimated
that the potential wind power capacity is 274,355 MW for areas more than or equal to 30 percent
gross capacity factor at 80 meters, which ranks 14th
in the U.S.
These wind maps indicate that the northwestern portion of the state, from the corner of
Atchison County down to Kansas City has the greatest abundance of windy land. The mean
wind speed on many hills in this region is predicted to be 7.0-7.5 meters/second at 70 meter
height. There are pockets of similar wind resources on relatively high elevations in the
southwestern part of the state. In southeastern Missouri, dense forest cover and lower elevations
substantially reduce the predicted wind speed and wind power. At 80 meter and 100 meter
heights, wind resource cumulative potentials improve considerably (Figure 7-6).
64
“Estimates of Windy Land Area and Wind Energy Potential”, U.S. Department of Energy, National Renewable
Energy Lab, AWS Truepower. April 2011. Web. September 7, 2012.
<http://www.windpoweringamerica.gov/docs/wind_potential.xls>.
63

64
8. Solar
8.1 Background and History
Missouri has limited production of energy from solar but this is increasing. Operational in
March 2013, the Butler Solar Energy Farm is the first utility-scale solar electric installation in
Missouri with a capacity of 3.05 MW for use by 35 members of the Missouri Joint Municipal
Electric Utility Commission; and in January 2014, Ameren announced plans to build a 5.7 MW
solar facility in O’Fallon, Missouri, which could be operational by December 2014. The use of
customer-owned solar electric systems in a net metering arrangement with a utility has increased
substantially in recent years following passage of the Net Metering and Easy Connection Act in
2007 and the Missouri Renewable Energy Standard in 2008. The Division of Energy has
monitored the installations of solar photovoltaic in net metering arrangements across the state,
and estimates from data gathered from utilities shows that in 2008 Missouri had less than 100
kW of generating capacity and at the end of 2010 had nearly 750 kW of generating capacity.65
The Missouri Partnership, an organization that markets Missouri’s business advantages to
companies, reports an increase of solar installations from 101 kilowatts (kW) in 2009 to over 7.8
MW in 2011.66
More recent solar industry estimates are 25 MW in 2013.67
8.2 Description of Resource
Missouri has moderate solar resources (Figure 8-1) with more than 200 sunny days per
year for an average of 4.5 to 5.0 kilowatt hour per square meter per day, according to the U.S.
Department of Energy's National Renewable Energy Laboratory’s (NREL) solar radiation maps.
Missouri’s solar resources actually exceed those of Germany, which leads the world in solar
energy production on less than three kWh per square meter per day.
Solar resources can be broken into different value representations depending on the solar
application and tilt. From NREL’s solar radiation maps on the MapSearch site, solar
photovoltaics installed at latitude tilt indicate that Missouri’s solar resource is consistent across
65
Correspondence with Ameren Missouri, Empire District Electric Company, Kansas City Power & Light
Company, Missouri Public Utility Association, and Associated Electric Cooperative Inc. 66
“The Market for Renewable Energy is Growing in Missouri”, Missouri Partnership. Web. January 6, 2014.
<http://www.missouripartnership.com/Industries/Energy-Solutions/CategoryID/13>. 67
Rebuttal Testimony of Mr. Adam Blake, Chief Executive Officer, Brightergy, LLC, Case No. ET-2014-0059
before the Missouri Public Service Commission, September 16, 2013.
65

the state at an annual daily average of 4.5 – 5.0 kWh/m2/day.
68 It is important to note that this
resource is an average daily value for the entire year and also that the light intensity panels are
rated at what would yield 24 kWh/m2/day.
Figure 8-1. Concentrating Solar Resources in the U.S.
In Missouri, December has the lowest solar potential at a daily average of 3.8
kWh/m2/day and a solar potential range of 2.6- 4.6 kWh/m
2/day for the month. Just as it makes
sense that December would be the lowest potential month with the Winter Solstice, June has the
highest potential with the Summer Solstice. In Missouri, June has the highest daily average of
6.1 kWh/m2/day and a solar potential range of 5.1- 6.9 kWh/m
2/day for the month.
69 Therefore,
solar panels installed in Missouri at a tilt equal to the location’s latitude will produce 60 percent
more energy in June than in December.
Just as the time of year influences the solar radiation available, the installation for solar
panels can affect the amount of solar resource available. Installing panels flat (0 degrees) will
68
“National Renewable Energy Research Laboratory MapSearch Beta”, National Renewable Energy Laboratory.
2012. Web. September 7, 2012. <http://www.nrel.gov/gis/mapsearch>. 69
“Solar Radiation Data Manual for Flat-Plate and Concentrating Collectors”, National Renewable Energy
Laboratory. 2012. Web. September 7, 2012. <http://rredc.nrel.gov/solar/pubs/redbook/>.
66
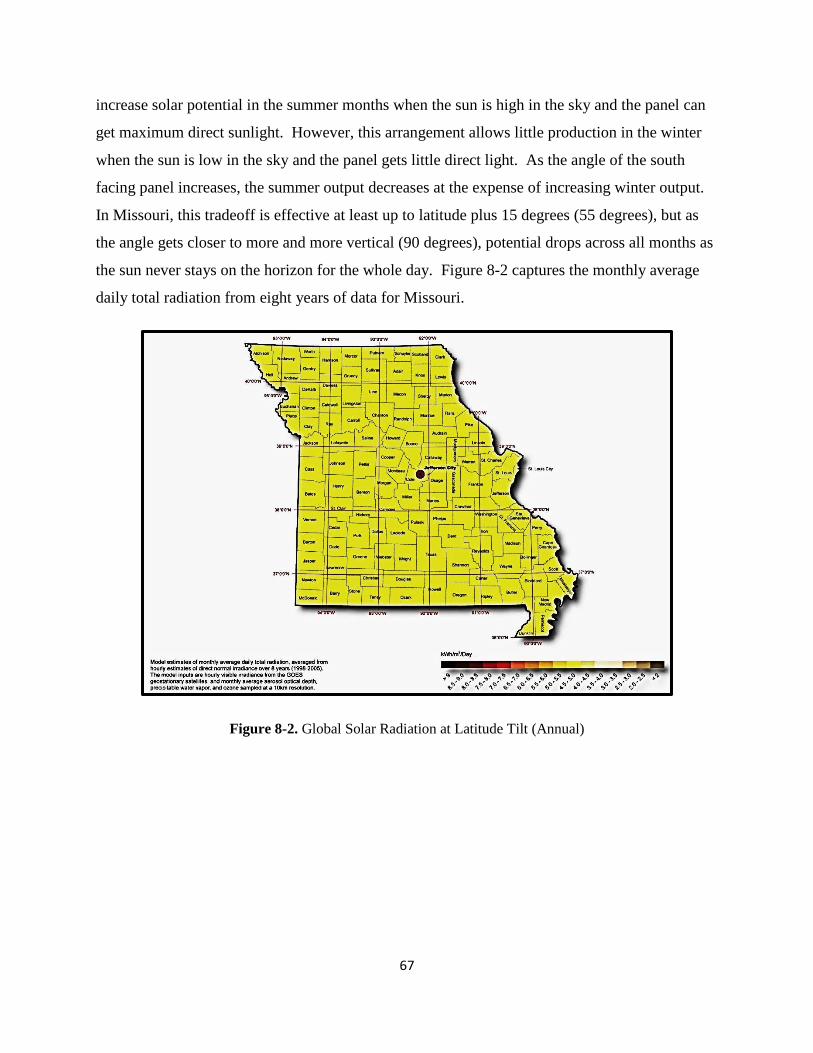
increase solar potential in the summer months when the sun is high in the sky and the panel can
get maximum direct sunlight. However, this arrangement allows little production in the winter
when the sun is low in the sky and the panel gets little direct light. As the angle of the south
facing panel increases, the summer output decreases at the expense of increasing winter output.
In Missouri, this tradeoff is effective at least up to latitude plus 15 degrees (55 degrees), but as
the angle gets closer to more and more vertical (90 degrees), potential drops across all months as
the sun never stays on the horizon for the whole day. Figure 8-2 captures the monthly average
daily total radiation from eight years of data for Missouri.
Figure 8-2. Global Solar Radiation at Latitude Tilt (Annual)
67

Figure 8-3. Concentrating Solar Power Resources
Some installations can track the sun’s azimuth (east-west movement) elevation (height in
the sky) or both. A two-axis tracking system that tracks both azimuth and elevation of the sun
throughout the day will gather the maximum solar potential for a site by keeping the panel
normal (at 90 degrees) to the sun’s rays. This maximum would result in December daily average
values of 4.6 kWh/m2/day with a range of 3.0 – 5.9 kWh/m
2/day and June daily average values
of 8.8 kWh/m2/day with a range of 6.8 to 10.3 kWh/m
2/day.
For concentrating solar power, much of Missouri is in a lower insolation class than for
photovoltaics as concentrated solar power (CSP) uses only direct sunlight. Solar insolation is a
measure of solar radiation energy received on a given surface area in a given time. All of
Missouri has insolation values of 4.0 – 4.5 kWh/m2/day with the exception of small sections of
the southwestern counties of Jasper, Newton, Lawrence, Barry and McDonald, which have
insolation values of 4.5- 5.0 kWh/m2/day. These values are not considered great enough for CSP
stations. A map of the direct normal solar resources for Missouri is shown in Figure 8-3.
68
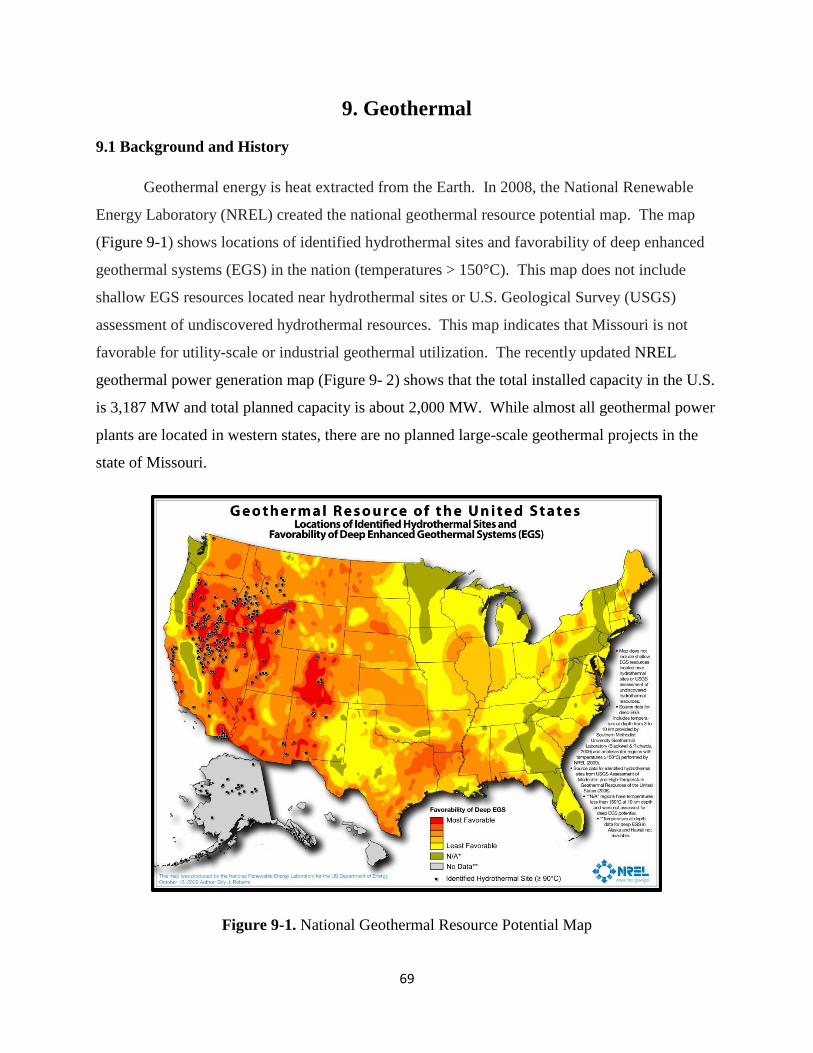
69
9. Geothermal
9.1 Background and History
Geothermal energy is heat extracted from the Earth. In 2008, the National Renewable
Energy Laboratory (NREL) created the national geothermal resource potential map. The map
(Figure 9-1) shows locations of identified hydrothermal sites and favorability of deep enhanced
geothermal systems (EGS) in the nation (temperatures > 150°C). This map does not include
shallow EGS resources located near hydrothermal sites or U.S. Geological Survey (USGS)
assessment of undiscovered hydrothermal resources. This map indicates that Missouri is not
favorable for utility-scale or industrial geothermal utilization. The recently updated NREL
geothermal power generation map (Figure 9- 2) shows that the total installed capacity in the U.S.
is 3,187 MW and total planned capacity is about 2,000 MW. While almost all geothermal power
plants are located in western states, there are no planned large-scale geothermal projects in the
state of Missouri.
Figure 9-1. National Geothermal Resource Potential Map
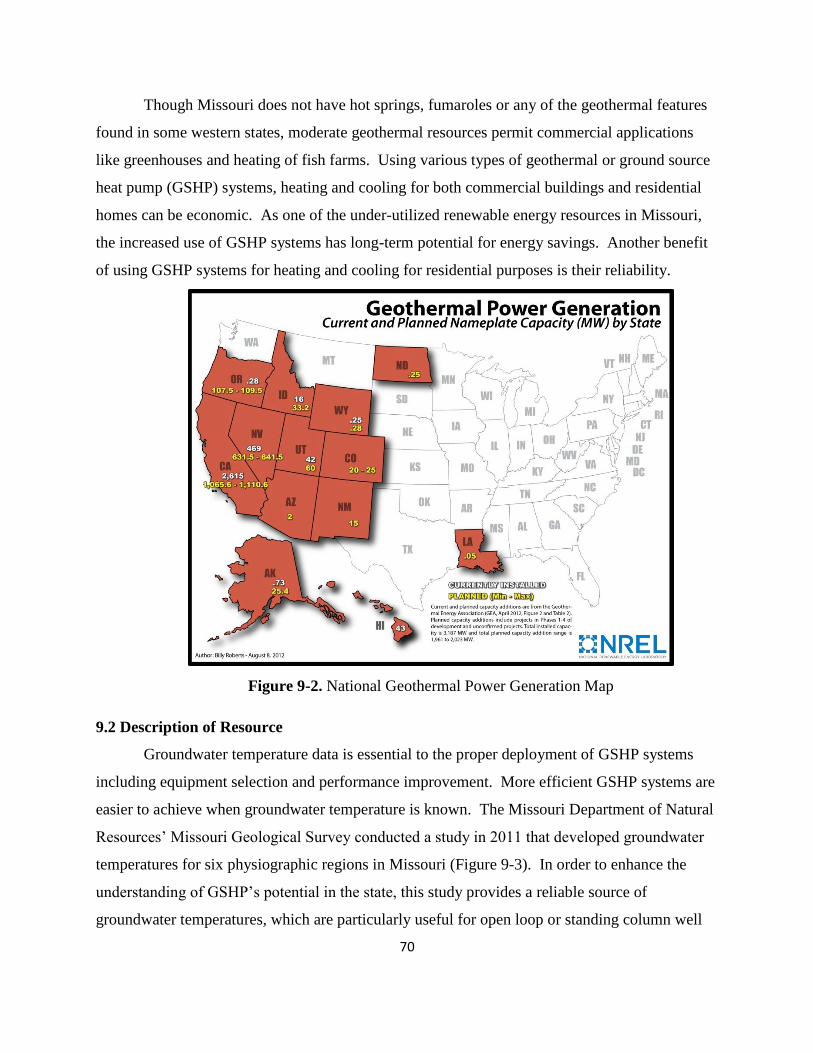
Though Missouri does not have hot springs, fumaroles or any of the geothermal features
found in some western states, moderate geothermal resources permit commercial applications
like greenhouses and heating of fish farms. Using various types of geothermal or ground source
heat pump (GSHP) systems, heating and cooling for both commercial buildings and residential
homes can be economic. As one of the under-utilized renewable energy resources in Missouri,
the increased use of GSHP systems has long-term potential for energy savings. Another benefit
of using GSHP systems for heating and cooling for residential purposes is their reliability.
Figure 9-2. National Geothermal Power Generation Map
9.2 Description of Resource
Groundwater temperature data is essential to the proper deployment of GSHP systems
including equipment selection and performance improvement. More efficient GSHP systems are
easier to achieve when groundwater temperature is known. The Missouri Department of Natural
Resources’ Missouri Geological Survey conducted a study in 2011 that developed groundwater
temperatures for six physiographic regions in Missouri (Figure 9-3). In order to enhance the
understanding of GSHP’s potential in the state, this study provides a reliable source of
groundwater temperatures, which are particularly useful for open loop or standing column well
70
systems installed in bedrock. The majority of the data is from the primary, uppermost aquifer
used in each region. The final report titled “Geothermal Map of Missouri” and maps can be
downloaded from the Division of Energy’s website at the following link:
http://ded.mo.gov/division-of-energy/transform/energize-missouri-sep-renewable-energy.
Due to the natural variation in groundwater temperature, selected areas of the state are
warm enough to support residential and commercial technical uses.70
Groundwater temperatures
range from mid-50 oF to mid-60
oF. Select portions of the state have groundwater temperatures
as low as the upper 40 degree range up to the high 80 degree range. In addition to residential
usage, some areas have groundwater temperatures sufficient for industrial and technical uses
such as greenhouse and aquaculture facilities. Groundwater for these uses can be as cool as
68oF.
70
Bone, F., Dove, V., Seeger, C. Geothermal Map of Missouri”, Missouri Department of Economic Development
Division of Energy, February 2012. Web. January 16, 2014. http://ded.mo.gov/division-of-
energy/transform/energize-missouri-sep-renewable-energy.
71
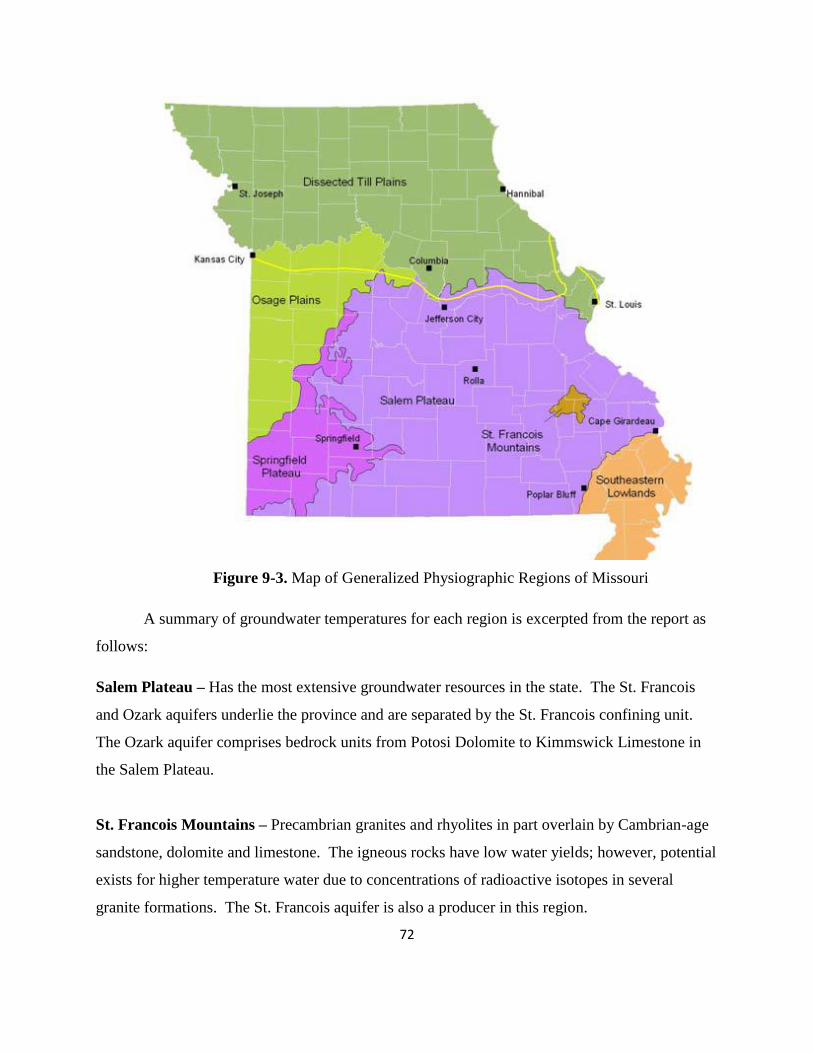
Figure 9-3. Map of Generalized Physiographic Regions of Missouri
A summary of groundwater temperatures for each region is excerpted from the report as
follows:
Salem Plateau – Has the most extensive groundwater resources in the state. The St. Francois
and Ozark aquifers underlie the province and are separated by the St. Francois confining unit.
The Ozark aquifer comprises bedrock units from Potosi Dolomite to Kimmswick Limestone in
the Salem Plateau.
St. Francois Mountains – Precambrian granites and rhyolites in part overlain by Cambrian-age
sandstone, dolomite and limestone. The igneous rocks have low water yields; however, potential
exists for higher temperature water due to concentrations of radioactive isotopes in several
granite formations. The St. Francois aquifer is also a producer in this region.
72
Southeastern Lowlands – Contains the greatest volume of groundwater per unit area. Parts of
the St. Francois and Ozark aquifers are used in the northwestern part of the province. However,
most usable groundwater is in thick deposits of shallow alluvium and deeper Tertiary- and
Cretaceous-age unconsolidated sands. The area has higher water temperatures than other parts of
the state.
Springfield Plateau – Mississippian-age limestones comprise the Springfield Plateau aquifer
and overlie the St. Francois and Ozark aquifers. The Ozark aquifer in this region comprises
Derby-Doerun Dolomite through Cotter Dolomite.
Osage Plains – This province is west of the freshwater-saline water transition zone. The region
has Pennsylvanian-age strata underlain by Cambrian, Ordovician and Mississippian units. The
area has documented groundwater temperatures of 72⁰F and 74⁰F (Fuller, 1981).
Dissected Till Plains – Cover northern Missouri and characterized by Pennsylvanian-age
sandstones, shales and limestones that are overlain by glacial drift. Mississippian- to
Ordovician-age strata are exposed along the Missouri and Mississippi rivers and produce some
water. Pennsylvanian strata have generally low permeability and yield small quantities of
marginal to poor quality water. Usage of water from glacial drift, including pre-glacial stream
valleys, increases to the west.
73

74

10. Hydropower
10.1 Background and History
Hydropower can be generated from a variety of different measures to control water
resources. Impoundment, diversion and pumped storage can be used in varying sizes to produce
hydroelectricity.71
Missouri currently has more than twenty hydroelectric plants, including both
impoundment and pumped storage facilities.72
Table 10-1 lists the major hydroelectric sites in
the state. Several facilities are owned and operated by the United States Army Corp of
Engineers (USACE). Union Electric Company (d/b/a Ameren Missouri) owns Bagnell Dam at
Lake of the Ozarks which began operations in 1931, and the Taum Sauk pumped storage plant
located in Iron County in the St. Francois mountain region which began operations in 1963.
10.2 Description of Resource
The combination of all of the hydropower facilities in the state produced 1,200 gigawatt
hours (GWh) in 2011. Between 2010 and 2011, hydroelectric production dropped about 22
percent (Figure 10-1).73
According to 2011 EIA data, 49 percent of Missouri’s electricity
generation from renewable resources came from hydropower sources (Figure 10- 2). Missouri’s
generation capacity from hydroelectric resources is shown in Figure 10-3 along with a few
selected Midwest states.
71
“Types of Hydropower Plants”, U.S. Department of Energy, Water Power Program. October 2011. Web. January
31, 2013. <http://www1.eere.energy.gov/water/hydro_plant_types.html>. 72
“Hydro Power”, Missouri Department of Natural Resources, Energy Producing Systems. Hydro Power, N.d.
Web. January 31, 2013. <http://ded.mo.gov/energy/education/hydropower.pdf>. 73
“Missouri Energy Profile”, NASEO. 2012. Web. January 31 2013.
<http://ded.mo.gov/energy/docs/Missouri_Energy_Profile_9_6_2012a.pdf>.
75

Table 10-1. Major Hydroelectric Facilities in Missouri74
Operator Plant Name Hydro
Technology
Current
Nameplate
Rating
(MW)
Year in
Service
Union Electric Co. Osage HYC 208 1931
Union Electric Co. Taum Sauk PS 440 1963
USACE Table Rock HYC 200 1959
USACE Clarence Cannon HYC+PS 58 1984
USACE Harry Truman PS 161.4 1979
USACE Stockton HYC 45.2 1973
Show-Me Power
Electric Coop Niangua HYC 3 1930
Empire District
Electric Co Ozark Beach HYC 16 1930
HYC: hydroelectric conventional PS: pumped storage
Figure 10-1. Net Electricity Generation from Conventional Hydropower in Missouri
74 Nameplate rating data source: Osage, Table Rock, Clarence Cannon and Harry Truman from EIA-923 and EIA-
860 reports (December, 2013); Taum Sauk from Ameren Missouri’s website
(http://www.ameren.com/sites/aue/Media/Pages/TaumSaukfactsandfigures.aspx) and Missouri Public Service
Commission; Stockton, Niangua and Ozark Beach from Oak Ridge National Laboratory’s HydroGIS
(http://nhaap.ornl.gov/content/hydrogis-0).
76
199
1,204
2,047 1,817
1,539
0
500
1,000
1,500
2,000
2,500
2006 2007 2008 2009 2010
GW
h
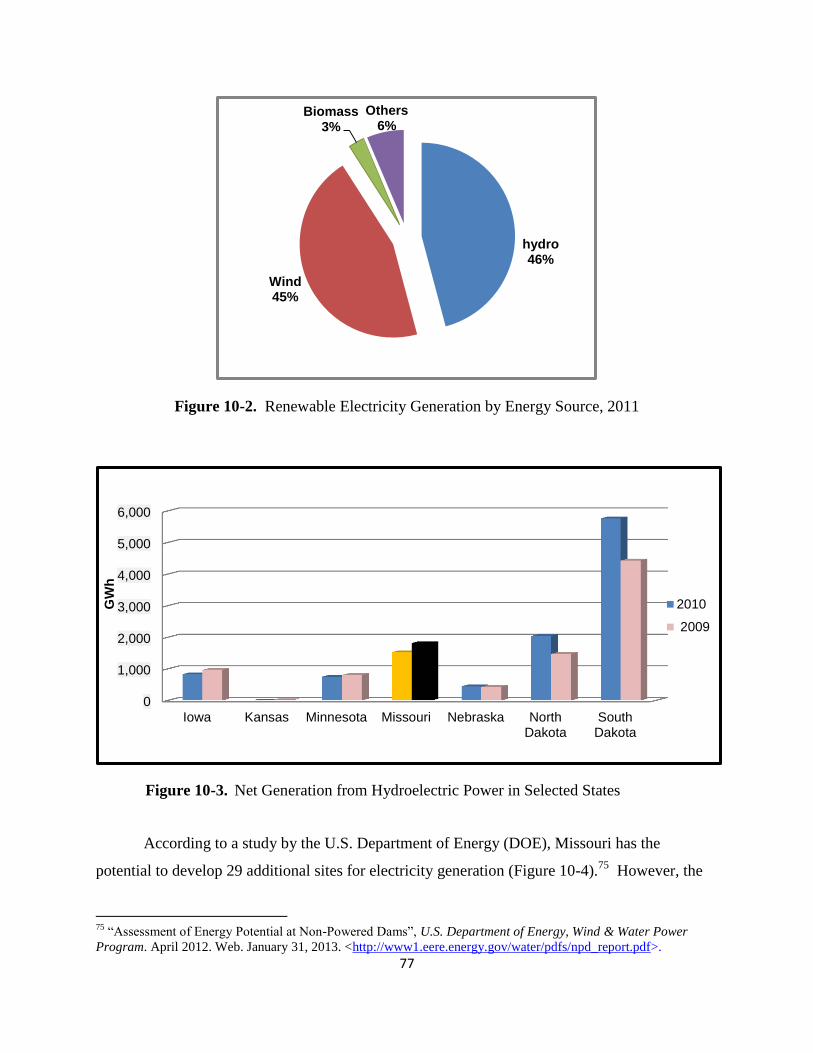
Figure 10-2. Renewable Electricity Generation by Energy Source, 2011
Figure 10-3. Net Generation from Hydroelectric Power in Selected States
According to a study by the U.S. Department of Energy (DOE), Missouri has the
potential to develop 29 additional sites for electricity generation (Figure 10-4).75
However, the
75
“Assessment of Energy Potential at Non-Powered Dams”, U.S. Department of Energy, Wind & Water Power
Program. April 2012. Web. January 31, 2013. <http://www1.eere.energy.gov/water/pdfs/npd_report.pdf>.
77
hydro 46%
Wind 45%
Biomass 3%
Others 6%
0
1,000
2,000
3,000
4,000
5,000
6,000
Iowa Kansas Minnesota Missouri Nebraska NorthDakota
SouthDakota
GW
h
2010
2009
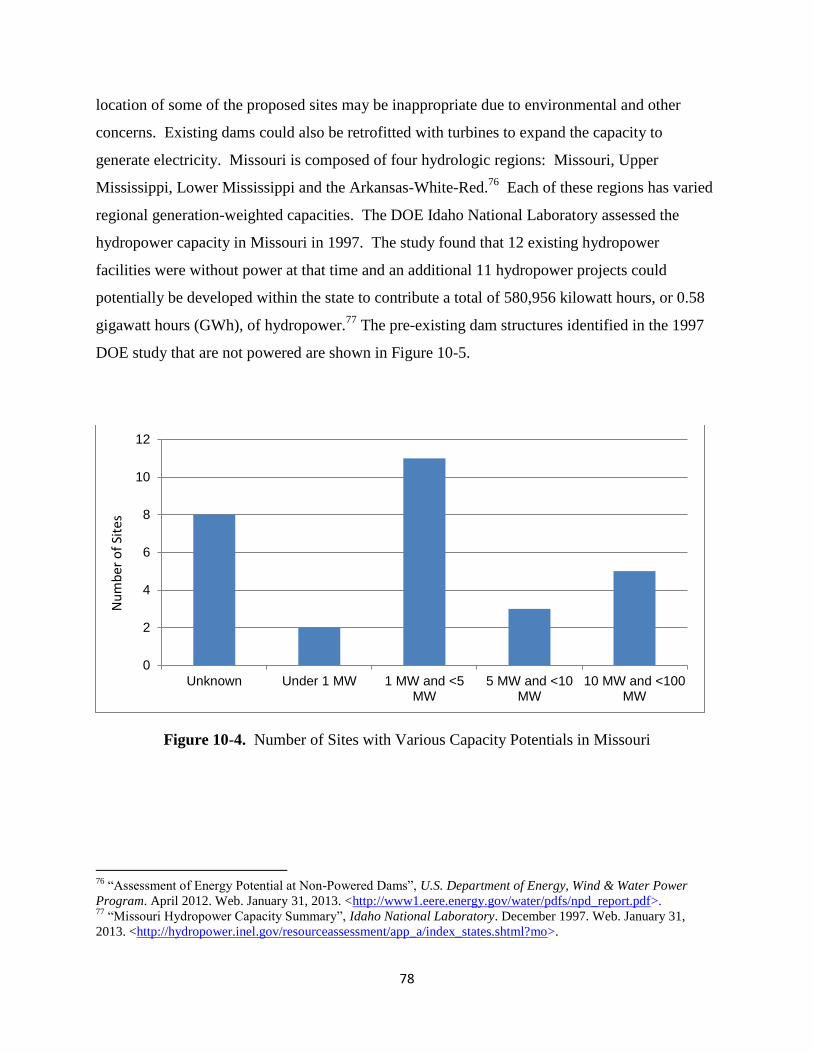
location of some of the proposed sites may be inappropriate due to environmental and other
concerns. Existing dams could also be retrofitted with turbines to expand the capacity to
generate electricity. Missouri is composed of four hydrologic regions: Missouri, Upper
Mississippi, Lower Mississippi and the Arkansas-White-Red.76
Each of these regions has varied
regional generation-weighted capacities. The DOE Idaho National Laboratory assessed the
hydropower capacity in Missouri in 1997. The study found that 12 existing hydropower
facilities were without power at that time and an additional 11 hydropower projects could
potentially be developed within the state to contribute a total of 580,956 kilowatt hours, or 0.58
gigawatt hours (GWh), of hydropower.77
The pre-existing dam structures identified in the 1997
DOE study that are not powered are shown in Figure 10-5.
Figure 10-4. Number of Sites with Various Capacity Potentials in Missouri
76
“Assessment of Energy Potential at Non-Powered Dams”, U.S. Department of Energy, Wind & Water Power
Program. April 2012. Web. January 31, 2013. <http://www1.eere.energy.gov/water/pdfs/npd_report.pdf>. 77
“Missouri Hydropower Capacity Summary”, Idaho National Laboratory. December 1997. Web. January 31,
2013. <http://hydropower.inel.gov/resourceassessment/app_a/index_states.shtml?mo>.
78
0
2
4
6
8
10
12
Unknown Under 1 MW 1 MW and <5MW
5 MW and <10MW
10 MW and <100MW
Nu
mb
er o
f Si
tes

Figure 10-5. Missouri Existing Unpowered Dam Structures -- Technical Potential Hydropower
Capacity (> 1MW)
79
0.0
50.0
100.0
150.0
200.0
250.0
300.0M
W

80
11. Demand Side Management: Energy Efficiency and Demand
Response
11.1 Background and History
“Demand Side Management” (DSM) describes efforts to provide utility customers with
the tools they need to control their energy use. When referring to DSM, practitioners make a
distinction between “energy efficiency” programs that support the purchase of high efficiency
measures (light bulbs, appliances, air conditioners, heating systems, etc.), and “demand
response” programs, which offer users an incentive to reduce their electricity use in response to
extreme system loads by shifting the time period that electricity is used.
In Missouri, most DSM programs are sponsored by utilities, whether investor-owned
utilities, rural electric cooperatives or municipal utilities, rather than being sponsored by the state
or by an independent program implementer. Utility-sponsored DSM programs in Missouri
began in 2005 and continue to the present.
11.2 Resource Overview
Missouri’s DSM program savings have grown rapidly over the past seven years. Figure
11-1 shows the overall growth in Missouri’s DSM savings since 2005, according to the U.S.
Department of Energy’s Energy Information Administration (EIA).78
Reported savings from
DSM programs grew from 1,029 MWh in 2005 to 383,096 MWh in 2011. Virtually all of these
savings came from the energy efficiency programs. Most of the growth in DSM program
savings between 2005 and 2011 came from programs sponsored by investor-owned utilities. In
2005, the EIA reported no DSM savings from investor-owned utilities. In 2012, savings from
investor-owned utilities represented 98 percent of the DSM savings statewide.
The rapid growth of investor-owned utility DSM programs is an outcome of the state’s
energy policy, in particular, the electric integrated resource planning process, which has
consistently identified DSM savings as the lowest cost resource for meeting utility generation
needs. Utilities have found that sponsoring DSM programs to meet expected energy demand is
78
“Annual Electric Power Industry Report, 2005-2011”, United States Department of Energy, Energy Information
Agency, Form 861.20 September 2012. Web. February 6, 2013.
<http://www.eia.gov/electricity/data/eia861/index.html>.
81
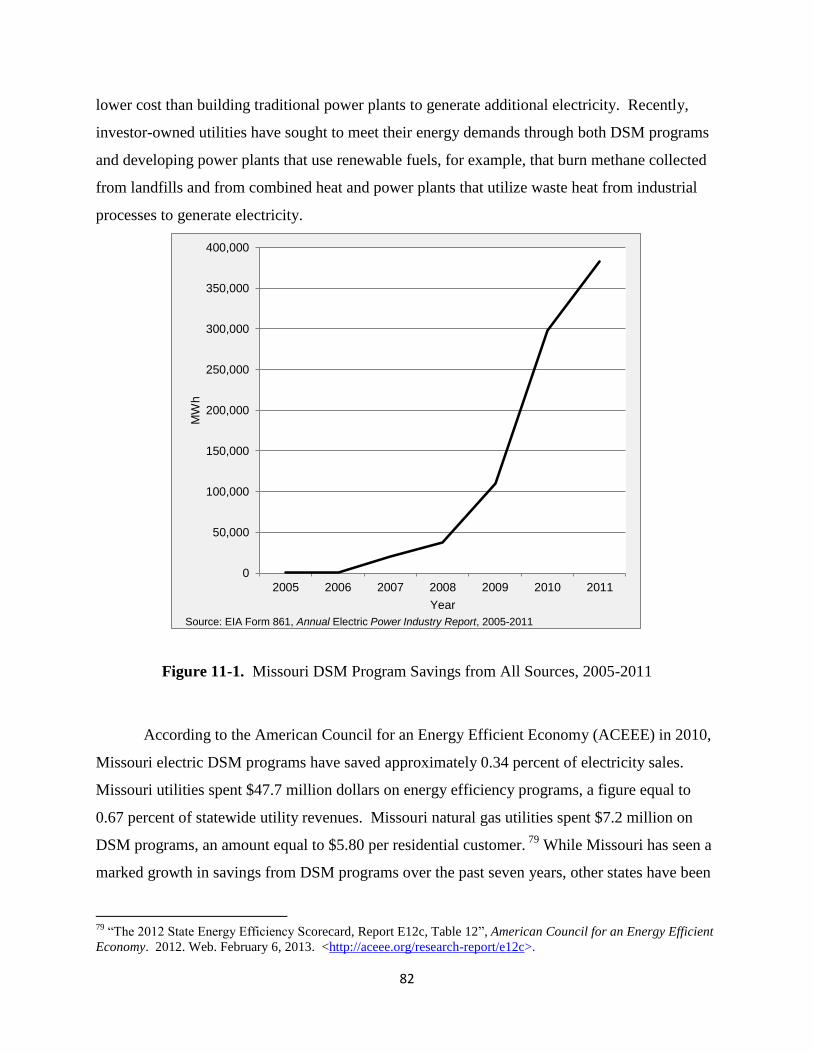
lower cost than building traditional power plants to generate additional electricity. Recently,
investor-owned utilities have sought to meet their energy demands through both DSM programs
and developing power plants that use renewable fuels, for example, that burn methane collected
from landfills and from combined heat and power plants that utilize waste heat from industrial
processes to generate electricity.
Figure 11-1. Missouri DSM Program Savings from All Sources, 2005-2011
According to the American Council for an Energy Efficient Economy (ACEEE) in 2010,
Missouri electric DSM programs have saved approximately 0.34 percent of electricity sales.
Missouri utilities spent $47.7 million dollars on energy efficiency programs, a figure equal to
0.67 percent of statewide utility revenues. Missouri natural gas utilities spent $7.2 million on
DSM programs, an amount equal to $5.80 per residential customer. 79
While Missouri has seen a
marked growth in savings from DSM programs over the past seven years, other states have been
79
“The 2012 State Energy Efficiency Scorecard, Report E12c, Table 12”, American Council for an Energy Efficient
Economy. 2012. Web. February 6, 2013. <http://aceee.org/research-report/e12c>.
82
0
50,000
100,000
150,000
200,000
250,000
300,000
350,000
400,000
2005 2006 2007 2008 2009 2010 2011
MW
h
Year
Source: EIA Form 861, Annual Electric Power Industry Report, 2005-2011

increasing their investments and savings in DSM programs as well. Figure 11-2, which shows
statewide savings from DSM programs in 2010 and 2011 using EIA data, places Missouri as 20th
out of the 51 states and the District of Columbia. Missouri’s overall state ranking on the 2012
ACEEE scorecard, which is based on states’ energy profiles in 2010, was 43rd
. The ACEEE
ranking considers many energy policy areas beyond utility DSM programs. When looking only
at Missouri’s electric DSM programs, Missouri ranked 29th
in terms of energy savings and 33rd
in terms of DSM program spending.
Figure 11-2. Total Savings from DSM Programs in 2010 and 2011
Figure 11-3 shows the per-capita savings of electricity, in KWh, from all DSM programs
in 2010. The EIA data ranked Missouri 18th
in terms of electricity savings. Figures 11-2 and 11-
3, as well as the ACEEE ranking, suggest that Missouri’s DSM performance can increase.
83
Calif
orn
ia
Ohio
P
ennsyl
vania
N
ew
York
A
rizona
Washin
gto
n
Texas
Min
nesota
M
ichig
an
Illin
ois
N
ort
h C
aro
lina
F
lorida
Iow
a
Connecticut
Mary
lan
d
Wis
consin
In
dia
na
Nevada
Colo
rado
Mis
so
uri
O
regon
Tennessee
Uta
h
Massachusetts
South
Caro
lina
Idaho
Kentu
cky
Okla
hom
a
New
Mexic
o
Georg
ia
Main
e
Monta
na
Nebra
ska
New
Jers
ey
Rhode I
sla
nd
Ark
ansas
Ala
bam
a
New
Ham
pshire
Virgin
ia
Verm
ont
Mis
sis
sip
pi
Kansas
Wyo
min
g
Nort
h D
akota
S
outh
Dakota
W
est V
irgin
ia
Haw
aii
Ala
ska
Dis
tric
t of
Colu
mbia
D
ela
ware
Louis
iana
0
500,000
1,000,000
1,500,000
2,000,000
2,500,000
3,000,000
3,500,000
4,000,000
MW
h
Total Incremental EnergySavings, 2010
Total Incremental EnergySavings, 2011
Source: EIA Form 861, Annual Electric Power Industry Report, 2010 and 2011
11.3 Development of State Policies that Support DSM
During the 2011 calendar year, Missouri’s investor-owned utilities, the Missouri Public
Service Commission, with input from the Office of Public Council, the Department of Natural
Resources’ Division of Energy80
and other interested groups, finalized the rules implementing
the Missouri Energy Efficiency Investment Act (MEEIA), a 2009 law that allows investor-
owned electric utilities to recover their DSM program costs, recover losses due to reduction in
electricity sales attributable to DSM programs and receive incentives for meeting a savings goal.
The MEEIA law established the state policy goal of “achieving all cost-effective demand-side
resources” in Missouri.
80
The Division of Energy transferred from the Missouri Department of Natural Resources to the Missouri
Department of Economic Development effective August 28, 2013 per Executive Order #13-03.
84
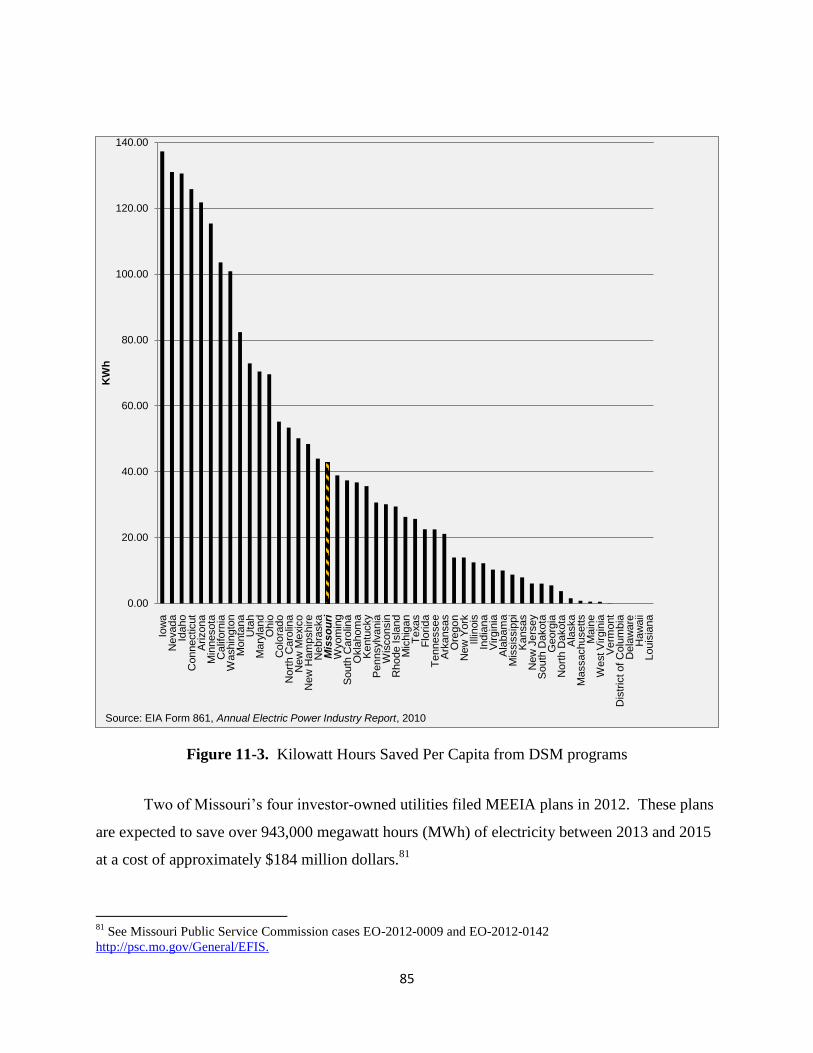
Figure 11-3. Kilowatt Hours Saved Per Capita from DSM programs
Two of Missouri’s four investor-owned utilities filed MEEIA plans in 2012. These plans
are expected to save over 943,000 megawatt hours (MWh) of electricity between 2013 and 2015
at a cost of approximately $184 million dollars.81
81
See Missouri Public Service Commission cases EO-2012-0009 and EO-2012-0142
http://psc.mo.gov/General/EFIS.
85
Iow
a
Nevada
Idaho
Connecticut
Arizona
M
innesota
C
alif
orn
ia
Washin
gto
n
Monta
na
Uta
h
Mary
land
Ohio
C
olo
rado
Nort
h C
aro
lina
N
ew
Mexic
o
New
Ham
pshire
Nebra
ska
M
isso
uri
W
yom
ing
South
Caro
lina
O
kla
hom
a
Kentu
cky
Pennsylv
ania
W
isconsin
R
hode I
sla
nd
M
ichig
an
T
exas
Flo
rid
a
Te
nnessee
A
rkansas
Ore
gon
New
York
Illin
ois
In
dia
na
V
irgin
ia
Ala
bam
a
Mis
sis
sip
pi
Kansas
New
Jers
ey
South
Dakota
G
eorg
ia
Nort
h D
akota
A
laska
Massachusett
s
Main
e
West V
irgin
ia
Verm
ont
Dis
tric
t of C
olu
mbia
D
ela
ware
H
aw
aii
Louis
iana
0.00
20.00
40.00
60.00
80.00
100.00
120.00
140.00
KW
h
Source: EIA Form 861, Annual Electric Power Industry Report, 2010

11.4 How Much Energy Can Be Saved? Results from Two DSM Potential Studies
While Missouri has seen rapid growth in its energy savings over the past seven years,
comparisons with other states give the impression that Missouri could increase its savings
substantially. However, one question to consider is how much energy could Missouri save
through DSM programs, renewable generation and supportive state policies; and at what cost?
Missouri state energy policy specifies a goal of achieving “all cost-effective demand-side
resources,” which means that the benefits of Missouri DSM programs must be at least equal to
their cost. In an attempt to estimate how much savings can be realized and at what cost, utilities
and the state conduct “energy efficiency potential studies.” Investor-owned electric utilities are
required by the Missouri Public Service Commission to conduct potential studies every four
years. These studies necessarily focus on savings from electric DSM programs targeted to a
utility’s service territory.
In 2011, the ACEEE conducted a statewide analysis of savings potential employing a
much broader scope than any individual utility study. By considering the results of two of these
studies, a utility-specific potential study conducted by Ameren Missouri in 201082
and the
broader study conducted by ACEEE, it is possible to understand the range of potential savings
from DSM, building codes and other energy efficiency policies in Missouri. The estimated
savings level from each study, along with the incremental savings from DSM for the state as a
whole in 2011, is displayed in Table 11-1.
Table 11-1. Estimates of DSM Savings by 2020 in MWh
Estimated Savings, ACEEE 2020 9,164,000
Estimated Savings, Ameren RAP, 2020 2,627,000
DSM Savings, EIA Form 861, 2011 370,263
Ameren’s 2010 DSM Market Potential Study published in January 2010, estimated
savings from the adoption of energy efficiency measures by its customers under the market
conditions that customers are likely to face. The estimated level of savings by 2020 of 2,627,000
MWh reflects savings from a proposed portfolio of DSM programs developed by Ameren
82
AmerenUE Demand Side Management (DSM) Market Potential Study, 4 Volumes, Global Energy Partners, LLC.
Walnut Creek, CA. 2010. 1287-1.
86

referred to as realistic achievable potential (RAP). The programs in this study formed the core of
its MEEIA portfolio.
In August 2011, the ACEEE published an analysis of the energy savings potential in
Missouri.83
This analysis considered improvements in energy efficiency broadly, including not
only utility-funded programs but also changes in building codes, establishment of a state energy
efficiency resource standard, development of combined heat and power (CHP) resources and a
particular focus on energy use in the agricultural sector. Their estimates suggest that, if all
possible sources were exploited to capture all cost-effective energy savings, Missouri could save
approximately 9,164 Gigawatt hours (GWh) (or 9,164,000 MWh) of electricity and 187 million
therms of natural gas by 2020. ACEEE estimates that these program changes and savings
opportunities could create 9,492 new jobs in Missouri by 2025.
These two studies are not strictly comparable. The Ameren Missouri study is based on
likely electric DSM program savings in its service territory. The ACEEE study is much broader,
considering savings opportunities for all sectors on a statewide basis. However, both studies
estimate that a higher level of savings from DSM programs is possible. Ameren Missouri
estimates that its customers can save approximately 2.6 million MWh by 2020, while ACEEE
estimates a statewide savings figure of 9.1 million MWh. In contrast, the EIA data indicates that
Missouri saved 370,000 MWh in 2011. While much of the discussion surrounding DSM savings
focuses on energy and environmental outcomes, DSM programs also support Missouri’s
economy. Missouri’s experience with utility energy efficiency programs has shown that these
programs support local business directly, by creating jobs in the building trades, and indirectly,
by making businesses and homes more efficient. Over the next three years, Missouri electric
utilities are expected to increase their spending on energy efficiency programs by a factor of
four, and are expected to increase their energy savings by a factor of three. Analyses conducted
by the ACEEE suggests that total savings between 2011 and 2020 could increase nearly ten
times over the expected savings from the current MEEIA DSM programs and that this effort
could produce 9,492 new jobs in Missouri by 2025.
83
“Missouri’s Energy Efficiency Potential: Opportunities for Economic Growth and Energy Sustainability,”
American Council for an Energy Efficient Economy, 2011. Report E114.
<http://ded.mo.gov/energy/docs/aceestudy.pdf>.
87
11.5 Conclusion
Missouri’s recent experience with demand side management programs suggests that they
have been successful in saving substantial amounts of energy. DSM savings have shown rapid
growth since 2005. With the implementation of MEEIA DSM programs in the beginning of
2013, the current expectation is that DSM savings will continue to grow. While this is good
news both environmentally and economically, it appears that more can be done. The future of
DSM programs and energy efficiency has the potential of substantially changing Missouri’s
energy usage patterns.
88