Embed Size (px)
Citation preview
Additional information is available on-line at:http://www.MissouriEconomy.org
Missouri Industry Clusters:Information Technology
INDUSTRY CLUSTER ANALYSIS
Report ICA-0601-1June 2001

Page 1 of 39Industry ClustersInformation TechnologyICA-0601-1
Missouri Industry Clusters:Information Technology
I. Overview . . . . . 2
Industry Profile . . . . . 3
II. Methods . . . . . 6
III. Determination of Industry Clusters . . . . . 8
Backward-Linkage Clusters . . . . . 8Forward Linkage Clusters . . . . . 13Industry Value-Chain . . . . . 18
IV. Location of Industry Clusters . . . . . 20
Backward-Linkage Clusters . . . . . 21Forward Linkage Clusters . . . . . 27
V. Implications and Summary . . . . . 35
References . . . . . 37Appendix A - Statistical Methods . . . . . 38
INDUSTRY CLUSTER ANALYSIS
Report ICA-0601-1June 2001
Analysis and reporting by David J. Peters, Planner.Maps by Zachary Johnson, GIS Analyst.

Page 2 of 39Industry ClustersInformation TechnologyICA-0601-1
I. Overview
Recently, there has been an interest in determining input and output industryclusters for a given economic sector - generally called an industry value-chain(Bergman and Feser 1999; Feser 1998). This interest has coincided with a focus onindustry competitiveness and comparative advantage. In essence, each industry'scompetitive position depends on one or several supporting industries or institutions.This interdependence between an industry's suppliers and consumers is key to thesuccess of a given industry. Industry cluster analysis views the development ofsupporting industries as vital to the health and growth of a given industry. Althoughindustries can be clustered along labor and knowledge requirements, clustering alongvalue-chains is more informative. Value-chains are detailed inter-industrytransactions, which include sales to and purchases from every other sector.
Given that information technology (IT) is a targeted industry in Missouri, thisanalysis determines the value-chain industry clusters for the IT sector in Missouri.Clusters of this type contain firms that are members of the same extended product orvalue chain, including both backward linkages (inputs purchased from otherindustries) and forward linkages (outputs sold to other industries). Although thereare many methods for determining clusters, this analysis will employ a statisticalcluster analysis of input-output transactions within Missouri.
By taking the backward-linkage and forward-linkage clusters, the informationtechnology value-chain can be ascertained. This information is significant in thatdecision-makers need to know where potential IT suppliers and consumers arelocated within the state. This allows businesses to better select facility locations, inthat it identifies areas where IT suppliers and consumers are located. Also, it allowsgovernment officials to develop a strategy for recruiting IT firms, highlighting thestate's existing supplier and consumer base. In general, the most optimal areas forthe development of the IT industry are characterized by a sizable industry clusteremployment base and high specialization. This information can be ascertained bydetermining the IT value-chain, and then analyzing the employment base andspecialization within each cluster of the value-chain.
Page 3 of 39Industry ClustersInformation TechnologyICA-0601-1
Industry Profile
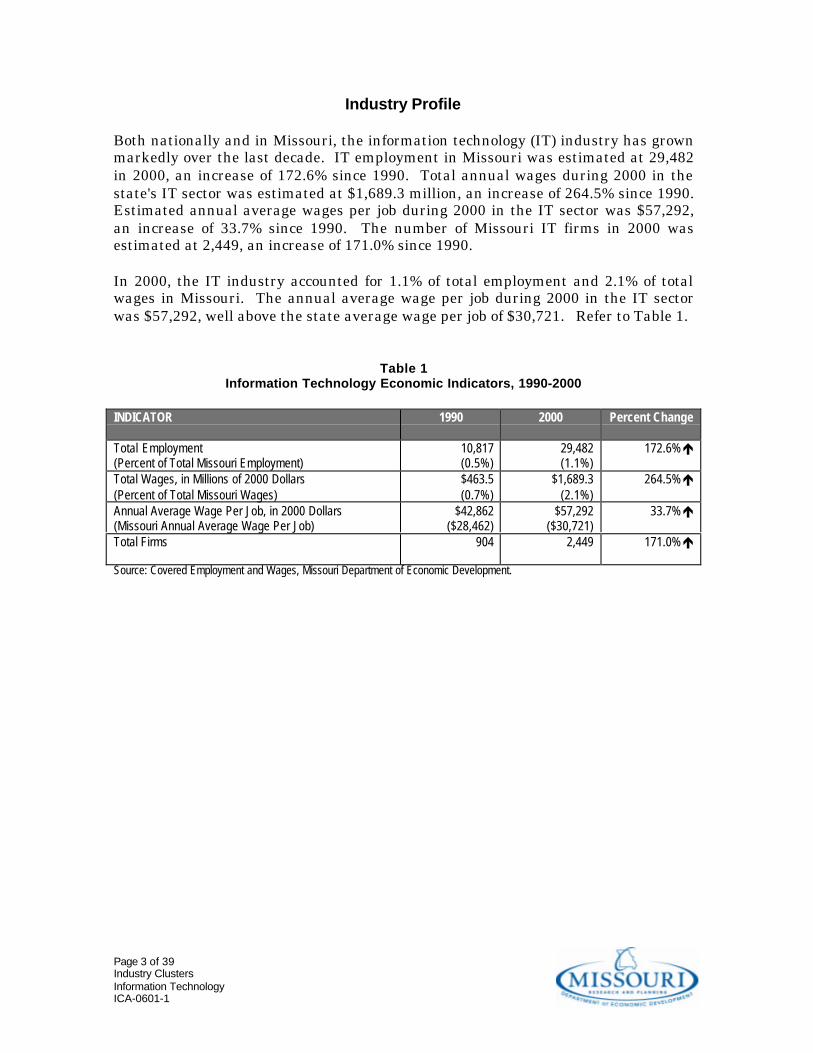
Both nationally and in Missouri, the information technology (IT) industry has grownmarkedly over the last decade. IT employment in Missouri was estimated at 29,482in 2000, an increase of 172.6% since 1990. Total annual wages during 2000 in thestate's IT sector was estimated at $1,689.3 million, an increase of 264.5% since 1990.Estimated annual average wages per job during 2000 in the IT sector was $57,292,an increase of 33.7% since 1990. The number of Missouri IT firms in 2000 wasestimated at 2,449, an increase of 171.0% since 1990.
In 2000, the IT industry accounted for 1.1% of total employment and 2.1% of totalwages in Missouri. The annual average wage per job during 2000 in the IT sectorwas $57,292, well above the state average wage per job of $30,721. Refer to Table 1.
Table 1Information Technology Economic Indicators, 1990-2000
INDICATOR 1990 2000 Percent Change
Total Employment(Percent of Total Missouri Employment)
10,817(0.5%)
29,482(1.1%)
172.6%é
Total Wages, in Millions of 2000 Dollars(Percent of Total Missouri Wages)
$463.5(0.7%)
$1,689.3(2.1%)
264.5%é
Annual Average Wage Per Job, in 2000 Dollars(Missouri Annual Average Wage Per Job)
$42,862($28,462)
$57,292($30,721)
33.7%é
Total Firms 904 2,449 171.0%é
Source: Covered Employment and Wages, Missouri Department of Economic Development.

Page 4 of 39Industry ClustersInformation TechnologyICA-0601-1
In 2000, the majority of IT jobs were located in metropolitan St. Louis, Kansas City,Columbia-Jefferson City, and Springfield. Additionally, IT jobs are also located inseveral rural areas of the state, such as Barry County, Polk County and WayneCounty. Counties with the largest employment base were St. Louis (14,718), Jackson(6,586), Clay (2,046), St. Louis City (1,300), St. Charles (989) and Barry (635).
According to specialization ratios, 5 Missouri counties were highly specialized in ITemployment. These areas were located in suburban metropolitan areas and inseveral rural areas of the state. The most specialized counties in the state wereBarry (3.73), Clay (2.16), St. Louis (2.04), Polk (1.94) and Wayne (1.59). It isimportant to note that specialization ratios measure the proportion of industryemployment relative to the state average, and not the total number of jobs. Refer toMap 1.
Map 1Information Technology Employment and Specialization, 2000
Source: Covered Employment and Wages, Missouri Department of Economic Development.

Page 5 of 39Industry ClustersInformation TechnologyICA-0601-1
0
5,000
10,000
15,000
20,000
25,000
30,000
35,00090
q1
90q3
91q1
91q3
92q1
92q3
93q1
93q3
94q1
94q3
95q1
95q3
96q1
96q3
97q1
97q3
98q1
98q3
99q1
99q3
00q1
00q3
• IT employment in Missouri hasincreased markedly during the lastdecade, with significant growth since1994.
• The most current data estimates 30,349IT jobs during 3rd quarter 2000.
• Employment was highest during 3rd
quarter 2000, with 30,349 jobs.• Employment was lowest during 4th
quarter 1990, with 10,658 jobs.
• The number of IT firms in Missouri hassubstantially increased since 1990 -especially since 1997.
• The most current data estimates 2,468IT firms during 3rd quarter 2000.
• Firms were most numerous during 2000,peaking in 3rd quarter 2000 at 2,468establishments.
• Firms were least numerous during 1st
quarter 1990, at 870 establishments.
• Annual average wages per job in the ITindustry in Missouri has steadilyincreased since 1990.
• The most current data estimates anaverage wage per job of $58,082 during3rd quarter 2000 - significantly higherthan the state average wage of $30,497.
• Average wages per job were highestduring 4th quarter 1999, at $62,172 perjob.
• Average wages per job were lowestduring 2nd quarter 1990, at $41,581 perjob.
Adjusted to 2000 Real Dollars.Quarter Wages Annualized.
0
10,000
20,000
30,000
40,000
50,000
60,000
70,000
90q1
90q3
91q1
91q3
92q1
92q3
93q1
93q3
94q1
94q3
95q1
95q3
96q1
96q3
97q1
97q3
98q1
98q3
99q1
99q3
00q1
00q3
0
500
1,000
1,500
2,000
2,500
3,000
90q1
90q3
91q1
91q3
92q1
92q3
93q1
93q3
94q1
94q3
95q1
95q3
96q1
96q3
97q1
97q3
98q1
98q3
99q1
99q3
00q1
00q3
Source: Covered Employment and Wages, Missouri Dept of Economic Development.
Source: Covered Employment and Wages, Missouri Dept of Economic Development.
Source: Covered Employment and Wages, Missouri Dept of Economic Development.
Employment by Quarter, 1990-2000
Annual Average Wages Per Job by Quarter, 1990-2000
Number of Firms by Quarter, 1990-2000
Page 6 of 39Industry ClustersInformation TechnologyICA-0601-1
II. Methods
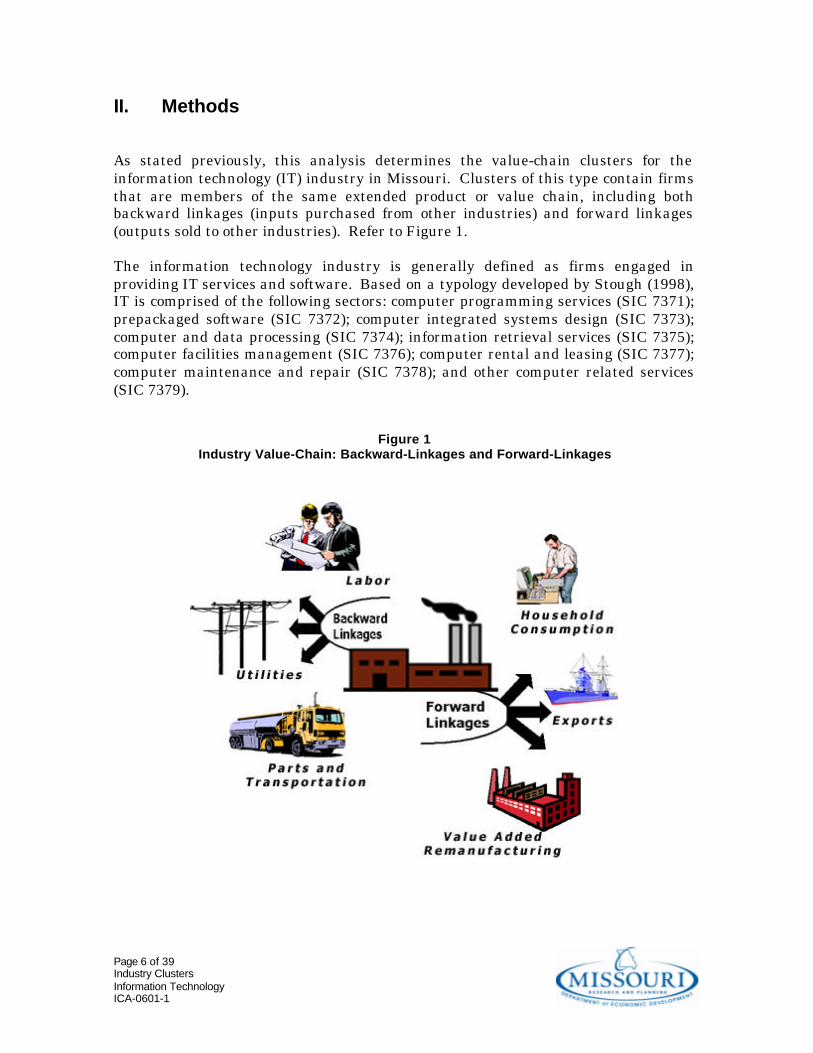
As stated previously, this analysis determines the value-chain clusters for theinformation technology (IT) industry in Missouri. Clusters of this type contain firmsthat are members of the same extended product or value chain, including bothbackward linkages (inputs purchased from other industries) and forward linkages(outputs sold to other industries). Refer to Figure 1.
The information technology industry is generally defined as firms engaged inproviding IT services and software. Based on a typology developed by Stough (1998),IT is comprised of the following sectors: computer programming services (SIC 7371);prepackaged software (SIC 7372); computer integrated systems design (SIC 7373);computer and data processing (SIC 7374); information retrieval services (SIC 7375);computer facilities management (SIC 7376); computer rental and leasing (SIC 7377);computer maintenance and repair (SIC 7378); and other computer related services(SIC 7379).
Figure 1Industry Value-Chain: Backward-Linkages and Forward-Linkages
Page 7 of 39Industry ClustersInformation TechnologyICA-0601-1
Information technology industry clusters were determined by employing ahierarchical agglomerative statistical cluster analysis, using input-output trade flowsamong 525 industries in Missouri. This methodology for determining industryclusters has been used successfully by other research economists (Bergman and Feser1999; Feser 1998). The most recent input-output (I-O) data is used, and is takenfrom the Minnesota IMPLAN Group. IMPLAN bases its data on the Bureau ofEconomic Analysis Benchmark Input-Output Study 1998. I-O data is the only majorsource of information on the interdependence of various industries in the UnitedStates. However, I-O data suffers from several drawbacks in that it is dated (mostcurrent data is from 1998), industry definitions may be imperfect, and it neglectssupporting institutions. However, it is the only source of data on inter-industrytransactions.
Cluster analysis is the generic name for a wide variety of procedures that can be usedto create a classification. These procedures mathematically form clusters or groupsof highly similar entities. More specifically, a clustering method is a multivariatestatistical procedure that starts with data containing information about a sample ofentities and attempts to reorganize these entities into relatively homogenous groups.In this case, the entities are purchases from and sales to 525 industries in Missouri -a 525x525 matrix.
In this analysis, a centroid hierarchical agglomerative cluster method was used todetermine clusters. The centroid method essentially computes the center point of apolygon using existing cases as the boundaries of that polygon. The similarity of thecluster center point and a case under consideration is compared using some distancemeasure and, subsequently, joins the case to that cluster if a given level of similarityis achieved. The centroid method has a tendency to find relatively compact andhyperspherical clusters composed of highly similar cases (Aldenderfer and Blashfield1984).
To compute the distance between centroids and cases, the Chebychev distancemeasure is used in this analysis. This dissimilarity measure is appropriate forcontinuous interval-ratio data. The Chebychev measure states that the distancebetween two cases is the maximum absolute difference between the values for thecases. Technically, all distance measures are best described as dissimilaritymeasures - a similarity measure (like a correlation coefficient) in reverse scale. Twopoints are identical if the distance between them is zero (Aldenderfer and Blashfield1984).
Lastly, the cluster solutions obtained using the above mentioned cluster method anddistance measure was compared to other solutions using alternative methods andmeasures: (1) centroid method using squared Euclidean distance; (2) Ward's methodusing squared Euclidean distance; and (3) Ward's method using Chebychev distance.All three methods yielded highly similar cluster solutions, indicating that there is aninherent structure in the data. Refer to Appendix A for more information.

Page 8 of 39Industry ClustersInformation TechnologyICA-0601-1
III. Determination of Industry Clusters
Backward-Linkage Clusters
Backward-linkage clusters are groups of industries from which the informationtechnology sector purchases goods and services. In essence, these industries supplythe goods and services (inputs) needed for the IT industry to operate. Input tradeflows among 525 industries in Missouri are analyzed to determine the backward-linkage clusters in the IT industry. This data measures purchase transactionsbetween industries within Missouri.
The IT industry mainly purchases inputs from within its own industry - $240.6million in purchases from computer and data processing. Other supply industriesinclude wholesale trade ($48.6 million), electronic components ($41.1 million), andcommunications services ($40.7 million). Refer to Table 2.
Table 2Information Technology Input Transactions, 1998
All Transactions Occur Within Missouri.
INDUSTRY PURCHASED FROM INPUTS(Dollars)
Computer and Data Processing Services 240,574,400Wholesale Trade 48,637,310Electronic Components 41,115,090Communications - Except Radio and TV 40,655,430Real Estate 34,838,930Other Business Services 25,301,870Personnel Supply Services 17,188,740Legal Services 16,819,010Banking 11,479,550U.S. Postal Service 11,300,320Semiconductors and Related Devices 8,626,368Management and Consulting Services 7,170,147Commercial Printing 7,100,301Accounting- Auditing and Bookkeeping 6,106,013Hotels and Lodging Places 5,580,916Colleges and Universities - Schools 5,430,478Maintenance and Repair Other Facilities 5,324,950Computer Storage Devices 5,206,694Eating and Drinking 5,154,294Security and Commodity Brokers 4,958,426
Source: Minnesota IMPLAN Group, based on Bureau of Economic Analysis Benchmark Input-Output.

Page 9 of 39Industry ClustersInformation TechnologyICA-0601-1
To determine backward-linkage clusters, a hierarchical agglomerative clusteranalysis was conducted using the 525x525 input-output matrix. The centroid methodwas used to form clusters since it tends to find relatively compact and hypersphericalclusters composed of highly similar cases. The Chebychev distance measure wasused to compute dissimilarity between cases, since it is an appropriate distancemeasure for continuous interval-ratio data. Since the Chebychev distance measure issensitive to extreme differences in scale, the variables have been standardized on azero to one scale (although there is disagreement on this point, the technique issupported by Aldenderfer and Blashfield 1984).
The results of the clustering method indicate the presence of three clusters, asevidenced by fusion coefficients and the dendogram. Fusion coefficients are an indexof the loss of information incurred when merging two clusters. There is a significantloss of information at the 2-stage cluster (Fusion=0.158, Fusionchange=0.1013), andconvention dictates that the prior cluster stage indicates a good cluster solution(Aldenderfer and Blashfield 1984). Refer to Table 3 and Chart 1.
Table 3 and Chart 1Fusion Coefficients, Agglomeration Schedule
Information Technology Backward-Linkage ClustersCentroid Method Using Chebychev Distance.
CLUSTER STAGE FUSION COEFFICIENT LOSS OF INFORMATION
10 0.00612 0.00059 0.01053 0.00448 0.01483 0.00437 0.02277 0.00796 0.02466 0.00195 0.03480 0.01014 0.04018 0.00543 0.05498 0.01482 0.15800 0.10301 0.99400 0.8360
0.0
0.2
0.4
0.6
0.8
1.0
1.2
s10 s 9 s8 s 7 s6 s 5 s4 s 3 s2 s1
Fusion Coefficient

Page 10 of 39Industry ClustersInformation TechnologyICA-0601-1
The dendogram also indicates a three cluster solution. Although dendograms aremainly heuristic devices, it provides an important validation of the cluster solution.The dendogram is presented in Figure 2.
Figure 2Dendogram, Information Technology Backward-Linkage Clusters
Centroid Method Using Chebychev Distance.
C A S E 0 5 10 15 20 25
Label Num +---------+---------+---------+---------+---------+
s473 473 òú ó s340 340 òú ó s454 454 òú ó s56 56 òú ó s496 496 òú ó s463 463 òú ó s507 507 òú ó s457 457 òú ó s476 476 òú ó s472 472 òú ùòòòø s437 437 òú ó ó s477 477 òú ó ó s469 469 òú ó ó s174 174 òú ó ó s435 435 òú ó ó s376 376 òú ó ó s479 479 òú ó ó s442 442 òú ó ó s443 443 òú ó ó s482 482 òú ó ùòòòòòòòòòòòòòòòòòòòòòòòòòòòòòòòòòòòòòòòòòø s179 179 òú ó ó ó s508 508 òú ó ó ó s377 377 ò÷ ó ó ó s456 456 òø ó ó ó s513 513 òôòú ó ó s474 474 òú ó ó ó s494 494 ò÷ ó ó ó s470 470 òòò÷ ó ó s378 378 òø ó ó s441 441 òú ó ó s462 462 òôòòòòò÷ ó s447 447 ò÷ ó s475 475 òòòòòòòòòòòòòòòòòòòòòòòòòòòòòòòòòòòòòòòòòòòòòòòòò÷

Page 11 of 39Industry ClustersInformation TechnologyICA-0601-1
The analysis of variance (ANOVA) F-test indicates that the input variable issignificantly different between the three clusters - statistically validating the clustersolution. By examining cluster membership and the differences in means, the threeclusters of information technology inputs can be described. Refer to Table 4 andChart 2.
The first cluster is described as supplying Second-Order Inputs, since the informationtechnology industry purchases a moderate amount of goods and services from theseindustries (average purchases of $41.3 million). The second cluster is described assupplying Third-Order Inputs, since the information technology industry purchases asmall amount of goods and services from these industries (average purchases of $16.4million). The third cluster is described as supplying First-Order Inputs, since theinformation technology industry purchases a large amount of goods and services fromthese industries (average purchases of $240.6 million).
Table 4Analysis of Variance, Information Technology Backward-Linkage Clusters
F-TEST
F(3,521) = 14844.71 p = 0.000
CLUSTER N MEAN STANDARDDEVIATION
1 4 41,311,690.00 5,657,757.482 5 16,417,898.00 5,706,507.953 1 240,574,400.00 -
Chart 2Cluster Means, Information Technology Backward-Linkage Clusters
0
50,000,000
100,000,000
150,000,000
200,000,000
250,000,000
300,000,000
Cluster 1 Cluster 2 Cluster 3
Input Transactions

Page 12 of 39Industry ClustersInformation TechnologyICA-0601-1
The First-Order Inputs cluster is composed of industries from which the IT sectorpurchases the vast majority of its needed inputs (goods and services). It appears thatthe IT sector purchases inputs heavily from computer and data processing services.This cluster is composed of industries that support mission-critical operations of theIT industry.
The Second-Order Inputs cluster is composed of industries from which the IT sectorpurchases a moderate amount of its needed inputs (goods and services). It appearsthat the IT sector purchases inputs moderately from wholesale trade, electroniccomponents manufacturing, communications and real estate. This cluster iscomposed of industries that support the physical operation and communication of theIT industry.
The Third-Order Inputs cluster is composed of industries from which the IT sectorpurchases a small amount of its needed inputs (goods and services). It appears thatthe IT sector purchases inputs sparingly from business services, personnel supplyservices, legal services, banking and the U.S. Postal Service. This cluster iscomposed of industries that support the financial and human resource components ofthe IT industry.
Table 5Information Technology Backward-Linkage Clusters
All Transactions Occur Within Missouri.
CLUSTER INDUSTRY INPUTS(Dollars)
First-Order Inputs Computer and Data Processing Services 240,574,400.00Wholesale Trade 48,637,310.00Electronic Components 41,115,090.00Communications - Except Radio and TV 40,655,430.00
Second-Order Inputs
Real Estate 34,838,930.00Other Business Services 25,301,870.00Personnel Supply Services 17,188,740.00Legal Services 16,819,010.00Banking 11,479,550.00
Third-Order Inputs
U.S. Postal Service 11,300,320.00

Page 13 of 39Industry ClustersInformation TechnologyICA-0601-1
Forward-Linkage Clusters
Forward-linkage clusters are groups of industries to which the informationtechnology sector sells goods and services. In essence, these industries purchase thegoods and services produced by the IT industry (outputs). Output trade flows among525 industries in Missouri are analyzed to determine the forward-linkage clusters inthe IT industry. This data measures sales transactions between industries withinMissouri.
The IT industry mainly sells outputs to wholesalers and other IT firms - $332.4million in sales to wholesale trade, and $240.6 million in sales to computer and dataprocessing services. The IT industry also sells to a host of other professional servicesfirms: banks ($161.6 million), doctors and dentists ($138.1 million), communicationservices ($123.6 million), and colleges and universities ($100.9 million). Refer toTable 6.
Table 6Information Technology Output Transactions, 1998
All Transactions Occur Within Missouri.
INDUSTRY PURCHASED FROM OUTPUTS(Dollars)
Wholesale Trade 332,367,700Computer and Data Processing Services 240,574,400Banking 161,607,500Doctors and Dentists 138,126,600Communications - Except Radio and TV 123,618,200Colleges and Universities - Schools 100,927,800Hospitals 81,500,140Engineering - Architectural Services 60,137,580Air Transportation 54,178,270Equipment Rental and Leasing 48,638,110Other Business Services 46,014,230Aircraft Manufacturing 44,587,310Management and Consulting Services 44,241,520Motor Freight Transport and Warehousing 36,750,770Arrangement Of Passenger Transportation 34,991,800Electric Services 28,137,990Accounting - Auditing and Bookkeeping 26,351,470Other Medical and Health Services 26,089,940Cyclic Crudes - Industrial Organic Chemicals 23,978,180Railroads and Related Services 23,270,670
Source: Minnesota IMPLAN Group, based on Bureau of Economic Analysis Benchmark Input-Output.

Page 14 of 39Industry ClustersInformation TechnologyICA-0601-1
To determine forward-linkage clusters, a hierarchical agglomerative cluster analysiswas conducted using the 525x525 input-output matrix. The centroid method wasused to form clusters since it tends to find relatively compact and hypersphericalclusters composed of highly similar cases. The Chebychev distance measure wasused to compute dissimilarity between cases, since it is an appropriate distancemeasure for continuous interval-ratio data. Since the Chebychev distance measure issensitive to extreme differences in scale, the variables have been standardized on azero to one scale (although there is disagreement on this point, the technique issupported by Aldenderfer and Blashfield 1984).
The results of the clustering method indicate the presence of four clusters, asevidenced by fusion coefficients and the dendogram. Fusion coefficients are an indexof the loss of information incurred when merging two clusters. There is a significantloss of information at the 3-stage cluster (Fusion=0.274, Fusionchange=0.148), andconvention dictates that the prior cluster stage indicates a good cluster solution(Aldenderfer and Blashfield 1984). Refer to Table 7 and Chart 3.
Table 7 and Chart 3Fusion Coefficients, Agglomeration Schedule
Information Technology Forward-Linkage ClustersCentroid Method Using Chebychev Distance.
CLUSTER STAGE FUSION COEFFICIENT LOSS OF INFORMATION
10 0.03145 0.00419 0.03218 0.00078 0.04365 0.01157 0.05845 0.01486 0.08156 0.02315 0.10800 0.02644 0.12600 0.01803 0.27400 0.14802 0.41300 0.13901 0.97700 0.5640
0.0
0.2
0.4
0.6
0.8
1.0
1.2
s10 s 9 s8 s 7 s6 s 5 s4 s 3 s2 s1
Fusion Coefficient
Page 15 of 39Industry ClustersInformation TechnologyICA-0601-1
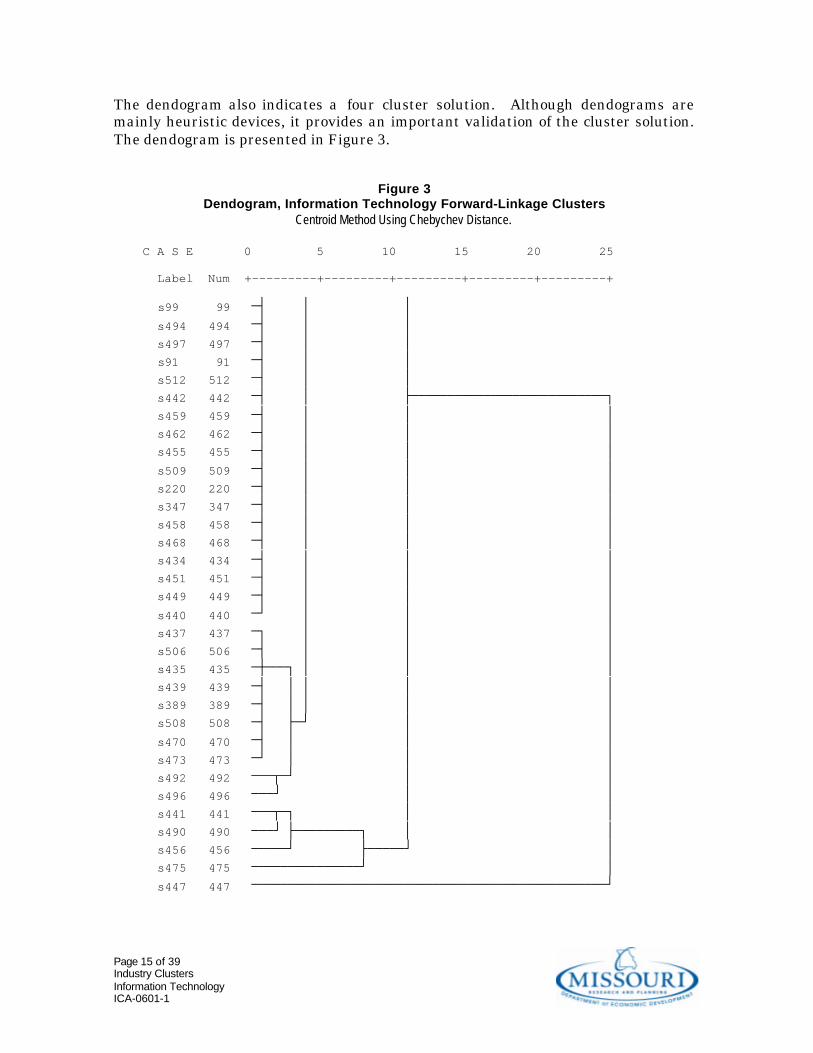
The dendogram also indicates a four cluster solution. Although dendograms aremainly heuristic devices, it provides an important validation of the cluster solution.The dendogram is presented in Figure 3.
Figure 3Dendogram, Information Technology Forward-Linkage Clusters
Centroid Method Using Chebychev Distance.
C A S E 0 5 10 15 20 25
Label Num +---------+---------+---------+---------+---------+
s99 99 òú ó ó s494 494 òú ó ó s497 497 òú ó ó s91 91 òú ó ó s512 512 òú ó ó s442 442 òú ó ùòòòòòòòòòòòòòòòòòòòòòòòòòòòø s459 459 òú ó ó ó s462 462 òú ó ó ó s455 455 òú ó ó ó s509 509 òú ó ó ó s220 220 òú ó ó ó s347 347 òú ó ó ó s458 458 òú ó ó ó s468 468 òú ó ó ó s434 434 òú ó ó ó s451 451 òú ó ó ó s449 449 òú ó ó ó s440 440 ò÷ ó ó ó s437 437 òø ó ó ó s506 506 òú ó ó ó s435 435 òôòòòø ó ó ó s439 439 òú ó ó ó ó s389 389 òú ó ó ó ó s508 508 òú ùò÷ ó ó s470 470 òú ó ó ó s473 473 ò÷ ó ó ó s492 492 òòòûò÷ ó ó s496 496 òòò÷ ó ó s441 441 òòòûòø ó ó s490 490 òòò÷ ùòòòòòòòòòø ó ó s456 456 òòòòò÷ ùòòòòò÷ ó s475 475 òòòòòòòòòòòòòòò÷ ó s447 447 òòòòòòòòòòòòòòòòòòòòòòòòòòòòòòòòòòòòòòòòòòòòòòòòò÷

Page 16 of 39Industry ClustersInformation TechnologyICA-0601-1
The analysis of variance (ANOVA) F-test indicates that the output variable issignificantly different between the four clusters - statistically validating the clustersolution. By examining cluster membership and the differences in means, the fourclusters of information technology outputs can be described. Refer to Table 8 andChart 4.
The first cluster is described as supplying Fourth-Order Outputs, since theinformation technology industry sells a small amount of goods and services to theseindustries (average sales of $55.2 million). The second cluster is described assupplying Third-Order Outputs, since the information technology industry sells amoderate amount of goods and services to these industries (average sales of $141.1million). The third cluster is described as supplying First-Order Outputs, since theinformation technology industry sells the most amount of goods and services to theseindustries (average sales of $332.4 million). The fourth cluster is described assupplying Second-Order Outputs , since the information technology industry sells alarge amount of goods and services to these industries (average sales of $240.6million).
Table 8Analysis of Variance, Information Technology Forward-Linkage Clusters
F-TEST
F(4,520) = 2528.14 p = 0.000
CLUSTER N MEAN STANDARDDEVIATION
1 10 55,196,753.00 20,862,119.462 3 141,117,433.33 19,170,434.043 1 332,367,700.00 -4 1 240,574,400.00 -
Chart 4Cluster Means, Information Technology Forward-Linkage Clusters
0
50,000,000
100,000,000
150,000,000
200,000,000
250,000,000
300,000,000
350,000,000
Cluster 1 Cluster 2 Cluster 3 Cluster 4
Output Transactions

Page 17 of 39Industry ClustersInformation TechnologyICA-0601-1
The First-Order Outputs cluster is composed of industries to which the IT sector sellsthe most of its outputs (goods and services). It appears that the IT sector sellsheavily to the wholesale trade sector. This cluster is composed of wholesalers thatpurchase IT goods and services to sell to retailers.
The Second-Order Outputs cluster is composed of industries to which the IT sectorsells a large share of its outputs (goods and services). It appears that the IT sectorsells heavily to the computer and data processing industry. This cluster is composedof IT firms that purchase the goods and services of other IT firms to conduct business.
The Third-Order Outputs cluster is composed of industries to which the IT sectorsells a moderate amount of its outputs (goods and services). It appears that the ITsector sells moderately to the banking sector, doctors and dentists, and thecommunications industry. This cluster is composed of professional services thatrequire heavy investment in IT goods and services.
The Fourth-Order Outputs cluster is composed of industries to which the IT sectorsells a small amount of its outputs (goods and services). It appears that the IT sectorsells sparingly to higher education, hospitals, engineering and architectural firms, airtransportation and manufacturing, and various business and consulting services.This cluster is composed of manufacturing and service industries that requiremoderate investment in IT goods and services.
Table 9Information Technology Forward-Linkage Clusters
All Transactions Occur Within Missouri.
CLUSTER INDUSTRY OUTPUTS(Dollars)
First-Order Outputs Wholesale Trade 332,367,700Second-Order Outputs Computer and Data Processing Services 240,574,400
Banking 161,607,500Doctors and Dentists 138,126,600
Third-Order Outputs
Communications - Except Radio and TV 123,618,200Colleges and Universities - Schools 100,927,800Hospitals 81,500,140Engineering and Architectural Services 60,137,580Air Transportation 54,178,270Equipment Rental and Leasing 48,638,110Other Business Services 46,014,230Aircraft Manufacturing 44,587,310Management and Consulting Services 44,241,520Motor Freight Transport and Warehousing 36,750,770
Fourth-Order Outputs
Arrangement Of Passenger Transportation 34,991,800
Page 18 of 39Industry ClustersInformation TechnologyICA-0601-1
Industry Value-Chain
By taking the backward-linkage and forward-linkage clusters, the informationtechnology value-chain can be ascertained. This is significant in that decision-makers need to know which industries are suppliers and consumers of IT goods andservices. This will allow government officials to better identify and target whichindustries in Missouri supply the IT industry, and which industries purchase ITgoods and services. This will permit state and local government to target programsaimed at developing these ancillary industries, especially supplier industries. Referto Figure 4.
In terms of backward-linkages, it appears that the IT industry purchases most of itsinputs from the computer and data processing sector - indicating that the IT sector ishighly dependent on other IT firms to provide needed inputs. The IT industry alsopurchases moderately from: the wholesale trade and electronic components sectors toobtain various goods used in production; the communications sector to obtaintelecommunications and internet services; and the real estate sector for facilities.Lastly, the IT industry purchases sparingly from a host of business operation servicesin support of personnel, fiscal, legal and shipping operations.
In terms of forward-linkages, it appears that the IT industry sells most of its outputsto the wholesale trade sector, who in turn sell IT goods to retailers for consumers topurchase. Additionally, the IT industry also sells heavily to other IT firms,indicating that there is a high degree of interdependence among IT firms. The ITindustry also sells moderately to banks, the medical profession, and thetelecommunications sector. Generally, the IT industry provides mission-criticalservices and software to these sectors that is specific to their business functions.Lastly, the IT industry sells sparingly to a host of professional service, transportationand manufacturing firms. The IT industry provides services and software to collegeand universities, hospitals, engineering and architectural firms, aircraftmanufacturing and transportation firms, a variety of business and consultingservices firms, and to the trucking and warehousing industry. Generally, theseindustries require a higher degree of IT infrastructure in order to operate.

Page 19 of 39Industry ClustersInformation TechnologyICA-0601-1
Figure 4Information Technology Industry Value-Chain
InformationTechnology
First-Order InputsComputer & Data Processing Services
Second-Order InputsWholesale Trade
Electronic ComponentsCommunications - Except Radio and TV
Real Estate
Third-Order InputsOther Business Services
Personnel Supply ServicesLegal Services
BankingU.S. Postal Service
First-Order OutputsWholesale Trade
Second-Order OutputsComputer & Data Processing Services
Third-Order OutputsBanking
Doctors and DentistsCommunications
Fourth-Order OutputsColleges and Universities - Schools
HospitalsEngineering and Architectural Services
Air TransportationEquipment Rental and Leasing
Other Business ServicesAircraft Manufacturing
Management and Consulting ServicesMotor Freight Transport and WarehousingArrangement Of Passenger Transportation

Page 20 of 39Industry ClustersInformation TechnologyICA-0601-1
IV. Location of Industry Clusters
Now that we have delineated the information technology industry value-chain, wecan begin to analyze where IT input and output clusters are located within the state.This is significant in that decision-makers need to know where potential IT suppliersand consumers are located in Missouri. This will allow businesses to better selectfacility locations, in that it identifies areas where suppliers and consumers arelocated. Also, it allows government officials to develop a strategy for recruiting ITfirms, highlighting the region's existing supplier and consumer base.
In general, the most optimal areas for the IT industry to develop are characterized bya sizable industry cluster employment base and high specialization. This informationcan be ascertained by looking at the employment base and specialization within eachcluster of the value-chain. Data is taken from Covered Employment and Wages,maintained by the Missouri Department of Economic Development.
Specialization ratios (SRs), also known as location quotients, are used to describe thedispersion of cluster employment across Missouri. SRs measure a county’semployment concentration in a given cluster relative to the state average.Comparing these ratios over time gives an indication of the relative strengths andweaknesses of the industry cluster. SRs greater than 1.0 indicate that the county isrelatively more specialized in an industry cluster relative to the state as a whole; orthat the county has a comparative advantage in that cluster. SRs less than 1.0indicate that the county is less specialized in an industry cluster relative to the stateas a whole, which may indicate an area for potential growth; or that the county doesnot have a comparative advantage in that cluster.
It is important to note that SRs measure the proportion of industry clusteremployment relative to the state average, and not the total number of jobs.Therefore, although St. Louis may have the largest number of employees within aparticular industry cluster, it may account for only a small percentage of totalemployment – leading to a small SR. It is also important to note that the followingSRs are normalized to the Missouri mean. In general, SRs are most informativewhen normalized to the national mean. However, national data was not available atthis level of sector detail.
The formula for a SR is given below:
=
stateEMPLOYMENT_TOTALstateEMPLOYMENT_SECTOR
countyEMPLOYMENT_TOTALcountyEMPLOYMENT_SECTOR
torsecSR
Page 21 of 39Industry ClustersInformation TechnologyICA-0601-1
Backward-Linkage Clusters
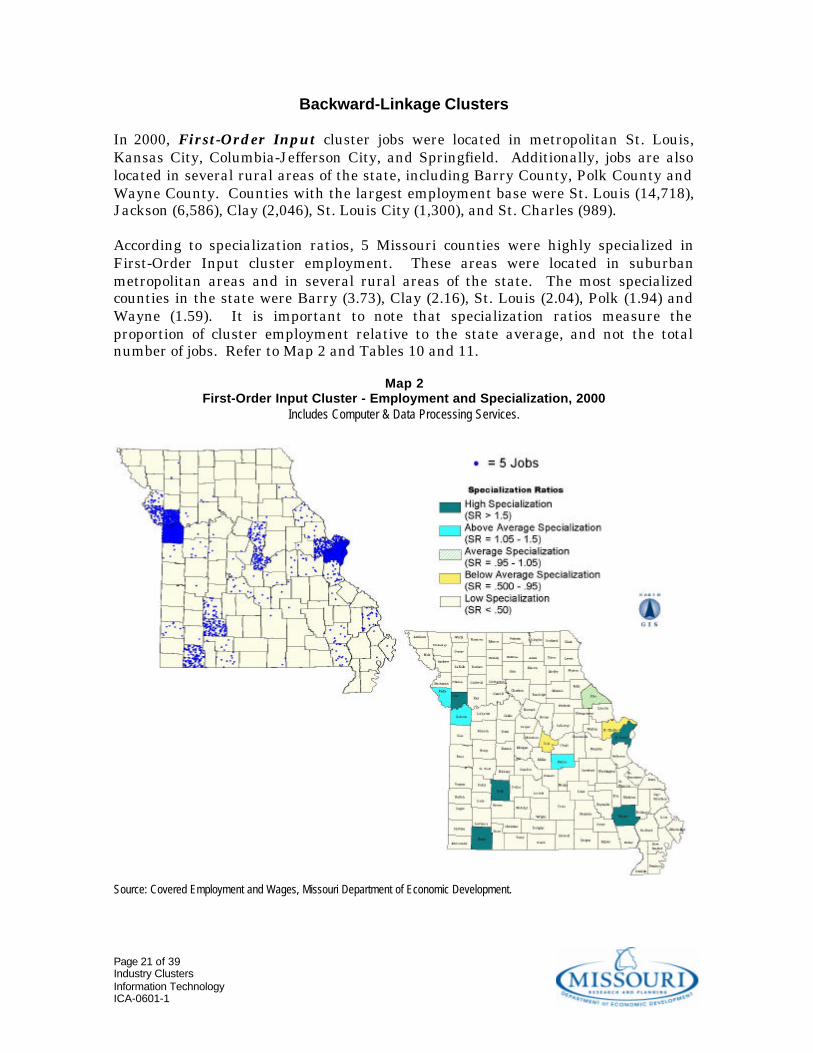
In 2000, First-Order Input cluster jobs were located in metropolitan St. Louis,Kansas City, Columbia-Jefferson City, and Springfield. Additionally, jobs are alsolocated in several rural areas of the state, including Barry County, Polk County andWayne County. Counties with the largest employment base were St. Louis (14,718),Jackson (6,586), Clay (2,046), St. Louis City (1,300), and St. Charles (989).
According to specialization ratios, 5 Missouri counties were highly specialized inFirst-Order Input cluster employment. These areas were located in suburbanmetropolitan areas and in several rural areas of the state. The most specializedcounties in the state were Barry (3.73), Clay (2.16), St. Louis (2.04), Polk (1.94) andWayne (1.59). It is important to note that specialization ratios measure theproportion of cluster employment relative to the state average, and not the totalnumber of jobs. Refer to Map 2 and Tables 10 and 11.
Map 2First-Order Input Cluster - Employment and Specialization, 2000
Includes Computer & Data Processing Services.
Source: Covered Employment and Wages, Missouri Department of Economic Development.

Page 22 of 39Industry ClustersInformation TechnologyICA-0601-1
Table 10First-Order Input Cluster - Employment, 2000
Includes Computer & Data Processing Services.
COUNTY EMPLOYMENT SPECIALIZATIONRATIO
St. Louis 14,717.56 2.04Jackson 6,586.11 1.49Clay 2,045.67 2.16St. Louis City 1,300.33 0.46St. Charles 989.44 0.93Barry 634.78 3.73Greene 601.56 0.38Platte 476.00 1.24Cole 432.44 0.75Boone 370.00 0.44Polk 155.11 1.94Cape Girardeau 126.22 0.28Jefferson 114.33 0.24Buchanan 93.78 0.19Butler 79.33 0.40
Source: Covered Employment and Wages, Missouri Department of Economic Development.
Table 11First-Order Input Cluster - Specialization Ratios, 2000
Includes Computer & Data Processing Services.
COUNTY EMPLOYMENT SPECIALIZATIONRATIO
Barry 634.78 3.73Clay 2,045.67 2.16St. Louis 14,717.56 2.04Polk 155.11 1.94Wayne 44.00 1.59Jackson 6,586.11 1.49Platte 476.00 1.24Maries 17.33 1.09Pike 67.56 0.99St. Charles 989.44 0.93Cole 432.44 0.75St. Louis City 1,300.33 0.46Boone 370.00 0.44Butler 79.33 0.40Greene 601.56 0.38
Source: Covered Employment and Wages, Missouri Department of Economic Development.

Page 23 of 39Industry ClustersInformation TechnologyICA-0601-1
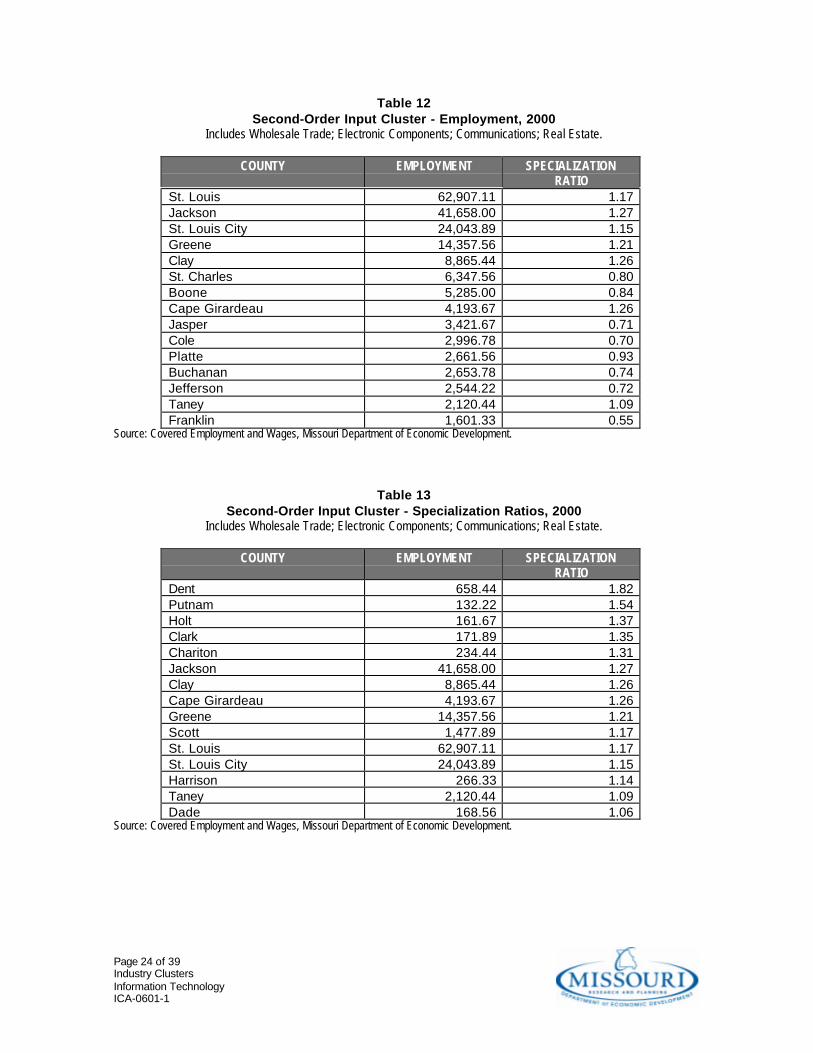
In 2000, Second-Order Input cluster jobs were located in metropolitan St. Louis,Kansas City and Springfield. Additionally, jobs are also located in several ruralareas of the state, including Cape Girardeau County, Cole County and Taney County.Counties with the largest employment base were St. Louis (62,907), Jackson (41,658),St. Louis City (24,044), Greene (14,358) and Clay (8,865).
According to specialization ratios, 2 Missouri counties were highly specialized inSecond-Order Input cluster employment. These areas were located in two rural areasof the state. The most specialized counties in the state were Dent (1.82) and Putnam(1.54). It is important to note that specialization ratios measure the proportion ofcluster employment relative to the state average, and not the total number of jobs.Refer to Map 3 and Tables 12 and 13.
Map 3Second-Order Input Cluster - Employment and Specialization, 2000
Includes Wholesale Trade; Electronic Components; Communications; Real Estate.
Source: Covered Employment and Wages, Missouri Department of Economic Development.
Page 24 of 39Industry ClustersInformation TechnologyICA-0601-1
Table 12Second-Order Input Cluster - Employment, 2000
Includes Wholesale Trade; Electronic Components; Communications; Real Estate.
COUNTY EMPLOYMENT SPECIALIZATIONRATIO
St. Louis 62,907.11 1.17Jackson 41,658.00 1.27St. Louis City 24,043.89 1.15Greene 14,357.56 1.21Clay 8,865.44 1.26St. Charles 6,347.56 0.80Boone 5,285.00 0.84Cape Girardeau 4,193.67 1.26Jasper 3,421.67 0.71Cole 2,996.78 0.70Platte 2,661.56 0.93Buchanan 2,653.78 0.74Jefferson 2,544.22 0.72Taney 2,120.44 1.09Franklin 1,601.33 0.55
Source: Covered Employment and Wages, Missouri Department of Economic Development.
Table 13Second-Order Input Cluster - Specialization Ratios, 2000
Includes Wholesale Trade; Electronic Components; Communications; Real Estate.
COUNTY EMPLOYMENT SPECIALIZATIONRATIO
Dent 658.44 1.82Putnam 132.22 1.54Holt 161.67 1.37Clark 171.89 1.35Chariton 234.44 1.31Jackson 41,658.00 1.27Clay 8,865.44 1.26Cape Girardeau 4,193.67 1.26Greene 14,357.56 1.21Scott 1,477.89 1.17St. Louis 62,907.11 1.17St. Louis City 24,043.89 1.15Harrison 266.33 1.14Taney 2,120.44 1.09Dade 168.56 1.06
Source: Covered Employment and Wages, Missouri Department of Economic Development.
Page 25 of 39Industry ClustersInformation TechnologyICA-0601-1
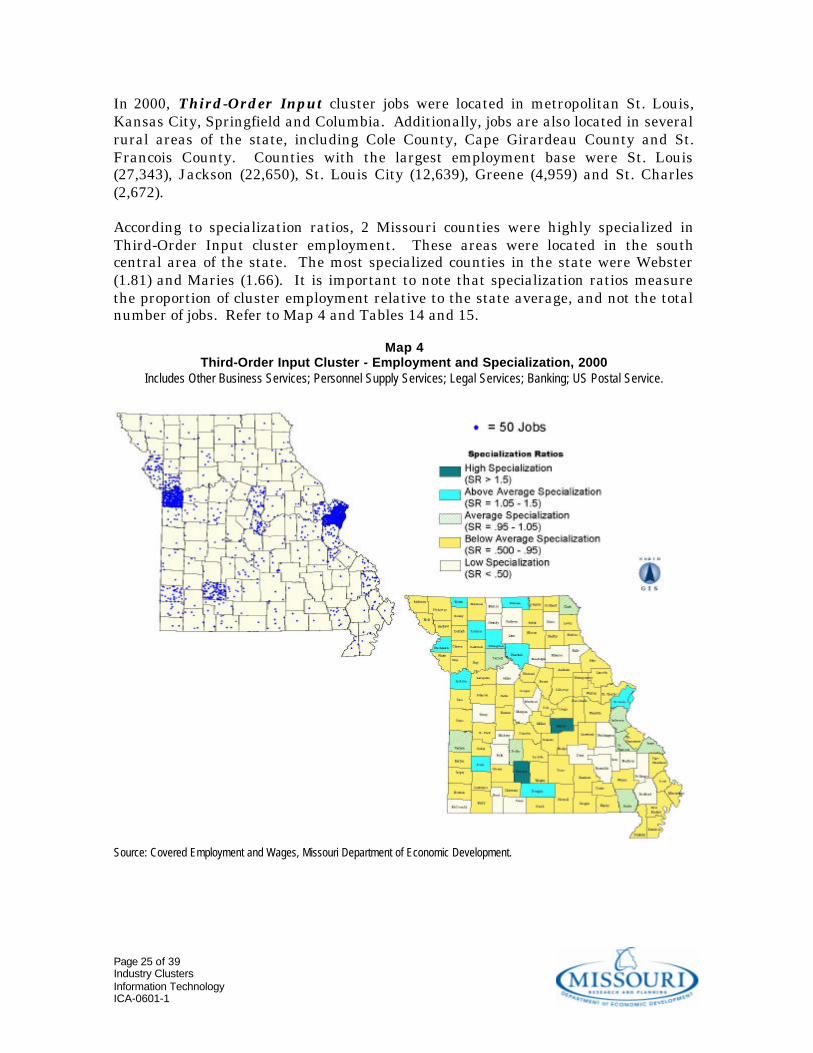
In 2000, Third-Order Input cluster jobs were located in metropolitan St. Louis,Kansas City, Springfield and Columbia. Additionally, jobs are also located in severalrural areas of the state, including Cole County, Cape Girardeau County and St.Francois County. Counties with the largest employment base were St. Louis(27,343), Jackson (22,650), St. Louis City (12,639), Greene (4,959) and St. Charles(2,672).
According to specialization ratios, 2 Missouri counties were highly specialized inThird-Order Input cluster employment. These areas were located in the southcentral area of the state. The most specialized counties in the state were Webster(1.81) and Maries (1.66). It is important to note that specialization ratios measurethe proportion of cluster employment relative to the state average, and not the totalnumber of jobs. Refer to Map 4 and Tables 14 and 15.
Map 4Third-Order Input Cluster - Employment and Specialization, 2000
Includes Other Business Services; Personnel Supply Services; Legal Services; Banking; US Postal Service.
Source: Covered Employment and Wages, Missouri Department of Economic Development.

Page 26 of 39Industry ClustersInformation TechnologyICA-0601-1
Table 14Third-Order Input Cluster - Employment, 2000
Includes Other Business Services; Personnel Supply Services; Legal Services; Banking; US Postal Service.
COUNTY EMPLOYMENT SPECIALIZATIONRATIO
St. Louis 27,342.78 1.10Jackson 22,650.22 1.49St. Louis City 12,638.56 1.31Greene 4,959.33 0.90St. Charles 2,671.78 0.73Boone 2,410.22 0.83Clay 2,158.33 0.66Buchanan 1,968.22 1.19Jasper 1,866.44 0.83Cole 1,681.44 0.84Jefferson 1,625.78 0.99Cape Girardeau 1,347.44 0.87Franklin 909.44 0.68St. Francois 749.78 0.99Platte 680.00 0.51
Source: Covered Employment and Wages, Missouri Department of Economic Development.
Table 15Third-Order Input Cluster - Specialization Ratios, 2000
Includes Other Business Services; Personnel Supply Services; Legal Services; Banking; US Postal Service.
COUNTY EMPLOYMENT SPECIALIZATIONRATIO
Webster 445.00 1.81Maries 91.00 1.66Putnam 59.78 1.50Jackson 22,650.22 1.49St. Louis City 12,638.56 1.31Chariton 103.78 1.25Dade 90.33 1.23Buchanan 1,968.22 1.19Livingston 293.00 1.17Daviess 82.67 1.14St. Louis 27,342.78 1.10Worth 18.44 1.08Douglas 103.00 1.07Clark 61.67 1.05Perry 341.44 1.00
Source: Covered Employment and Wages, Missouri Department of Economic Development.

Page 27 of 39Industry ClustersInformation TechnologyICA-0601-1
Forward-Linkage Clusters
In 2000, First-Order Output cluster jobs were located in metropolitan St. Louis,Kansas City and Springfield. Additionally, jobs are also located in several ruralareas of the state, including Cape Girardeau County, Cole County and Scott County.Counties with the largest employment base were St. Louis (41,409), Jackson (21,452),St. Louis City (13,590), Greene (10,175) and Clay (7,706).
According to specialization ratios, 8 Missouri counties were highly specialized inFirst-Order Output cluster employment. These areas were located Kansas City andin several rural areas of the state. The most specialized counties in the state wereDent (2.68), Putnam (2.05), Clark (1.91), Chariton (1.77), Clay (1.70), Scott (1.53),Harrison (1.53) and Dade (1.51). It is important to note that specialization ratiosmeasure the proportion of cluster employment relative to the state average, and notthe total number of jobs. Refer to Map 5 and Tables 16 and 17.
Map 5First-Order Output Cluster - Employment and Specialization, 2000
Includes Wholesale Trade.
Source: Covered Employment and Wages, Missouri Department of Economic Development.

Page 28 of 39Industry ClustersInformation TechnologyICA-0601-1
Table 16First-Order Output Cluster - Employment, 2000
Includes Wholesale Trade.
COUNTY EMPLOYMENT SPECIALIZATIONRATIO
St. Louis 41,409.22 1.19Jackson 21,452.22 1.02St. Louis City 13,590.33 1.01Greene 10,174.89 1.33Clay 7,705.67 1.70St. Charles 3,712.22 0.73Boone 3,096.89 0.76Jasper 2,601.22 0.84Cape Girardeau 2,412.11 1.12Platte 2,236.67 1.21Buchanan 2,095.78 0.91Cole 1,934.56 0.70Jefferson 1,781.67 0.78Scott 1,242.56 1.53Franklin 1,170.56 0.63
Source: Covered Employment and Wages, Missouri Department of Economic Development.
Table 17First-Order Output Cluster - Specialization Ratios, 2000
Includes Wholesale Trade.
COUNTY EMPLOYMENT SPECIALIZATIONRATIO
Dent 623.33 2.68Putnam 113.44 2.05Clark 156.33 1.91Chariton 204.89 1.77Clay 7,705.67 1.70Scott 1,242.56 1.53Harrison 230.33 1.53Dade 154.33 1.51Maries 109.89 1.44New Madrid 614.89 1.38Daviess 138.56 1.37Greene 10,174.89 1.33Montgomery 241.22 1.31Holt 96.56 1.27Bollinger 132.56 1.26
Source: Covered Employment and Wages, Missouri Department of Economic Development.

Page 29 of 39Industry ClustersInformation TechnologyICA-0601-1
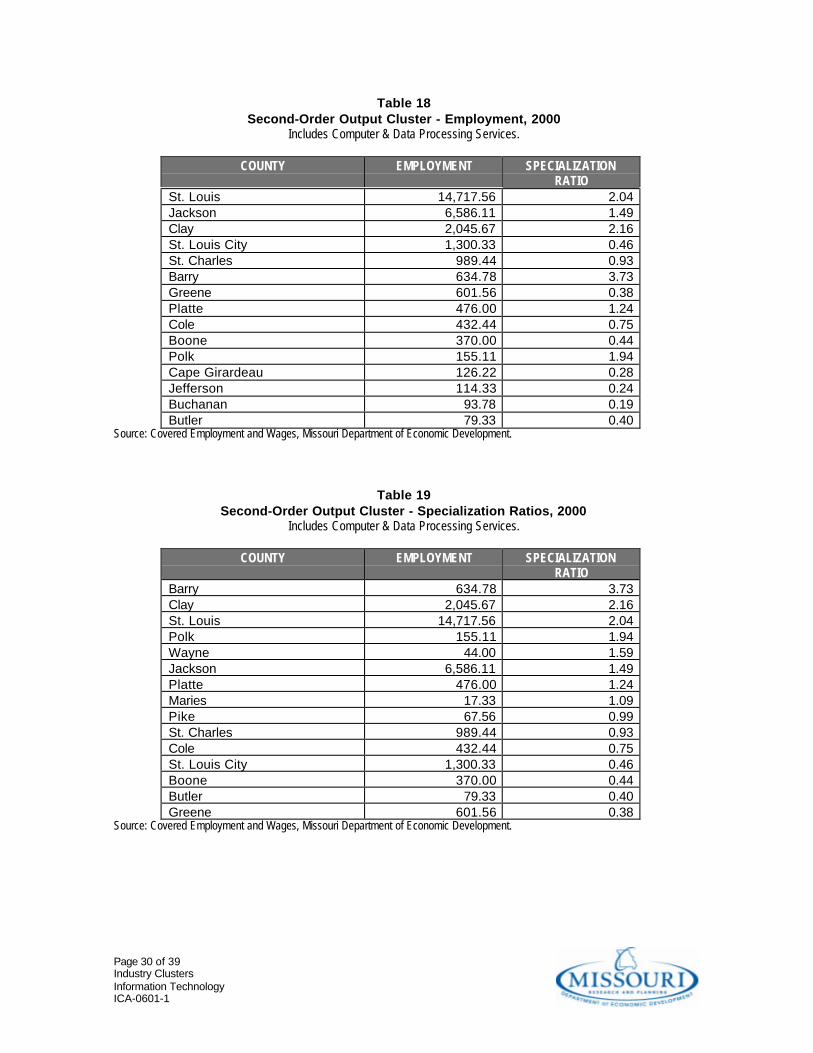
In 2000, Second-Order Output cluster jobs were located in metropolitan St. Louis,Kansas City, Columbia-Jefferson City, and Springfield. Additionally, jobs are alsolocated in several rural areas of the state, including Barry County, Polk County andWayne County. Counties with the largest employment base were St. Louis (14,718),Jackson (6,586), Clay (2,046), St. Louis City (1,300), St. Charles (989) and Barry(635).
According to specialization ratios, 5 Missouri counties were highly specialized inSecond-Order Output cluster employment. These areas were located in the suburbanmetropolitan areas and in several rural areas of the state. The most specializedcounties in the state were Barry (3.73), Clay (2.16), St. Louis (2.04), Polk (1.94) andWayne (1.59). It is important to note that specialization ratios measure theproportion of cluster employment relative to the state average, and not the totalnumber of jobs. Refer to Map 6 and Tables 18 and 19.
Map 6Second-Order Output Cluster - Employment and Specialization, 2000
Includes Computer & Data Processing Services.
Source: Covered Employment and Wages, Missouri Department of Economic Development.
Page 30 of 39Industry ClustersInformation TechnologyICA-0601-1
Table 18Second-Order Output Cluster - Employment, 2000
Includes Computer & Data Processing Services.
COUNTY EMPLOYMENT SPECIALIZATIONRATIO
St. Louis 14,717.56 2.04Jackson 6,586.11 1.49Clay 2,045.67 2.16St. Louis City 1,300.33 0.46St. Charles 989.44 0.93Barry 634.78 3.73Greene 601.56 0.38Platte 476.00 1.24Cole 432.44 0.75Boone 370.00 0.44Polk 155.11 1.94Cape Girardeau 126.22 0.28Jefferson 114.33 0.24Buchanan 93.78 0.19Butler 79.33 0.40
Source: Covered Employment and Wages, Missouri Department of Economic Development.
Table 19Second-Order Output Cluster - Specialization Ratios, 2000
Includes Computer & Data Processing Services.
COUNTY EMPLOYMENT SPECIALIZATIONRATIO
Barry 634.78 3.73Clay 2,045.67 2.16St. Louis 14,717.56 2.04Polk 155.11 1.94Wayne 44.00 1.59Jackson 6,586.11 1.49Platte 476.00 1.24Maries 17.33 1.09Pike 67.56 0.99St. Charles 989.44 0.93Cole 432.44 0.75St. Louis City 1,300.33 0.46Boone 370.00 0.44Butler 79.33 0.40Greene 601.56 0.38
Source: Covered Employment and Wages, Missouri Department of Economic Development.

Page 31 of 39Industry ClustersInformation TechnologyICA-0601-1
In 2000, Third-Order Output cluster jobs were located in metropolitan St. Louis,Kansas City, Springfield and Columbia. Additionally, jobs are also located in severalrural areas of the state, including Cape Girardeau County, Cole County and ButlerCounty. Counties with the largest employment base were St. Louis (37,380), Jackson(32,875), St. Louis City (17,520), Greene (7,993) and St. Charles (5,376).
According to specialization ratios, no Missouri counties were highly specialized inThird-Order Output cluster employment. However, Maries County (1.49) andJackson County (1.49) had significant above average specialization. It is importantto note that specialization ratios measure the proportion of cluster employmentrelative to the state average, and not the total number of jobs. Refer to Map 7 andTables 20 and 21.
Map 7Third-Order Output Cluster - Employment and Specialization, 2000
Includes Banking; Doctors & Dentists; Communications.
Source: Covered Employment and Wages, Missouri Department of Economic Development.

Page 32 of 39Industry ClustersInformation TechnologyICA-0601-1
Table 20Third-Order Output Cluster - Employment, 2000
Includes Banking; Doctors & Dentists; Communications.
COUNTY EMPLOYMENT SPECIALIZATIONRATIO
St. Louis 37,379.89 1.03Jackson 32,874.56 1.49St. Louis City 17,520.11 1.25Greene 7,993.33 1.01St. Charles 5,376.33 1.01Clay 3,745.11 0.79Boone 3,116.67 0.74Cape Girardeau 3,018.89 1.35Cole 2,594.89 0.90Jasper 2,209.67 0.68Buchanan 1,748.00 0.73Jefferson 1,449.67 0.61Franklin 1,437.78 0.74Butler 1,016.78 1.03Platte 947.89 0.49
Source: Covered Employment and Wages, Missouri Department of Economic Development.
Table 21Third-Order Output Cluster - Specialization Ratios, 2000
Includes Banking; Doctors & Dentists; Communications.
COUNTY EMPLOYMENT SPECIALIZATIONRATIO
Maries 118.56 1.49Jackson 32,874.56 1.49Worth 34.56 1.40Cape Girardeau 3,018.89 1.35St. Louis City 17,520.11 1.25Howard 166.33 1.25Knox 70.78 1.22Clark 101.00 1.19Dallas 165.22 1.16Cedar 193.89 1.14Marion 892.33 1.14Putnam 64.78 1.12Clinton 283.22 1.11Holt 87.00 1.10Caldwell 87.33 1.09
Source: Covered Employment and Wages, Missouri Department of Economic Development.

Page 33 of 39Industry ClustersInformation TechnologyICA-0601-1
In 2000, Fourth-Order Output cluster jobs were located in metropolitan St. Louis,Kansas City, Springfield and Columbia. Additionally, jobs are also located in severalrural areas of the state, including Cape Girardeau County, Cole County andCallaway County. Counties with the largest employment base were St. Louis(83,445), Jackson (45,121), St. Louis City (40,573), Greene (23,509) and Boone(19,969).
According to specialization ratios, 5 Missouri counties were highly specialized inFourth-Order Output cluster employment. These areas were located in the largerregional cities in Missouri. The most specialized counties in the state were Boone(2.21), Platte (2.15), Newton (1.86), Callaway (1.82), and Adair (1.57). It is importantto note that specialization ratios measure the proportion of cluster employmentrelative to the state average, and not the total number of jobs. Refer to Map 8 andTables 22 and 23.
Map 8Fourth-Order Output Cluster - Employment and Specialization, 2000
Includes Colleges & Universities; Hospitals; Engineering & Architectural Services; Air Transportation;Equipment Rental & Leasing; Other Business Services; Aircraft Manufacturing; Management & Consulting Services;
Motor Freight & Warehousing; Arrangement of Passenger Transportation.
Source: Covered Employment and Wages, Missouri Department of Economic Development.

Page 34 of 39Industry ClustersInformation TechnologyICA-0601-1
Table 22Fourth-Order Output Cluster - Employment, 2000
Includes Colleges & Universities; Hospitals; Engineering & Architectural Services; Air Transportation;Equipment Rental & Leasing; Other Business Services; Aircraft Manufacturing; Management & Consulting Services;
Motor Freight & Warehousing; Arrangement of Passenger Transportation.
COUNTY EMPLOYMENT SPECIALIZATIONRATIO
St. Louis 83,444.89 1.08Jackson 45,121.22 0.96St. Louis City 40,573.44 1.36Greene 23,509.11 1.39Boone 19,969.44 2.21Jasper 9,075.78 1.31Platte 8,794.11 2.15Clay 6,748.22 0.67St. Charles 5,826.56 0.51Cape Girardeau 5,479.11 1.15Buchanan 5,392.78 1.05Newton 4,108.89 1.86Cole 3,399.11 0.55Callaway 2,960.44 1.82Jefferson 2,774.89 0.55
Source: Covered Employment and Wages, Missouri Department of Economic Development.
Table 23Fourth-Order Output Cluster - Specialization Ratios, 2000
Includes Colleges & Universities; Hospitals; Engineering & Architectural Services; Air Transportation;Equipment Rental & Leasing; Other Business Services; Aircraft Manufacturing; Management & Consulting Services;
Motor Freight & Warehousing; Arrangement of Passenger Transportation.
COUNTY EMPLOYMENT SPECIALIZATIONRATIO
Boone 19,969.44 2.21Platte 8,794.11 2.15Newton 4,108.89 1.86Callaway 2,960.44 1.82Adair 2,031.56 1.57Phelps 2,758.33 1.45Greene 23,509.11 1.39Polk 1,169.67 1.37St. Louis City 40,573.44 1.36Johnson 2,267.56 1.33Jasper 9,075.78 1.31Butler 2,531.44 1.21Nodaway 1,213.11 1.17Cape Girardeau 5,479.11 1.15St. Louis 83,444.89 1.08
Source: Covered Employment and Wages, Missouri Department of Economic Development.

Page 35 of 39Industry ClustersInformation TechnologyICA-0601-1
V. Implications and Summary
Given that information technology (IT) is a targeted industry in Missouri, there is aneed to delineate the entire IT value-chain within the state. One method toaccomplish this is to determine and analyze where IT input and output clusters arelocated in Missouri. This information is significant in that decision-makers need toknow where potential IT suppliers and consumers are located within the state. Thisallows businesses to better select facility locations, in that it identifies areas where ITsuppliers and consumers are located. Also, it allows government officials to develop astrategy for recruiting IT firms, highlighting the state's existing supplier andconsumer base. In general, the most optimal areas for the development of the ITindustry are characterized by a sizable industry cluster employment base and highspecialization.
In terms of backward-linkages, it appears that the IT industry purchases most of itsinputs from the computer and data processing sector - indicating that the IT sector ishighly dependent on other IT firms to provide needed inputs. In 2000, First-OrderInput cluster jobs were located in metropolitan St. Louis, Kansas City, Columbia-Jefferson City, and Springfield. Additionally, jobs are also located in several ruralareas of the state, including Barry County, Polk County and Wayne County.According to specialization ratios, 5 Missouri counties were highly specialized inFirst-Order Input cluster employment. These areas were located in suburbanmetropolitan areas and in several rural areas of the state. The most specializedcounties in the state were Barry, Clay, St. Louis, Polk and Wayne.
The IT industry also purchases moderately from the wholesale trade and electroniccomponents sectors to obtain various goods used in production; the communicationssector to obtain telecommunications and internet services; and the real estate sectorfor facilities. In 2000, Second-Order Input cluster jobs were located in metropolitanSt. Louis, Kansas City and Springfield. Additionally, jobs are also located in severalrural areas of the state, including Cape Girardeau County, Cole County and TaneyCounty. According to specialization ratios, 2 Missouri counties were highlyspecialized in Second-Order Input cluster employment. These areas were located intwo rural areas of the state. The most specialized counties in the state were Dentand Putnam.
Lastly, the IT industry purchases sparingly from a host of business operation servicesin support of personnel, fiscal, legal and shipping operations. In 2000, Third-OrderInput cluster jobs were located in metropolitan St. Louis, Kansas City, Springfieldand Columbia. Additionally, jobs are also located in several rural areas of the state,including Cole County, Cape Girardeau County and St. Francois County. Accordingto specialization ratios, 2 Missouri counties were highly specialized in Third-OrderInput cluster employment. These areas were located in the south central area of thestate. The most specialized counties in the state were Webster and Maries.

Page 36 of 39Industry ClustersInformation TechnologyICA-0601-1
In terms of forward-linkages, it appears that the IT industry sells most of its outputsto the wholesale trade sector, who in turn sell IT goods to retailers for consumers topurchase. In 2000, First-Order Output cluster jobs were located in metropolitan St.Louis, Kansas City and Springfield. Additionally, jobs are also located in severalrural areas of the state, including Cape Girardeau County, Cole County and ScottCounty. According to specialization ratios, 8 Missouri counties were highlyspecialized in First-Order Output cluster employment. These areas were locatedKansas City and in several rural areas of the state. The most specialized counties inthe state were Dent, Putnam, Clark, Chariton, Clay, Scott, Harrison and Dade.
Additionally, the IT industry also sells heavily to other IT firms, indicating that thereis a high degree of interdependence among IT firms. In 2000, Second-Order Outputcluster jobs were located in metropolitan St. Louis, Kansas City, Columbia-JeffersonCity, and Springfield. Additionally, jobs are also located in several rural areas of thestate, including Barry County, Polk County and Wayne County. According tospecialization ratios, 5 Missouri counties were highly specialized in Second-OrderOutput cluster employment. These areas were located in the suburban metropolitanareas and in several rural areas of the state. The most specialized counties in thestate were Barry, Clay, St. Louis, Polk and Wayne.
The IT industry also sells moderately to banks, the medical profession, and thetelecommunications sector. Generally, the IT industry provides mission-criticalservices and software to these sectors that is specific to their business functions. In2000, Third-Order Output cluster jobs were located in metropolitan St. Louis, KansasCity, Springfield and Columbia. Additionally, jobs are also located in several ruralareas of the state, including Cape Girardeau County, Cole County and Butler County.According to specialization ratios, no Missouri counties were highly specialized inThird-Order Output cluster employment. However, Maries County and JacksonCounty had significant above average specialization.
Lastly, the IT industry sells sparingly to a host of professional service, transportationand manufacturing firms. The IT industry provides services and software to collegeand universities, hospitals, engineering and architectural firms, aircraftmanufacturing and transportation firms, a variety of business and consultingservices firms, and to the trucking and warehousing industry. Generally, theseindustries require a higher degree of IT infrastructure in order to operate.
Page 37 of 39Industry ClustersInformation TechnologyICA-0601-1
References
Aldenderfer, Mark S. and Roger K. Blashfield. 1984. Cluster Analysis. SageUniversity Paper Series on Quantitative Applications in the Social Sciences,44. London, UK: Sage Publications.
Bergman, Edward and Edward Feser. 1999. "Industry Clusters: A Methodology andFramework for Regional Development Policy in the U.S." In BoostingInnovation: The Cluster Approach, edited by T. Roelandt and P. den Hertog.Paris, FRANCE: Organisation for Economic Cooperation and Development.
Feser, Edward. 1998. "Old and New Theories of Industry Clusters." In Clusters andRegional Specialisation: On Geography, Technology and Networks, edited byM. Steiner. London, UK: Pion Publications.
Stough, Richard. 1998. Technology in Virginia's Regions . School of Public PolicyResearch Report. Fairfax, VA: George Mason University.
Page 38 of 39Industry ClustersInformation TechnologyICA-0601-1
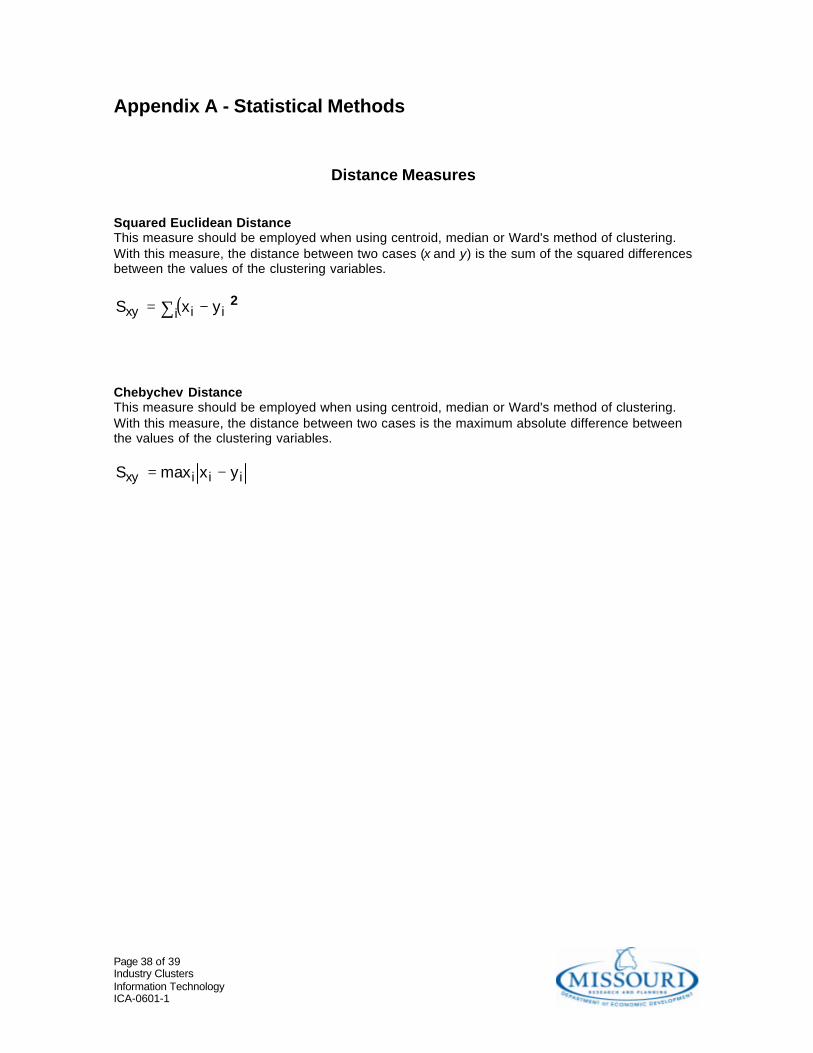
Appendix A - Statistical Methods
Distance Measures
Squared Euclidean DistanceThis measure should be employed when using centroid, median or Ward's method of clustering.With this measure, the distance between two cases (x and y) is the sum of the squared differencesbetween the values of the clustering variables.
( )∑ −= i iixy yxS 2
Chebychev DistanceThis measure should be employed when using centroid, median or Ward's method of clustering.With this measure, the distance between two cases is the maximum absolute difference betweenthe values of the clustering variables.
iiixy yxmaxS −=

Page 39 of 39Industry ClustersInformation TechnologyICA-0601-1
Clustering Methods
General ProcedureBegin with N clusters each containing one case. Denote the clusters 1 through N.Where: S Matrix of similarity or dissimilarity measures
Sij Similarity of dissimilarity measure between cluster i and cluster j.Ni Number of case in cluster i.
• Find the most similar pair of clusters p and q (p > q). Denote this similarity Spq. If a dissimilaritymeasure is used, large values indicate dissimilarity. If a similarity measure is used, smallvalues indicate dissimilarity.
• Reduce the number of clusters by one through merger of clusters p and q. Label the newcluster t (=q) and update similarity matrix by the method specified to reflect revised similaritiesor dissimilarities between cluster t and all other clusters. Delete the row and column of Scorresponding to cluster p.
• Perform the previous two steps until all entities are in one cluster.• For each of the following methods, the similarity or dissimilarity matrix S is updated to reflect
revised similarities or dissimilarities (Str) between the new cluster t and all other clusters r asgiven below.
Centroid MethodUpdate Str by:
( ) pqqp
qpqr
qp
qpr
qp
ptr S
NN
NNS
NN
NS
NN
NS
2+−
++
+=
Ward's MethodUpdate Str by:
( ) ( ) ( )[ ]pqrrqqrrpprrt
tr SNSNNSNNNN
S −++++
=1
Update the coefficient W by:
pqS.WW 50+=
Note that for Ward's method, the coefficient given in the agglomeration schedule is really thewithin-cluster sum of squares at that step. For all other methods, this coefficient represents thedistance at which the clusters p and q were joined.
ICA-0601-1
Analysis and reporting by David J. Peters, Planner.Maps by Zachary Johnson, GIS Analyst.
June 2001
Direct all correspondence to David J. Peters:
580 Harry S. Truman BuildingResearch and Planning
Department of Economic DevelopmentJefferson City, MO 65102
TEL: (573) 522-2791FAX: (573) 751=7385
E-MAIL: [email protected]: http://www.MissouriEconomy.org