Embed Size (px)
Citation preview

Summary
• Previous research from Civitas1 has revealed that post-Brexit, in the event of there beingno trade treaty, UK exports to the EU-27 could expect to suffer tariff costs in the regionof £5.2 billion, but the corresponding exports from the EU-27 to the UK would face costsin the region of £12.9 billion. These figures were advanced as a strong argument that itis in the best interests of the EU-27 to agree a trade treaty to permit tariff-free access totheir markets to the UK.
• This paper considers the policy responses open to the UK in the event that a trade treatyis not reached, in terms of mitigating the cost of these tariffs for UK businesses.
• After Brexit, the UK will be bound by the rules of the World Trade Organization (WTO). It will be prevented from offering ‘prohibited subsidies’, linked directly to exportperformance, and will be at risk from retaliation by foreign governments if it offers‘actionable subsidies’, those which cause injury to a foreign business by providing specificbenefits for UK industries.
• Provided the UK establishes mitigation schemes which are non-specific, economy-widemeasures, foreign governments will not be able to retaliate.
• Freed from the EU rules on state aid, the UK will be able to implement greater taxincentives for research and development expenditure for all businesses. This policy isjustifiable in its own right. The cost would be in the region of £2.9 billion, of which £2.1billion (73%) would go to industries suffering EU-27 tariffs.
• Freed from the EU rules on state aid, the UK will be able to operate a more extensiveregional aid programme. Using simple rules acceptable to the WTO, areas covering 65%of the population could receive assistance worth £3.8 billion, of which £3.1 billion (82%)would go to exporting industries. At present EU rules limit the UK to assisting areascovering only 27% of the population.
Mitigating the impact of tariffs on UK-EU trade
Report: January 2017
William Norton
1 Protts, ‘Potential post-Brexit tariff costs for EU-UK trade’ (October 2016) available at http://www.civitas.org.uk/reports_articles/potential-post-brexit-tariff-costs-for-eu-uk-trade/

• Freed from the EU rules on state aid, the UK can redesign its energy policy. Whatever itdecides to do about emissions trading, and wider climate change policy, abolition of thedamaging carbon price floor mechanism makes sense in its own right. It would release£1.2 billion in costs, including £392 million for domestic users of electricity.
• These measures would be supplemented by a Transitional Assistance Programme (TAP),a discretionary economy-wide scheme making payments to aid adjustment costs arisingfrom Brexit, capped in practice at 1% of the value of a business’ exports. Set at that level,the scheme would not infringe WTO rules on actionable subsidies.
• The exports that would be affected by EU-27 tariffs are best considered in four maincategories: (i) agricultural products, including food and beverages, which have their ownWTO rules; (ii) ‘seriously-affected’ non-agricultural products, which face tariff costs inexcess of 5% of the value of exports; (iii) ‘middle products’, where the tariff burden wouldbe between 1%-5%; and (iv) ‘de minimis products’, where the tariff burden would bebelow 1% of the value of exports.
• Outside the EU, the UK would have to negotiate the assessment of its own ‘TotalAggregate Measure of Support (AMS) Commitment’, the WTO ceiling on permittedsubsidies for agriculture. This threshold is likely to be the equivalent of €5 billion. GivenWTO rules on the categorisation of agriculture support (the so-called Green Box, AmberBox and Blue Box), this will be more than sufficient to both implement a UK replacementfor the EU Common Agriculture Policy and to mitigate the £1.7 billion tariff costs thissector would face.
• The ‘seriously-affected non-agricultural products’ (motor vehicles, most textiles, somechemicals, plastics, fishing, ceramics and aluminium) face total tariff costs of £2.3 billion.Because of the locations in which these businesses are based, and because of their R&Dexpenditure and electricity usage, it would be possible for the UK government tocompletely mitigate the impact of EU tariffs through R&D tax incentives, the abolition ofthe carbon floor price, the TAP and through regional aid.
• The ‘middle products’ and ‘de minimis products’ groups face EU tariff costs of £1.2 billionin aggregate. The same policies would not only mitigate the cost of tariffs, but wouldactually leave these industries with slight net gains.
• These mitigation measures are better considered not as a stop-gap response to animmediate problem, but as part of a co-ordinated long-term industrial strategy to improveBritish competitiveness for a global market. That is also the best means of matching up‘winners’ and ‘losers’ from the tariffs and the mitigation measures.
• Such a strategy would have to be based on a horizontal, economy-wide approach. Itwould not represent a return to 1970s-style ‘picking winners’, if only because such anovert targeting of benefits would be heavily constrained by the WTO rules.
• Hitherto, discussion of the UK’s departure from the EU has focussed upon the risks of‘Hard Brexit’ and the need to soften this by avoiding costs for business such as tariffsbeing levied upon exports to the EU-27.
civitas.org.uk/research/europe • 2

• The real question is not ‘how soft a Brexit can we achieve?’ but rather ‘how hard anegotiation do we wish to drive with the EU?’ The balance of negotiating strengths is farmore favourable to the UK. If the EU-27 decide to levy tariffs on British exports, Britainhas little to fear.
• The UK should stop obsessing about the EU and worrying about how they will react. Weshould get on with the task of managing our own affairs in our own interests, and leavethe EU to worry about their own problems.
• What does ‘Brexit’ mean? It means having nobody else to blame.
civitas.org.uk/research/europe • 3

Part One: The Nature of the Problem
Previous research by Civitas2 has provided an estimate of the tariff costs that could arise forboth the UK and the EU on the trade between them in the event that a free trade agreement isnot reached as part of the Brexit negotiations. In such a situation, what is sometimes calledBrexit on the ‘WTO-only basis’, the UK would inherit the current EU tariff schedule on the goodsit currently imports from the other EU-27. The relevant findings for each exporting sector aresummarised in Table A1 of Appendix I to this paper. That research highlighted the likely costsas constituting a strong argument for the conclusion of such a deal.But what if, despite this, nodeal could be reached, and the two sides were forced to suffer these costs? What scope wouldthe UK government have to offer compensation to the affected businesses?
The WTO regime on subsidies
The UK is a member of the World Trade Organisation (WTO) in its own right. This would notbe affected by Brexit, although it would entail some bureaucratic adjustments because theexercise of its membership has been conducted through the medium of the EU. UK policy istherefore subject to the constraints – and benefits from the protections – of a complex seriesof international agreements.
Base case: the SCM Agreement
The starting point for policy is the WTO Agreement on Subsidies and Countervailing Measures1994 (‘the SCM Agreement’). This limits both subsidies for exports and the scope to retaliateagainst the trade policy of other states.
A ‘subsidy’ is defined as a public financial contribution (whether a grant, a direct investment,a loan guarantee, a tax incentive, or purchases and sales of goods and services) or aprice/income support mechanism which in either case confers a ‘benefit’ on an industry.3 Whatconstitutes a benefit is not defined in the agreement, but WTO case law and the context ofassessing justifiable countervailing measures establishes that in essence a benefit is conferredwhen an industry receives a non-arms’ length gain compared to prevailing market terms andconditions.
There are two types of subsidy which invoke WTO consequences. ‘Prohibited subsidies’ are directly linked (either legally or in practice) to the volume of exports or which encouragelocally produced goods over imports.4 No WTO member is permitted to operate such schemes.An aggrieved country can take a case to the WTO for an adjudication under an acceleratedprocedure.5 If the defendant country is found to be operating prohibited subsidies, they mustbe removed immediately, or other member states are entitled to retaliate.
‘Actionable subsidies’ are those which entitle other WTO members to retaliate where thosemeasures cause them ‘adverse effects’,6 either:
civitas.org.uk/research/europe • 4
2 Protts, ‘Potential post-Brexit tariff costs for EU-UK trade’ (October 2016) available at http://www.civitas.org.uk/reports_articles/potential-post-brexit-tariff-costs-for-eu-uk-trade/
3 SCM Agreement 1994, Article 1.4 SCM Agreement 1994, Article 3.5 SCM Agreement 1994, Article 4.6 SCM Agreement 1994, Article 5.
• injury to a domestic industry; or
• nullifying or impairing the effects of the GATT 1994 Agreement; or
• serious prejudice to its interests.
The onus of proof is on the complaining country to demonstrate by an investigation that anactionable subsidy exists, using tests set out in the SCM Agreement. If the countries in disputecannot resolve the matter by mutual agreement, the complaining country can take its case to theWTO for a ruling. This requires the submission of detailed supporting evidence.7 A country foundto be in breach has six months to remedy the situation before other countries may retaliate.8
There was originally a third category, ‘non-actionable subsidies’ which governments werespecifically permitted to operate, provided such programmes were given prior clearance bythe WTO:9
• research and development (personnel; equipment and land; technical services andconsultancy; overheads and running costs) – for subsidies in value up to 75% of researchcosts and 50% of pre-competitive development costs10
• assistance to disadvantaged regions, i.e. contiguous geographical areas with their ownadministrative and economic identity, selected on ‘neutral and objective’ criteria, includingincome per capita not exceeding 85% of the national average or an unemployment rateexceeding 110% of the national average11
• adaptation to cope with the costs of new environmental regulations, provided (i) it is one-off in nature; (ii) it does not exceed 20% of the cost; (iii) it does not cover the replacementcost of capital investment; (iv) it is linked to planned pollution reduction; and (v) it isavailable to all firms.12
The exemption for non-actionable subsidies has been abolished since 31 December 1999. A sunset clause13 took effect to terminate the provisions when the relevant WTO Committeewas unable to reach a consensus as to their extension or modification.14 R&D support, regionalpolicy and compensation for environmental policy are therefore subject to the risk ofcountervailing action under the WTO regime.
The criteria for qualification as an actionable subsidy are subject to objective testing. ‘Injury to a domestic industry’ is judged by reference to changes in import volumes and domestic market prices.15 The complainant country has to demonstrate a causal link
civitas.org.uk/research/europe • 5
7 SCM Agreement 1994, Article 11.8 SCM Agreement 1994, Article 7.9 SCM Agreement 1994, Article 8.3.10 SCM Agreement 1994, Article 8.2(a).11 SCM Agreement 1994, Article 8.2(b).12 SCM Agreement 1994, Article 8.2(c).13 SCM Agreement 1994, Article 31.14 Broadly speaking, developing countries regarded non-actionable subsidies as devices to entrench the
commercial advantage of developed countries, and considered themselves less able to exploit measures tosupport R&D.
15 SCM Agreement 1994, Article 15.1.

between the foreign subsidy and the alleged injury,16 taking into account all relevant economic factors which might otherwise be affecting the domestic industry concerned.17
Countries cannot use the WTO to protect, for example, declining industries which arebecoming obsolescent anyway.
‘Nullifying or impairing’ involves measuring the effective increase in the tariff on imports throughsubsidising the prices of domestic sellers, to assess whether a government has covertlyreversed any reductions in tariffs it has promised on joining the WTO.
‘Serious prejudice’ occurs when the exports of a complaining state have been impeded,whether to the offending country or a third country (in the latter case, judged by comparativemarket share over at least one year18), or suffered significant price-undercutting, or there wasa consistent trend for the subsidised product to increase its world market share.19 Seriousprejudice is not created by a state monopoly deciding to switch supplier, force majeuredisruptions of trade or a failure to conform to new standards or regulatory requirements20
(although in the last case, the parallel WTO Agreement on Technical Barriers to Trade wouldprevent a country from using impossibly high standards as camouflaged protectionism).
Until 31 December 1999, serious prejudice was deemed to have been automatically proved ifthe price of a product was subsidised by more than 5%; an industry’s operating losses werecovered; an individual business’ operating losses were covered (other than one-off transitionalmeasures to avoid acute social problems); there was forgiveness of government debt or grantsare made to cover debt repayment.21 These provisions were a quid pro quo for the exemptionof non-actionable subsidies, and they fell away as part of the same process. Thus, if there isnarrower scope for a country to offer subsidies, it also slightly harder for complaining states totake action against them.
Furthermore, a country’s ability to retaliate against the ‘adverse effects’ is only triggered if analleged actionable subsidy is ‘specific’, i.e. targeted at designated businesses, industries orregions.22 Governments are permitted to provide subsidies if they are based on ‘criteria orconditions which are neutral, which do not favour certain enterprises over others, and whichare economic in nature and horizontal in application, such as number of employees or size ofenterprise’.23 A cut in corporation tax for all companies would not be specific,24 and neitherwould a tax allowance aimed at businesses below a certain turnover, or size of workforce.WTO case law has held that a subsidy is ‘specific’ if it benefits the producers of particular typesof products which are known and particularised, but that at some point, judged on a case-by-case basis, when a subsidy is sufficiently broadly available so as not to benefit a limited groupof products, it becomes non-specific.25
civitas.org.uk/research/europe • 6
16 SCM Agreement 1994, Article 15.5.17 SCM Agreement 1994, Article 15.4.18 SCM Agreement 1994, Article 6.4.19 SCM Agreement 1994, Article 6.3.20 SCM Agreement 1994, Article 6.7.21 SCM Agreement 1994, Article 6.1.22 SCM Agreement 1994, Article 2.23 SCM Agreement 1994, Article 2.1(b) and explanatory footnote 2.24 SCM Agreement 1994, Article 2.2: “It is understood that the setting or change of generally applicable tax rates
by all levels of government entitled to do so shall not be deemed to be a specific subsidy for the purposes ofthis Agreement.”
25 See the Panel Report in US – Upland Cotton and the Appellate Body Report US – Anti-Dumping andCountervailing Duties (China).
There is nothing to prevent a government excluding a specific industry from a subsidy scheme.That is, for instance, how the UK structures its tax-favoured investment schemes such as theEnterprise Investment Scheme, which excludes 16 different categories of business.26 The onlylimit would be whether the list of exclusions was so extensive that, in fact, the un-excludedremnant was being specifically targeted with the benefit on offer.
The SCM Agreement also provides that retaliation is not considered justified where, oninvestigation, the subsidy complained of has a beneficial value which does not exceed a deminimis threshold, or if the volume of sales being subsidised are ‘negligible’.27 For a developedcountry like the UK, the de minimis threshold is 1% of the value of the exports. There is nodefinition of what ‘negligible’ means in this context in the SCM Agreement, nor has it yet beenconsidered by WTO case law.
The SCM Agreement does define how these criteria apply to a developing country. They enjoya de minimis threshold of 2%, and their exports to a country are considered negligible if theyamount to less than 4% of the imports of those goods by that country (unless the aggregateimports from all ‘negligible’ developing countries exceeds 9% of the total).28 It is also worthnoting that the adjudication provisions of the SCM Agreement shadow closely those of theAnti-Dumping Agreement, where the de minimis threshold for a developed country is 2%, andsales are considered negligible if they do not exceed 3% of the market (provided the aggregatesales by such negligible exporters do not exceed 7% of the total).29 It is always dangerous tomount an argument from implication and silence where the law is untested, but it is notunreasonable to suppose that UK exports of a commodity would be considered negligible ina country where they achieved less than 1.5% to 2% of the imports of that good.
Retaliation may only be taken by a complainant country on behalf of a domestic industry, andit is necessary to demonstrate the action has the support of the domestic producers of at least25% of the product in question.30 A complainant country may levy preliminary countervailingduties, i.e. tariffs to reverse the impact of the offending subsidy, provided it gives notice to theforeign government and an opportunity for negotiated remedy.31 Once the domestic authoritieshave determined that an offending subsidy exists, they must first consult the other government(and provide access to the supporting evidence).32 Only if no undertaking to remove thesubsidy is obtained can the countervailing duty be imposed, at a level not exceeding theoffensive subsidy (quantified according to the SCM Agreement).33The levies must be removed
civitas.org.uk/research/europe • 7
26 Income Tax Act 2007, sections 192-199: (1) dealing in land, in commodities or futures in shares, securities orother financial instruments; (2) dealing in goods, other than in an ordinary trade of retail or wholesaledistribution; (3) financial activities; (4) leasing or letting assets on hire, except certain ship-chartering activities;(5) receiving royalties or licence fees (except exploitation of an intangible asset which the company itself hascreated); (6) providing legal or accountancy services; (7) property development; (8) farming or marketgardening; (9) woodlands, forestry activities or timber; (10) shipbuilding; (11) coal; (12) steel; (13) operating ormanaging hotels; (14) operating or managing nursing or residential care homes; (15) generating or exportingelectricity which will attract a Feed-in Tariff, unless generated by hydro power or anaerobic digestion, or carriedon by a quasi-charity; (16) providing services to another person whose trade consists of excluded activities,and the person controlling that trade also controls the company providing the services.
27 SCM Agreement 1994, Article 11.9.28 SCM Agreement 1994, Article 27.10.29 Agreement on Implementation of Article VI of the General Agreement on Tariffs and Trade 1994, Article 5.830 SCM Agreement 1994, Article 11.4.31 SCM Agreement 1994, Article 17.32 SCM Agreement 1994, Article 13.33 SCM Agreement 1994, Article 19.4.

as soon as the offensive subsidy is withdrawn34 and there is an automatic requirement thatcountervailing duties should expire after five years unless a fresh investigation demonstratesthat their removal would lead to recurrence or continuation of the offensive subsidy.35
Taken together, the qualification requirements for another country to take countervailingmeasures, and the exemptions and defences within the WTO regime itself, create considerablescope for government policy. Mitigation measures implemented as outright ‘compensation’ forloss of tariff-free access to the EU-27 would qualify as a prohibited subsidy. But provided suchmeasures were drafted to satisfy the criteria of non-specificity and non-severity, they wouldbe within the WTO rules.
A horizontal, economy-wide policy, supplemented by focused measures within WTO-approvedexemptions, would be immune from challenge – and retaliation – from the EU-27. Clearly,notwithstanding the abolition of non-actionable subsidies exemption, governments world-wideprovide state aid through support for R&D and regional policy.
The point is not uncontentious. The most protracted and detailed case ever taken through theWTO has been the dispute between the US and the EU over their respective assistance forthe Boeing and Airbus companies, which has been conducted through challenges to R&Dgrants and regional assistance at federal and state level. The WTO will investigate whether inpractice any measure predominantly or disproportionately favours an explicit group, but acarefully crafted policy should not be difficult to implement. That is likely to be attractive for agovernment which in any event was intending to adopt a new industrial strategy.
Special rules for ‘agricultural products’
A standalone Agreement on Agriculture 1994 embraces ‘agricultural products’. These aredefined quite widely.36
The Harmonised Commodity Description and Coding System (HS) divides all traded goods intoXXI high-level Sections, which are then sub-divided into a further 96 Chapters.37 The AgricultureAgreement covers the trade in all commodities within Section I (Live Animals & AnimalProducts), Section II (Vegetable Products); Section III (Animal and Vegetable Fats and Oils);and Section IV (Prepared Foodstuffs, Beverages and Spirts, and Tobacco) – but excluding fishand fish products – together with some organic compounds from Section VI (ChemicalProducts), such as essential oils, modified starches and glues; hides and raw furskins fromSection VIII (Leather and Travel Goods); and the raw base materials of silk, wool, hair, cotton,flax and hemp from Section XI (Textile and Textile Products). In total 33 Chapters are caught tosome degree, including items which would not immediately be thought of as agricultural.38
Interaction with the SCM Agreement is complicated. The Agriculture Agreement does not includean equivalent of prohibited subsidy, and the SCM Agreement rules in that area do not apply.39
civitas.org.uk/research/europe • 8
34 SCM Agreement 1994, Article 21.1.35 SCM Agreement 1994, Article 21.3.36 Agriculture Agreement 1994, Article 2 and Annex 1.37 For some reason Chapter 77 has never been assigned and is left blank, so the Chapters actually number from
01 to 97.38 The full description of commodities covered by the Agriculture Agreement is given in Appendix III.39 SCM Agreement 1994, Article 3.1.
Instead, the founding WTO members made a commitment to commence a phased reductionin export subsidies on qualifying agricultural products, to reach binding limits by 2003.40 Duringthis implementation period a so-called ‘peace clause’41 exempted agricultural products fromthe SCM Agreement regime on ‘adverse effects’42 and ‘serious prejudice’43. Althoughagricultural products are exposed to countervailing action under the SCM Agreement, andcases involving such commodities are taken to the WTO, a country’s right to retaliate is subjectto the provisions of the Agriculture Agreement.44
The Agriculture Agreement provides constraints on how countries are permitted to use theirmaximum subsidy allowance (and as with the SCM Agreement, the restrictions are morerelaxed for developing countries). UK agricultural subsidies, via its membership of the EU, arecovered by three provisions:
• Exempt Domestic Support Measures (the so-called ‘Green Box’)45
This covers public money used for general services such as research, disease control,training, information, inspection, marketing and infrastructure; together with theaccumulation of emergency food stockpiles and provision of domestic food aid to theneedy (at market price, in reasonable quantities). Also permitted are direct payments toproducers: ‘decoupled income support’46 i.e. a minimum income level not linked toproduction amounts; ‘income safety-net programmes’47 i.e. which compensate for annuallosses within prescribed limits; relief for the effects of natural disasters, nuclear accidentsand wars;48 ‘structural adjustment assistance’ designed to encourage the retirement ofproducers or products or to enable investment for modernisation (again, decoupled fromany production level);49 environmental or conservation programmes;50 and regionalassistance on objective criteria with no connection to price or production levels.51
There is no restriction on subsidies in this category, provided that they do not have theeffect of distorting trade, encouraging production or acting as price supports.52
• Production-limiting Programmes (the so-called ‘Blue Box’).53
This covers payments to producers to limit production, based on fixed area and yields,which do not exceed 85% of the base level of production, or they are made for a fixedhead of livestock.
There is no restriction on subsidies in this category.
civitas.org.uk/research/europe • 9
40 Agriculture Agreement 1994, Article 3 and Article 9.41 Agriculture Agreement 1994, Article 13.42 SCM Agreement 1994, Article 5.43 SCM Agreement 1994, Article 6.9.44 SCM Agreement 1994, Article 10.45 Agriculture Agreement 1994, Article 6 and Annex 2.46 Agriculture Agreement 1994, Annex 2, para 6.47 Agriculture Agreement 1994, Annex 2, para 7.48 Agriculture Agreement 1994, Annex 2, para 8.49 Agriculture Agreement 1994, Annex 2, paras 9-11.50 Agriculture Agreement 1994, Annex 2, para 12.51 Agriculture Agreement 1994, Annex 2, para 13.52 Agriculture Agreement 1994, Annex 2, para 1.53 Agriculture Agreement 1994, Article 6, para 5.

• Restricted Domestic Support Measures (the so-called ‘Amber Box’).54
This covers all other domestic support measures. WTO members are subject to a bindingcommitment to reduce over time the Aggregate Measurement of Support (‘Total AMS’)paid to producers.55 This catches more than just the payment of government grants, asthere is a valuation method for e.g. price support systems.
Nevertheless, there are further exemptions available. Excluded from counting towardsthe Total AMS threshold are ‘de mininis’ support measures: (a) for specific products, notexceeding 5% of the value of the country’s production of that good, priced at first-sale;(b) for non-specific support, not exceeding 5% of the value of the country’s total annualagricultural product. There is also an exemption for emergency tariffs introduced underthe ‘special safeguard provisions’.56
The Agriculture Agreement came into force as a consequence of the protracted UruguayRound trade negotiations in which countries agreed to reduce agricultural subsidies and permitgreater market access for imports. WTO members retained the right to implement specialsafeguards. Emergency tariffs may be levied where either import volumes rise above a certaintrigger level, or import prices fall below a different trigger level, such levels varying dependingon the degree of market access conceded by the country in question.
The restrictions discussed above are policed by the WTO through a system of annual reportingby members – and by members reporting each other to the WTO for any infringements.Complaining countries are only entitled to take countervailing action in the event that the anti-dumping provisions of the main GATT 1994 Treaty are violated.57
A post-Brexit UK will almost certainly wish to continue with agricultural support measures insome form. If not an exact replica of the EU Common Agricultural Policy (CAP), somethingsimilar will be implemented for at least a transitional adjustment period. The precedingsummary indicates that there will be considerable flexibility for the UK to do so – after all theCAP itself is being operated within WTO rules (albeit not without outside challenge). Thequestion is how much flexibility the UK Government will have to go beyond the CAP.
The critical component is the Total AMS Commitment level which the UK will enjoy, i.e. themaximum subsidies payable under the Agriculture Agreement. Because the UK was a memberof the EU when that agreement came into force it has never had a standalone Total AMSCommitment. The UK was included in an aggregate AMS Commitment awarded to the EU-12as it then was. This position has not been amended. Although the EU has subsequentlyexpanded to 28 members, from a regulatory perspective it is still treated as having 17 subsidyallowances under the Agriculture Agreement: that of the original EU-12, plus the 16 separateAMS levels for each new member state.
In many cases the EU has calculated an estimate of what AMS Commitment a new accessionstate would have been entitled to had it been an original signatory to the Agriculture Agreementin 1994. The same principles have been applied: a Base Total is set by reference to the state’sactual AMS averaged over the years 1986 to 1988, which is then reduced by 20% and thatlevel remains fixed for 2000 onwards.
civitas.org.uk/research/europe • 10
54 Agriculture Agreement 1994, Article 6.55 Calculated according to Agriculture Agreement 1994, Annex 3 and Annex 4.56 Agriculture Agreement 1994, Article 5.57 Agriculture Agreement 1994, Article 13(b)(i).

Part Two: Devising a Solution
The way forward under the WTO regime
UK exports to the EU should be treated as comprising four broad categories:
• ‘Agricultural products’, which are subject to a separate regime – and the priority being tonegotiate an apportionment of the EU-12 Total AMS Commitment.
This covers 24 HS Chapters, representing 9% of UK exports to the EU by value, listed inTable 9.
• ‘Seriously-affected non-agricultural products’, those non-agricultural goods where the levelof EU tariffs exceeds 5% of the value of current sales.
(Although the rule no longer applies that a subsidy in excess of 5% is automaticallydeemed to be impermissible serious prejudice, it is still a convenient threshold to identifywhere special care is required in devising mitigation measures.)
This covers 21 HS Chapters, representing 24% of UK exports to the EU by value, listedin Table 15.
• ‘Middle products’, those non-agricultural goods where the tariff cost lies between 1% and5% of the value of the exports.
This covers 39 HS Chapters, representing 55% of UK exports to the EU by value, listedin Table 28.
• ‘De minimis products’, those non-agricultural goods where overseas governments wouldbe precluded from retaliatory measures because the cost being ‘compensated’ by the UKwould be less than 1% of the value of the exports.
This covers 12 HS Chapters, representing 13% of UK exports to the EU by value, listedin Table 30.
As discussed previously, there is a further defence where UK exports to any country arenegligible, which for the purposes of discussion can be taken as less than 1.5% of all importsby that country. However, it would be unwise to base policy upon this. Aside from the inherentunpredictability, the defence only works on the facts of each overseas market. Country X mightbe precluded from retaliation against the same measure where Country Y was not. In thiscontext, it is a nice question whether the defence is tested against the EU Single Market oreach of the EU-27 individually, and it can be assumed that the EU-27 will adopt whicheverinterpretation causes most disruption.
It is unclear why the government should want to reward exporters who were not very successful.If their failure to achieve more than negligible sales in an overseas market is due to foreignsubsidies then the correct response, once the UK has regained sovereignty over its own tradepolicy, is to pursue counteraction for foreign misdeeds through the WTO regime, not to subsidisedomestic failure. In any event, an analysis of the UK market share for 96 commodities in eachof 27 EU member states is outside the scope of this paper.
civitas.org.uk/research/europe • 11

The attitude of policy-makers towards cross-subsidisation also requires clarity. SupposeIndustry X would suffer from £1 million of tariffs being levied on its exports to the EU, but thecorresponding imports from the EU-27 would generate £2 million from tariffs. Industry X couldbe considered a ‘winner’ – except that the costs are being borne by exporting businesses andthe revenues are all being received by HM Treasury. This provides a resource from whichgovernment can fund mitigation measures to ‘compensate’ Industry X. But should the whole ofthe revenue be ear-marked for Industry X?
The contrary case suggests not. Industry Y, which incurs the impact of £2 million in tariff costs,where there is only £1 million in balancing import tariffs, is likely to expect the government tomake good the missing ‘compensation’, which will require all tariff revenue to be pooled andthus surplus receipts from Industry X can be directed towards Industry Y. Such an aggregatedapproach still ignores the issue that the businesses within Industry X will incur direct cash lossesbut, because of the WTO rules, and especially so in the case of the highest losers, are unlikelyto be receiving a direct infusion of cash. Instead they will benefit indirectly, from horizontal, non-specific programmes which not every individual business may be able to exploit as well as others. We have to think in terms of assisting industries which export rather than specificexporters as such.
The previous Civitas research indicates that in fact HM Treasury is likely to receive surplusfunds, in that the total receipts on imports from the EU-27 would be in the region of £12.9 billionas against total tariffs on UK exported goods of £5.2 billion.58 That leaves policy-makers somefreedom of manoeuvre. But it still ignores a very pertinent issue.
The fortunate cash-flow consequence for HM Treasury is not something which suddenly fallsfrom the sky out of a helicopter, or is found in a crock at the end of a rainbow. If governmentfinds itself in surplus funds, that resource has been provided by the purchases of imports, i.e.,ultimately, by UK consumers. Just as with any individual exporter affected by tariffs, there is noautomatic netting-off between the cash costs that consumers will suffer and benefits providedto someone else. Since they will be subsidising this exercise to the tune of £12.9 billion, atsome point UK consumers might not unreasonably ask when and how someone is going to‘compensate’ them.
A pro-Brexit argument which was aired occasionally during the referendum campaign is thepossibility of substitution: that UK exporters may lose sales, but so will their EU competitors,and this creates space to make good losses through increased domestic sales (and judging bythe anticipated tariff costs for both sides, previous Civitas research suggests that UK businesseswill have more ‘space’ to exploit). That may be so, although it begs the question that, if true, wemight as well leave all ‘compensation’ to market adjustments of this kind.
Whether desirable or not, this still ignores the problem that winnings and losses are very unlikelyto match up and net off for every UK business. It also ignores the fact that often the reason UKconsumers buy EU-27 goods in the first place is because there is no local alternative. Bydefinition, there is no UK producer of French champagne. Your daughter – perhaps moreimportantly, her prospective mother-in-law – is unlikely to be impressed to learn that onlyfermented fizzy apple juice from Hereford will be served at the wedding.
civitas.org.uk/research/europe • 12
58 See Table A1 in Appendix I.

Mitigation of the immediate trade costs of Brexit, then, raises wider political issues which gobeyond the scope of this paper. A difficult balance must be struck between the short-termpolitical imperative to reassure UK business in the event of anything other than a very ‘soft’Brexit, and the longer-run interests of the tax-paying consumer. Ultimately, no mitigationprogramme can be implemented until those questions are addressed.
For the purposes of discussion, this paper confines itself to the narrower – and much simpler– question of how without breaching WTO rules government can deliver mitigating benefits atleast equal in value to the costs which UK business is likely to incur.
Options for mitigation
Non-agricultural exports do not enjoy the benefit of a single magic bullet solution. Insteadgovernment will have to devise a series of overlapping programmes which in aggregate relievethe impact of the EU-27 tariffs. Care would still have to be taken to ensure that in practice thesemeasures were non-specific. For example, if the UK’s only factory manufacturing super-widgetshappened to be located in Barchester, a programme which declared Barchester to be a specialEnterprise Zone with valuable rebates for the essential components of super-widgets, is likelyto be challenged. Assistance has to be delivered through objective, horizontal measuresdelivering benefits across the whole economy.
As this paper will make clear, such an approach is possible. The major constraint on governmentis not whether non-specific measures to assist Industry X can be devised, but whether HMTreasury can afford the cost of delivering ‘unnecessary’ windfalls to other businesses. Forexample, in 2015/16 UK corporation tax raised £44.4 billion in revenue.59 The abolition ofcorporation tax would therefore deliver a benefit far in excess of the cost of tariffs on exports tothe EU-27. The main drawback, however, is that with at most only £12.9 billion revenue beingcontributed by imports from the EU-27, this policy has created a £31.5 billion black hole in thepublic finances – and Ministers will have to explain to the country why they are now expectedto fill it. The secondary drawbacks are that domestic businesses who have no intention ofexporting receive an ‘undeserved’ windfall, whilst a loss-making exporter receives no benefit atall, because corporation tax is only levied on profits. That is doubly unfair on an exporter if (assome would undoubtedly claim) it has been the imposition of EU tariffs which pushed theirfinances into the red in the first place.
A sense of perspective is essential. Very few British businesses actually engage in overseastrade. The latest ONS data suggests that at most only 10.6% of UK enterprises export abroad.60
The proportion which engages only with the EU-27 is probably around a third of that, or about4% of the total.61 ONS survey data indicates that exporters are disproportionately likely to belarger enterprises (with more than 250 employees or a turnover in excess of £25 million), more
civitas.org.uk/research/europe • 13
59 Autumn Statement 2016, Table C.5, page 58.60 ONS “Annual Business Survey importers and exporters”, release 10 November 2016, Table 1 Exporters and
Importers of Goods and/or Services Provisional 2015 figures. Out of 2,153,600 UK businesses registered forVAT and/or PAYE only 228,700 exported either goods or services.
61 It is difficult to verify precise numbers on this topic. The Department for Business, Innovation & Skills (as itthen was) formerly published Regional Economic Performance Indicators which covered this topic, but theseries has been discontinued. The last available figures, for 2011 Q4, suggest that of 50,433 UK companiesinvolved in exporting goods (Table F2i), only 17,679 exported them to the EU (Table F2ii), which would bearound 35% of total exporters. The documents may be found at < https://www.gov.uk/government/statistics/repi-exports> (accessed 17/11/16).

than 20 years old and under foreign ownership.62 In contrast, on a comparable survey basis, inso far as there is a ‘typical’ UK business, it tends to have fewer than 10 employees, a turnoverof less than £1 million, to be less than 10 years old, and to be British-owned.63 Withoutdownplaying the importance of export earnings for UK plc, the media attention which the tariffissue has attracted should not permit the tail to wholly wag the dog.
The objective, then, is to identify measures which assist exporters but which also have a meritin their own right. That would justify the leakage of public funds on windfall gains for non-exporters. It would also enable the programme to carry the support of the vast majority of UKbusinesses who are not directly affected and who if anything might be expecting Brexit to deliverthe benefit of, for example, escape from the burdens of EU regulation.
So what the overall mitigation programme amounts to is, in fact, a UK industrial strategy. It istherefore worthwhile canvassing candidate programmes for their suitability.
Scope for mitigation through assistance for R&D
Although the non-actionable subsidy exemption is no longer available, R&D support is still themost attractive route for mitigating EU-27 tariff costs. Public intervention to support anexpansion of the UK’s innovation base is likely to be a key element of any industrial strategy.Mitigation through R&D would seem to tick every possible box.
We know from bitter experience that merely throwing public money at something is noguarantee of success. Whilst individual businesses might enjoy spill-over benefits from fundinggiven to an industry as a whole, for example through public funding of a research institute, thereis a practical maximum to the amount of research and development that can be undertaken in
civitas.org.uk/research/europe • 14
62 ONS “Annual Business Survey importers and exporters”, release 10 November 2016, Table 1 Exporters andImporters of Goods and/or Services Provisional 2015 figures.
63 ONS “Annual Business Survey importers and exporters”, release 10 November 2016, Table 1 Exporters andImporters of Goods and/or Services Provisional 2015 figures.
Table 1: Expenditure on R&D by UK businesses (£ million)
2012 2014 2015
All businesses 18,617 19,819 20,885of which Agricultural products 558 566 562 Share 3% 3% 3%Seriously-affected non-agriculture 3,032 3,373 3,747 Share 16% 17% 18%Middle products 5,529 5,821 6,061 Share 30% 29% 29%De minimis products 4,370 4,246 4,525 Share 23% 21% 22% Share excluding pharmaceuticals 2% 2% 2%Excluded services 5,129 5,811 5,989 Share 28% 29% 29%
Source: ONS “UK Business Enterprise Research and Development”, Table 2 dataset released 17 November 2016.

any year before spending ceases to provide any useful results. Beyond that point money issimply being wasted (or inflates the salaries of the researchers). That raises the question ofBritain’s current capacity to absorb an expansion of research & development.
Table 1 summaries the most recent figures, analysed by reference to the categories of exportdiscussed in this paper. A full analysis by business sector is given in Table B1 in Appendix II.
The categories in which the ONS reports the data for Table 1 do not dovetail exactly with theHS Classification used to derive the tariff cost estimates.64 The major difference is the presenceof ‘Excluded services’, which are not affected by tariffs at all and yet account for a considerableproportion of total R&D, outweighing any of the individual non-agricultural categories. Thefigures given should therefore be treated as ball-park estimates rather than hard numbers.
It is interesting that, once Excluded services are discounted, the share of total R&D spendingbetween the categories is not too dissimilar to their share of exports to the EU-27. The majordiscrepancy is caused by exports in Chapter 30 (pharmaceuticals), which face minimal tariffcosts, hence its inclusion in the de minimis category, whilst being responsible for around 20%of total R&D. An economy-wide mitigation scheme based on R&D is therefore going to delivera significant windfall to this sector. Pharmaceuticals could, of course, be expressly excludedfrom the programme, but Ministers will likely consider that in a post-Brexit environment, thiswould send the wrong signals to the outside world.
The most obvious point to draw from Table 1 is that the UK, facing post-Brexit tariffs on exportsto the EU costing in the region of £5.2bn, currently spends several multiples of this sum onR&D. Would Brexit alter that?
One argument advanced for voting Remain in the referendum was that UK business benefitsgreatly from EU grants to assist, among other things, research and development. But the actualtotal grants received by UK businesses from the EU in recent years have amounted to no morethan £67 million.65 In the context of the sums in Table 1, this is insignificant – and the argumentpresupposes that post-Brexit the UK will be permanently locked-out of participation in any EUprogrammes. That is unlikely since a good number of these schemes are currently open toresidents of non-EU members. In any event, since the UK is a net contributor to the EU Budget,one consequence of Brexit will be a net cash saving for HM Treasury, and so it will be in aposition to make good any shortfall from that source.
Table 2 summarises the sources of the spending in Table 1 for the most recent available year,2015, analysed by our five broad categories. A full analysis by industry is given in Table B2 inAppendix II.
These figures should be taken with the same caution applied to Table 1 in regards toclassification. But even with imprecise estimates, Table 2 indicates that all sectors derive thebulk of the funding for R&D from their own resources. Indeed, the more affected by tariffs anindustry is, it is far more likely to be doing so. Members of the seriously-affected non-agricultural
civitas.org.uk/research/europe • 15
64 The assignment criteria are discussed more fully in the Technical Note in Appendix III.65 2013: £65 million; 2014: £65 million; 2015: £67 million. Source: ONS “UK Business Enterprise Research and
Development”, Table 3 dataset released 17 November 2016. EU funds may have reached UK businessesindirectly, e.g. via Research Councils, but the general point holds good.

Table 2: Sources of funds for R&D performed in UK businesses, 2015 (£ million)
UK Own Govmt. Overseas Funds Other Total
All businesses 1,818 3,790 14,657 622 20,885 Share of the total 9% 18% 70% 3% Agricultural products 5 167 380 10 562 Share within category 1% 30% 68% 2% Seriously-affected non-agriculture 47 466 3,162 72 3,747 Share within category 1% 12% 84% 2% Middle products 1,089 912 3,863 168 6,061 Share within category 18% 15% 64% 3% De minimis products 11 1,316 3,125 73 4,525 Share within category 0% 29% 69% 2% excluding Pharmaceuticals 2% 21% 78% 0% of which, Pharmaceuticals 5 1,243 2,856 73 4,178 Shares 0% 30% 68% 2% Excluded services 651 928 4,130 283 5,989 Share within category 11% 15% 69% 5%
‘Other’ includes funds from other UK sources and international organisations. EU Commission grants fall within ‘Overseas’.Source: ONS “UK Business Enterprise Research and Development”, Table 13 dataset released 17 November 2016.
Table 3: Analysis of UK R&D expenditure, 2015 (£ million)
Total Capital Salaries/ Other Wages Current
All businesses 20,885 1,691 10,238 8,956 Share of the total 8% 49% 43%
Agricultural products 562 43 265 254 Share within category 8% 47% 45%Seriously-affected non-agriculture 3,747 326 1,486 1,933 Share within category 9% 40% 52%Middle non-agriculture 6,392 446 3,228 2,718 Share within category 7% 51% 43%De minimis non-agriculture 4,525 314 1,969 2,243 Share within category 7% 44% 50% excluding Pharmaceuticals 12% 50% 38%of which, Pharmaceuticals 4,178 271 1,796 2,111 Shares 6% 43% 51%Excluded services 5,659 562 3,290 1,808 Share within category 10% 58% 32%
Source: ONS “UK Business Enterprise Research and Development”, Table 10 dataset released 17 November 2016.
civitas.org.uk/research/europe • 16

civitas.org.uk/research/europe • 17
66 This last factor may in part be attributable to EU rules on State Aid. By definition these industries are oneswhere the EU levies relatively higher tariffs, to protect against foreign competitors. Attracting such politicalsensitivity means that the EU Commission might be equally keen to police “unfair competition” as betweenmember states in these sectors.
Table 4: UK R&D current expenditure by type, 2015 (£ million)
Total Basic Applied Experimental Development
All businesses 19,194 1,276 7,996 9,922 Share of the total 7% 42% 52%Agricultural products 519 86 240 193 Share within category 17% 46% 37%Seriously-affected non-agriculture 3,421 50 897 2,447 Share within category 1% 26% 72%Middle non-agriculture 5,944 420 2,845 2,704 Share within category 7% 48% 45%De minimis non-agriculture 4,211 170 1,660 2,382 Share within category 4% 39% 57% excluding Pharmaceuticals 5% 55% 41%of which, Pharmaceuticals 3,907 156 1,494 2,257 Shares 4% 38% 58%Excluded services 5,099 550 2,354 2,196 Share within category 11% 46% 43%
Source: ONS “UK Business Enterprise Research and Development”, Table 11 dataset released 17 November 2016.
group are also far less likely than the average UK business to be already in receipt of agovernment grant.66
The ONS publishes data from which it is possible to analyse how individual industries allocate theirR&D expenditure. Table 3 breaks down the spending in the most recent available year, 2015, forthe broad categories of product. A full analysis by industry is given in Table B3 in Appendix II.
There is no obvious differentiation between the behaviour of the categories, except perhaps asuggestion that the least-affected industries have a slight bias to above-average capital andstaff spending. That possibly reflects economies of scale within the more-affected sectors, andalso in pharmaceuticals, allowing them to operate R&D on a less capital- and labour-intensivebasis.
Table 4 further dissects current expenditure by area of research. A full analysis by industry isgiven in Table B4 in Appendix II.
Here there are two clear outliers: agricultural products (specifically, food products, beveragesand tobacco) require a much higher-than average outlay on basic research, and the seriously-affected businesses devote a disproportionate amount of current R&D work on experimentaldevelopment. The drawback in directing support at those sectors is the leakage to other areasof the economy. Agriculture accounts for only 6% of all basic research and seriously-affectednon-agriculture for only 22% of experimental development.

That may be less of a problem in practice. ‘Research’ for agricultural products falls within theGreen Box of exempt subsidies under the Agriculture Agreement, meaning that they can bespecifically targeted, provided that the assistance does not have the effect of distorting trade,encouraging production or acting as a price support. In regard to ‘experimental development’,over half of it is accounted for by three industries: pharmaceuticals; motor vehicles; and computerprogramming and information services.67 Although two of these three are not materiallyinconvenienced by EU-27 tariffs at all, they are probably sectors which government would wantto encourage anyway. Leakage towards those industries could be politically tolerable.
R&D expenditure is, not unexpectedly, concentrated in the largest businesses. In 2015 the Top5 companies were responsible for 19.7% of all UK R&D, and the Top 100 for 59.8%.68
Businesses with fewer than 250 employees accounted for only 23.0%69. ONS data suggeststhat enterprises with fewer than 400 employees bear 29.7% of the burden70 but they do notpublish information for those below of 500 employees which, as shall be discussed later, is animportant threshold for tax purposes.
It is also geographically concentrated. Table 5 indicates that R&D is mainly undertaken in theSouth East and East regions, although there are a few variations in particular industries(Transport R&D, for instance, is more heavily skewed towards the West Midlands).
civitas.org.uk/research/europe • 18
67 See Appendix II, Table B4.68 ONS “UK Business Enterprise Research and Development”, Table 20 dataset released 17 November 2016.69 ONS “UK Business Enterprise Research and Development”, Table 26 dataset released 17 November 2016.70 ONS “UK Business Enterprise Research and Development”, Table 21 dataset released 17 November 2016.
Unfortunately, the ONS only publishes R&D data at the regional level, and then only byreference to much broader industry categories which lack the detail available for the
Table 5: UK R&D expenditure and employment by region and country, 2015
Region/Country Expenditure Employment £ million Share thousand Share
UNITED KINGDOM 20,885 206
ENGLAND 19,150 91.7% 183 88.8%North East 306 1.5% 4 1.9%North West 2,113 10.1% 17 8.3%Yorkshire & the Humber 779 3.7% 11 5.3%East Midlands 1,515 7.3% 16 7.8%West Midlands 2,166 10.4% 19 9.2%East 4,178 20.0% 35 17.0%London 1,912 9.2% 20 9.7%South East 4,709 22.5% 44 21.4%South West 1,472 7.0% 17 8.3%
WALES 362 1.7% 5 2.4%SCOTLAND 871 4.2% 11 5.3%NORTHERN IRELAND 501 2.4% 6 2.9%
Source: ONS “UK Business Enterprise Research and Development”, Tables 18 and 19 dataset released 17 November 2016.
previous tables. But Table 5 is sufficient to illustrate that, if R&D activity is concentrated in themost prosperous parts of the UK, it will be difficult to frame an objective policy based aboutassistance for deprived areas through enhanced R&D. Ironically, of course, this concentrationwould indeed have knock-on disadvantages for businesses, if only because they will have topay their R&D staff above-average salaries. Public opinion across the nations and regions ofthe UK is unlikely to tolerate a policy which targeted assistance at the most prosperous areasprecisely because they were more successful.
Taken together, these tables indicate that UK business is already undertaking R&D from itsown resources at a level which dwarfs the likely cost impact of EU tariffs. Furthermore, theindustries which invest the largest aggregate sums on R&D are also those which are exposedto the highest impact from EU tariffs.71
The main mechanism by which the UK government encourages innovation is the R&D TaxCredit. The operation of this varies depending on the size of the business claiming it.
• Small or Medium-Sized Enterprises (SMEs):
Defined as: a business with fewer than 500 employees and either (a) annual turnoverunder €500 million; or (b) a ‘balance sheet total’, i.e. gross assets, under €86 million. Inapplying this test, businesses with common ownership over 25% are aggregated, withmore relaxed provisions applying to investments by public corporations, venture capitalhouses, business angels, universities, institutional investors and local authorities.
The relief was first introduced in 2000.72 It has been raised substantially in Budgets eversince. From April 2015 the business is entitled to claim a deduction in computing itstaxable profits equal to 230% of qualifying R&D expenditure, in addition to the deductionwhich such expenditure would have entitled anyway. Alternatively, if it has made a loss,the business can surrender this entitlement for a cash repayment equal to (at present)14.5% of the enhancement.
Suppose the business had income of £1 million, R&D expenditure of £100,000 and otherdeductible expenditure of £750,000. Normally, it would be liable to tax on its trading profitof £150,000 (£1 million - £850,000). By claiming an enhanced R&D relief, this becomesa loss for tax purposes of £80,000 (£150,000 – 230% x £100,000) which can either becarried forward against profits in future years or converted into a repayment of £11,600(14.5% x £80,000 loss).
• Large Companies
Defined as: any business which is not an SME for R&D credit purposes.
Originally, from 2002 large businesses could claim a further enhanced deduction of(eventually) 130% of the qualifying R&D, or claim a repayment worth 11% of anysurrendered credits. This provision has now been phased out, after an overlap periodfrom April 2013 when businesses could opt-in early to the new scheme.
civitas.org.uk/research/europe • 19
71 See Table B2, Appendix II.72 The legislation is contained in Finance Act 2000, Schedule 20 (as amended).

From April 2016 large businesses fall within the R&D Expenditure Credit Scheme(RDEC),73 where the business receives an ‘above the line’ credit against its tax liabilityequal to 11%74 of the R&D expenditure. This is treated as taxable income which is netted-off against any tax liabilities due from the business. Surplus amounts can be carriedforward, or repaid (but repayments are only made up to a ceiling equal to the PAYE andNIC attributable to employees whose working time is spent on R&D activity).
For these purposes ‘research and development’ means activities that fall to be treated asresearch and development in accordance with normal accounting practice,75 modified asappropriate by regulations. Only revenue expenditure on staffing and consumable storesqualifies for relief, and among other conditions there are limits on the ability of a business tocount R&D which has been subcontracted to a third party, or paid for by state grants. BEISguidelines76 establish that this requires a project to achieve an advance in science or technology,and only activities which resolve a scientific or technological uncertainty, and a closed list ofindirect ancillary costs, are eligible.
R&D Capital Allowances cater for capital expenditure.77 This covers capital expenditure on R&D,but not on the acquisition of rights or of land. As a one-off claim, an amount up to 100% of thequalifying expenditure can be deducted against taxable profits. On a subsequent disposal, thebusiness is deemed to receive taxable income if the sale proceeds exceed the written-downvalue of the asset in question (which will equal any unclaimed amount of R&D). So, if a businessspent £1,000,000 building a new research facility, and claimed 100% of the cost, for taxpurposes the building is valued at zero and on a subsequent sale all of the proceeds would betaxable income. On the other hand, if the business had only claimed 75% of the potentialallowance, the building would have a value for capital allowances purposes of £250,000(£1,000,000 less the 75% claimed as a one-off allowance), and only sale proceeds in excessof that amount would be taxable.
The 2016 Autumn Statement announced the launch of a National Productivity Investment Fund,amounting to £23 billion over the period 2017/18 to 2021/22, of which £4.7 billion was allocatedto research and development funding.78 The stated reason for this is that the UK does not investenough in research, development and innovation and in order to remain competitive “we mustbuild on our strengths in science and tech innovation to ensure that the next generation ofdiscoveries is not only made here, but developed and produced in Britain”.79 Governmentthinking is focused on two new schemes by which public bodies will direct grants and otherassistance to facilitate the take-up of pure science.80 In terms of the more every day, humdrumend of the spectrum, the Autumn Statement merely says “To ensure the UK tax system is
civitas.org.uk/research/europe • 20
73 The legislation is contained in Corporation Tax Act 2009, Part 13, cross-referring to the definition in IncomeTax Act 2007 section 1006, which contains the power to issue regulations. Income tax is relevant because thesame tax credits are also available to unincorporated businesses.
74 Originally 10% when first introduced.75 Now found in FRS102 (intangible assets other than goodwill), section 18, and FRS105 (intangible assets other
than goodwill for micro-entities), section 13; and IAS38 (intangible assets) for enterprises which have adoptedinternational accounting standards.
76 “Guidelines on the Meaning of Research and Development for Tax Purposes”, issued 5 March 2004, updated6 December 2010, available at < https://www.gov.uk/government/uploads/system/uploads/attachment_data/file/71260/bis-10-1393-rd-tax-purposes.pdf > (accessed 8/11/16).
77 The legislation is contained in Capital Allowances Act 2001, Part 6 (as amended).78 Autumn Statement 2016, Table 3.1, page 26.79 Hansard, House of Commons Debates, 23 November 2016, col.899 at col. 902.80 Autumn Statement 2016, para 3.29, page 30.

strongly pro-innovation, the government will review the tax environment for R&D to look at waysto build on the introduction of the ‘above the line’ R&D tax credit to make the UK an even morecompetitive place to do R&D.”81
The best way to complement the Government’s plans for cutting-edge discovery is to make itmore attractive for all business to carry out the basic bread-and-butter work that will do moreto immediately improve productivity across the board. Why not just increase the level of taxcredit? Assistance for R&D qualifies as state aid for EU purposes and this area of policy iscurrently controlled by the EU Commission. The definition of a ‘Small and Medium-SizedEnterprise’ is derived from EU Recommendation 2003/361/EC, which is specifically referencedin UK tax legislation as determining eligibility for relief.82 In the context of Brexit, there is nolonger any obligation to be bound by these limits. The only constraint is set by the WTO rules.
It would be unwise to tamper with the definition of ‘research and development’ set by accountingstandards. Aside from the complication which would ensue for businesses attempting to followtwo competing definitions, accountancy standards have the merit from a WTO perspective ofbeing objective and neutral. An overseas government could not accuse the UK of deliberatelyrigging its post-Brexit tax system to favour specific industries.
The cost to HM Treasury of the current R&D tax credit system is assessed at £1,750 million for2014/15 and forecast to be £1,955 million for 2015/16.83 (There are no standalone figures forR&D Capital Allowances, but Table 3 indicates that, whilst not negligible, capital R&D is acomparatively minor component.) These figures cover the transitional period when largercompanies could choose between the new RDEC process and the original enhanced deductionsimilar to, but less generous than, what is available for SMEs. The increase broadly reflectsthe impact on the public finances anticipated when RDEC was first mooted,84 adjusting forchanges in other projections.
When George Osborne, as Chancellor, announced the intention to introduce RDEC he statedthat he did so in response to representations from the CBI, the IoD and the EngineeringEmployers Federation.85 That raises the questions of whether there are advantages in puttingall businesses, irrespective of size, onto an RDEC-type above-the-line credit, or indeed, post-Brexit, whether there is any need to retain an EU-driven distinction between SMEs and LargeCompanies. The Autumn Statement suggests that the Treasury is open to such suggestions.That requires an assessment of the relative attractions of the two schemes.
Although a headline enhanced R&D relief for SMEs at 230% of actual expenditure is very eye-catching, the cash value to the enterprise is the corporation/income tax not paid – much lower,
civitas.org.uk/research/europe • 21
81 Autumn Statement 2016, para 3.30, page 30.82 Strictly speaking, not accurately. The criteria for SME R&D relief discussed above extends to “Larger SMEs”
which have staff counts, turnover and gross assets all higher than the maximum thresholds set out inRecommendation 2003/361/EC. The Commission agreed in 2008 these limits could be exceeded, withoutupdating the original source of the law. To further add to the confusion, the ONS still compiles data on the basisof the original thresholds, because that is what the written authority says, making it frustratingly difficult toassess how many businesses actually qualify for the SME R&D relief in the UK.
83 HMRC “Estimated costs of the principal tax expenditure and structural reliefs”, December 2015, available athttps://www.gov.uk/government/uploads/system/uploads/attachment_data/file/487119/Dec15_expenditure_reliefs_Final.xlsx.pdf> (accessed 8/11/16).
84 Budget Report 2013, Table 2.2, page 66, line item x.85 Hansard, House of Commons Debates, 21 March 2012, col 802.

especially since, historically, SMEs and basic rate income taxpayers have tended to be chargedto tax at rates lower than the main corporation tax rate. Putting all businesses within the LargeCompany RDEC scheme ought to deliver greater benefits for SMEs.
The drawback is that an SME would lose the current ability to cash-out surplus losses. Theprovision within the current RDEC scheme to cap the amount of credit which can be claimedeach year is clearly designed to control the annual impact on the public finances. The NewRDEC would have to include a facility for surplus credit to be repaid, up to some annualmaximum for each business, most probably set by reference to its eligible R&D spending.Setting such a threshold would require detailed HM Treasury modelling, and consultation with business.
It is a reasonable working assumption that most R&D relief will be claimed by larger companies.On that basis, the numbers work out more or less exactly. The most recent figure for currentR&D expenditure (2015) is £19,194 million (see Table 4). The estimated cost to the Treasuryof £1,955 million is therefore equivalent to just under 10.2%, quite close to the headline RDECrate for large companies in 2015/16 of 11%. It is a reasonable planning assumption that ascaling factor of 10/11ths applies, so a 1% increase in the headline RDEC rate equates to a costof 10/11% of current R&D expenditure, or, on 2015 figures, £174.5 million.
On a crude rule of thumb, referring back to Table 1, if ‘Excluded services’ are responsible for29% of all R&D expenditure, then we should expect any additional across-the-board supportfor R&D to incur a 29% leakage rate.
The following measures would therefore appear viable:
1. All businesses to be eligible for a New RDEC scheme, with credit at a rate of 22% (i.e. anincrease of 11% on the current rate)
Estimated cost: £1,889 million
Leakage: £541 million (29%)
Since this is an economy-wide measure, it is not specific.
2. Agricultural products businesses (as defined by the WTO) to be eligible for EnhancedRDEC at a rate of 33% for revenue spending on ‘basic research’.
Estimated cost: £8 million
Leakage: £nil
All of this would count as part of the New UK Total AMS Commitment governed by theAgriculture Agreement, as the CAP is at present. In practice there would be difficulties indrafting the tax legislation, and doubtless this would open planning opportunities forbusinesses at the margin, but in principle there would be zero leakage of support. By definition, it is targeted at industries which would suffer reasonably high EU-27 tariffs.As the figures suggest, agricultural products groups do not actually undertake muchresearch, so there is not much cost exposure.
civitas.org.uk/research/europe • 22

3. All businesses to be eligible for Enhanced RDEC at a rate of 33% for revenue spendingon ‘experimental development’
Estimated cost: £954 million
Leakage: £233 million (24%)
Since this is an economy-wide measure, it is not specific. In principle it might be possibleto reduce the leakage by excluding services, or some sub-set of them, but the industrieslikeliest to receive the greatest windfall benefits are those which government would mostprobably wish to support in any event. The fact that there is a lower leakage rate for thisenhanced support compared to the basic increase indicates that the measure achievesits objective of being slanted towards the industries affected by tariffs.
The total cost, then, would come to £2,851 million, of which £774 million (27%) would count asleakage. The costings for the proposal are explained in the Technical Note in Appendix III.
Scope for mitigation through regional policy
Regional policy was the other major non-actionable subsidy formerly available to WTO memberstates (now abolished). Clearly however, governments operate assistance for disadvantagedregions, and the criteria set out in the SCM Agreement can still be regarded as the internationalstandard against which national programmes are judged.
UK regional policy is currently governed by the EU and covered by its rules on state aid.Thelegal framework is set out in Article 107.3 of the Treaty on the Functioning of the EuropeanUnion, which permits two forms of regional aid ‘compatible with the internal market’, known as“a” areas and “c” areas by reference to the subsections in which they are listed:
(a) aid to promote the economic development of areas where the standard of living isabnormally low or where there is serious underemployment, and of the regions referredto in Article 34986, in view of their structural, economic and social situation;
(c) aid to facilitate the development of certain economic activities or of certain economicareas, where such aid does not adversely affect trading conditions to an extent contraryto the common interest
The EU Commission issues bespoke ‘guidance’ to member governments on regional aid.87
Among a wide range of other things (including banning any assistance for steel and syntheticfibres88) this lays down the criteria for designating areas eligible for regional aid.
“a” areas are:89
• NUTS 2 regions90 whose GDP per capita in purchasing power standards (PPS) is below
civitas.org.uk/research/europe • 23
86 Guadeloupe, French Guiana, Martinique, Réunion, Saint-Barthélemy, Saint-Martin, the Azores, Madeira andthe Canary Islands.
87 “Guidelines on regional state aid for 2014-2020”, 2013/C 209/01, 23 July 2013.88 “Guidelines on regional state aid for 2014-2020”, paragraph 9.89 “Guidelines on regional state aid for 2014-2020”, paragraph 151.90 NUTS: Nomenclature des unités territoriales statistiques or “Nomenclature of Territorial Units for Statistics”,
i.e. the EU coding system for compiling area data. NUTS 2 units are roughly equivalent to an English county,although low-population counties and unitary authorities are grouped together.

or equal to 75% of the EU average (based on the average of the last three years for whichEurostat data are available); or
• An ‘outermost region’ (i.e. the Article 349 territories).
Predefined “c” areas, which can be designated by a member state on its own discretion, are:91
• NUTS 2 regions that were designated as “a” areas during 2011-2013; or
• sparsely populated NUTS 2 regions with less than 8 inhabitants per km2 or NUTS 3regions92 with less than 1.5 inhabitants per km2 (based on Eurostat data on populationdensity for 2010).
Non-predefined “c” areas are subject to an overall ceiling such that the aggregate populationcovered by the “a” and “c” areas in all member states does not exceed 47% of the EU-28population using 2010 data. This is then carved up between the various countries in a roughand ready effort to be fair to all of them. Although it is strictly for a member government to justifydesignation in terms of the Treaty, the Guidelines provide helpful prompts:93
• Criterion 1: contiguous areas of at least 100,000 inhabitants located in NUTS 2 or NUTS3 regions that have a GDP per capita below or equal to the EU average, or anunemployment rate above or equal to 115% of the national average.
• Criterion 2: NUTS 3 regions of less than 100,000 inhabitants that have a GDP per capitabelow or equal to the EU average, or an unemployment rate above or equal to 115% ofthe national average.
• Criterion 3: islands or contiguous areas characterised by similar geographical isolation(e.g. peninsulas or mountain areas) that have a GDP per capita below or equal to the EUaverage, or an unemployment rate above or equal to 115% of the national average, orless than 5,000 inhabitants.
• Criterion 4: NUTS 3 regions, or parts of NUTS 3 regions that form contiguous areas, thatare adjacent to an “a” area or that share a land border with a country outside either theEEA or EFTA.
• Criterion 5: contiguous areas of at least 50,000 inhabitants that are undergoing majorstructural change or are in serious relative decline, provided that such areas are notlocated in NUTS 3 regions or contiguous areas that fulfil the conditions to be designatedas predefined areas or under Criteria 1 to 4.
The upshot is that the UK is left with permitted Assisted Areas covering 27.05% of the UKpopulation, living in Northern Ireland, most of Wales, most of Scotland, Cornwall and scatteredareas concentrated in Northern England and the Midlands. Government is permitted to make
civitas.org.uk/research/europe • 24
91 “Guidelines on regional state aid for 2014-2020”, paragraph 158.92 NUTS 3 units are equivalent to an English unitary authority or district council, although they may be grouped
in order to reach a certain significant population size.93 “Guidelines on regional state aid for 2014-2020”, paragraph 168.

discretionary grants to businesses in these areas, provided it does not breach specified ‘grantintensity thresholds’ (in essence, the proportion of costs borne by the taxpayer), which are morerelaxed for SMEs and also for assistance towards investment in ‘green technologies’94. Forthese purposes, ‘SME’ means the original narrow definition based on 250 employees, not therelaxed and wider definition which the EU permits for R&D. Regulation 651/2014 permits ageneral block exemption for most aid to assisted areas provided public authorities satisfy thecriteria laid down. Assistance requires prior clearance if the public authority wants to awardgrants to a company to start up a new establishment when it is closing a similar one elsewherein the EU, or if over a 3 year period the same commercial group receives more than a certainamount for activities in the same area.95
• In “a” areas, any company can receive grants towards investment in a new establishment,the expansion or diversification of an existing establishment or for fundamental changesin processes.
• In “c” areas, any SME can receive grants towards investment in a new establishment, theexpansion or diversification of an existing establishment or for fundamental changes inprocesses – but a large company can only receive grants for investment in a newestablishment or diversification if it passes further tests to demonstrate the genuine noveltyof the activity.
• Business Premises Renovation Allowance is a special capital allowance available forbringing back into use a derelict or unused property within an Assisted Area. 100% of thecosts may be deducted against tax immediately.
Regional policy is, perhaps inevitably, a devolved matter. The main vehicle for the delivery ofregional aid is the Regional Growth Fund (RGF) in England. As at 31 March 2015, £2,050 millionhad been drawn down in RGF co-financing of private sector projects, of which £906 million wasdrawn down in 2014/15. As at 3 March 2015, £1,340 million had been drawn down for paymentto programmes run by intermediary bodies, of which £486 million was paid out during 2014/15.That gives an annual cost of £1,392 million for 2014/15.96
The corresponding programme in Scotland, Regional Selective Assistance, delivered £57.8million during 2014/15,97 in Northern Ireland the Selective Financial Assistance Scheme deliversaround £50 million p.a.98 and the amount in Wales, delivered through Business Wales, appearsto be of an equivalent amount.99
civitas.org.uk/research/europe • 25
94 Covered by their own rules: “Guidelines for State Aid for environmental protection and energy 2014-20”, 2014/C200/01.
95 For “a” areas: £14.5 million; for “c” areas: £6 million.96 All figures taken from BIS “Regional Growth Fund: Annual Monitoring Report 2014-15”, page 5.97 “Regional Selective Assistance 2014/15 Annual Summary”, page 2.98 Invest NI “Selective Financial Assistance Scheme”, July 2014, available at < http://secure.investni.com/static/
library/invest-ni/documents/selective-financial-assistance-scheme-information.pdf> (accessed 30/11/16).99 It is not always easy to follow the spending of the Welsh Government. They disclose all of their programmes
which claim block exemption from EU state aid rules at < http://gov.wales/funding/state-aid/gber/schemes/?lang=en > (accessed 30/11/16), on the basis of aggregate budgets for 2014-20, covering fundingfrom all sources. Only some of these schemes qualify as ‘regional aid’ using the same measures as the Englishscheme, and not all of them are confined to ‘assisted areas’, but a crude annual average would not be materiallydifferent from the Scottish or Northern Irish spending levels.

civitas.org.uk/research/europe • 26
Since 2012 the Government has launched a programme of Enterprise Zones. These are specificsites, selected or nominated by the Local Enterprise Partnership (LEP). In total 48 are expectedto have been designated in England by April 2017.100 The equivalent devolved scheme inScotland covers 16 sites,101 and in Wales covers 8 sites.102 A scheme for Northern Ireland isnot yet operational. The intention is to encourage clusters dedicated to particular specialisms.The benefits available vary from site to site, but in general:
• Enterprises moving to the Zone can receive a discount of up to 100% on business rates,up to £275,000 per business over a 5-year period.
• Simplified local authority planning for automatic permission for certain development (suchas new industrial buildings or changing how existing buildings are used) within specifiedareas.
• In one of 8 designated Zones within Assisted Areas, 100% enhanced capital allowancesare available for businesses investing in plant and machinery.
• A variety of central Funds make grants and loans available to support local housingdevelopment (Local Infrastructure Fund) and infrastructure projects (Capital Grants Fund).There is no automatic entitlement, as applications have to be made either by the individualenterprise or by the LEP.
• Government support (if necessary involving public funding) to ensure that superfastbroadband is connected throughout the Zone.
The cost of this package is estimated to amount to £259 million. This is made up by the initialestimated cost for 2015/16 of the business rates measure at £80 million,103 and the subsequentextension of the scheme, a further £5 million;104 capital allowances for 2015/16 of £15 million.105
The Local Infrastructure Fund was set at £59 million and the Capital Grants Fund at £100 million.106
Being a creature of EU membership, these rules on Assisted Areas fall away on Brexit.However, the UK would then be faced with implementing a scheme of its own along similarlines. Although the Commission polices EU regional policy to ensure that there is no ‘unfaircompetition’ between member states, it does so with an eye to the WTO. The underlying criteriafor selecting “a” and “c” areas has clearly been inspired by the non-actionable subsidyprovisions originally in force through the SCM Agreement. What Brexit will give to the UK is theability to draft its own bespoke eligibility criteria for regional aid, based on average conditionsin the UK, not across the whole EU, and freedom from having to forfeit part of its scope to utiliseregional policy as part of a pan-EU carve-up.
Map 1 reproduces the official UK Government map of Assisted Areas permitted by the EUregime. For comparison, Map 2 indicates the Areas which would be covered by a UK regional
100 Source: http://enterprisezones.communities.gov.uk/about-enterprise-zones/ (accessed 9/11/16).101 Source: http://www.gov.scot/Topics/Economy/EconomicStrategy/Enterprise-Areas (accessed 9/11/16).102 Source: https://businesswales.gov.wales/enterprisezones/reasons-locate/support-and-incentives (accessed
9/11/16).103 Budget Report 2011, Table 2.1, item 11, page 42.104 Budget Report 2014, Table 2.1, item 19, page 56.105 Budget Report 2012, Table 2.1, item 11, page 50.106 House of Commons Library Briefing Paper 5942 “Enterprise Zones”, 17 March 2016.

civitas.org.uk/research/europe • 27
Map 1. Current UK coverage of Assisted Areas under EU state aid rules
Source: BIS “An Introduction to Assisted Areas” (October 2014).
‘a’ areas
sparsely populated ‘c’ areas
other ‘c’ areas
UK 2014-2020 Regional Aid Map

civitas.org.uk/research/europe • 28
Map 2. Likely UK coverage of Assisted Areas under WTO rules
Source: see the Technical Note in Appendix III
Area I - income test only
Area II - unemployment test only
Area III - both tests
Likely UK Assisted Areas underWTO rules

policy based on the original criteria in the SCM Agreement: (i) income per capita not exceeding85% of the national average; and (ii) an unemployment rate exceeding 110% of the nationalaverage. These are measured as far as possible at an actual local authority level, not theimposed groupings used by the NUTS system. The supporting data is given in Table B5 inAppendix II for the income test and in Table B6 for the unemployment test. Table B7 summarisesthe results depicted in Map 2 by local authority. 107
Regional aid is a devolved matter and the construction of a new UK-wide approach woulddoubtless require considerable negotiation between the various authorities. For the purposes ofthis paper it is assumed that a consistent policy would be applied across the nations and regions:
Area I: a local authority satisfying the income test only;Area II: a local authority satisfying the unemployment test only;Area III: a local authority satisfying both tests.
Using these two tests to derive three Areas would amount to a very basic and rudimentary regionalpolicy. Other neutral and objective tests could be used, such as the low population density andgeographical isolation criteria in the existing EU rules, to extend the coverage for different purposes.Further tests for factors such as educational attainment could be used to create tiers within theAreas to denote qualification for greater levels of support. The two tests discussed in this paperare for illustration only, as an indication of the flexibility which arises on Brexit.
Table 6 gives the potential population coverage of the new areas. The total coverage, 64.85%,is significantly wider than the 27.05% maximum permitted under current EU-controlled policy.
civitas.org.uk/research/europe • 29
107 The methodology for the compilation of Map 2 is explained at length in the Technical Note in Appendix III.
Table 6: UK UK population coverage of potential New Assisted Areas
Population Area I Area II Area III Coverage
United Kingdom 65,110,034 17,138,692 26.3% 8,945,826 13.7% 16,136,280 24.8% 42,220,798 64.8%
of which
England 54,786,327 13,903,621 25.4% 7,515,827 13.7% 12,120,954 22.1% 33,540,402 61.2%
of which
North East 2,624,621 517,757 19.7% 105,389 4.0% 2,001,475 76.3% 2,624,621 100.0%
North West 7,173,835 1,753,268 24.4% 1,254,486 17.5% 2,364,860 33.0% 5,372,614 74.9%
Yorkshire & the Humber 5,390,576 1,149,228 21.3% 881,962 16.4% 2,658,155 49.3% 4,689,345 87.0%
East Midlands 4,677,038 2,178,085 46.6% 573,152 12.3% 820,854 17.6% 3,572,091 76.4%
West Midlands 5,751,000 1,863,493 32.4% 1,174,094 20.4% 1,495,209 26.0% 4,532,796 78.8%
East 6,076,451 1,562,191 25.7% 845,499 13.9% 408,048 6.7% 2,815,738 46.3%
London 8,673,713 1,198,691 13.8% 2,443,223 28.2% 1,044,745 12.0% 4,686,659 54.0%
South East 8,947,913 948,305 10.6% 110,864 1.2% 887,253 9.9% 1,946,422 21.8%
South West 5,471,180 2,732,603 49.9% 127,158 2.3% 440,355 8.0% 3,300,116 60.3%
Wales 3,099,086 1,154,191 37.2% 484,752 15.6% 1,169,422 37.7% 2,808,365 90.6%
Scotland 5,373,000 2,080,880 38.7% 606,340 11.3% 1,333,190 24.8% 4,020,410 74.8%
Northern Ireland 1,851,621 338,907 18.3% 1512714 81.7% 1,851,621 100.0%
Source: Mid-2015 population estimates. For Great Britain: ONS dataset MYEDE. For Northern Ireland: data downloadedfrom NINIS website (accessed 17/11/16)

This presupposes, however, that any of the industries we were concerned to help would benefitfrom any assistance directed at these particular localities. The ONS produces data on ‘locationquotients’ for local authorities, which are a measure of the relative concentration of eachindustry. The industry with the largest quotient could be seen as a business in which that districtspecialises (which is not necessarily the same as the largest employer108) and it would certainlyprovide a convenient identifier for areas where that industry would disproportionately benefitfrom assistance.
Tables B8, B9 and B10 in Appendix II list the industries with the highest location quotients foreach of the authorities in Areas I, II and III respectively. Table 7 below summarises the resultsby industry category, supplemented by ONS data about the industries in each authority whichhave the second and third highest quotients.
civitas.org.uk/research/europe • 30
The three highest-quotient industries in an area can be considered to be the most influential.109
It is therefore significant that over two-thirds of these authorities specialise in industries which,to limited or greater degree, will be affected by EU tariffs. If funding were spread evenly acrossall three Areas, then Table 7 would support the belief that over half of the resources wouldassist industries where EU tariffs have the greatest impact (the agricultural and seriously-affected categories). It is particularly interesting that those sectors are weighted more heavilytowards Area III, the most ‘deprived’ regions where assistance is most justifiable objectively.Policy-makers could be confident that ‘leakage’ could be controlled. Their role, essentially, isto set the budget.
Table 7: Distribution of industries across the potential New Assisted Areas
Area I Area II Area III Total
Number of authorities 121 31 86 238First ranking to: Agricultural products 15 2 4 21 Seriously-affected non-agricultural 30 4 32 66 Middle products 25 4 12 41 De minimis products 18 3 14 35 Excluded services 33 18 24 75
Agricultural products in Top 2 ranking 26 4 5 35Agricultural products in Top 3 ranking 37 5 7 49
Seriously-affected in Top 2 ranking 44 8 41 93Seriously-affected in Top 3 ranking 59 9 48 116
Top 3 ranking are all Excluded services 12 10 5 27
Source: Tables B8-B10, Appendix II, supplemented by original source data from ONS location quotients for each localauthority, derived from Business Register and Employment Survey, 2011. See the Technical Note in Appendix III.
108 See the Technical Note in Appendix III.109 The ONS source data indicates that once the fourth-ranking industry in an area is reached, on the whole its
degree of concentration does not materially differ from the national average, i.e. there is no particular localspecialisation in that industry.
It would still be possible to create a high degree of leakage depending on the means throughwhich assistance is delivered. For example, suppose that the current Enterprise Zone strategyof discounting business rates were to be applied to the whole of Area III. Apart from beingextremely expensive, in a context where less than 11% of UK businesses are engaged inexport, the overwhelming majority of benefit will be passed to enterprises who are not directlyaffected by EU-27 tariffs at all. Such a policy could not be justified by the need to deal withpost-Brexit costs alone.
But there is no reason why regional policy should take such a broad-brush form. All that isrequired is objective national criteria for selecting the areas to receive assistance (such asthose discussed in this paper), with perhaps some additional metrics to justify why someareas should receive higher funding than others. Once this framework has been set,assistance can be delivered on a discretionary basis, via grants or loans as appropriate, inresponse to applications and perceived need. If, say, this were devolved to a body such as aLocal Enterprise Partnership, with a remit to assist businesses within its area, and it so happened that those businesses were ones which were disproportionately affected by EU-27 tariffs, who is in a position to quibble? Having ensured that there is no automaticentitlement for exporters to benefit under the scheme, the only constraint is to ensure that in practice ‘discretion’ is not exercised in such a way that it amounts to a de factoexport subsidy.110
In practice, then, there will be ‘leakage’, if only as the price to be paid to ensure that thescheme does not breach the WTO rules. For the purposes of this paper a planning assumptionas to the level of this leakage has to be made. Table 7 indicates that in 75 out of 238 localauthorities eligible for post-Brexit regional aid (31.5%), the dominant local industry is an‘Excluded service’ which would not be subject to EU-27 tariffs. Although it somewhat twiststhe data, this provides a crude rule of thumb for the following assumptions in costing thataspect of the overall mitigation programme to be delivered through regional aid:
• In Area I, a leakage of 27.3% (33/121), i.e. it will be assumed that to deliver £1.00 of‘compensation’ benefit it will require £1.38 of funding;
• In Area II, a leakage of 58.1% (18/31), i.e. it will be assumed that to deliver £1.00 of‘compensation’ benefit it will require £2.04 of funding – which reflects the fact that AreaII authorities tend to be service-dominated urban areas with high unemployment;
• In Area III, a leakage of 27.9% (24/86), i.e. it will be assumed that to deliver £1.00 of‘compensation’ benefit it will require £1.39 of funding;
• If funds were deployed proportionately across all Areas, the average leakage rate wouldbe in the region of 31.5%, i.e. to deliver £1.00 of ‘compensation’ benefit it will require£1.46 of funding.
Assistance to ‘agricultural products’ could however be regarded as having zero leakage asthis would be covered by the less-stringent terms of the WTO Agriculture Agreement.
civitas.org.uk/research/europe • 31
110 The numerous judgments in the interminable US/EU dispute over support for either Boeing or Airbus shouldbe required reading for Ministers and their advisers.

Some commentators would consider this to be an unacceptably high level of leakage. If theprogramme is seen purely as a benefit scheme for less than 11% of UK business, that criticismhas some force. But this discussion has established two points:
• It is quite feasible to use regional aid to mitigate the costs of EU tariffs post-Brexit –provided the degree of ‘leakage’ involved is considered acceptable; and
• Post-Brexit, the UK’s scope for implementing regional aid has expanded far more than isthe case within the constraints of EU rules on state aid – assuming that regional aid issomething which you want to deliver in the first place.
A rather significant point risks being overlooked in the discussion over Brexit. If, as Table 6suggests, nearly two-thirds of the UK population live in areas which on objective and neutralcriteria can be regarded as ‘disadvantaged’, then perhaps that ought to be more of animmediate priority for government than the comparatively niche issue of tariffs on exports tothe EU-27?
The natural conclusion is that regional aid is not something which should be designed withthe objective of mitigating the effect of EU tariffs. Rather, a comprehensive scheme should bedesigned within a coherent industrial strategy, one of whose incidental benefits is the mitigationof the consequences of Brexit.
Scope for mitigation through energy policy
Compensation for the adaption costs of pollution reduction measures was one of the nowabolished categories of non-actionable subsidy,111 albeit limited to one-off measures andsubject to strict cost limits. Governments are still able to offer environmental ‘compensation’,provided that any scheme is non-specific.
In the modern era this is largely a matter of energy policy. This is currently controlled by theEU,112 the legal authority for which is originally derived from the Single European Act toimplement the single market. The cornerstone is the EU Emissions Trading System (ETS),which is regarded as an element of climate change policy.113 The ETS has evolved since 2005and it now covers around 11,000 power stations and industrial plants in the EU-28, Iceland,Liechtenstein and Norway, together with airlines flying between these countries and perhapsfurther afield from 2017.
The key features of Phase III, covering the period 2013-2020, are:
• There is a single ETS-wide cap on emissions, which is set to fall over time.
civitas.org.uk/research/europe • 32
111 SCM Agreement 1994, Article 8.2(c).112 The EU Commission’s own publication, “EU ETS Handbook” (available at https://ec.europa.eu/clima/
publications/docs/ets_handbook_en.pdf, accessed 19/11/16), makes it quite clear that, as an environmentalmatter, energy policy is not set by Member States. See page 9 of the handbook.
113 The legal authority is set out in Directive 2003/87/EC of the European Parliament and of the Council of 13October 2003, as amended by Directive 2004/101/EC, Directive 2008/101/EC, Regulation (EC) No 219/2009,the Treaty of Accession of Croatia (2012), Directive 2009/29/EC, Decision No 1359/2013/EU, Regulation (EU)No 421/2014 and with typographical errors in the text corrected by Corrigendum OJ L 140, 14/5/2014, page177.

• This covers CO2 emission114 by fuel combustion above 20MW thermal input (i.e. powerstations, but excluding municipal and hazardous waste incineration); oil refining; theproduction of coke, metal ore, pig iron and steel, ferrous metals and alloys, aluminium,non-ferrous metals and alloys, cement, lime, dolomite, glass and glass fibre, ceramics,mineral wool insulation material, gypsum and plasterboard, wood pulp, paper, cardboard,nitric acid, adipic acid115, glyoxal116 and glyoxylic acid,117 ammonia, bulk organic chemicals, hydrogen, soda ash (in each case, above qualifying size thresholds); thecapture, transport and storage of greenhouse gases; and aviation (subject to a widerange of exemptions118).
• It also covers NO2 emission in the production of nitric acid, adipic acid, glyoxal andglyoxylic acid, and of perfluorocarbons in the production of primary aluminium.119
• Inclusion in the scheme is mandatory, although Member States are allowed to exclude‘small installations’ (i.e. hospitals and also plants with a track record of emitting less than25,000 tonnes of CO2 or equivalent per annum for at least three years) provided theycan demonstrate that the installation is subject to “measures that will achieve anequivalent contribution to emission reductions”.120 Judging by their website, the EUCommission primarily envisages these measures as being fiscal in nature.121
• Businesses caught by the EU-ETS are required to report their annual emissions and tothe extent this exceeds the amount of allowances held by them, they are subject to afine. Unused allowances may however be traded with other businesses or carried forwardto a later year.
• Some allowances are made available by free allocation, using a formula which variesaccording to the specific sector and its energy-efficiency, and which is meant to taper outover time. Power stations no longer receive free allocations, whereas manufacturers areset to have their free allocation capped at 30% by 2020, and aviators at 82%. There arespecial rules for ‘new entrants’, i.e. installations entering the EU-ETS for the first time orundergoing significant capacity changes.
civitas.org.uk/research/europe • 33
114 Directive 2003/87/EC (as amended), Annex I.115 (CH2)4(COOH)2. Used mainly in the production of nylon and polyurethane, but also as a coating for tablets to
ensure delayed release of drugs in the stomach and as a food flavouring. So industries using those productsenjoy costs from the EU-ETS passed on by their suppliers.
116 OCHCHO. Used for coating paper and textiles. So those industries enjoy costs from the EU-ETS passed onby their suppliers.
117 OCHCO2H. Used in the production of cosmetics, agro-chemicals and pharmaceuticals. So those industriesenjoy costs from the EU-ETS passed on by their suppliers.
118 Excluded are: flights for official, military, customs, police, search and rescue and humanitarian purposes;within the visual flight rules in Annex 2 of the Chicago Convention on International Civil Aviation; where theplane returns to the aerodrome it started from without landing anywhere else first; training flights; scientificresearch and prototype testing; low-weight aircraft; public service flights to Guadeloupe, French Guiana,Martinique, Réunion, Saint-Barthélemy, Saint-Martin, the Azores, Madeira and the Canary Islands or whereannual capacity is below 30,000 seats; and low-volume, low-emission flights, with different thresholds forcommercial and non-commercial operations.
119 Directive 2003/87/EC (as amended), Annex I.120 Directive 2003/87/EC (as amended), Article 27.121 See “Sectors and gases covered” in the on-line summary of the ETS, available at < https://ec.europa.eu/
clima/policies/ets/index_en.htm> (accessed 19/11/16).

• For the main part, businesses are supposed to acquire allowances either by bidding forthem in an auction process, buying surplus capacity from other businesses or (in limitedcircumstances) purchasing them through international carbon off-setting schemes.
• Member states retain the proceeds of auctions, subject to a percentage which is allocatedto a New Entrants Reserve used to fund development of carbon capture and storagetechniques and the deployment of renewable energy technology. In typical EU fashion,the Directive declares that “Member States shall determine the use of revenuesgenerated from the auctioning of allowances” and in the next sentence instructs them touse 50% of the proceeds on nine environmental objectives.122
• There are extensive measures to police and prevent ‘carbon leakage’, i.e. the offshoringof production to territories outside the remit of the scheme.
The underlying ‘cap and trade’ philosophy is fairly clear: to use a market-style mechanism toprice inefficient energy-usage out of business and indirectly promote ‘clean’ technology andprocesses. The implementation has been criticised, not least for being designed by peoplewho do not understand how markets actually work.123 The allocation systems for allowancesseem to have led to a highly volatile EU ‘carbon price’. As will be seen later in Part III, energy-intensive industries are among those most seriously affected by tariffs and they havecomplaints about the costs imposed on them by the scheme as it is presently operated. TheEU-ETS has achieved the worst of all possible worlds: imposed costs are high enough toalienate business; the carbon price is not consistently high enough to satisfy environmentalists;and there has not been the long-term stability (here used as a euphemism for ‘subsidy’) tosupport the development of alternative technologies.
This is not the place to redesign the EU-ETS. Post-Brexit, the UK would be in principle outsidethe scheme, although any trade treaty governing continued access to the single market wouldalmost certainly require British re-inclusion. The absence of any such treaty would notnecessarily mean the end of emissions trading in the UK. There might be perfectly soundarguments for voluntarily staying within the EU-ETS. Alternatively, as the UK will almostcertainly end up doing in the field of agricultural support, we could launch a ‘Son of ETS’. Afterall, in 2002 the UK launched the world’s first national multi-sector emissions trading scheme,which was only folded into the EU-ETS in 2007.124 There would be nothing to prevent a fully-sovereign UK returning to its own local emissions scheme, as many countries now do. Brexitcould be seen as offering an opportunity to solve the flaws in the current EU model.
Not an insignificant factor is the £500 million which the UK Government currently receivesfrom the sale of emissions allowances.125 Concern for the future of the planet will doubtlessforce HM Treasury to ensure that this revenue stream continues after we have left the EU.
civitas.org.uk/research/europe • 34
122 Directive 2003/87/EC (as amended), Article 10.3.123 See for example, among an extensive literature, Sinclair “Let Them Eat Carbon” (Biteback, 2011). Although
that book discusses an earlier iteration of the EU-ETS, the author’s criticisms of the structural economics ofthe scheme retain their force.
124 A fact which is somehow omitted from the official history in the EU ETS Handbook. Slightly earlier, anotherpilot scheme was launched in Denmark, but it only covered electricity generation.
125 Source: OBR November 2016 Economic and Fiscal Outlook, Table 4.6 Current Receipts, outturn receipts for2015/16. Using current futures markets prices, receipts are projected to taper off to £300 million by 2021/22.As the OBR explain “In the absence of clear statements of Government policy in this area, we continue toinclude EU-ETS revenue in our fiscal forecast.” (para 4.86, page 133).

Therefore, it would be unwise to assume that Brexit will lead to the elimination of costs imposedthrough participation in the EU-ETS. But there is one area which is open to discussion: CarbonPrice Support (CPS).
This acts as an adjunct to the Climate Change Levy (CCL), which since 2001 has beencharged, with some exemptions, on supplies of electricity, gas, liquid petroleum gas, solidfossil fuels, including from nuclear and (since 2015) renewable energy sources. With effectfrom 2013, a further levy, the CPS, is charged on supplies of gas, liquid petroleum gas andsolid fossil fuels if they are intended to be used for producing electricity, again with exemptions.
The avowed purpose of this is to inflate the price of electricity in the UK because the EU-ETSwas not doing so by itself. As George Osborne explained when announcing the measure inthe 2011 Budget: “First, as I have long argued, investment in green energy will never be certainunless we bring some stability to the price of carbon. Today we become the first country in theworld to introduce a carbon price floor for the power sector... That will provide the incentivefor billions of pounds of new investment in our dilapidated energy infrastructure.”126
Whether the measure has achieved this objective, and whether this was the best means ofdoing so anyway, are beside the point. The justification for the CPS levy is the need toencourage investment in ‘green energy’ because of deficiencies in the EU-ETS setting of acarbon price. Post-Brexit, the UK will have the freedom of action to either design a ‘Son ofETS’ without such flaws or to encourage investment without the fetters of the EU rules on state aid.
Even if the UK is still inside the EU-ETS in some form after Brexit, since the CPS wasimplemented unilaterally, it can be revisited unilaterally. Rigging the electricity market at anartificially high price is a very bad way to encourage investment in green technology. Allconsumers bear the cost. Industrial users have higher input costs, making their end-productsless competitive in world markets. Domestic customers suffer what amounts to a regressivetax, disproportionately hitting the lowest-income households. Developers of green energy donot receive a penny directly, and their long-term investment plans still have hanging over themthe threat that one day this ‘temporary’ measure will be reversed should it become politicallyexpedient to do so (such as the circumstances envisioned in this paper).
Table B11 in Appendix II analyses the usage of electricity produced in the UK during 2015.Table 8 below summaries the results by broad category.127
UK industry spent £6,825 million on electricity in 2015, domestic consumers £16,725 millionand other final users (which for these purposes includes farming) a total of £10,865 million.128
The CPS raised £1.2 billion for HM Treasury in 2015/16.129 Over the near term, CPS broadlydoubles the receipts expected from CCL.130 In the 2016 Autumn Statement, the Chancellorconfirmed his intention to retain the measure until 2020, describing capping it in real terms as
civitas.org.uk/research/europe • 35
126 Hansard House of Commons Debates, 23 March 2011, col. 951 at cols. 289-290.127 See the Technical Note in Appendix III.128 Source: BEIS “Digest of UK Energy Statistics”, Table 1.1.6, released 28 July 2016.129 Source: OBR Economic and Fiscal Outlook March 2016, Fiscal Supplementary Tables, Table 2.13.130 Source: OBR Economic and Fiscal Outlook November 2016, Fiscal Supplementary Tables, Table 2.13. Over
the period 2016/17 to 2018/19, receipt from CPS and ‘core CCL’ are equal, with CCL proceeds increasing inimportance after 2019/20 as CPS is fixed in real terms and so fails to keep up.

one of “the commitments we have made to the oil and gas sector”131 which have to be kept –a somewhat disingenuous way of viewing the matter. Even though the CPS is a self-inflictedwound by the UK, a reduction in rates would have to be non-specific. It is a reasonableplanning assumption that any cut in CPS revenues would be shared in the proportions givenin Table 8. CPS is charged at differential rates for each type of commodity on which it is levied,but since the Treasury were able to set those rates with the intention of forcing a specificminimum carbon price for electricity, it should be mechanically possible for them to reversethe process in order to set a lower floor price.
That implies a leakage rate of 69.4%, which makes a reduction in the carbon price anextremely inefficient way of ‘compensating’ businesses for EU tariffs, even if it is the sectorsmost likely to be affected by those tariffs who are calling most loudly for a reduction in thecarbon floor. Conversely, a cut in CPS would be a means of sharing the proceeds of Brexitamong the consumers who would be ultimately funding the new tariffs.
They do things differently in Germany. The Renewable Energy Sources Act 2000 (Erneuerbare-Energien-Gesetz or ‘EEG’), building on and extending the Electricity Feed-In Act 1991,prioritised the use of renewable energy by guaranteeing their generators long-term purchasingcontracts at generous prices with the distribution networks. This was funded by a surchargelevied by the networks on other electricity generators, which in turn was passed on to theircustomers. The law has been revised and amended many times,132 chiefly to tweak mechanicalproblems in its operation, and unintended consequences around the explosion of the domesticsolar energy sector, but in 2003 a significant refinement was introduced through the ‘specialequalisation scheme’ (Besondere Ausgleichsregelung). This entitled ‘energy-intensiveindustries’, which by an interesting coincidence turned out to be key German manufacturers(and after 2004, railways), to claim an automatic rebate on their surcharge.
Throughout all the amendments and re-workings of the EEG scheme, this feature hasremained intact. How, you might ask, has the German government managed to get away withsuch a blatant subsidisation of its exporters by domestic consumers?
Table 8: Usage of UK electricity supplied by industry, 2015
Industry Usage (GWh) Share
TOTAL 330,905.0 of which Agricultural products 14,816.7 4.5% Seriously-affected non-agricultural products 33,552.1 10.1% Middle products 41,292.2 12.5% De minimis products 11,740.7 3.5% Excluded services 121,345.9 36.7% Domestic users 108,157.3 32.7%
Source: BEIS “Digest of UK Energy Statistics”, Table 5.1, released 28 July 2016.
131 Hansard House of Commons Debates, 23 November 2016, Vol. 617, col. 899 at cols. 906-907.132 In 2003, 2004, 2009, 2010, 2011, 2012, 2013, 2014 and a forthcoming amendment will be enacted in 2017.
civitas.org.uk/research/europe • 36

Because they also do things more cleverly in Germany. The special equalisation schemeinvolves not a penny of public money. There is authority of an ECJ judgment133 (and who couldquibble with that?) that a law which obliges a private sector distribution network to purchaseelectricity from one private sector energy supplier, and to pay for it by levying surcharges onother private sector energy suppliers, is not a ‘public subsidy’ for the purposes of EU state aid.Funds do not pass through the government account. Hence, mandating a rebate on thatsurcharge is not a subsidy, either. And for the same reasons, on this aspect at least, the EEGalso falls outside the definition of ‘subsidy’ in the SCM Agreement. The EU Commission maynot like the special equalisation scheme, and from time to time it nudges the Germangovernment to tweak the EEG scheme in a less generous direction, but it has never dared totake them on directly.
You might next ask, why doesn’t the UK have its own version of the EEG scheme? It’s a goodquestion. A cynic could even be tempted to speculate that George Osborne was more interestedin getting his hands on the CPS revenue than in helping the renewable energy industry. At leastthe German system has ensured that money has gone to develop and sustain a pet industrialsector, to the extent they are now having to cope with the problems of success. It should beclear from this broad-brush outline, however, that a UK EEG would entail a significant overhaulof the UK energy industry and markets. That is not something which should be done lightly, orfor the narrow purposes of compensating a few sectors for the costs of Brexit.
Once again we reach the conclusion that there is indeed a wide scope to mitigate the tariffcosts of Brexit, but that the more appropriate response is to first devise a comprehensiveindustrial strategy for the whole of UK business.
Scope for mitigation through other non-specific measures
Infrastructure spending
There is now an established cross-party consensus that government intervention is neededto improve our nation’s (or, if you prefer, our nations’) infrastructure. This consensus is so deepand solid, it is something of a mystery as to how that infrastructure became so dilapidated inthe first place.
A case can be made for public support for any specific project. Compelling evidence can becompiled as to how ‘everyone’ in any given area will benefit from it. From the perspective ofthe WTO regime, infrastructure spending has the great merit of not being ‘specific’, in thesense that an identifiable business or industry will benefit to the exclusion of any other.134
It is the perfect example of a horizontal, non-specific programme where ‘everyone’ benefits.
But for precisely these reasons, infrastructure spending is too imprecise as a mechanism forBrexit ‘compensation’. The Autumn Statement 2016 unveiled a number of infrastructureschemes which will be supported over the medium term. These were justified as measures to improve the overall productivity of the domestic economy,135 which they may well do.
civitas.org.uk/research/europe • 37
133 PreussenElektra AG v Schleswag AG, Case C-379/98, 13 March 2001. The case actually involved a Germanenergy company challenging the predecessor 1991 statute, but the same principle applies to the current law.
134 Presumably if any business or industry would so benefit, they would have paid for the project with their ownmoney by now.

That, however, is a distinct issue to ‘compensation’ for exporters and should be treatedseparately as such.
A new UK definition of SME
Politicians are always keen to offer help to ‘small businessmen’. The UK already provides awide range of support for ‘small businesses’. A total of 533 schemes are available to helplaunch and sustain a new enterprise in one region or nation of the UK.136
As we have seen in considering R&D, ‘small business’ ultimately derives from EU legislation– and there is no consistent single definition. With Brexit, that falls away, and the UK hasregained the ability to set its own regulations. In the event of a UK-EU trade treaty, in particularone which permitted some form of access to the Single Market, that freedom would probablybe curtailed. The premise of this paper, however, is that no such deal is reached.
An example of the flexibility that becomes available can be seen in the US. The Small BusinessAct of 1953 authorised assistance to enterprises which are independently owned and operatedand which are not dominant in their field of operation, meeting criteria for size in regulationsissued by the Small Business Administration (SBA). The SBA has used its remit to, more orless, specify different size criteria for each of the US equivalent of SIC coded activities, whichcan be remarkably lenient in terms of turnover and workforce. Hence, an aircraft manufactureronly ceases to be small when it exceeds 1,500 employees, or a family clothing store when itexceeds a turnover of $38.5 million, and a bank is not ‘big’ until it has more than $550 millionin assets.137
A similar exercise should be undertaken in the UK post-Brexit. But more important than the‘who’ is the ‘what’: how is assistance to be delivered? The answer is, pretty much the sameas at present, a variety of grants, loans and helplines, except to a wider range of eligibleenterprises and with slightly more money on offer.
A new definition, or series of definitions, would play a part in, for example, regional policy byscoping the enterprises which were eligible for assistance in any particular Area, but by itselfthis measure is unlikely to achieve much. If there exists an onerous regulation from whosecost British businesses could be exempted by widening the definition of SME, the correctremedy in a post-Brexit environment is to review whether the regulation in question is stillnecessary. That is an across-the-board exercise outside the scope of this paper.
A Transitional Assistance Programme (TAP)
The WTO regime provides that where, on investigation of a complaint, it is found that thesubsidy does not exceed the de minimis level of 1% of the value of the exports, countervailingaction by other governments must stop. This creates scope for small-value direct paymentsas ‘compensation’ for exporters.
civitas.org.uk/research/europe • 38
135 Autumn Statement 2016, Chapter 3, pages 25-34.136 See “Finance and support for your business” at < https://www.gov.uk/business-finance-support-finder
/search > (accessed 19/11/16).137 The full list may be consulted at the Federal Code of Federal Regulations: < http://www.ecfr.gov/cgi-
bin/retrieveECFR?gp=&SID=7780ee089107f59ef3f78b938e2282b7&r=PART&n=13y1.0.1.1.17#se13.1.121_1201 > (accessed 19/11/16).

Merely because an exporter could be compensated at less than 1% of the value of their salesdoes not give the government a completely free hand. A programme which, say, permittedeach business to reclaim costs up to the lower of actual tariffs suffered and 1% of export saleswould be directly-linked to export performance. It would therefore count as a prohibitedsubsidy, on which there is no de minimis level.
But it would be possible to establish a Transitional Assistance Programme (TAP), limited forsay five years (to minimise the room for foreign objections). The remit of the TAP would be tomake discretionary grants to any UK business, to assist them with the transition costs of Brexitif they could justify their case against published criteria. This would not be specifically limitedto exporters, although they would obviously have an easier time of demonstrating that theyhad suffered one-off costs. As with regional policy, there would be no de jure specificity andcare would have to be taken in operation, but this would be a mechanism for handling anybusiness on a case-by-case basis that did not come within the new SME definition or whichbenefited from any of the other mitigation schemes.
In theory, then, the TAP could be designed to have a leakage rate of 0%, with discretion beingused to award funding solely to ‘compensation’ cases. It would be more prudent, however, tomake the planning assumption of a 20% leakage rate, i.e. that £1.25 has to be spent in orderto deliver £1 to businesses suffering EU-27 tariffs.
civitas.org.uk/research/europe • 39

Part Three: Application of the Solution
This part of the paper reviews the individual categories of exported product and discussesparticular issues which arise in delivering ‘compensation’ to each of them.
Mitigation measures for ‘agricultural products’ under WTO rules
Table 9 summarises the estimated tariff position under the WTO-only basis for EU-27 exportersto the UK of ‘agricultural products’ and the corresponding position for UK exporters to the EU-27.
Table 9: Estimate of annual tariffs payable on UK-EU agricultural products (2015, £ millions)
EU GOODS UK GOODS Average Tariffs Average Product UK Tariffs Tariff EU Payable Tariff Description Imports Payable Rate Imports Estimate Rate
Source: data derived from Protts “Potential post-Brexit tariff costs for EU-UK trade” (Civitas, October 2016).
civitas.org.uk/research/europe • 40
Live animals 427 23 5.5% 286 6 2.2%Meat 3,163 1,023 32.3% 999 378 37.8%Dairy produce (including Eggs) 2,394 956 39.9% 840 331 39.4%Products of animal origin 68 0 0.4% 82 0 0.2%Live trees and other plants 932 70 7.5% 46 3 6.9%Edible vegetables 2,154 326 15.1% 204 24 11.8%Edible fruit and nuts 1,660 168 10.1% 200 15 7.5%Coffee, tea, maté and spices 396 22 5.6% 191 9 4.7%Cereals 599 79 13.1% 322 77 23.9%Products of milling (e.g Flour) 253 64 25.2% 124 32 25.5%Oil seeds, straw and fodder 318 10 3.3% 217 2 1.1%Vegetable saps and extracts 68 3 4.6% 32 0 1.4%Other vegetable products 4 - 0.0% 3 - 0.0%Animal or vegetable fats and oils 820 122 14.8% 316 28 8.8%Preparations of meat or fish 1,771 563 31.8% 386 154 39.9%Sugars and sugar confectionery 719 217 30.2% 310 98 31.6%Cocoa and cocoa preparations 1,440 16 1.1% 468 6 1.3%Preparations of cereals, flour, starch or milk; pastrycooks’ products 2,554 303 11.9% 953 121 12.7%Preparations of vegetables, fruit, nuts or other parts of plants 1,893 372 19.7% 352 62 17.7%Miscellaneous edible preparations 2,140 192 9.0% 889 79 8.9%Beverages, spirits and vinegar 4,159 240 5.8% 2,148 60 2.8%Residues and waste from the food industries 1,160 214 18.4% 539 123 22.8%Tobacco and manufactured tobacco substitutes 333 132 39.5% 208 91 43.7%Albuminoidal substances; modified starches; glues; enzymes 451 35 7.8% 221 16 7.2%
TOTAL 29,875 5,147 17.2% 10,336 1,716 16.6%

This category of goods accounts for about 9% of the UK’s exports to the EU-27 in 2015 butwould have suffered 33% of the total tariff costs potentially payable under the WTO-only basis.That is a good illustration of how, despite two decades of the WTO, agriculture is still heavilyaffected by ‘un-free’ trade. It can be seen that of the 24 business sectors covered, in 23(highlighted red) the UK are ‘winners’ (i.e. EU-27 exporters incur higher aggregate tariff costs).But there are still 15 sectors in which UK producers face a higher effective tariff than their EU-27 counterparts. British businesses are only ‘winners’ in the tariff sense because their EUcompetitors are better exporters.
The first step for policy-makers is to negotiate a new Total AMS Commitment for the UK. Thereis no prescribed method for doing this, and it can be expected that the method will itselfbecome a negotiating issue. Since WTO membership has been exercised through the EU, thefigures for allowances are all stated (and calculated) in euros. What is unclear is the sterlingequivalent which would apply, since the calculation of the actual exchange rate for theconversion would doubtless be another matter for negotiation in its own right. Until that isdecided there is little point in converting the allowance figures into sterling.
Two viable methods of assessment would be:
• Apportion the original EU-12 Total AMS Commitment
The original EU-12 threshold negotiated in 1994 was set to fall to €61.2 billion in 2000 andremain at that level. This sum could be apportioned between the 12 constituent countriesaccording to an average of their recent agricultural production. Table 10 indicates that the UKhas a fairly consistent share of the total:
civitas.org.uk/research/europe • 41
Table 10: EU-12 agricultural production at producer prices (EUR million)
Year 2011 2012 2013 2014 2015 Average
EU-12 314,064 326,714 334,467 330,145 324,184 325,915 UK 27,007 29,539 30,293 31,678 29,143 29,532 UK share 8.6% 9.0% 9.1% 9.6% 9.0% 9.1%
Source: Eurostat database “Output of the agricultural industry - basic and producer prices”. 2015 figures are estimates.
That would suggest a UK Total AMS Commitment of €5.5 billion.
• Ab initio calculation for the UK
A UK Commitment could be calculated as if the country had been an independent signatoryto the Agriculture Agreement from the outset. This would be a complex exercise beyond thescope of this paper, involving assessing the differences between local and prevailing worldprices, and UK market consumption, of every single agricultural product in 1986-88 to assesswhat the standalone UK AMS would have been. Again there is scope for argument as to whichcurrency should be used for measurement.
Table 11 uses the UK share of total CAP spending as a crude proxy.

This method suggests a UK Total AMS Commitment of €4.6 billion.
These are very ball-park estimates. The answers suggested by these two calculation methodsprobably represent the two extremes of the UK/EU-27 negotiating spectrum. A final figure nearthe mid-point, in the region of €5 billion, is not unreasonable to take as a working assumption.
Post-Brexit, the UK will be faced with implementing a British-CAP as well. As Table 12 shows,UK receipts are in the region of £3 billion.
Table 11: UK deemed AMS (ECU million)
Year 1986 1987 1988 Total Total CAP spending 22,840.6 23,811.4 27,525.0 74,177.0 UK CAP receipts 2,062.1 1,828.1 1,929.5 5,819.7 UK share 9.0% 7.7% 7.0% 7.8%EU-12 Commitment 73,530.0 UK Total AMS 5,768.9 20% reduction to 2000 ceiling 4,615.2
‘CAP spending’ measured as the reported expenditure under the European Agricultural Guarantee and Guidance Fund(EAGGF). Source: Annex 4 to the EU Budget 2008 Financial Report, pages 96-97.
Table 13: WTO status of EU agricultural support
Marketing Year 2009-10 2010-11 2011-12 2012-13
EU Total AMS Commitment, € million 72,244.0 72,244.0 72,244.0 72,379.0
Amber Box measures, € million: Gross 12,285.2 7,894.8 7,861.7 7,679.6 Less: disregard of de minimis items - 1,402.0 - 1,393.0 - 1,002.8 - 1,780.5 Blue Box measures, € million: 5,323.6 3,141.8 2,981.1 2,754.2 Green Box measures, € million: 63,798.1 68,051.5 70,976.8 71,140.0
Total EU Agricultural Spending 80,004.9 77,695.1 80,816.8 79,793.3 Proportion counting as WTO ‘subsidies’ 14.0% 8.0% 8.0% 7.4%
Note: The EU Total AMS Commitment increased for 2012/13 due to the accession of Croatia.
Source: EU Commission notifications to the WTO Agriculture Committee G/AG/N/EU/10/Rev.1 (2009/10), G/AG/N/EU/17(2010/11), G/AG/N/EU/20 (2011/12) and G/AG/N/EU/26 (2012/13)
Table 12: UK agricultural receipts from the EU (£ million)
Year 2012 2013 2014 2015
European Agricultural Guarantee Fund 2,753 2,747 2,595 2,544 European Agricultural Fund for Rural Development 291 619 567 556 Total 3,044 3,366 3,162 3,100
Source: House of Commons Briefing Paper 7602 “EU Referendum: Impact on UK Agriculture Policy” (26 May 2016).
It might be thought that if the government also has to accommodate mitigation measures witha value of at least £1.7 billion, and has a working limit under the WTO rules of only €5 billion,the scope for UK action could become constrained.
civitas.org.uk/research/europe • 42

Table 13 summarises the EU’s total agricultural spending in terms of the WTO subsidy regime forthe four most recent available years. A full analysis can be found in Table B12 in Appendix II.
The EU has followed a deliberate policy of shifting payments under the CAP towards the BlueBox (production-limitation) and Green Box (exempt payments). Gaming the system in this waymeans that the EU uses less than 10% of its WTO Total AMS Commitment, whilst managingto spend in aggregate more than that limit, either in cash or through equivalent supportmechanisms.138 Since the UK participates in the CAP, it is reasonable to suppose that theagricultural subsidies which it receives have the same general profile. At the very least, itshould be easy to scope a UK-CAP which replicates those features.
Thus, if post-Brexit the UK Government inherits a ceiling on agricultural subsidies of the then-sterling equivalent of approximately €5 billion, it should be able to deliver a UK-CAP wortharound £3 billion and expend little more than €500 million of its WTO capacity.139 Armed with£1.7 billion of import duties, Government should experience little constraint in mitigating thecost of tariffs for industries exporting the whole range of agricultural products.
For example, overseas marketing and promotion initiatives would be scored as Green Boxexpenditure and as such not subsidies for WTO purposes at all. These will be exactly themeasures that would be needed to explain why EU-27 consumers should continue to buy Britisheven though the price is now higher, or to assist in finding replacement buyers in third countries.That would greatly assist businesses operating within Chapter 09 (coffee and tea), Chapter 18(chocolate) and Chapter 22 (beer and whisky) – although ministers might not want to choosethis precise route to help those in Chapter 24 (tobacco). Depending on how the UK-CAP wereto be structured, the Blue Box offers considerable scope for retirement schemes as part of awider rationalisation of farming, or existing CAP programmes could be extended.
As discussed in Part II, such measures could be delivered under the regional policy wrapperwith greater targeting and minimal leakage. They should, however, be delivered via Defra inorder to sustain the defence that they are agricultural measures.
If the Government were too overt in exploiting the Amber Box for direct payments to producersthey could expect resistance from other WTO members over the medium to longer term, asthis would mark a breach of the aspiration to lower agricultural subsidies worldwide. Nor shouldwe ignore the danger that any ‘compensation’ offered to UK farmers is likely to provoke ahostile reaction within the EU-27, given the political sensitivity of agriculture.
The basic point remains valid. The current operation of the EU indicates that post-Brexit theUK will be able to manage the transition to unfree trade with the EU for some of the industriesmost disproportionately hit by tariffs.
civitas.org.uk/research/europe • 43
138 Which explains why Lord Mandelson, when EU Trade Commissioner, was able to make the extravagantgesture of offering to surrender 70% of the EU’s Total AMS Commitment as part of the on-going WTOagricultural negotiations. He knew perfectly well that it would make no difference to the support available toEU producers. So, unfortunately, did his negotiating counterparts.
139 There is not a simple read-across to say that £3 billion of CAP-style payments would translate to only £300million of AMS Commitment because that overlooks the monetary value of any market intervention measureswhich the UK would inherit or introduce on Brexit, and cash payments within the £3 billion receipts are likelyto be skewed more towards the Amber Box. But UK farmers and producers clearly currently enjoy the benefitof programmes which are scored within the Blue Box (production-limitation) and Green Box (exempt), so notall of the £3 billion will count towards the new UK Total AMS Commitment.

Table 14 summarises the expected compensation costs for this category of product. Becauseof the non-discretionary nature of the CPS and R&D measures, some of the industries wouldmake a slight overall net gain. A full analysis for all industries is found in Table B13. The costingapproach is explained later in Part IV.
civitas.org.uk/research/europe • 44
Table 14: Impact of mitigation for agricultural products (£ million)
Tariff costs Tariff revenues
1,715.60 5,147.32CPS abolition 50.34 Increase in general R&D credit 48.48 Enhanced R&D credit for basic research 7.85 Enhanced R&D credit for experimental development 17.95 TAP payments 94.44 Regional grants 1,504.62 -1,723.68 (GAIN) -8.08
Gain to the Exchequer 3,423.63
Source: Table B13 and supporting calculations.
Mitigation measures for ‘seriously-affected’ non-agricultural products
Table 15 summarises the estimated tariff position under the WTO-only basis for UK exportersof non-agricultural products to the EU where the tariff is estimated to exceed 5% of the valueof the sales, and the corresponding position for EU exporters to the UK.
Some observations immediately prompt themselves. The first is that a single sector, Chapter87 (vehicles) attracts by itself over a quarter of the total EU tariff costs for the UK. The secondis that over half of the seriously-affected sectors, 12 out of 21, fall within the same HS Section,XI (Textiles and Textile Products), with which it is convenient to also group Chapter 64(footwear). There is another cluster of four industries from Section VI (Chemical Products), towhich Chapter 39 (plastics) is clearly related.140
Apart from these, the three other components of Table 15 (fish; ceramics; and aluminium) areone-off outliers without any obvious connecting theme. It is also helpful that, whilst beingproportionately severe, the median point for the absolute cost involved is only £17 millionwhich, in the context of most government programmes, is a comparatively trivial sum.
This concentration is helpful for ministers, because it means that a small number of schemescould have considerably wide impact among the most highly-affected industries. But it alsocreates a danger, because the very specificity of any assistance makes it more likely to offendagainst the WTO rules. Furthermore, potentially all measures to benefit a particular industrywould be aggregated in assessing whether ‘serious prejudice’ has been suffered by foreigncompetitors – and, by definition, all of these industries in Table 15 would be expecting toreceive benefits equivalent to at least 5% of the value of their exports, a material figure.
140 Strictly that Chapter falls within Section VII.

Table 15: Estimate of annual tariffs payable on UK-EU non-agricultural exports (£ million)
EU GOODS UK GOODS Average Tariffs Average Product UK Tariffs Tariff EU Payable Tariff Description Imports Payable Rate Imports Estimate Rate
Source: data derived from Protts “Potential post-Brexit tariff costs for EU-UK trade” (Civitas, October 2016)
Fish and crustaceans 514 45 8.8% 924 87 9.4%Dyeing extracts and colouring matter; paints and varnishes; putty and other mastics; inks 1,309 79 6.0% 1,200 72 6.0%Explosives; pyrotechnic products; matches; pyrophoric alloys; certain combustible preparations 10 1 6.3% 25 2 6.3%Photographic or cinematographic goods 211 13 6.2% 268 16 6.1%Plastics and articles thereof 8,125 498 6.1% 4,656 286 6.1%Silk 19 1 5.7% 7 0 6.6%Cotton 105 7 6.7% 65 5 7.5%Other vegetable textile fibres; paper yarn and woven fabrics of paper yarn 26 2 6.2% 8 1 6.5%Man-made filaments; strip and the like of man-made textile materials 273 15 5.4% 396 22 5.5%Man-made staple fibres 204 11 5.3% 144 9 6.3%Carpets & other textile floor coverings 595 47 7.9% 72 6 7.7%Special woven fabrics; tufted textile fabrics; lace; tapestries; trimmings; embroidery 143 11 7.7% 64 5 7.4%Impregnated, coated, covered or laminated textile fabrics; textile articles suitable for industrial use 183 12 6.8% 238 17 7.1%Knitted or crocheted fabrics 60 5 8.0% 65 5 8.0%Articles of apparel and clothing accessories, knitted or crocheted 1,940 230 11.9% 859 102 11.8%Articles of apparel and clothing accessories, not knitted or crocheted 2,428 283 11.7% 979 113 11.5%Other made-up textile articles; sets; worn clothing and worn textile articles; rags 271 28 10.2% 243 21 8.5%Footwear, gaiters and the like;parts of such articles 1,896 209 11.0% 723 83 11.4%Ceramic products 748 38 5.1% 141 10 6.8%Aluminium and articles thereof 2,186 149 6.8% 1,174 66 5.7%Vehicles other than railway or tramway rolling stock modified starches; glues; enzymes 43,111 3,896 9.0% 15,439 1,348 8.7%
TOTAL 64,355 5,579 8.7% 27,690 2,274 8.2%
civitas.org.uk/research/europe • 45

Nevertheless, these broad groupings provide a suitable basis for considering what mitigationmeasures could be implemented by Government through the gateways permitted in the WTOregime: non-specificity and non-severity. That involves considering the locations in which theseindustries are found, to check the ability to assist them through regional policy. It is unfortunatethat the available data only extends to Great Britain, but since the discussion in Part II indicatedthat the whole of Northern Ireland would qualify for extended assisted area status anyway,this is less of an issue in practice. It can be assumed that any industry with a presence in thatregion can benefit from the mitigation measures. Where possible, reference is made to thegovernment assistance which industry trade bodies have requested.
Motor vehicles
This sub-category covers UK exports within HS Chapter 87 (vehicles other than railway ortramway rolling stock).
It corresponds to SIC division 29 (manufacture of motor vehicles, trailers and semi-trailers).
Table 16 gives the local authorities in Great Britain where this sub-category is mostconcentrated, indicating which would qualify as assisted areas under the expanded regionalpolicy discussed in Part II. The ‘location quotients’ indicate the degree of specialisation (1.00equals the national average).
civitas.org.uk/research/europe • 46
Table 16: Concentration of motor vehicle industry in Great Britain
Local authority Location quotient Area status
Sunderland 16.4 Area IIIKnowsley 12.0 Area IIISwindon 8.8 Stratford-on-Avon 8.4 Coventry 7.8 South Norfolk 6.9 Area I Telford and Wrekin 6.6 Torfaen 6.1 Area IIIDaventry 6.0 Redditch 5.6 Area ISouth Ribble 5.1 Darlington 4.7 Area II High Peak 4.2 Area IBlaenau Gwent 4.1 Area IIIWellingborough 3.8 Area IIICheshire West and Chester 3.8 East Riding of Yorkshire 3.2 Area ISandwell 3.1 Area IIIKingston upon Hull, City of 3.0 Area IIICannock Chase 3.0 Area I
Source: ONS location quotients for each local authority, derived from Business Register and Employment Survey, 2011.See the Technical Note in Appendix III.

The motor industry trade body, the Society of Motor Manufacturers and Traders (SMMT), wasone of the business groups most opposed to Brexit.141 Their response to the Autumn Statement2016 welcomed the extra infrastructure investment, especially in regard to the charging networkfor electric cars, and the possibility of R&D support, but expressed disappointment that therehad been no action on business rates reform, especially their demand that plant and machinerybe removed from the valuation of premises for rating purposes.142 This last request is, of course,something that could be arranged through an expanded programme of Enterprise Zones nowthat the UK is not constrained by the EU rules on state aid. It is a little unfortunate that Table16 indicates that some high-concentration areas would still fall outside the coverage of post-Brexit regional policy, but nevertheless the major centres of the industry would be caught. Asthe SMMT often reminds us, the motor industry is a major contributor of R&D expenditure, andit is also a significant consumer of electricity, so this category of product would derive materialUK-wide benefit from those measures.
Table 17 summarises the expected compensation costs for motor vehicles, which indicates thatthe industry could be fully ‘compensated’. The costing approach is explained later in Part IV.
civitas.org.uk/research/europe • 47
Table 17: Impact of mitigation for motor vehicles (£ million)
Tariff costs Tariff revenues
1,347.95 3,896.20CPS abolition 17.46 Increase in general R&D credit 249.10 Enhanced R&D credit for basic research 203.80 Enhanced R&D credit for experimental development 154.39 TAP payments 154.39 Regional grants 723.21 -1,347.95 (GAIN) 0.00 Leakage on regional grants -301.51Gain to the Exchequer 3,423.63
Source: Table B13 and supporting calculations.
Textiles and footwear
This large sub-category covers UK exports within HS Chapter 50 (silk); Chapter 52 (cotton);Chapter 53 (other vegetable textile fibres; paper yarn and woven fabrics of paper yarn); Chapter55 (man-made filaments; strip and the like of man-made textile materials); Chapter 57 (carpetsand other textile floor coverings); Chapter 58 (special woven fabrics; tufted textile fabrics; lace;tapestries; trimmings; embroidery); Chapter 59 (impregnated, coated, covered or laminatedtextile fabrics; textile articles suitable for industrial use); Chapter 60 (knitted or crocheted fabrics);Chapter 61 (articles of apparel and clothing accessories, knitted or crocheted); Chapter 62(articles of apparel and clothing accessories, not knitted or crocheted) and Chapter 63 (other
141 See for example: https://www.smmt.co.uk/2016/06/remaining-in-europe-critical-to-future-of-uk-automotive-industry-warns-smmt/ (accessed 24/11/16).
142 See https://www.smmt.co.uk/2016/11/smmt-statement-in-response-to-the-2016-spending-review/ (accessed 24/11/16).
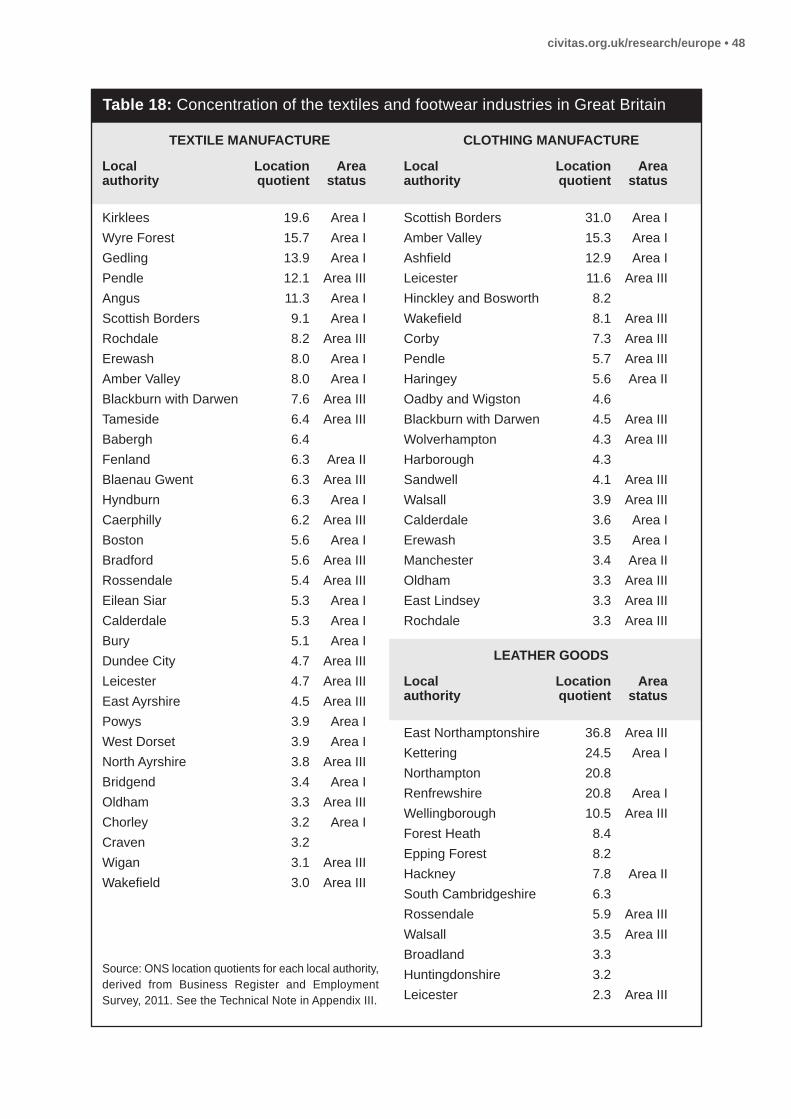
Table 18: Concentration of the textiles and footwear industries in Great Britain
TExTILE MANUFACTURE
Local Location Areaauthority quotient status
Kirklees 19.6 Area IWyre Forest 15.7 Area IGedling 13.9 Area IPendle 12.1 Area IIIAngus 11.3 Area IScottish Borders 9.1 Area IRochdale 8.2 Area IIIErewash 8.0 Area IAmber Valley 8.0 Area IBlackburn with Darwen 7.6 Area IIITameside 6.4 Area IIIBabergh 6.4 Fenland 6.3 Area II Blaenau Gwent 6.3 Area IIIHyndburn 6.3 Area ICaerphilly 6.2 Area IIIBoston 5.6 Area IBradford 5.6 Area IIIRossendale 5.4 Area IIIEilean Siar 5.3 Area ICalderdale 5.3 Area IBury 5.1 Area IDundee City 4.7 Area IIILeicester 4.7 Area IIIEast Ayrshire 4.5 Area IIIPowys 3.9 Area IWest Dorset 3.9 Area INorth Ayrshire 3.8 Area IIIBridgend 3.4 Area IOldham 3.3 Area IIIChorley 3.2 Area ICraven 3.2 Wigan 3.1 Area IIIWakefield 3.0 Area III
CLOThING MANUFACTURE
Local Location Areaauthority quotient status
Scottish Borders 31.0 Area IAmber Valley 15.3 Area IAshfield 12.9 Area ILeicester 11.6 Area IIIHinckley and Bosworth 8.2 Wakefield 8.1 Area IIICorby 7.3 Area IIIPendle 5.7 Area IIIHaringey 5.6 Area II Oadby and Wigston 4.6 Blackburn with Darwen 4.5 Area IIIWolverhampton 4.3 Area IIIHarborough 4.3 Sandwell 4.1 Area IIIWalsall 3.9 Area IIICalderdale 3.6 Area IErewash 3.5 Area IManchester 3.4 Area IIOldham 3.3 Area IIIEast Lindsey 3.3 Area IIIRochdale 3.3 Area III
LEAThER GOODS
Local Location Areaauthority quotient status
East Northamptonshire 36.8 Area IIIKettering 24.5 Area I Northampton 20.8 Renfrewshire 20.8 Area IWellingborough 10.5 Area IIIForest Heath 8.4 Epping Forest 8.2 Hackney 7.8 Area II South Cambridgeshire 6.3 Rossendale 5.9 Area IIIWalsall 3.5 Area IIIBroadland 3.3 Huntingdonshire 3.2 Leicester 2.3 Area III
Source: ONS location quotients for each local authority,derived from Business Register and Employment Survey, 2011. See the Technical Note in Appendix III.
civitas.org.uk/research/europe • 48

made-up textile articles; sets; worn clothing and worn textile articles; rags). For convenience ofanalysis this group is combined with HS Chapter 64 (footwear, gaiters and the like; parts ofsuch articles). There is a partial overlap in the use of leather, and the available UK data is rarelysufficiently granular to distinguish between them.
The sub-category corresponds to SIC divisions 13 (manufacture of textiles), 14 (manufactureof wearing apparel) and 15 (manufacture of leather and related products).
Studying the location of this very broad sub-category is best considered in terms of its threemain constituent elements: textile manufacture; clothing manufacture; and leather goods. Table18 gives the local authorities in Great Britain where these groups are most concentrated,indicating which would qualify as assisted areas under the expanded regional policy discussedin Part II. The ‘location quotients’ indicate the degree of specialisation (1.00 equals the nationalaverage).
Not unexpectedly, there is considerable overlap between the locations of the three constituentsub-groups. More significantly, almost all of the high-concentration sites for all three fall withinthe expanded regional policy envisaged in this paper. That makes it comparativelystraightforward to arrange for full ‘compensation’ for these industries.
In their “Manifesto 2012”143 the UK Fashion & Textile Association, the industry trade body,called for:
1. Making it simpler for UK companies to bid for UK Government contracts.
2. An end to the steady ‘creep’ of Government activity which impacts on the tradeassociation sector’s ability to support their industry.
3. Reinforcement of the Climate Change Levy scheme (CCL) and for its continuedadministration by industry associations.
4. Simplification of policies within different devolved regions and administrations.
5. A campaign to ensure that fashion and textile graduates have a basic understanding ofrunning a business.
6. A programme of industry mentors to support start up designer companies.
7. A programme to ensure that accurate information outlining the range of opportunities inthe sector be made available to schools, and that teachers and lecturers become familiarwith the sector and provide quality careers advice.
8. A closer working relationship with UK Trade & Investment (the export-promotion body),especially in the areas of preparing companies for export and the allocation of budgets.
9. A new programme of supported Trade Missions for established exporters to theBRICs markets.
civitas.org.uk/research/europe • 49
143 Available at < http://www.ukft.org/documents/industryinformation/ > (accessed 24/11/16).

10. Increased funding for the Tradeshow Access Programme which helps small exportersbreak into new export markets.
11. Greater flexibility to channel the existing budgets to the best investment potential for thetaxpayer.
12. A commitment for trade associations to be reconnected directly with Commercial Officersin overseas Embassies and Consulates, for these to be reinforced and act as a freeconduit of active business opportunities for UK exporters.
13. A swift conclusion to trade treaty negotiations with key markets including Japan andthe USA.
Of this list, items 2, 4 and 13 perhaps display excessive optimism. The concern of UKFT overthe climate change levy (item 3) relates to the aspect of the scheme whereby businessescaught by it are entitled to rebates in return for making binding carbon reduction commitments,which UKFT polices. The remainder of the list are all items which it would be relativelystraightforward to deliver through regional assistance programmes.
Table 19 summarises the expected compensation costs for these products, which indicatesthat the industries could be fully ‘compensated’. A full analysis for all industries is found inTable B13. The costing approach is explained later in Part IV.
civitas.org.uk/research/europe • 50
Table 19: Impact of mitigation for textiles and footwear (£ million)
Tariff costs Tariff revenues
386.78 860.73 CPS abolition 8.10 Increase in general R&D credit 1.69 Enhanced R&D credit for experimental development 0.71 TAP payments 38.63 Regional grants 337.65 -386.78 (GAIN) 0.00 Leakage on regional grants -140.98Gain to the Exchequer 332.97
Source: Table B13 and supporting calculations.
Chemicals and plastics
This sub-category covers UK exports within HS Chapter 32 (dyeing extracts and colouring matter;paints and varnishes; putty and other mastics; inks); HS Chapter 36 (explosives; pyrotechnicproducts; matches; pyrophoric alloys; certain combustible preparations); HS Chapter 37(photographic or cinematographic goods); and HS Chapter 39 (plastics and articles thereof).
It corresponds to SIC division 20 (manufacture of chemicals and chemical products) and thesub-division 222 (manufacture of plastics products).

Table 20 gives the local authorities in Great Britain where the chemicals and plastics industriesare most concentrated, indicating which would qualify as assisted areas under the expandedregional policy discussed in Part II. The ‘location quotients’ indicate the degree of specialisation(1.00 equals the national average).
civitas.org.uk/research/europe • 51
Table 20: Concentration of the chemicals and plastics industries in Great Britain
ChEMICALSLocal Location Areaauthority quotient status
Halton 13.8 Area IIIFalkirk 9.8 Area I North Hertfordshire 7.7 Area II Wellingborough 7.5 Area IIIRossendale 6.8 Area IIINorth East Lincolnshire 6.5 Area IIIThe Vale of Glamorgan 6.4 Area IIFlintshire 6.0 Wyre 5.5 Area IIIRedcar and Cleveland 5.5 Area IIIBlackburn with Darwen 5.2 Area IIIStockton-on-Tees 5.1 Area IIICheshire West and Chester 4.8 Bolsover 4.7 Area IHartlepool 4.7 Area IIIAshford 4.4 Breckland 4.4 Area IHigh Peak 4.4 Area IKnowsley 4.3 Area IIIWest Lindsey 4.2 Area IRochdale 4.2 Area IIIBurnley 4.1 Area IIIMid Suffolk 4.0 East Hampshire 3.9 Bury 3.9 Area ISlough 3.9 Amber Valley 3.8 Area IStaffordshire Moorlands 3.7 Area IGateshead 3.6 Area IIIBoston 3.5 Area INorth West Leicestershire 3.3 Ribble Valley 3.3 East Riding of Yorkshire 3.2 Area IAllerdale 3.2 Area ITaunton Deane 3.2 Area IHyndburn 3.1 Area IUttlesford 3.0
PLASTICSLocal Location Areaauthority quotient status
Rutland 8.8 Caerphilly 6.3 Area IIINorth Warwickshire 6.1 Area II Ashfield 5.8 Area IHerefordshire, County of 5.2 Area IBlackburn with Darwen 5.0 Area IIIGosport 4.3 Amber Valley 4.2 Area IRhondda, Cynon, Taff 4.2 Area IIIBury 4.0 Area ITelford and Wrekin 4.0 Tamworth 3.9 Area IIIDoncaster 3.7 Area IIIHuntingdonshire 3.7 North Lincolnshire 3.6 Area IDover 3.6 Area IIICorby 3.5 Area IIIBlaenau Gwent 3.5 Area IIIMalvern Hills 3.4 Area IEast Dunbartonshire 3.3 Area IRyedale 3.2 East Lindsey 3.2 Area IIIHigh Peak 3.0 Area I
Source: ONS location quotients for each local authority,derived from Business Register and Employment Survey, 2011. See the Technical Note in Appendix III.

Apart from the primary cluster of the plastics industry in Rutland, the major concentrations ofboth of these industries fall within the new assisted areas and so there is considerable flexibilityfor them to receive regional policy support. Both industries could also expect to makereasonable gains from R&D and energy price measures.
Table 21 summarises the expected compensation costs for these products, which indicatesthat the industries could be fully ‘compensated’. A full analysis for all industries is found inTable B13. The costing approach is explained later in Part IV.
civitas.org.uk/research/europe • 52
Table 21: Impact of mitigation for chemicals and plastics (£ million)
Tariff costs Tariff revenues
376.20 590.19 CPS abolition 19.89 Increase in general R&D credit 17.47 Enhanced R&D credit for experimental development 5.99 TAP payments 61.49 Regional grants 271.36 -376.20 (GAIN) 0.00 Leakage on regional grants -117.31Gain to the Exchequer 96.68
Source: Table B13 and supporting calculations.
Fishing
This sub-category covers UK exports within HS Chapter 3 (fish and crustaceans).
It corresponds to SIC division 03 (fishing and aquaculture).
Table 22 gives the local authorities in Great Britain where the fishing industry and related foodactivity is most concentrated, indicating which would qualify as assisted areas under theexpanded regional policy discussed in Part II. The ‘location quotients’ indicate the degree ofspecialisation (1.00 equals the national average).
Fishing is one of the trickier industries to handle, because the tariff costs on exports to theEU-27 exceed the revenues that would be raised on imports. It does not spend a great dealon R&D144 and aside from on-shore refrigeration is not a great user of electricity and so wouldnot materially benefit from the CPS abolition. Fishing boats are fuelled by ‘gas oil’, otherwiseknown as ‘red diesel’. The UK’s attempts to levy a lower rate of excise duty than for other fuelssparked a long-running dispute between London and Brussels.145 Brexit will not make that
144 The fishing industry is combined with agriculture in the ONS data, indicating that it is not a major contributorin its own right.
145 The EU objects to the owners of pleasure boats being able to pay a lower duty on fuel which it believes shouldbe confined exclusively to commercial vessels. There have even been attempts to charge the owners of boatsarriving in Continental ports with duty evasion. At present UK owners of pleasure vessels have to sign adeclaration that they will not sail outside British territorial waters when they purchase fuel at the reduced rate.For a full account of this dispute, see the website of the Royal Yachting Association at < http://www.rya.org.uk/infoadvice/regssafety/reddiesel/Pages/reddieselhistory.aspx > (accessed 25/11/16).

problem go away. In the absence of any UK-wide non-specific programme, the route formitigation for fishing will lie almost exclusively through regional policy.
Not unsurprisingly, Table 22 demonstrates that this industry tends to be found in coastal areas.It is annoying that the heaviest concentration falls outside the three Areas, but as discussedpreviously in Part II, these new assisted areas have been devised using very rudimentarytests. A more sophisticated policy, which made use of criteria such as geographical isolationor low population density, would make it very easy to justify the provision of assistance to theShetland Islands. That is, after all, how they are included under the current EU rules.
Table 22: Concentration of the fishing industry in Great Britain
Local authority Location quotient Area status
Shetland Islands 138.22 Eilean Siar 117.14 Area IOrkney Islands 96.81 Area IAberdeenshire 54.66 Argyll & Bute 41.54 Area IHighland 32.03 Area IMoray 27.92 Eden 21.71 Torbay 12.46 Area IWeymouth and Portland 9.3 Area IIIDumfries & Galloway 8.21 Area IWest Somerset 8.07 Area ISouth Ayrshire 7.82 Area ITeignbridge 6.12 Area ICornwall 5.81 Area IAnglesey 5.56 Area IColchester 5.49 Area ITorridge 5.33 Area IIICotswold 5.32 South Hams 5.2 Area INorth Norfolk 5.18 Area IEast Devon 4.71 Area IEast Lothian 4.51 Area IPembrokeshire 4.45 Area IScottish Borders 4.32 Area IAdur 4.19 Angus 3.87 Area IMid Devon 3.14 Area IBarrow-in-Furness 3.08 Area I
Source: ONS location quotients for each local authority, derived from Business Register and Employment Survey, 2011.See the Technical Note in Appendix III.
civitas.org.uk/research/europe • 53

Members of the fishing industry have a well-known discontent with EU membership.Grievances mainly arise with the operation of the Common Fisheries Policy (CFP) and post-Brexit the appropriate vehicle for addressing these would be through a ‘Son of CFP’ adoptedby the UK. There is already a statutory body, the Sea Fish Industry Authority (‘Seafish’), withthe role of promoting the efficiency of the industry as a whole, whilst having regard to theinterests of consumers.146 That would be a convenient mechanism for arranging assistance.Ministers would have to take care, since assistance which allegedly encourages over-exploitation is a controversial topic within the Doha Round of WTO talks, with proposals tabledto reduce the size of shipping fleets and subsidies for operating costs through a new Annex tothe SCM Agreement devoted to the industry alone.147
Under the CFP, no new licences are issued for fishing. Instead someone wishing to enter theindustry has to purchase (or perhaps inherit) a boat which already carries a licence. So anobvious vehicle for providing ‘compensation’ would be loans to fishermen on favourable termsto enable them to buy new boats. The ‘subsidy’ in such an arrangement would be the amount ofinterest which the borrower paid below a normal commercial rate.148 The loan would have to beon otherwise arms’ length terms, especially as to repayment, with no element of debt-forgiveness, but with an appropriate choice of interest rate, such a scheme would facilitate themodernisation of a considerable proportion of the UK fishing fleet.149 Eligibility for such loanswould be subject to objective criteria limiting them to smaller vessels, or those which betterfulfilled the conservation objectives of ‘Son of CFP’, making them a non-specific subsidy. Thatcase becomes easier if the scheme is opened up to other classes of coastal vessel, which mighthelp to meet wider objectives, for example in the waterborne carriage of freight instead of byroad. It is unlikely to be politically feasible to extend the scheme to private yachts.
Table 23 summarises the expected compensation costs for fishing, which indicates that theindustry could be fully ‘compensated’, but there would be a deficiency to the Treasury to bemade good from other industries. The costing approach is explained later in Part IV.
civitas.org.uk/research/europe • 54
146 Fisheries Act 1981 section2. See also http://www.seafish.org/ 147 See WTO website at < https://www.wto.org/english/tratop_e/rulesneg_e/fish_e/fish_intro_e.htm > (accessed
25/11/16).148 SCM Agreement 1994 Article 14(b).149 Because if the ‘benefit’ is equal to, say, a 2% interest rate saving, the capital value of the new vessels would
be x50 the benefit.
Table 23: Impact of mitigation for fishing (£ million)
Tariff costs Tariff revenues
86.72 45.36CPS abolition 3.39 Increase in general R&D credit 3.42 Enhanced R&D credit for experimental development 1.35 TAP payments 9.24 Regional grants 69.32 -86.72 (GAIN) 0.00 Leakage on regional grants -26.06Gain to the Exchequer -67.43
Source: Table B13 and supporting calculations.

Ceramics
This sub-category covers UK exports within Chapter 69 (ceramic products).
It corresponds to the SIC sub-divisions 233 (manufacture of clay building materials) and 234(manufacture of other porcelain and ceramic products).
Table 24 gives the local authorities in Great Britain where these two sub-sets, building materialsand ceramic products, are most concentrated, indicating which would qualify as assisted areasunder the expanded regional policy discussed in Part II. The ‘location quotients’ indicate thedegree of specialisation (1.00 equals the national average).
civitas.org.uk/research/europe • 55
Table 24: Concentration of the ceramics industry in Great Britain
CLAY BUILDING MATERIALSLocal Location Areaauthority quotient status
North West Leicestershire 37.2 Newcastle-under-Lyme 28.3 Area IStoke-on-Trent 20.7 Area IIIRother 19.0 Area IMid Sussex 16.5 Horsham 15.6 Forest of Dean 9.7 Braintree 6.8 Area IWalsall 6.4 Area IIIDudley 2.8 Area III
PORCELAIN AND CERAMIC PRODUCTSLocal Location Areaauthority quotient status
Stoke-on-Trent 128.5 Area III
Source: ONS location quotients for each local authority,derived from Business Register and Employment Survey, 2011. See the Technical Note in Appendix III.
It can be seen that there is a very close alignment between the two sub-sets. Porcelain andceramics are, of course, made elsewhere in Great Britain than Stoke-on-Trent, but not in theconcentration that would qualify for inclusion in Table 24.150
In their submission to the Treasury ahead of the Autumn Statement 2016,151 the British CeramicConfederation, the industry body, lobbied for five policies, under the overall slogan of E-A-R-T-H:
1. Emissions Trading System: they were concerned that the projected operation of the EU-ETS, especially the allocation of free allowances, was putting them out of business andthey argued that Brexit offered an opportunity to develop a climate change policy whichdid more to promote UK competitiveness.
2. Action to lighten the cost of UK energy, climate and environmental policy: among othermitigation schemes, they wanted the abolition of the UK-only carbon price floor imposedvia the CPS levy.
150 The second-ranked location is Fife, with a quotient of 2.6, and Stratford-on-Avon comes third with 1.8.151 Available at < http://www.ceramfed.co.uk/news/british-ceramic-confederation-makes-submission-to-chancellor-
for-autumn-statement-2016/ > (accessed 25/11/16).

3. Reduction of industrial CO2 emissions: essentially, they were asking for fiscal support forbusinesses to re-equip with more carbon-efficient technology.
4. Trade freely but fairly: in short, take anti-dumping action against China.
5. Housing: they wanted more of it built.
From this list, the Autumn Statement 2016 appears to have given them item 5, with theannouncement of a National Productivity Investment Fund which among other things will investat least £8 billion in housing over the next four years.152 The arguments of the British CeramicsConfederation for their other four items carry great force, and they amount to a plea for a co-ordinated industrial strategy.
This paper would agree with them in regard to the damaging carbon price floor, where abolitionwould make a material contribution. Of all of the ‘seriously-affected’ industries considered inthis paper, electricity costs impact most heavily on ceramics. The benefit from abolition of theCPS would mitigate 26% of the industry’s anticipated tariff costs, far in excess of the others’.153
The bulk of assistance would have to come through regional aid, but the industry as a wholeis one where import revenues significantly outweigh tariff costs.
Table 25 summarises the expected compensation costs for these products, which indicatesthat the industries could be fully ‘compensated’, with HM Treasury still making a considerableoverall surplus. The costing approach is explained later in Part IV.
civitas.org.uk/research/europe • 56
152 Autumn Statement 2016, Table 3.1, page 26.153 Second-ranking is aluminium, on 11%, and next is chemicals and plastics, on 5%.
Aluminium
This sub-category covers UK exports within Chapter 76 (aluminium and articles thereof).
It corresponds to SIC sub-division 244 (manufacture of basic precious and other non-ferrousmetals), although even at that level the matching is not precise.
Table 25: Impact of mitigation for ceramics (£ million)
Tariff costs Tariff revenues
9.55 37.84 CPS abolition 2.52 Increase in general R&D credit 0.47 Enhanced R&D credit for experimental development 0.23 TAP payments 1.41 Regional grants 4.92 -9.55 (GAIN) 0.00 Leakage on regional grants -1.89Gain to the Exchequer 26.40
Source: Table B13 and supporting calculations.

Table 26 gives the local authorities in Great Britain where this industry is most concentrated,indicating which would qualify as assisted areas under the expanded regional policy discussed in Part II. The ‘location quotients’ indicate the degree of specialisation (1.00 equalsthe national average).
civitas.org.uk/research/europe • 57
Table 26: Concentration of the aluminium industry in Great Britain
Local authority Location quotient Area status
High Peak 8.6 Area IRotherham 5.3 Area IIICannock Chase 4.1 Area ITamworth 3.9 Area IIICoventry 3.2 Walsall 2.9 Area IIIBirmingham 2.8 Area II
Source: ONS location quotients for each local authority, derived from Business Register and Employment Survey, 2011.See the Technical Note in Appendix III.
It can be seen that there are relatively few areas where this industry is based, which is whythe list in Table 26 has been extended to include a couple of ‘near misses’ (Walsall;Birmingham) which would not have passed the criteria for the equivalent tables for othersub-groupings being considered. That reinforces the impression of a quite tight geographicalcontiguity which is very helpful from a regional aid perspective. The industry would makematerial gains from the abolition of CPS, but in absolute terms regional grants will have tomake up the bulk of the mitigation measures.
Table 27 summarises the expected compensation costs for this product, which indicates thatthe industry could be fully ‘compensated’, with HM Treasury still making a considerable overallsurplus. The costing approach is explained later in Part IV.
Table 27: Impact of mitigation for aluminium (£ million)
Tariff costs Tariff revenues
66.37 148.76 CPS abolition 7.09 Increase in general R&D credit 2.27 Enhanced R&D credit for experimental development 1.16 TAP payments 11.74 Regional grants 44.12 -66.37 (GAIN) 0.00 Leakage on regional grants -19.59Gain to the Exchequer 62.80
Source: Table B13 and supporting calculations.

civitas.org.uk/research/europe • 58
Table 28: Estimate of annual tariffs payable on UK-EU non-agricultural exports (2015, £ millions)
EU GOODS UK GOODS Average Tariffs Average Product UK Tariffs Tariff EU Payable Tariff Description Imports Payable Rate Imports Estimate Rate
Mitigation measures for ‘middle products’
Table 28 summarises the estimated tariff position under the WTO-only basis for UK exportersto the EU of the ‘middle goods’ categories and the corresponding position for EU exporters tothe UK.
Mineral fuels, oils and products;bituminous substances; mineral waxes 7,684 127 1.7% 15,659 167 1.1%Inorganic chemicals 1,186 37 3.1% 928 24 2.6%Organic chemicals 4,010 209 5.2% 3,516 134 3.8%Fertilisers 511 29 5.6% 228 9 3.7%Essential oils and resinoids; perfumery, cosmetic or toilet preparations 2,964 58 1.9% 2,061 37 1.8%Soap, organic surface-active agents, prepared waxes, candles, modellingpastes and dental preparations 1,357 45 3.3% 920 28 3.1%Miscellaneous chemical products 2,483 118 4.7% 2,625 113 4.3%Rubber and articles thereof 1,967 62 3.2% 1,724 54 3.1%Raw hides and skins (other than furskins) and leather 156 7 4.7% 160 4 2.4%Articles of leather and articles of animal gut (other than silkworm gut) 993 41 4.1% 296 13 4.2%Furskins and artificial fur; manufactures hereof 37 1 3.0% 18 0 2.0%Wood and articles of wood; wood charcoal 2,551 49 1.9% 271 8 3.1%Cork and articles of cork 23 1 4.2% 1 0 3.9%Manufactures of straw, of esparto or of other plaiting materials; basketware and wickerwork 6 0 3.3% 2 0 3.8%Wool, fine or coarse animal hair; horsehair yarn and woven fabric 156 6 4.1% 143 6 4.5%Wadding, felt and nonwovens; special yarns; twine, cordage, ropes and cables and articles thereof 328 16 4.8% 157 7 4.7%Headgear and parts thereof 85 3 3.1% 47 1 3.0%Umbrellas, sun umbrellas, walking sticks, seat-sticks, whips, riding-crops and parts 9 0 4.4% 5 0 4.3%

civitas.org.uk/research/europe • 59
Table 28: Estimate of annual tariffs payable on UK-EU non-agricultural exports (2015, £ millions)
EU GOODS UK GOODS Average Tariffs Average Product UK Tariffs Tariff EU Payable Tariff Description Imports Payable Rate Imports Estimate Rate
Source: data derived from Protts “Potential post-Brexit tariff costs for EU-UK trade” (Civitas, October 2016)
This is an extensive list, and it is noteworthy that it includes a number of high-profile industriessuch as Chapter 88 (aircraft). In part that may reflect the high-level basis on which the datahas been compiled, since within each broad category there will undoubtedly be specific sub-sectors of commodity which will be exposed to very precisely targeted tariffs at comparativelysteep rates. That said, within the limitations of an aggregate netting-off approach, it shouldoffer some reassurance that so many industries, responsible for over half of exports to theEU, are unlikely to be exposed to a material increase in costs.
Prepared feathers and down; artificial flowers; articles of human hair 11 0 2.7% 6 0 2.8%Glass and glassware 1,007 49 4.9% 470 23 5.0%Articles of iron or steel 3,272 55 1.7% 1,493 32 2.1%Copper and articles thereof 984 40 4.1% 582 9 1.6%Lead and articles thereof 31 1 2.7% 155 3 1.9%Zinc and articles thereof 61 2 3.5% 77 2 2.8%Other base metals and cermets 210 9 4.3% 238 11 4.8%Tools implements of base metal 628 18 2.9% 306 9 3.0%Miscellaneous articles of base metal 858 21 2.4% 366 9 2.5%Nuclear reactors, boilers, and mechanical appliances 25,915 366 1.4% 12,739 210 1.7%Electrical machinery 19,749 477 2.4% 8,385 144 1.7%Railway or tramway locomotives rolling stock 313 6 2.0% 83 1 1.7%Aircraft, spacecraft, and parts thereof 3,391 49 1.4% 3,852 63 1.6%Ships, boats and floating structures 187 2 1.0% 398 4 1.1%Optical, photographic, cinematographic, measuring, medical instruments and apparatus 6,627 74 1.1% 4,123 52 1.3%Clocks and watches 504 8 1.5% 102 2 1.5%Musical instruments 99 3 3.2% 27 1 3.1%Arms and ammunition 88 2 2.9% 56 1 2.1%Furniture 3,257 58 1.8% 744 13 1.7%Toys, games and sports requisites 827 13 1.6% 657 10 1.5%Miscellaneous manufactured articles 896 25 2.8% 259 8 3.0%
TOTAL 95,422 2,088 2.2% 63,880 1,214 1.9%

It would be possible to craft mitigation schemes for each of the 39 industries in Table 28. Butthe very scale of such an exercise, and the relatively small amount of loss under consideration,raises questions about the return of doing so for every single industry in this category. It ismore suitable to rely upon the economy-wide R&D programme and the CPS abolition conduit.By themselves they are sufficient to ensure that some of the industries, of which aircraft is thebest example, make net gains compared to their tariff costs.
Regional aid is therefore a comparatively less significant factor for this category than the‘seriously-affected’ industries, and the Treasury retains a comparatively smaller proportion ofits revenue. Table 29 summarises the expected compensation costs. A full analysis for allindustries is found in Table B13. The approach is explained later in Part IV.
civitas.org.uk/research/europe • 60
Table 29: Impact of mitigation for the middle products category (£ million)
Tariff costs Tariff revenues
1,214.39 2,088.01 CPS abolition 175.81 Increase in general R&D credit 617.80 Enhanced R&D credit for experimental development 253.20 TAP payments 323.87 Regional grants 190.93 -1,561.62 (GAIN) -347.23 Leakage on regional grants -87.80Gain to the Exchequer 438.59
Source: Table B13 and supporting calculations.
Mitigation measures for ‘de minimis’ non-agricultural products
Table 30 summarises the estimated tariff position under the WTO-only basis for UK exportersto the EU of the de minimis goods categories, and the corresponding position for EU exportersto the UK.
A number of immediate observations are worth making. This small collection of industriescollectively exports more by value to the EU-27 than the ‘agricultural products’ category (13%of the total, as opposed to 9%). It contains a number of high-profile sectors. They are alsofairly concentrated, with three falling within HS Section X (Wood Pulp, Paper and Paperboard)and three within HS Section XV (Base Metals). Of the remaining six, it is not too difficult tosee connections between the two industries which fall within HS Section V (Mineral Products),the raw materials, and the finished products within stone and cement articles, or between HSChapter 71 (pearls and precious metals) and Chapter 97 (art and antiques). It is unclear if theEU wants to import such goods very badly, or does not care about them at all.
Some within the industry might be surprised to see HS Chapter 72 (iron and steel) within thislist. That is a reflection of the relatively high level at which the underlying tariff cost data hasbeen compiled. The EU operates highly specific tariffs, of an order equivalent to 4% and 6%by value, on speciality steels which, when averaged across the whole industry fall to the loweffective rates given in the Table.
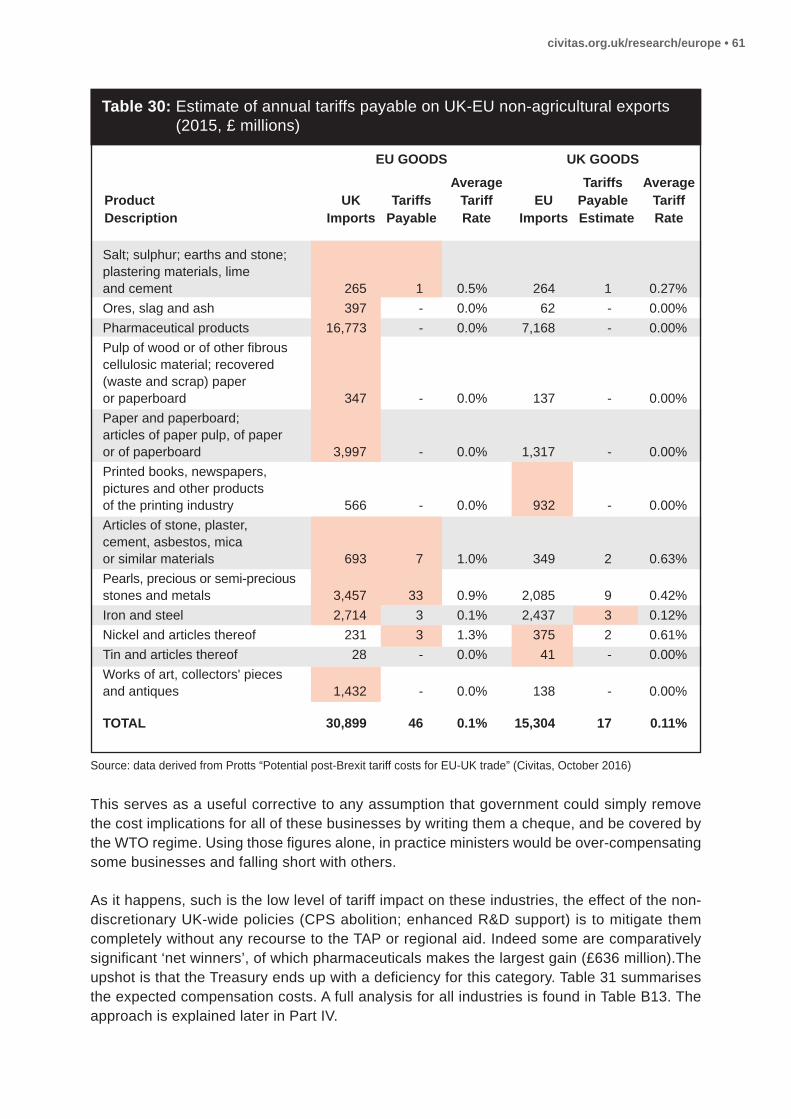
This serves as a useful corrective to any assumption that government could simply removethe cost implications for all of these businesses by writing them a cheque, and be covered bythe WTO regime. Using those figures alone, in practice ministers would be over-compensatingsome businesses and falling short with others.
As it happens, such is the low level of tariff impact on these industries, the effect of the non-discretionary UK-wide policies (CPS abolition; enhanced R&D support) is to mitigate themcompletely without any recourse to the TAP or regional aid. Indeed some are comparativelysignificant ‘net winners’, of which pharmaceuticals makes the largest gain (£636 million).Theupshot is that the Treasury ends up with a deficiency for this category. Table 31 summarisesthe expected compensation costs. A full analysis for all industries is found in Table B13. Theapproach is explained later in Part IV.
civitas.org.uk/research/europe • 61
Table 30: Estimate of annual tariffs payable on UK-EU non-agricultural exports(2015, £ millions)
EU GOODS UK GOODS Average Tariffs Average Product UK Tariffs Tariff EU Payable Tariff Description Imports Payable Rate Imports Estimate Rate
Source: data derived from Protts “Potential post-Brexit tariff costs for EU-UK trade” (Civitas, October 2016)
Salt; sulphur; earths and stone; plastering materials, lime and cement 265 1 0.5% 264 1 0.27%Ores, slag and ash 397 - 0.0% 62 - 0.00%Pharmaceutical products 16,773 - 0.0% 7,168 - 0.00%Pulp of wood or of other fibrous cellulosic material; recovered (waste and scrap) paper or paperboard 347 - 0.0% 137 - 0.00%Paper and paperboard; articles of paper pulp, of paper or of paperboard 3,997 - 0.0% 1,317 - 0.00%Printed books, newspapers, pictures and other products of the printing industry 566 - 0.0% 932 - 0.00%Articles of stone, plaster, cement, asbestos, mica or similar materials 693 7 1.0% 349 2 0.63%Pearls, precious or semi-precious stones and metals 3,457 33 0.9% 2,085 9 0.42%Iron and steel 2,714 3 0.1% 2,437 3 0.12%Nickel and articles thereof 231 3 1.3% 375 2 0.61%Tin and articles thereof 28 - 0.0% 41 - 0.00%Works of art, collectors' pieces and antiques 1,432 - 0.0% 138 - 0.00%
TOTAL 30,899 46 0.1% 15,304 17 0.11%

Table 31: Impact of mitigation for de minimis products (£ million)
Tariff costs Tariff revenues
16.86 46.25 CPS abolition 83.13 Increase in general R&D credit 407.03 Enhanced R&D credit for experimental development 236.68 TAP payments 0.00 Regional grants 0.00 -726.84 (GAIN) -709.98 Leakage on regional grants 0.00Gain to the Exchequer -663.73
Source: Table B13 and supporting calculations.
civitas.org.uk/research/europe • 62

Part Four: The Cost Of The Solution
This paper sets a puzzle: how to ‘compensate’ industries facing £5,220 million of tariff costson their sales to the EU-27, using a fund of £12,861 million revenue derived from imports fromthe EU-27. In other words, the combined programme can sustain a leakage rate of up to59.4%. But clearly, it would be imprudent to ignore the risk that the sensitivity of sales to tariff-induced price increases, which could materially drive down revenue for HM Treasury whilstincreasing the losses of UK exporters. So we would want to design an overall programme withthe lowest total cost and leakage rate.
The four main policy instruments discussed in this paper have been:
• A tax incentive for R&D expenditure, which has a central leakage rate of 29%, but withtargeted sub-measures where the leakage would be capped at either 0% or 24%;
• Discretionary grants and loans for an expanded list of Assisted Areas, where the leakagevaries with the assisted area in which the resources are spent, but with an overall averageleakage rate of 31.5%;
• A reduction in electricity prices by lowering the CPS levy intended to set a ‘carbon floorprice’, which has a leakage rate of 69.4%; and
• A discretionary Transitional Assistance Programme of small one-off grants which isintended as a sweeping-up measure and which could in theory be designed with aleakage rate of 0% but for planning purposes this is taken as 20%.
The inclusion of CPS abolition perhaps requires some explanation, given that it iscomparatively less efficient. There are good arguments for this action in its own right. Mitigationof tariff costs within the WTO regime will require UK-wide non-discretionary measures.Regional aid by itself cannot provide full mitigation, for the obvious reason that not everybusiness operates in a disadvantaged area. Nor can additional support for R&D, because notevery firm engages in it to the same extent. Even if the RDEC credit were increased to 75%,exhausting all of the anticipated tariff revenues, it would still fail to mitigate the costs of 60 outof the 96 product groups studied in this paper.
In contrast, we can be certain that all UK businesses use electricity in some form or other andwould therefore benefit from the removal of the carbon price floor. Indeed, by itself the abolitionof the CPS fully mitigates 13 of the 96 product groups.
Not the least consideration is the fact that domestic consumers also benefit from a fall inelectricity prices. CPS abolition is the only measure studied in this paper which does that.Since those consumers are ultimately bearing the burden of tariffs on EU goods, simplepolitical expediency suggests that they, too, ought to be offered a ‘Brexit bonus’ as part of aprogramme designed to benefit a comparatively small segment of UK plc.
Mitigation, then, is about devising an overall package of measures, each with their own winnersand losers. The method in which they are applied is:
1. Calculate the benefits from the abolition of the CPS
civitas.org.uk/research/europe • 63

2. Calculate the benefits from the enhanced R&D support
3. To the extent that a particular product group still has unmitigated costs, calculate anamount of TAP payment, capped at a maximum of 1% of its export sales and the balanceof unmitigated costs.
4. Any remaining costs are mitigated through regional aid.
Further explanation of the methodology is given in the Technical Note in Appendix III.
Table 32 summarises the results of this process for all industries.
civitas.org.uk/research/europe • 64
Table 32: Impact of all mitigation measures (£ million)
Tariff revenues 12,860.66
Tariff costs 5,220.43
CPS abolition 367.73 Increased R&D credits 2,076.66 TAP payments 695.20 Regional grants 3,146.13 -6,285.71 -6,285.71 (GAIN) -1,065.29
Leakage to Excluded services CPS abolition 440.05 R&D credits 773.90 TAP payments 173.80 Regional grants 695.14 -2,082.89
Domestic consumers -392.22
Net gain to Exchequer 4,099.84
Source: Table B13 and supporting calculations.

Conclusion
Hitherto, discussion of the UK’s departure from the EU has focussed upon the risks of ‘HardBrexit’ and the need to soften this by avoiding costs for business such as tariffs being leviedupon exports to the EU-27.
Tariffs are not the only costs which businesses will incur, and they would not be the onlyobstacles which exporters would face after Brexit. What this paper, and the underlying studyfrom which it is derived, indicate is that these tariff costs can be managed. In an ideal world,British exporters would not have to suffer them, but it is possible to mitigate their impactthrough other measures which are justifiable in their own right. It makes sense to remove aself-inflicted wound like the carbon price floor, which is damaging British competitiveness andlow-income households. It makes sense to provide greater tax incentives for research anddevelopment. A case can be made for regional aid given the imbalances in economicperformance and employment across the UK as a whole.
Hence, the real question is not ‘how soft a Brexit can we achieve?’ but rather ‘how hard anegotiation do we wish to drive with the EU?’ The balance of negotiating strengths is far morefavourable to the UK. If the EU-27 wish to impose a self-inflicted wound by levying tariffs onBritish exports, Britain has little to fear.
What the discussion of these mitigation measures also highlights is that each one is betterconsidered not as a stop-gap response to an immediate problem, but as part of a co-ordinatedlong-term industrial strategy to improve British competitiveness for a global market. That isalso the best means of addressing another issue highlighted in this paper: the difficulty inmatching up ‘winners’ and ‘losers’ from the tariffs and the mitigation measures. Such a strategywould have to be based on a horizontal, economy-wide approach. It would not represent areturn to the 1970s-style attitude of ‘picking winners’, if only because such an overt targetingof benefits would eventually fall foul of the modern WTO rules.
Perhaps, then, the real conclusion of this paper is that the UK should stop obsessing aboutthe EU and worrying about how they will react. We should get on with the task of managingour own affairs in our own interests, and leave the EU to worry about their own problems. Thatis the only way to make a success of Brexit. The EU-27 aren’t going to spend much time tryingto help us.
What does ‘Brexit’ mean? It means having nobody else to blame.
civitas.org.uk/research/europe • 65

Appendix I: Base data
civitas.org.uk/research/europe • 66
Table A1: Estimate of annual tariffs payable on UK-EU exports by EU PartnerCountry (2015, £ millions)
EU GOODS UK GOODS Product Average Tariffs Average Description UK Tariffs Tariff EU Payable Tariff (Full description in Table A2) Imports Payable Rate Imports Estimate Rate
Live animals 427 23 5.5% 286 6 2.2%Meat 3,163 1,023 32.3% 999 378 37.8%Fish and crustaceans 514 45 8.8% 924 87 9.4%Dairy produce (including Eggs) 2,394 956 39.9% 840 331 39.4%Products of animal origin 68 0 0.4% 82 0 0.2%Live trees and other plants 932 70 7.5% 46 3 6.9%Edible vegetables 2,154 326 15.1% 204 24 11.8%Edible fruit and nuts 1,660 168 10.1% 200 15 7.5%Coffee, tea, maté and spices 396 22 5.6% 191 9 4.7%Cereals 599 79 13.1% 322 77 23.9%Products of milling (e.g Flour) 253 64 25.2% 124 32 25.5%Oil seeds, straw and fodder 318 10 3.3% 217 2 1.1%Vegetable saps and extracts 68 3 4.6% 32 0 1.4%Other vegetable products 4 - 0.0% 3 - 0.0%Animal or vegetable fats and oils 820 122 14.8% 316 28 8.8%Preparations of meat or fish 1,771 563 31.8% 386 154 39.9%Sugars and sugar confectionery 719 217 30.2% 310 98 31.6%Cocoa and cocoa preparations 1,440 16 1.1% 468 6 1.3%Preparations of cereals, flour, starch or milk; pastrycooks' products 2,554 303 11.9% 953 121 12.7%Preparations of vegetables, fruit, nuts or other parts of plants 1,893 372 19.7% 352 62 17.7%Miscellaneous edible preparations 2,140 192 9.0% 889 79 8.9%Beverages, spirits and vinegar 4,159 240 5.8% 2,148 60 2.8%Residues and waste from the food industries 1,160 214 18.4% 539 123 22.8%Tobacco and manufactured tobacco substitutes 333 132 39.5% 208 91 43.7%Salt; sulphur; earths and stone; plastering materials, lime and cement 265 1 0.5% 264 1 0.3%Ores, slag and ash 397 - 0.0% 62 - 0.0%Mineral fuels, oils and products; bituminous substances; mineral waxes 7,684 127 1.7% 15,659 167 1.1%Inorganic chemicals 1,186 37 3.1% 928 24 2.6%Organic chemicals 4,010 209 5.2% 3,516 134 3.8%Pharmaceutical products 16,773 - 0.0% 7,168 - 0.0%Fertilisers 511 29 5.6% 228 9 3.7%

civitas.org.uk/research/europe • 67
Table A1: Estimate of annual tariffs payable on UK-EU exports by EU PartnerCountry (2015, £ millions)
EU GOODS UK GOODS Product Average Tariffs Average Description UK Tariffs Tariff EU Payable Tariff (Full description in Table A2) Imports Payable Rate Imports Estimate Rate
Dyeing extracts and colouring matter; paints and varnishes; putty and other mastics; inks 1,309 79 6.0% 1,200 72 6.0%Essential oils and resinoids; perfumery, cosmetic or toilet preparations 2,964 58 1.9% 2,061 37 1.8%Soap, organic surface-active agents, prepared waxes, candles, modellingpastes and dental preparations 1,357 45 3.3% 920 28 3.1%Albuminoidal substances; modified starches; glues; enzymes 451 35 7.8% 221 16 7.2%Explosives; pyrotechnic products; matches; pyrophoric alloys; certain combustible preparations 10 1 6.3% 25 2 6.3%Photographic or cinematographic goods 211 13 6.2% 268 16 6.1%Miscellaneous chemical products 2,483 118 4.7% 2,625 113 4.3%Plastics and articles thereof 8,125 498 6.1% 4,656 286 6.1%Rubber and articles thereof 1,967 62 3.2% 1,724 54 3.1%Raw hides and skins (other than furskins) and leather 156 7 4.7% 160 4 2.4%Articles of leather and articles of animal gut (other than silkworm gut) 993 41 4.1% 296 13 4.2%Furskins and artificial fur; manufactures thereof 37 1 3.0% 18 0 2.0%Wood and articles of wood; wood charcoal 2,551 49 1.9% 271 8 3.1%Cork and articles of cork 23 1 4.2% 1 0 3.9%Manufactures of straw, of esparto or of other plaiting materials;basketware and wickerwork 6 0 3.3% 2 0 3.8%Pulp of wood or of other fibrous cellulosic material; recovered (waste and scrap) paper or paperboard 347 - 0.0% 137 - 0.0%Paper and paperboard; articles of paper pulp, of paper or of paperboard 3,997 - 0.0% 1,317 - 0.0%Printed books, newspapers, pictures and other products of the printing industry 566 - 0.0% 932 - 0.0%Silk 19 1 5.7% 7 0 6.6%Wool, fine or coarse animal hair; horsehair yarn and woven fabric 156 6 4.1% 143 6 4.5%

civitas.org.uk/research/europe • 68
Table A1: Estimate of annual tariffs payable on UK-EU exports by EU PartnerCountry (2015, £ millions)
EU GOODS UK GOODS Product Average Tariffs Average Description UK Tariffs Tariff EU Payable Tariff (Full description in Table A2) Imports Payable Rate Imports Estimate Rate
Cotton 105 7 6.7% 65 5 7.5%Other vegetable textile fibres; paper yarn and woven fabrics of paper yarn 26 2 6.2% 8 1 6.5%Man-made filaments; strip and the like of man-made textile materials 273 15 5.4% 396 22 5.5%Man-made staple fibres 204 11 5.3% 144 9 6.3%Wadding, felt and nonwovens; special yarns; twine, cordage, ropes and cables and articles thereof 328 16 4.8% 157 7 4.7%Carpets and other textile floor coverings 595 47 7.9% 72 6 7.7%Special woven fabrics; tufted textile fabrics; lace; tapestries; trimmings; embroidery 143 11 7.7% 64 5 7.4%Impregnated, coated, covered or laminated textile fabrics; textile articles suitable for industrial use 183 12 6.8% 238 17 7.1%Knitted or crocheted fabrics 60 5 8.0% 65 5 8.0%Articles of apparel and clothing accessories, knitted or crocheted 1,940 230 11.9% 859 102 11.8%Articles of apparel and clothing accessories, not knitted or crocheted 2,428 283 11.7% 979 113 11.5%Other made-up textile articles; sets; worn clothing and worn textile articles; rags 271 28 10.2% 243 21 8.5%Footwear, gaiters and the like; parts of such articles 1,896 209 11.0% 723 83 11.4%Headgear and parts thereof 85 3 3.1% 47 1 3.0%Umbrellas, sun umbrellas, walking sticks, seat-sticks, whips, riding-crops and parts 9 0 4.4% 5 0 4.3%Prepared feathers and down; artificial flowers; articles of human hair 11 0 2.7% 6 0 2.8%Articles of stone, plaster, cement, asbestos, mica or similar materials 693 7 1.0% 349 2 0.6%Ceramic products 748 38 5.1% 141 10 6.8%Glass and glassware 1,007 49 4.9% 470 23 5.0%Pearls, precious or semi-precious stones and metals 3,457 33 0.9% 2,085 9 0.4%

civitas.org.uk/research/europe • 69
Table A1: Estimate of annual tariffs payable on UK-EU exports by EU PartnerCountry (2015, £ millions)
EU GOODS UK GOODS Product Average Tariffs Average Description UK Tariffs Tariff EU Payable Tariff (Full description in Table A2) Imports Payable Rate Imports Estimate Rate
Source: data derived from Protts “Potential post-Brexit tariff costs for EU-UK trade” (Civitas, October 2016)
Iron and steel 2,714 3 0.1% 2,437 3 0.1%Articles of iron or steel 3,272 55 1.7% 1,493 32 2.1%Copper and articles thereof 984 40 4.1% 582 9 1.6%Nickel and articles thereof 231 3 1.3% 375 2 0.6%Aluminium and articles thereof 2,186 149 6.8% 1,174 66 5.7%Lead and articles thereof 31 1 2.7% 155 3 1.9%Zinc and articles thereof 61 2 3.5% 77 2 2.8%Tin and articles thereof 28 - 0.0% 41 - 0.0%Other base metals and cermets 210 9 4.3% 238 11 4.8%Tools implements of base metal 628 18 2.9% 306 9 3.0%Miscellaneous articles of base metal 858 21 2.4% 366 9 2.5%Nuclear reactors, boilers, and mechanical appliances 25,915 366 1.4% 12,739 210 1.7%Electrical machinery 19,749 477 2.4% 8,385 144 1.7%Railway or tramway locomotives rolling stock 313 6 2.0% 83 1 1.7%Vehicles other than railway or tramway rolling stock 43,111 3,896 9.0% 15,439 1,348 8.7%Aircraft, spacecraft, and parts thereof 3,391 49 1.4% 3,852 63 1.6%Ships, boats and floating structures 187 2 1.0% 398 4 1.1%Optical, photographic, cinematographic, measuring, medical instruments and apparatus 6,627 74 1.1% 4,123 52 1.3%Clocks and watches 504 8 1.5% 102 2 1.5%Musical instruments 99 3 3.2% 27 1 3.1%Arms and ammunition 88 2 2.9% 56 1 2.1%Furniture 3,257 58 1.8% 744 13 1.7%Toys, games and sports requisites 827 13 1.6% 657 10 1.5%Miscellaneous manufactured articles 896 25 2.8% 259 8 3.0%Works of art, collectors' pieces and antiques 1,432 - 0.0% 138 - 0.0%
TOTAL 220,551 12,861 5.8% 117,210 5,220 4.5%

civitas.org.uk/research/europe • 70
Table A2: 2-digit HS Code Product Description
01 Live animals
02 Meat and edible meat offal
03 Fish and crustaceans, molluscs and other aquatic invertebrates
04 Dairy produce; birds' eggs; natural honey; edible products of animal origin, not elsewherespecified or included
05 Products of animal origin, not elsewhere specified or included
06 Live trees and other plants; bulbs, roots and the like; cut flowers and ornamental foliage
07 Edible vegetables and certain roots and tubers
08 Edible fruit and nuts; peel of citrus fruit or melons
09 Coffee, tea, maté and spices
10 Cereals
11 Products of the milling industry; malt; starches; inulin; wheat gluten
12 Oil seeds and oleaginous fruits; miscellaneous grains, seeds and fruit; industrial or medicinalplants; straw and fodder
13 Lac; gums, resins and other vegetable saps and extracts
14 Vegetable plaiting materials; vegetable products not elsewhere specified or included
15 Animal or vegetable fats and oils and their cleavage products; prepared edible fats; animalor vegetable waxes
16 Preparations of meat, of fish or of crustaceans, molluscs or other aquatic invertebrates
17 Sugars and sugar confectionery
18 Cocoa and cocoa preparations
19 Preparations of cereals, flour, starch or milk; pastrycooks' products
20 Preparations of vegetables, fruit, nuts or other parts of plants
21 Miscellaneous edible preparations
22 Beverages, spirits and vinegar
23 Residues and waste from the food industries; prepared animal fodder
24 Tobacco and manufactured tobacco substitutes
25 Salt; sulphur; earths and stone; plastering materials, lime and cement
26 Ores, slag and ash
27 Mineral fuels, mineral oils and products of their distillation; bituminous substances; mineralwaxes
28 Inorganic chemicals; organic or inorganic compounds of precious metals, of rare-earthmetals, of radioactive elements or of isotopes
29 Organic chemicals
30 Pharmaceutical products
31 Fertilisers
32 Tanning or dyeing extracts; tannins and their derivatives; dyes, pigments and other colouringmatter; paints and varnishes; putty and other mastics; inks

civitas.org.uk/research/europe • 71
Table A2: 2-digit HS Code Product Description
33 Essential oils and resinoids; perfumery, cosmetic or toilet preparations
34 Soap, organic surface-active agents, washing preparations, lubricating preparations, artificialwaxes, prepared waxes, polishing or scouring preparations, candles and similar articles,modelling pastes, ‘dental waxes’ and dental preparations with a basis of plaster
35 Albuminoidal substances; modified starches; glues; enzymes
36 Explosives; pyrotechnic products; matches; pyrophoric alloys; certain combustiblepreparations
37 Photographic or cinematographic goods
38 Miscellaneous chemical products
39 Plastics and articles thereof
40 Rubber and articles thereof
41 Raw hides and skins (other than furskins) and leather
42 Articles of leather; saddlery and harness; travel goods, handbags and similar containers;articles of animal gut (other than silkworm gut)
43 Furskins and artificial fur; manufactures thereof
44 Wood and articles of wood; wood charcoal
45 Cork and articles of cork
46 Manufactures of straw, of esparto or of other plaiting materials; basketware and wickerwork
47 Pulp of wood or of other fibrous cellulosic material; recovered (waste and scrap) paper orpaperboard
48 Paper and paperboard; articles of paper pulp, of paper or of paperboard
49 Printed books, newspapers, pictures and other products of the printing industry; manuscripts,typescripts and plans
50 Silk
51 Wool, fine or coarse animal hair; horsehair yarn and woven fabric
52 Cotton
53 Other vegetable textile fibres; paper yarn and woven fabrics of paper yarn
54 Man-made filaments; strip and the like of man-made textile materials
55 Man-made staple fibres
56 Wadding, felt and nonwovens; special yarns; twine, cordage, ropes and cables and articlesthereof
57 Carpets and other textile floor coverings
58 Special woven fabrics; tufted textile fabrics; lace; tapestries; trimmings; embroidery
59 Impregnated, coated, covered or laminated textile fabrics; textile articles of a kind suitablefor industrial use
60 Knitted or crocheted fabrics
61 Articles of apparel and clothing accessories, knitted or crocheted
62 Articles of apparel and clothing accessories, not knitted or crocheted

civitas.org.uk/research/europe • 72
Table A2: 2-digit HS Code Product Description
63 Other made-up textile articles; sets; worn clothing and worn textile articles; rags
64 Footwear, gaiters and the like; parts of such articles
65 Headgear and parts thereof
66 Umbrellas, sun umbrellas, walking sticks, seat-sticks, whips, riding-crops and parts thereof
67 Prepared feathers and down and articles made of feathers or of down; artificial flowers;articles of human hair
68 Articles of stone, plaster, cement, asbestos, mica or similar materials
69 Ceramic products
70 Glass and glassware
71 Natural or cultured pearls, precious or semi-precious stones, precious metals, metals cladwith precious metal, and articles thereof; imitation jewellery; coin
72 Iron and steel
73 Articles of iron or steel
74 Copper and articles thereof
75 Nickel and articles thereof
76 Aluminium and articles thereof
78 Lead and articles thereof
79 Zinc and articles thereof
80 Tin and articles thereof
81 Other base metals; cermets; articles thereof
82 Tools, implements, cutlery, spoons and forks, of base metal; parts thereof of base metal
83 Miscellaneous articles of base metal
84 Nuclear reactors, boilers, machinery and mechanical appliances; parts thereof
85 Electrical machinery and equipment and parts thereof; sound recorders and reproducers,television image and sound recorders and reproducers, and parts and accessories of sucharticles
86 Railway or tramway locomotives, rolling stock and parts thereof; railway or tramway trackfixtures and fittings and parts thereof; mechanical (including electromechanical) trafficsignalling equipment of all kinds
87 Vehicles other than railway or tramway rolling stock, and parts and accessories thereof
88 Aircraft, spacecraft, and parts thereof
89 Ships, boats and floating structures
90 Optical, photographic, cinematographic, measuring, checking, precision, medical or surgicalinstruments and apparatus; parts and accessories thereof
91 Clocks and watches and parts thereof
92 Musical instruments; parts and accessories of such articles
93 Arms and ammunition; parts and accessories thereof

civitas.org.uk/research/europe • 73
Table A2: 2-digit HS Code Product Description
94 Furniture; bedding, mattresses, mattress supports, cushions and similar stuffed furnishings;lamps and lighting fittings, not elsewhere specified or included; illuminated signs, illuminatednameplates and the like; prefabricated buildings
95 Toys, games and sports requisites; parts and accessories thereof
96 Miscellaneous manufactured articles
97 Works of art, collectors' pieces and antiques
99 Reserved for special uses by Contracting Parties

civitas.org.uk/research/europe • 74
Appendix II: Supporting data for mitigation proposals
Table B1: Expenditure on R&D by UK businesses (£ million)
2012 2014 2015
AGRICULTURAL PRODUCTS 558 566 562Agriculture, hunting and forestry; Fishing 121 135 139Food products and beverages; Tobacco products 437 431 423
SERIOUSLY-AFFECTED NON-AGRICULTURAL PRODUCTS 3,032 3,373 3,747Textiles, clothing and leather products 22 22 19Chemicals and chemical products 754 784 826Rubber and plastic products 99 127 137Non-ferrous metals 56 76 62Motor vehicles and parts 2,101 2,364 2,703
MIDDLE PRODUCTS 5,529 5,821 6,061Refined petroleum products and coke oven products 110 189 178Fabricated metal products except machinery and equipment 113 110 122Machinery and equipment 1,043 1,011 1,040Computers and peripheral equipment 260 276 316Electrical equipment 398 461 475Consumer electronics and communication equipment 877 912 989Precision instruments and optical products; photographic equipment 617 670 656Other transport equipment 64 78 93Shipbuilding 233 265 300Aerospace 1,639 1,666 1,701Other manufactured goods 175 183 191
DE MINIMIS PRODUCTS 4,370 4,246 4,525Extractive Industries 209 230 206Pulp, paper and paper products; Printing; Wood and straw products 48 48 48Pharmaceuticals 4,039 3,855 4,178Other non-metallic mineral products 47 62 54Casting of iron and steel 27 51 39
ExCLUDED SERVICES 5,129 5,811 5,989Sewerage, waste management, remediation activities 17 19 29Electricity, gas and water supply 123 148 155Construction 91 151 146Wholesale and retail trade 167 238 215Transport and storage, incl. postal and courier activities 35 38 49Telecommunications 840 959 825Miscellaneous business activities; Technical testing and analysis 994 1,104 1,104Computer programming and information service activities 1,977 2,229 2,381Research and development services 772 817 998Public administration 113 108 87
TOTAL 18,617 19,819 20,885
Source: ONS “UK Business Enterprise Research and Development”, Table 2 dataset released 17 November 2016.

civitas.org.uk/research/europe • 75
Table B2: Sources of funds for R&D performed in UK businesses, 2014 (£ million)
UK Own Govmt. Overseas Funds Other Total
AGRICULTURAL PRODUCTS 5 167 380 10 562Agriculture, hunting and forestry; Fishing 3 19 110 7 139Food products and beverages; Tobacco products 2 148 270 3 423
SERIOUSLY-AFFECTED NON-AGRICULTURAL PRODUCTS 47 466 3,162 72 3,747
Textiles, clothing and leather products - - 19 - 19Chemicals and chemical products 12 108 704 2 826Rubber and plastic products 2 - 135 - 137Non-ferrous metals 3 1 12 46 62Motor vehicles and parts 30 357 2,292 24 2,703
MIDDLE PRODUCTS 1,089 912 3,863 168 6,061Refined petroleum products and coke oven products n/a n/a 172 n/a 178Fabricated metal products except machinery and equipment 4 60 58 - 122Machinery and equipment 375 109 526 30 1,040Computers and peripheral equipment n/a 65 241 n/a 316Electrical equipment 41 37 376 21 475Consumer electronics and communication equipment 64 435 482 9 989Precision instruments and opticalproducts; photographic equipment 71 18 559 8 656Other transport equipment 22 n/a 59 n/a 93Shipbuilding 267 1 32 - 300Aerospace 242 167 1,192 99 1,701Other manufactured goods 3 20 166 1 191
DE MINIMIS PRODUCTS 11 1,316 3,125 73 4,525Extractive Industries 1 71 134 - 206Pulp, paper and paper products;Printing; Wood and straw products 1 - 47 - 48Pharmaceuticals 5 1,243 2,856 73 4,178Other non-metallic mineral products 1 2 52 - 54Casting of iron and steel 3 - 36 - 39
ExCLUDED SERVICES 651 928 4,130 283 5,989Sewerage, waste management,remediation activities - - 28 2 29Electricity, gas and water supply 1 24 124 7 155Construction 1 1 141 3 146Wholesale and retail trade 11 43 161 - 215Transport and storage, incl. postaland courier activities 1 13 28 8 49Telecommunications 7 121 695 2 825

civitas.org.uk/research/europe • 76
‘Other’ includes funds from other UK sources and international organisations. EU Commission grants fall within ‘Overseas’.
Source: ONS “UK Business Enterprise Research and Development”, Table 13 dataset released 17 November 2016.
Table B2: Sources of funds for R&D performed in UK businesses, 2014 (£ million)
UK Own Govmt. Overseas Funds Other Total
Miscellaneous business activities; Technical testing and analysis 202 131 710 61 1,104Computer programming andinformation service activities 46 471 1,855 9 2,381Research and development services 371 101 335 191 998Public administration 11 23 53 - 87
TOTAL 1,818 3,790 14,657 622 20,885
Table B3: Analysis of UK R&D expenditure, 2015 (£ million)
Salaries/ Other Total Capital Wages Current
AGRICULTURAL PRODUCTS 562 43 8% 265 47% 254 45%Agriculture, hunting and forestry; Fishing 139 12 9% 45 32% 82 59%Food products and beverages; Tobacco products 423 31 7% 220 52% 172 41%
SERIOUSLY-AFFECTED NON-AGRICULTURAL 3,747 326 9% 1,486 40% 1,933 52%
Textiles, clothing and leather products 19 - 0% 14 74% 5 26%Chemicals and chemical products 826 75 9% 401 49% 349 42%Rubber and plastic products 137 27 20% 64 47% 46 34%Non-ferrous metals 62 11 18% 37 60% 13 21%Motor vehicles and parts 2,703 213 8% 970 36% 1,520 56%
MIDDLE PRODUCTS 6,061 423 7% 3,020 50% 2,618 43%Refined petroleum productsand coke oven products 178 7 4% 53 30% 118 66%Fabricated metal products except machinery and equipment 122 12 10% 62 51% 48 39%Machinery and equipment 1,040 74 7% 548 53% 418 40%Computers and peripheral equipment 316 10 3% 191 60% 115 36%Electrical equipment 475 98 21% 206 43% 171 36%Consumer electronics andcommunication equipment 989 94 10% 500 51% 395 40%Precision instrumentsand optical products;photographic equipment 656 37 6% 330 50% 289 44%

civitas.org.uk/research/europe • 77
‘Other’ includes funds from other UK sources and international organisations. EU Commission grants fall within ‘Overseas’.
Source: ONS “UK Business Enterprise Research and Development”, Table 13 dataset released 17 November 2016.
Table B3: Analysis of UK R&D expenditure, 2015 (£ million)
Salaries/ Other Total Capital Wages Current
Other transport equipment 93 8 9% 41 44% 44 47%Shipbuilding 300 - 0% 148 49% 152 51%Aerospace 1,701 79 5% 809 48% 813 48%Other manufactured goods 191 4 2% 132 69% 55 29%
DE MINIMIS PRODUCTS 4,525 314 7% 1,969 44% 2,243 50%Extractive Industries 206 24 12% 108 52% 75 36%Pulp, paper and paper products;Printing; Wood and straw products 48 6 13% 25 52% 17 35%Pharmaceuticals 4,178 271 6% 1,796 43% 2,111 51%Other non-metallic mineral products 54 13 24% 28 52% 14 26%Casting of iron and steel 39 - 0% 12 31% 26 67%
ExCLUDED SERVICES 5,989 585 10% 3,496 58% 1,911 32%Sewerage, waste management,remediation activities 29 2 7% 25 86% 3 10%Electricity, gas and water supply 155 20 13% 69 45% 66 43%Construction 146 1 1% 112 77% 34 23%Wholesale and retail trade 215 9 4% 112 52% 95 44%Transport and storage, incl. postaland courier activities 49 1 2% 40 82% 8 16%Telecommunications 825 20 2% 481 58% 324 39%Miscellaneous business activities;Technical testing and analysis 1,104 33 3% 694 63% 377 34%Computer programming andinformation service activities 2,381 391 16% 1,369 57% 621 26%Research and development services 998 107 11% 538 54% 353 35%Public administration 87 1 1% 56 64% 30 34%
TOTAL 20,885 1,691 8% 10,238 49% 8,956 43%

civitas.org.uk/research/europe • 78
Table B4: UK R&D current expenditure by type, 2015 (£ million)
Experimental Total Basic Applied Development
AGRICULTURAL PRODUCTS 519 86 17% 240 46% 193 37%Agriculture, hunting and forestry;Fishing 127 - 0% 89 70% 38 30%Food products and beverages;Tobacco products 392 86 22% 151 39% 155 40%
SERIOUSLY-AFFECTED NON-AGRICULTURAL 3,421 50 1% 897 26% 2,473 72%
Textiles, clothing and leather products 19 - 0% 11 58% 8 42%Chemicals and chemical products 751 17 2% 347 46% 386 51%Rubber and plastic products 110 17 15% 77 70% 15 14%Non-ferrous metals 51 - 0% 25 49% 26 Motor vehicles and parts 2,490 16 1% 437 18% 2,038 82%
MIDDLE PRODUCTS 5,637 320 6% 2,598 46% 2,263 40%Refined petroleum products and coke oven products 171 n/a n/a 112 65%Fabricated metal products except machinery and equipment 110 1 1% 61 55% 49 45%Machinery and equipment 966 37 4% 438 45% 491 51%Computers and peripheral equipment 306 n/a 205 67% n/a Electrical equipment 377 15 4% 120 32% 242 64%Consumer electronics and communication equipment 895 26 3% 386 43% 483 54%Precision instruments and opticalproducts; photographic equipment 619 6 1% 330 53% 282 46%Other transport equipment 85 - 0% 45 53% 40 47%Shipbuilding 300 4 n/a n/a Aerospace 1,622 228 14% 954 59% 440 27%Other manufactured goods 186 3 2% 59 32% 124 67%
DE MINIMIS PRODUCTS 4,211 170 4% 1,660 39% 2,382 57%Extractive Industries 182 7 4% 142 78% 34 19%Pulp, paper and paper products; Printing; Wood and straw products 42 - 0% 10 24% 33 79%Pharmaceuticals 3,907 156 4% 1,494 38% 2,257 58%Other non-metallic mineral products 42 7 17% 14 33% 20 48%Casting of iron and steel 38 - 0% - 0% 38 100%
ExCLUDED SERVICES 5,407 602 11% 2,475 46% 2,331 43%Sewerage, waste management,remediation activities 28 - 0% 25 89% 3 11%Electricity, gas and water supply 135 29 21% 49 36% 57 42%Construction 145 23 16% 47 32% 75 52%Wholesale and retail trade 207 3 1% 128 62% 76 37%Transport and storage,incl. postal and courier activities 48 3 6% 22 46% 23 48%

civitas.org.uk/research/europe • 79
Source: ONS “UK Business Enterprise Research and Development”, Table 11 dataset released 17 November 2016.
Table B4: UK R&D current expenditure by type, 2015 (£ million)
Experimental Total Basic Applied Development
Telecommunications 805 1 0% 194 24% 611 76%Miscellaneous business activities;Technical testing and analysis 1,071 40 4% 748 70% 283 26%Computer programming andinformation service activities 1,991 205 10% 813 41% 972 49%Research and development services 891 280 31% 433 49% 178 20%Public administration 86 18 21% 16 19% 53 62%
TOTAL 19,194 1,276 7% 7,996 42% 9,922 52%

civitas.org.uk/research/europe • 80
Table B5: WTO Income test for UK local authorities
Compared to PassedArea Rate UK Average test?
UNITED KINGDOM 24,544.50
NORTh EAST Darlington 22,775.50 92.8% County Durham 15,164.50 61.8% Yes Hartlepool 18,276.00 74.5% Yes Middlesbrough 16,156.50 65.8% Yes Northumberland 14,791.50 60.3% Yes Redcar and Cleveland 16,156.50 65.8% Yes Stockton-on-Tees 18,276.00 74.5% Yes Gateshead 20,402.00 83.1% Yes Newcastle upon Tyne 20,402.00 83.1% Yes North Tyneside 20,402.00 83.1% Yes South Tyneside 20,402.00 83.1% Yes Sunderland 18,981.50 77.3% Yes
NORTh WEST Blackburn with Darwen 17,807.00 72.5% Yes Blackpool 14,849.50 60.5% Yes Cheshire East 29,596.50 120.6% Cheshire West and Chester 24,522.00 99.9% Halton 20,480.00 83.4% Yes Warrington 30,176.00 122.9% Allerdale 20,417.00 83.2% Yes Barrow-in-Furness 20,417.00 83.2% Yes Carlisle 22,027.50 89.7% Copeland 20,417.00 83.2% Yes Eden 22,027.50 89.7% South Lakeland 22,027.50 89.7% Bolton 15,060.00 61.4% Yes Bury 15,126.00 61.6% Yes Manchester 30,654.00 124.9% Oldham 15,126.00 61.6% Yes Rochdale 15,126.00 61.6% Yes Salford 26,838.50 109.3% Stockport 18,618.00 75.9% Yes Tameside 18,618.00 75.9% Yes Trafford 26,838.50 109.3% Wigan 15,060.00 61.4% Yes Burnley 16,192.50 66.0% Yes Chorley 17,182.50 70.0% Yes Fylde 25,193.00 102.6% Hyndburn 16,192.50 66.0% Yes Lancaster 15,464.00 63.0% Yes Pendle 16,192.50 66.0% Yes
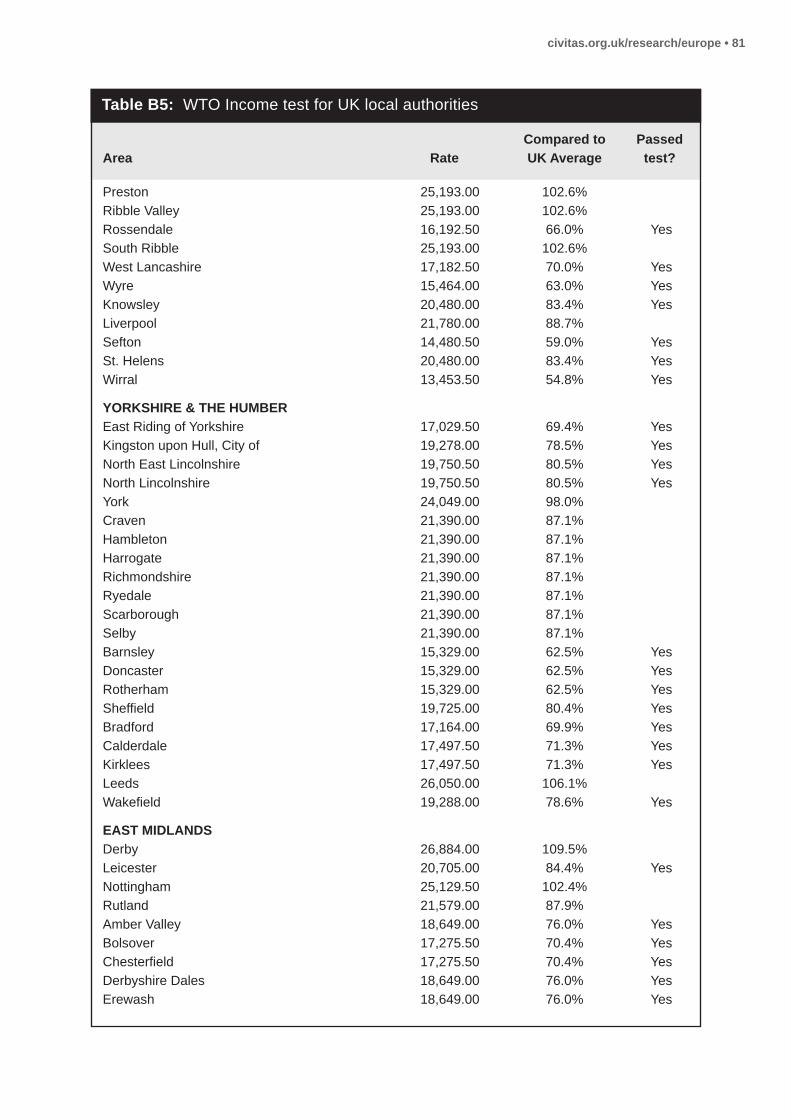
civitas.org.uk/research/europe • 81
Table B5: WTO Income test for UK local authorities
Compared to PassedArea Rate UK Average test?
Preston 25,193.00 102.6%Ribble Valley 25,193.00 102.6% Rossendale 16,192.50 66.0% Yes South Ribble 25,193.00 102.6% West Lancashire 17,182.50 70.0% Yes Wyre 15,464.00 63.0% Yes Knowsley 20,480.00 83.4% Yes Liverpool 21,780.00 88.7% Sefton 14,480.50 59.0% Yes St. Helens 20,480.00 83.4% Yes Wirral 13,453.50 54.8% Yes
YORKShIRE & ThE hUMBER East Riding of Yorkshire 17,029.50 69.4% Yes Kingston upon Hull, City of 19,278.00 78.5% Yes North East Lincolnshire 19,750.50 80.5% Yes North Lincolnshire 19,750.50 80.5% Yes York 24,049.00 98.0% Craven 21,390.00 87.1% Hambleton 21,390.00 87.1% Harrogate 21,390.00 87.1% Richmondshire 21,390.00 87.1% Ryedale 21,390.00 87.1% Scarborough 21,390.00 87.1% Selby 21,390.00 87.1% Barnsley 15,329.00 62.5% Yes Doncaster 15,329.00 62.5% Yes Rotherham 15,329.00 62.5% Yes Sheffield 19,725.00 80.4% Yes Bradford 17,164.00 69.9% Yes Calderdale 17,497.50 71.3% Yes Kirklees 17,497.50 71.3% Yes Leeds 26,050.00 106.1% Wakefield 19,288.00 78.6% Yes
EAST MIDLANDS Derby 26,884.00 109.5% Leicester 20,705.00 84.4% Yes Nottingham 25,129.50 102.4% Rutland 21,579.00 87.9% Amber Valley 18,649.00 76.0% Yes Bolsover 17,275.50 70.4% Yes Chesterfield 17,275.50 70.4% Yes Derbyshire Dales 18,649.00 76.0% Yes Erewash 18,649.00 76.0% Yes
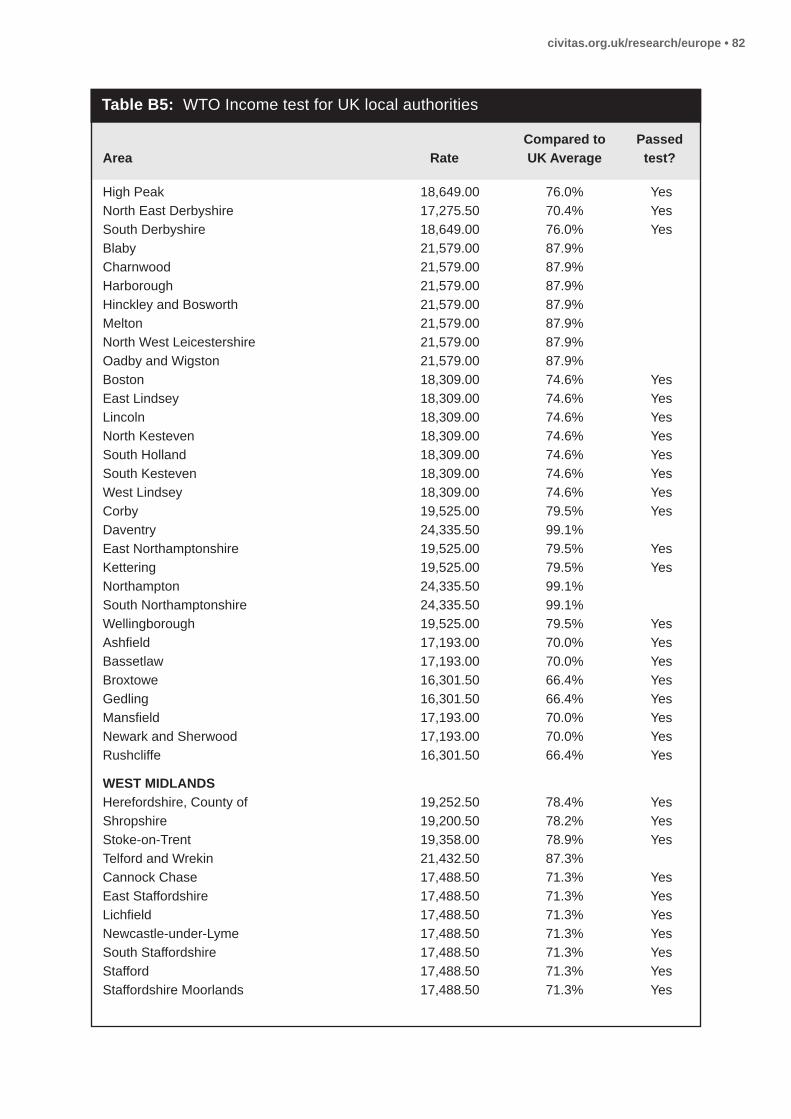
civitas.org.uk/research/europe • 82
Table B5: WTO Income test for UK local authorities
Compared to PassedArea Rate UK Average test?
High Peak 18,649.00 76.0% Yes North East Derbyshire 17,275.50 70.4% Yes South Derbyshire 18,649.00 76.0% Yes Blaby 21,579.00 87.9% Charnwood 21,579.00 87.9% Harborough 21,579.00 87.9% Hinckley and Bosworth 21,579.00 87.9% Melton 21,579.00 87.9% North West Leicestershire 21,579.00 87.9% Oadby and Wigston 21,579.00 87.9% Boston 18,309.00 74.6% Yes East Lindsey 18,309.00 74.6% Yes Lincoln 18,309.00 74.6% Yes North Kesteven 18,309.00 74.6% Yes South Holland 18,309.00 74.6% Yes South Kesteven 18,309.00 74.6% Yes West Lindsey 18,309.00 74.6% Yes Corby 19,525.00 79.5% Yes Daventry 24,335.50 99.1% East Northamptonshire 19,525.00 79.5% Yes Kettering 19,525.00 79.5% Yes Northampton 24,335.50 99.1% South Northamptonshire 24,335.50 99.1% Wellingborough 19,525.00 79.5% Yes Ashfield 17,193.00 70.0% Yes Bassetlaw 17,193.00 70.0% Yes Broxtowe 16,301.50 66.4% Yes Gedling 16,301.50 66.4% Yes Mansfield 17,193.00 70.0% Yes Newark and Sherwood 17,193.00 70.0% Yes Rushcliffe 16,301.50 66.4% Yes
WEST MIDLANDS Herefordshire, County of 19,252.50 78.4% Yes Shropshire 19,200.50 78.2% Yes Stoke-on-Trent 19,358.00 78.9% Yes Telford and Wrekin 21,432.50 87.3% Cannock Chase 17,488.50 71.3% Yes East Staffordshire 17,488.50 71.3% Yes Lichfield 17,488.50 71.3% Yes Newcastle-under-Lyme 17,488.50 71.3% Yes South Staffordshire 17,488.50 71.3% Yes Stafford 17,488.50 71.3% Yes Staffordshire Moorlands 17,488.50 71.3% Yes

civitas.org.uk/research/europe • 83
Table B5: WTO Income test for UK local authorities
Compared to PassedArea Rate UK Average test?
Tamworth 17,488.50 71.3% Yes North Warwickshire 25,693.00 104.7% Nuneaton and Bedworth 25,693.00 104.7% Rugby 25,693.00 104.7% Stratford-on-Avon 25,693.00 104.7% Warwick 25,693.00 104.7% Birmingham 21,008.00 85.6% Coventry 21,310.50 86.8% Dudley 14,840.50 60.5% Yes Sandwell 17,525.00 71.4% Yes Solihull 26,495.50 107.9% Walsall 15,823.50 64.5% Yes Wolverhampton 18,293.50 74.5% Yes Bromsgrove 19,296.00 78.6% Yes Malvern Hills 19,296.00 78.6% Yes Redditch 19,296.00 78.6% Yes Worcester 19,296.00 78.6% Yes Wychavon 19,296.00 78.6% Yes Wyre Forest 19,296.00 78.6% Yes
EAST Bedford 21,052.00 85.8% Central Bedfordshire 19,865.00 80.9% Yes Luton 21,807.00 88.8% Peterborough 27,270.00 111.1% Southend-on-Sea 16,663.50 67.9% Yes Thurrock 18,017.50 73.4% Yes Cambridge 26,557.50 108.2% East Cambridgeshire 26,557.50 108.2% Fenland 26,557.50 108.2% Huntingdonshire 26,557.50 108.2% South Cambridgeshire 26,557.50 108.2% Basildon 19,036.50 77.6% Yes Braintree 18,490.00 75.3% Yes Brentwood 23,842.00 97.1% Castle Point 19,036.50 77.6% Yes Chelmsford 23,842.00 97.1% Colchester 18,490.00 75.3% Yes Epping Forest 21,529.50 87.7% Harlow 21,529.50 87.7% Maldon 23,842.00 97.1% Rochford 19,036.50 77.6% Yes Tendring 18,490.00 75.3% Yes Uttlesford 21,529.50 87.7%
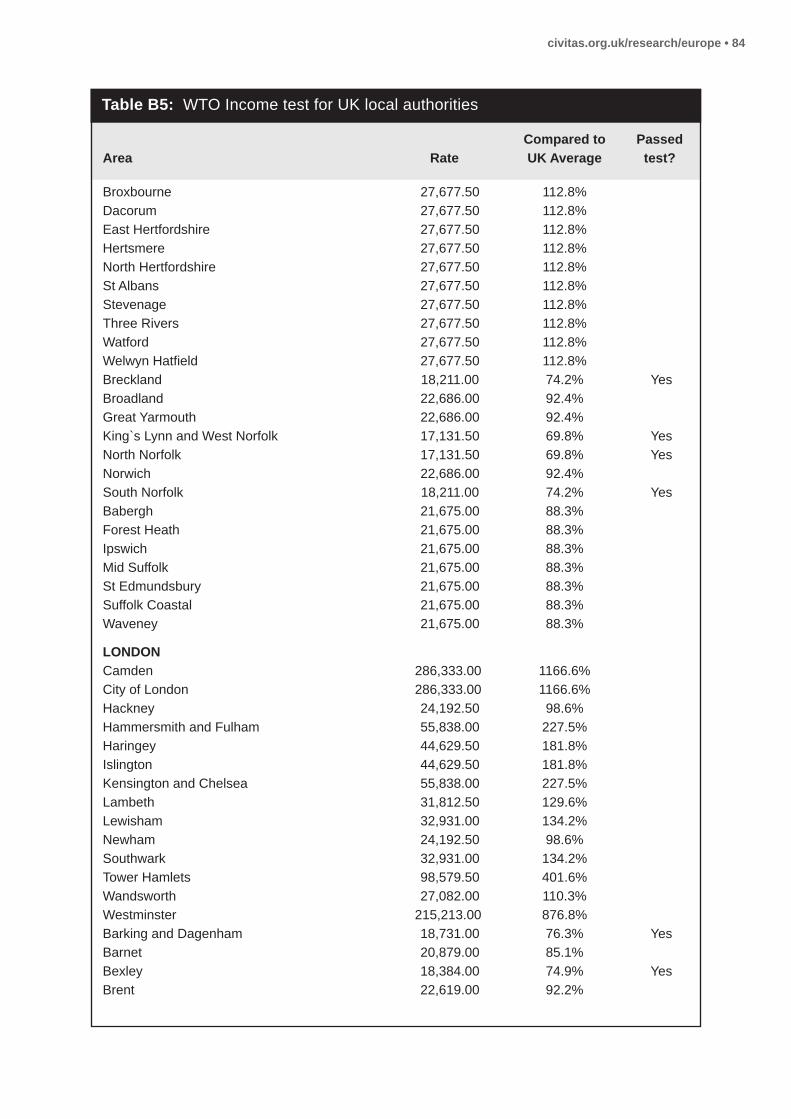
civitas.org.uk/research/europe • 84
Table B5: WTO Income test for UK local authorities
Compared to PassedArea Rate UK Average test?
Broxbourne 27,677.50 112.8% Dacorum 27,677.50 112.8% East Hertfordshire 27,677.50 112.8% Hertsmere 27,677.50 112.8% North Hertfordshire 27,677.50 112.8% St Albans 27,677.50 112.8% Stevenage 27,677.50 112.8% Three Rivers 27,677.50 112.8% Watford 27,677.50 112.8% Welwyn Hatfield 27,677.50 112.8% Breckland 18,211.00 74.2% Yes Broadland 22,686.00 92.4% Great Yarmouth 22,686.00 92.4% King`s Lynn and West Norfolk 17,131.50 69.8% Yes North Norfolk 17,131.50 69.8% Yes Norwich 22,686.00 92.4% South Norfolk 18,211.00 74.2% Yes Babergh 21,675.00 88.3% Forest Heath 21,675.00 88.3% Ipswich 21,675.00 88.3% Mid Suffolk 21,675.00 88.3% St Edmundsbury 21,675.00 88.3% Suffolk Coastal 21,675.00 88.3% Waveney 21,675.00 88.3%
LONDON Camden 286,333.00 1166.6% City of London 286,333.00 1166.6% Hackney 24,192.50 98.6% Hammersmith and Fulham 55,838.00 227.5% Haringey 44,629.50 181.8% Islington 44,629.50 181.8% Kensington and Chelsea 55,838.00 227.5% Lambeth 31,812.50 129.6% Lewisham 32,931.00 134.2% Newham 24,192.50 98.6% Southwark 32,931.00 134.2% Tower Hamlets 98,579.50 401.6% Wandsworth 27,082.00 110.3% Westminster 215,213.00 876.8% Barking and Dagenham 18,731.00 76.3% Yes Barnet 20,879.00 85.1% Bexley 18,384.00 74.9% Yes Brent 22,619.00 92.2%

civitas.org.uk/research/europe • 85
Table B5: WTO Income test for UK local authorities
Compared to PassedArea Rate UK Average test?
Bromley 20,905.00 85.2%Croydon 18,961.00 77.3% Yes Ealing 24,250.50 98.8% Enfield 19,952.50 81.3% Yes Greenwich 18,384.00 74.9% Yes Harrow 30,739.00 125.2% Havering 18,731.00 76.3% Yes Hillingdon 30,739.00 125.2% Hounslow 31,883.00 129.9% Kingston upon Thames 23,748.50 96.8% Merton 23,748.50 96.8% Redbridge 16,346.50 66.6% Yes Richmond upon Thames 31,883.00 129.9% Sutton 23,748.50 96.8% Waltham Forest 16,346.50 66.6% Yes
SOUTh EAST Bracknell Forest 38,594.50 157.2% Brighton and Hove 23,810.00 97.0% Isle of Wight 17,062.00 69.5% Yes Medway 16,905.50 68.9% Yes Milton Keynes 38,876.00 158.4% Portsmouth 25,545.50 104.1% Reading 38,594.50 157.2% Slough 38,594.50 157.2% Southampton 23,256.50 94.8% West Berkshire 38,594.50 157.2% Windsor and Maidenhead 38,594.50 157.2% Wokingham 38,594.50 157.2% Aylesbury Vale 27,777.00 113.2% Chiltern 27,777.00 113.2% South Bucks 27,777.00 113.2% Wycombe 27,777.00 113.2% Eastbourne 17,103.50 69.7% Yes Hastings 17,103.50 69.7% Yes Lewes 17,103.50 69.7% Yes Rother 17,103.50 69.7% Yes Wealden 17,103.50 69.7% Yes Basingstoke and Deane 29,751.50 121.2% East Hampshire 27,182.50 110.7% Eastleigh 22,703.00 92.5% Fareham 22,703.00 92.5% Gosport 22,703.00 92.5% Hart 29,751.50 121.2%

civitas.org.uk/research/europe • 86
Table B5: WTO Income test for UK local authorities
Compared to PassedArea Rate UK Average test?
Havant 22,703.00 92.5% New Forest 27,182.50 110.7% Rushmoor 29,751.50 121.2% Test Valley 27,182.50 110.7% Winchester 27,182.50 110.7% Ashford 22,141.50 90.2% Canterbury 16,976.00 69.2% Yes Dartford 19,866.50 80.9% Yes Dover 16,976.00 69.2% Yes Gravesham 19,866.50 80.9% Yes Maidstone 22,141.50 90.2% Sevenoaks 24,208.50 98.6% Shepway 16,976.00 69.2% Yes Swale 19,866.50 80.9% Yes Thanet 16,976.00 69.2% Yes Tonbridge and Malling 24,208.50 98.6% Tunbridge Wells 24,208.50 98.6% Cherwell 29,917.50 121.9% Oxford 29,917.50 121.9% South Oxfordshire 29,917.50 121.9% Vale of White Horse 29,917.50 121.9% West Oxfordshire 29,917.50 121.9% Elmbridge 32,738.00 133.4% Epsom and Ewell 30,202.00 123.0% Guildford 32,738.00 133.4% Mole Valley 30,202.00 123.0% Reigate and Banstead 30,202.00 123.0% Runnymede 32,738.00 133.4% Spelthorne 32,738.00 133.4% Surrey Heath 32,738.00 133.4% Tandridge 30,202.00 123.0% Waverley 32,738.00 133.4% Woking 32,738.00 133.4% Adur 21,084.00 85.9% Arun 21,084.00 85.9% Chichester 21,084.00 85.9% Crawley 28,456.00 115.9% Horsham 28,456.00 115.9% Mid Sussex 28,456.00 115.9% Worthing 21,084.00 85.9%
SOUTh WEST Bath and North East Somerset 25,967.00 105.8% Bournemouth 22,849.00 93.1%

civitas.org.uk/research/europe • 87
Table B5: WTO Income test for UK local authorities
Compared to PassedArea Rate UK Average test?
Bristol, City of 29,247.50 119.2% Cornwall 17,290.50 70.4% Yes Isles of Scilly 17,290.50 70.4% Yes North Somerset 25,967.00 105.8% Plymouth 19,650.50 80.1% Yes Poole 22,849.00 93.1% South Gloucestershire 25,967.00 105.8% Swindon 30,451.50 124.1% Torbay 15,342.50 62.5% Yes Wiltshire 19,913.00 81.1% Yes East Devon 19,907.50 81.1% Yes Exeter 19,907.50 81.1% Yes Mid Devon 19,907.50 81.1% Yes North Devon 19,907.50 81.1% Yes South Hams 19,907.50 81.1% Yes Teignbridge 19,907.50 81.1% Yes Torridge 19,907.50 81.1% Yes West Devon 19,907.50 81.1% Yes Christchurch 19,293.00 78.6% Yes East Dorset 19,293.00 78.6% Yes North Dorset 19,293.00 78.6% Yes Purbeck 19,293.00 78.6% Yes West Dorset 19,293.00 78.6% Yes Weymouth and Portland 19,293.00 78.6% Yes Cheltenham 24,086.50 98.1% Cotswold 24,086.50 98.1% Forest of Dean 24,086.50 98.1% Gloucester 24,086.50 98.1% Stroud 24,086.50 98.1% Tewkesbury 24,086.50 98.1% Mendip 19,279.50 78.5% Yes Sedgemoor 19,279.50 78.5% Yes South Somerset 19,279.50 78.5% Yes Taunton Deane 19,279.50 78.5% Yes West Somerset 19,279.50 78.5% Yes
WALES Anglesey 12,961.50 52.8% Yes Gwynedd 18,566.00 75.6% Yes Conwy 15,273.50 62.2% Yes Denbighshire 15,273.50 62.2% Yes Flintshire 20,916.50 85.2% Wrexham 20,916.50 85.2% Powys 15,894.50 64.8% Yes

civitas.org.uk/research/europe • 88
Table B5: WTO Income test for UK local authorities
Compared to PassedArea Rate UK Average test?
Ceredigion 15,439.00 62.9% Yes Pembrokeshire 15,439.00 62.9% Yes Carmarthenshire 15,439.00 62.9% Yes Swansea 17,918.50 73.0% Yes Neath Port Talbot 15,987.50 65.1% Yes Bridgend 15,987.50 65.1% Yes The Vale of Glamorgan 22,079.50 90.0% Cardiff 22,079.50 90.0% Rhondda, Cynon, Taff 15,404.50 62.8% Yes Merthyr Tydfil 15,404.50 62.8% Yes Caerphilly 13,391.50 54.6% Yes Blaenau Gwent 13,391.50 54.6% Yes Torfaen 13,391.50 54.6% Yes Monmouthshire 19,541.50 79.6% Yes Newport 19,541.50 79.6% Yes
SCOTLAND Aberdeen City 36,923.50 150.4% Aberdeenshire 36,923.50 150.4% Angus 19,004.50 77.4% Yes Argyll and Bute 19,970.00 81.4% Yes Clackmannanshire 17,026.50 69.4% Yes Dumfries & Galloway 16,970.50 69.1% Yes Dundee City 19,004.50 77.4% Yes East Ayrshire 13,289.50 54.1% Yes East Dunbartonshire 14,472.50 59.0% Yes East Lothian 14,921.00 60.8% Yes East Renfrewshire 17,015.50 69.3% Yes Edinburgh, City of 35,371.50 144.1% Eilean Siar 16,107.00 65.6% Yes Falkirk 17,195.00 70.1% Yes Fife 17,026.50 69.4% Yes Glasgow City 31,258.50 127.4% Highland 16,420.00 66.9% Yes Inverclyde 17,015.50 69.3% Yes Midlothian 14,921.00 60.8% Yes Moray 23,680.50 96.5% North Ayrshire 13,289.50 54.1% Yes North Lanarkshire 17,589.00 71.7% Yes Orkney Islands 19,646.50 80.0% Yes Perth and Kinross 22,138.00 90.2% Renfrewshire 17,015.50 69.3% Yes Scottish Borders 16,749.00 68.2% Yes Shetland Islands 25,979.50 105.8%

civitas.org.uk/research/europe • 89
Table B5: WTO Income test for UK local authorities
Compared to PassedArea Rate UK Average test?
South Ayrshire 20,695.00 84.3% Yes South Lanarkshire 17,328.00 70.6% Yes Stirling 22,138.00 90.2% West Dunbartonshire 14,472.50 59.0% Yes West Lothian 19,375.50 78.9% Yes
NORThERN IRELAND Antrim and Newtownabbey 16,986.50 69.2% YesArmagh City, Banbridge and Craigavon 16,986.50 69.2% Yes Belfast 34,455.50 140.4% Causeway Coast and Glens 14,196.00 57.8% YesDerry City and Strabane 14,196.00 57.8% Yes Fermanagh and Omagh 15,574.00 63.5% YesLisburn and Castlereagh 15,113.00 61.6% YesMid and East Antrim 16,986.50 69.2% Yes Mid Ulster 15,574.00 63.5% Yes Newry, Mourne and Down 16,986.50 69.2% Yes Ards and North Down 16,986.50 69.2% Yes
Table B6: WTO Unemployment test for UK local authorities
Compared to PassedArea Rate UK Average test?
UNITED KINGDOM Unemployment Rate 6.5% Claimant Count Rate 2.2%
NORTh EAST Darlington 7.6% 117.2% YesCounty Durham 8.8% 135.2% YesHartlepool 12.6% 194.1% YesMiddlesbrough 13.0% 200.5% YesNorthumberland 6.0% 92.9% Redcar and Cleveland 9.6% 148.0% YesStockton-on-Tees 8.0% 122.7% YesGateshead 7.8% 119.8% YesNewcastle upon Tyne 10.2% 157.8% YesNorth Tyneside 6.6% 102.1% South Tyneside 10.0% 154.0% YesSunderland 10.4% 160.8% Yes
Source: see the Technical Note in Appendix III

civitas.org.uk/research/europe • 90
Table B6: WTO Unemployment test for UK local authorities
NORTh WEST Blackburn with Darwen 7.9% 122.3% YesBlackpool 7.6% 117.1% YesCheshire East 4.6% 70.4% Cheshire West and Chester 4.6% 71.4% Halton 7.2% 111.6% YesWarrington 4.7% 72.5% Allerdale 5.6% 86.1% Barrow-in-Furness 6.9% 106.7% Carlisle 7.0% 108.7% Copeland 5.9% 91.4% Eden 3.0% 46.6% South Lakeland 3.7% 56.5% Bolton 7.9% 121.8% YesBury 6.6% 102.1% Manchester 9.2% 142.7% YesOldham 9.1% 140.9% YesRochdale 8.6% 132.7% YesSalford 10.0% 153.9% YesStockport 5.3% 82.4% Tameside 7.3% 111.9% YesTrafford 6.0% 92.5% Wigan 7.3% 112.6% YesBurnley 10.8% 166.4% YesChorley 3.9% 59.7% Fylde 4.1% 63.5% Hyndburn 6.8% 104.3% Lancaster 3.6% 56.0% Pendle 8.7% 135.0% YesPreston 5.5% 85.0% Ribble Valley 7.0% 108.5% Rossendale 8.5% 131.0% YesSouth Ribble 4.9% 76.2% West Lancashire 4.9% 74.9% Wyre 7.4% 113.6% YesKnowsley 8.4% 129.6% YesLiverpool 10.8% 166.8% YesSefton 6.5% 100.7% St. Helens 8.5% 130.5% YesWirral 6.9% 107.2%
YORKShIRE & ThE hUMBER East Riding of Yorkshire 5.5% 84.8% Kingston upon Hull, City of 11.6% 178.5% Yes
Compared to PassedArea Rate UK Average test?

civitas.org.uk/research/europe • 91
Table B6: WTO Unemployment test for UK local authorities
North East Lincolnshire 9.2% 142.3% YesNorth Lincolnshire 5.2% 80.1% York 4.4% 67.6% Craven 5.7% 88.0% Hambleton 5.0% 77.7% Harrogate 2.8% 43.3% Richmondshire 5.7% 87.2% Ryedale 55.2% Scarborough 9.5% 146.6% YesSelby 4.4% 67.6% Barnsley 8.4% 130.0% YesDoncaster 9.3% 143.1% YesRotherham 9.2% 141.4% YesSheffield 9.3% 144.3% YesBradford 9.9% 152.5% YesCalderdale 6.4% 98.7% Kirklees 6.5% 100.0% Leeds 8.0% 122.8% YesWakefield 8.0% 123.1% Yes
EAST MIDLANDS Derby 8.3% 127.6% YesLeicester 11.2% 173.0% YesNottingham 10.8% 167.4% YesRutland 3.9% 59.7% Amber Valley 3.8% 59.4% Bolsover 5.6% 87.1% Chesterfield 5.1% 78.3% Derbyshire Dales 3.8% 59.4% Erewash 6.6% 101.8% High Peak 5.8% 89.2% North East Derbyshire 3.3% 50.3% South Derbyshire 5.4% 82.7% Blaby 4.7% 72.1% Charnwood 4.3% 66.4% Harborough 5.0% 77.2% Hinckley and Bosworth 5.1% 78.1% Melton 5.0% 77.7% North West Leicestershire 4.6% 71.0% Oadby and Wigston 4.9% 75.7% Boston 4.9% 75.6% East Lindsey 8.7% 134.7% YesLincoln 6.2% 95.8% North Kesteven 5.4% 82.6%
Compared to PassedArea Rate UK Average test?

civitas.org.uk/research/europe • 92
Table B6: WTO Unemployment test for UK local authorities
South Holland 4.2% 64.5% South Kesteven 5.6% 85.7% West Lindsey 5.5% 84.9% Corby 10.0% 153.9% YesDaventry 3.9% 59.8% East Northamptonshire 8.7% 133.6% YesKettering 5.0% 76.4% Northampton 5.3% 81.7% South Northamptonshire 2.3% 35.2% Wellingborough 8.7% 134.9% YesAshfield 5.6% 86.0% Bassetlaw 5.7% 87.3% Broxtowe 6.4% 98.5% Gedling 6.7% 103.3% Mansfield 10.4% 160.1% YesNewark and Sherwood 5.7% 87.5% Rushcliffe 4.0% 61.1%
WEST MIDLANDS Herefordshire, County of 4.5% 69.4% Shropshire 4.9% 75.9% Stoke-on-Trent 8.3% 127.6% YesTelford and Wrekin 6.6% 102.2% Cannock Chase 5.0% 77.2% East Staffordshire 2.6% 40.5% Lichfield 5.3% 81.8% Newcastle-under-Lyme 4.9% 75.4% South Staffordshire 6.0% 92.4% Stafford 3.1% 47.5% Staffordshire Moorlands 4.5% 69.3% Tamworth 9.7% 149.3% YesNorth Warwickshire 8.9% 137.6% YesNuneaton and Bedworth 5.4% 83.6% Rugby 3.2% 49.8% Stratford-on-Avon 2.1% 32.8% Warwick 3.3% 51.3% Birmingham 12.1% 187.5% YesCoventry 6.4% 98.3% Dudley 8.3% 128.8% YesSandwell 10.2% 156.9% YesSolihull 5.3% 81.4% Walsall 9.5% 147.3% YesWolverhampton 12.1% 186.3% YesBromsgrove 4.0% 62.0%
Compared to PassedArea Rate UK Average test?
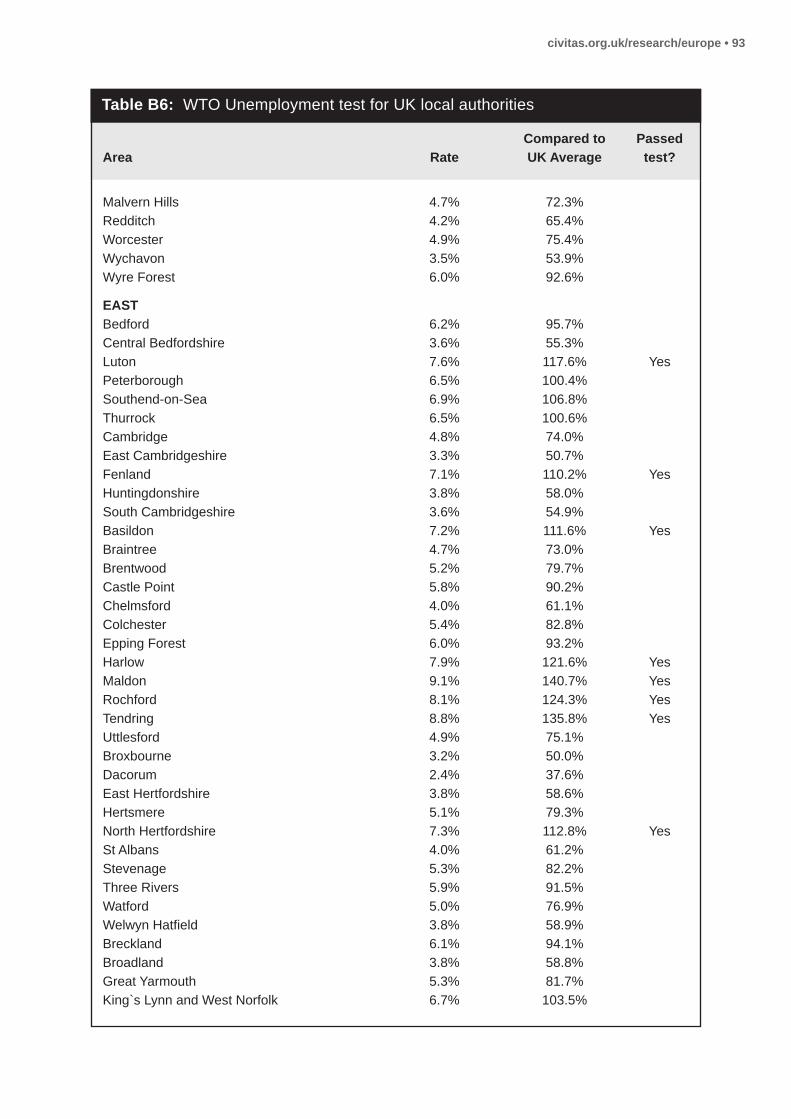
civitas.org.uk/research/europe • 93
Table B6: WTO Unemployment test for UK local authorities
Malvern Hills 4.7% 72.3% Redditch 4.2% 65.4% Worcester 4.9% 75.4% Wychavon 3.5% 53.9% Wyre Forest 6.0% 92.6%
EAST Bedford 6.2% 95.7% Central Bedfordshire 3.6% 55.3% Luton 7.6% 117.6% YesPeterborough 6.5% 100.4% Southend-on-Sea 6.9% 106.8% Thurrock 6.5% 100.6% Cambridge 4.8% 74.0% East Cambridgeshire 3.3% 50.7% Fenland 7.1% 110.2% YesHuntingdonshire 3.8% 58.0% South Cambridgeshire 3.6% 54.9% Basildon 7.2% 111.6% YesBraintree 4.7% 73.0% Brentwood 5.2% 79.7% Castle Point 5.8% 90.2% Chelmsford 4.0% 61.1% Colchester 5.4% 82.8% Epping Forest 6.0% 93.2% Harlow 7.9% 121.6% YesMaldon 9.1% 140.7% YesRochford 8.1% 124.3% YesTendring 8.8% 135.8% YesUttlesford 4.9% 75.1% Broxbourne 3.2% 50.0% Dacorum 2.4% 37.6% East Hertfordshire 3.8% 58.6% Hertsmere 5.1% 79.3% North Hertfordshire 7.3% 112.8% YesSt Albans 4.0% 61.2% Stevenage 5.3% 82.2% Three Rivers 5.9% 91.5% Watford 5.0% 76.9% Welwyn Hatfield 3.8% 58.9% Breckland 6.1% 94.1% Broadland 3.8% 58.8% Great Yarmouth 5.3% 81.7% King`s Lynn and West Norfolk 6.7% 103.5%
Compared to PassedArea Rate UK Average test?

civitas.org.uk/research/europe • 94
Table B6: WTO Unemployment test for UK local authorities
North Norfolk 4.0% 61.7% Norwich 5.8% 88.9% South Norfolk 5.2% 80.2% Babergh 6.3% 97.4% Forest Heath 3.9% 60.9% Ipswich 7.5% 116.2% YesMid Suffolk 2.7% 41.6% St Edmundsbury 3.3% 51.2% Suffolk Coastal 4.2% 65.4% Waveney 9.4% 145.7% Yes
LONDON Camden 6.2% 95.0% City of London 52.2% Hackney 8.3% 127.5% YesHammersmith and Fulham 5.4% 82.9% Haringey 7.5% 116.0% YesIslington 6.9% 105.9% Kensington and Chelsea 6.1% 94.4% Lambeth 6.7% 103.8% Lewisham 7.2% 111.8% YesNewham 10.3% 159.1% YesSouthwark 9.3% 143.3% YesTower Hamlets 10.9% 168.0% YesWandsworth 6.3% 97.3% Westminster 7.1% 109.3% Barking and Dagenham 12.1% 187.5% YesBarnet 6.4% 99.2% Bexley 7.1% 109.7% Brent 8.5% 131.6% YesBromley 5.5% 84.8% Croydon 6.9% 107.1% Ealing 8.6% 132.5% YesEnfield 6.3% 96.5% Greenwich 9.8% 151.3% YesHarrow 6.5% 101.0% Havering 6.8% 104.9% Hillingdon 7.0% 107.4% Hounslow 6.4% 99.4% Kingston upon Thames 5.3% 82.2% Merton 5.5% 84.1% Redbridge 8.5% 131.7% YesRichmond upon Thames 4.3% 66.1% Sutton 5.5% 84.7% Waltham Forest 7.3% 113.1% Yes
Compared to PassedArea Rate UK Average test?

civitas.org.uk/research/europe • 95
Table B6: WTO Unemployment test for UK local authorities
SOUTh EAST Bracknell Forest 3.2% 49.5% Brighton and Hove 6.9% 106.7% Isle of Wight 6.9% 106.8% Medway 9.3% 144.2% YesMilton Keynes 6.7% 102.9% Portsmouth 6.2% 95.8% Reading 5.0% 77.7% Slough 6.8% 105.1% Southampton 6.8% 104.5% West Berkshire 3.5% 54.2% Windsor and Maidenhead 3.6% 55.5% Wokingham 3.4% 52.0% Aylesbury Vale 3.3% 51.3% Chiltern 3.5% 53.6% South Bucks 5.0% 76.5% Wycombe 5.8% 90.0% Eastbourne 6.4% 99.0% Hastings 8.0% 122.9% YesLewes 4.7% 72.5% Rother 3.6% 55.2% Wealden 4.2% 64.1% Basingstoke and Deane 4.3% 66.6% East Hampshire 5.3% 81.8% Eastleigh 3.8% 59.3% Fareham 5.9% 91.2% Gosport 6.5% 100.6% Hart 2.9% 45.1% Havant 5.4% 83.4% New Forest 4.1% 63.1% Rushmoor 4.3% 65.9% Test Valley 3.6% 55.4% Winchester 5.1% 78.0% Ashford 5.3% 81.9% Canterbury 10.4% 159.9% YesDartford 5.5% 84.2% Dover 8.7% 133.5% YesGravesham 7.3% 113.3% YesMaidstone 5.4% 83.9% Sevenoaks 4.4% 68.2% Shepway 5.1% 78.4% Swale 5.9% 91.2% Thanet 7.9% 121.8% Yes
Compared to PassedArea Rate UK Average test?

civitas.org.uk/research/europe • 96
Table B6: WTO Unemployment test for UK local authorities
Tonbridge and Malling 3.5% 54.3% Tunbridge Wells 3.9% 59.7% Cherwell 3.0% 46.5% Oxford 5.3% 81.4% South Oxfordshire 2.9% 45.5% Vale of White Horse 3.8% 58.4% West Oxfordshire 4.9% 75.9% Elmbridge 4.3% 65.6% Epsom and Ewell 5.8% 89.0% Guildford 5.4% 83.8% Mole Valley 4.8% 74.1% Reigate and Banstead 3.4% 52.1% Runnymede 4.1% 63.8% Spelthorne 4.5% 69.2% Surrey Heath 5.7% 87.8% Tandridge 6.0% 92.1% Waverley 4.7% 73.0% Woking 5.8% 90.0% Adur 7.0% 107.5% Arun 3.2% 49.8% Chichester 4.6% 70.5% Crawley 7.8% 119.7% YesHorsham 3.6% 56.3% Mid Sussex 3.3% 50.8% Worthing 4.9% 75.8%
SOUTh WEST Bath and North East Somerset 4.7% 73.0% Bournemouth 5.1% 78.5% Bristol, City of 7.1% 109.1% Cornwall 5.4% 83.5% Isles of Scilly 28.4% North Somerset 4.3% 65.7% Plymouth 7.7% 118.1% YesPoole 3.6% 55.5% South Gloucestershire 4.3% 65.7% Swindon 5.2% 79.9% Torbay 6.2% 95.3% Wiltshire 4.9% 76.2% East Devon 3.4% 52.4% Exeter 4.1% 63.1% Mid Devon 3.3% 50.2% North Devon 4.7% 72.3% South Hams 6.9% 106.6%
Compared to PassedArea Rate UK Average test?

civitas.org.uk/research/europe • 97
Table B6: WTO Unemployment test for UK local authorities
Teignbridge 4.3% 66.4% Torridge 7.5% 116.3% YesWest Devon 4.7% 72.9% Christchurch 4.3% 66.8% East Dorset 3.2% 49.8% North Dorset 3.1% 47.6% Purbeck 7.4% 113.8% YesWest Dorset 5.6% 86.2% Weymouth and Portland 8.4% 129.4% YesCheltenham 4.9% 75.5% Cotswold 3.3% 50.3% Forest of Dean 6.7% 102.9% Gloucester 7.8% 119.9% YesStroud 3.7% 57.8% Tewkesbury 4.2% 64.8% Mendip 4.2% 65.3% Sedgemoor 6.2% 95.4% South Somerset 3.8% 59.4% Taunton Deane 4.0% 62.4% West Somerset 56.7%
WALES Anglesey 6.8% 104.5% Gwynedd 6.1% 94.1% Conwy 5.1% 79.0% Denbighshire 6.6% 101.5% Flintshire 5.0% 77.2% Wrexham 5.4% 83.2% Powys 3.3% 50.8% Ceredigion 4.0% 61.5% Pembrokeshire 6.2% 96.0% Carmarthenshire 7.1% 109.8% Swansea 8.5% 131.4% YesNeath Port Talbot 7.7% 119.1% YesBridgend 7.0% 108.6% The Vale of Glamorgan 7.3% 112.5% YesCardiff 7.6% 117.4% YesRhondda, Cynon, Taff 8.7% 133.6% YesMerthyr Tydfil 8.5% 131.8% YesCaerphilly 8.3% 127.7% YesBlaenau Gwent 12.3% 190.3% YesTorfaen 9.0% 138.4% YesMonmouthshire 4.7% 72.2% Newport 7.4% 114.0% Yes
Compared to PassedArea Rate UK Average test?

civitas.org.uk/research/europe • 98
Table B6: WTO Unemployment test for UK local authorities
SCOTLAND Aberdeen City 4.6% 70.5% Aberdeenshire 3.5% 54.0% Angus 6.8% 105.0% Argyll and Bute 5.0% 76.8% Clackmannanshire 8.5% 131.1% YesDumfries and Galloway 5.9% 90.8% Dundee City 10.8% 167.2% YesEast Ayrshire 10.1% 155.7% YesEast Dunbartonshire 4.4% 68.3% East Lothian 5.6% 86.5% East Renfrewshire 5.9% 91.0% Edinburgh, City of 5.6% 86.1% Eilean Siar 5.9% 91.5% Falkirk 6.7% 102.7% Fife 7.7% 118.6% YesGlasgow City 9.5% 146.2% YesHighland 4.5% 69.3% Inverclyde 7.4% 113.5% YesMidlothian 5.2% 80.9% Moray 4.9% 75.7% North Ayrshire 11.0% 169.5% YesNorth Lanarkshire 8.5% 130.7% YesOrkney Islands 2.7% 41.7% Perth and Kinross 5.4% 83.6% Renfrewshire 6.5% 101.0% Scottish Borders 3.9% 59.8% Shetland Islands 5.5% 84.9% South Ayrshire 6.9% 105.9% South Lanarkshire 6.5% 100.6% Stirling 5.8% 89.5% West Dunbartonshire 8.4% 130.2% YesWest Lothian 6.7% 104.1%
NORThERN IRELAND Overall unemployment rate 6.8% Overall claimant count 4.6% Antrim and Newtownabbey 147.8% YesArmagh City, Banbridge and Craigavon 174.6% YesBelfast 273.1% YesCauseway Coast and Glens 207.5% YesDerry City and Strabane 349.3% YesFermanagh and Omagh 194.0% YesLisburn and Castlereagh 122.4% Yes
Compared to PassedArea Rate UK Average test?

civitas.org.uk/research/europe • 99
Table B6: WTO Unemployment test for UK local authorities
Mid and East Antrim 162.7% YesMid Ulster 153.7% YesNewry, Mourne and Down 200.0% YesArds and North Down 159.7% Yes
Compared to PassedArea Rate UK Average test?
Table B7: Potential New Assisted Areas
NORTh EAST Northumberland Darlington County DurhamNorth Tyneside Hartlepool Middlesbrough Redcar and Cleveland Stockton-on-Tees Gateshead Newcastle upon Tyne South Tyneside Sunderland
NORTh WEST Allerdale Manchester Blackburn with DarwenBarrow-in-Furness Salford BlackpoolCopeland Liverpool HaltonBury BoltonStockport OldhamChorley RochdaleHyndburn TamesideLancaster WiganWest Lancashire BurnleySefton PendleWirral Rossendale Wyre Knowsley St. Helens
YORKShIRE & ThE hUMBER East Riding of Yorkshire Scarborough Kingston upon Hull, City ofNorth Lincolnshire Leeds North East LincolnshireCalderdale BarnsleyKirklees Doncaster
Area I Area II Area III
Source: see the Technical Note in Appendix III

civitas.org.uk/research/europe • 100
Table B7: Potential New Assisted Areas
Rotherham Sheffield Bradford Wakefield
EAST MIDLANDS Amber Valley Derby LeicesterBolsover Nottingham East LindseyChesterfield CorbyDerbyshire Dales East NorthamptonshireErewash WellingboroughHigh Peak MansfieldNorth East Derbyshire South Derbyshire Boston Lincoln North Kesteven South Holland South Kesteven West Lindsey Kettering Ashfield Bassetlaw Broxtowe Gedling Newark and Sherwood Rushcliffe WEST MIDLANDS Herefordshire, County of North Warwickshire Stoke-on-TrentShropshire Birmingham TamworthCannock Chase DudleyEast Staffordshire SandwellLichfield WalsallNewcastle-under-Lyme WolverhamptonSouth Staffordshire Stafford Staffordshire Moorlands Bromsgrove Malvern Hills Redditch Worcester Wychavon Wyre Forest EAST Central Bedfordshire Luton BasildonSouthend-on-Sea Fenland Rochford
Area I Area II Area III

civitas.org.uk/research/europe • 101
Table B7: Potential New Assisted Areas
Thurrock Harlow TendringBraintree Maldon Castle Point North Hertfordshire Colchester Ipswich Breckland Waveney King`s Lynn and West Norfolk North Norfolk South Norfolk LONDON Bexley Hackney Barking and DagenhamCroydon Haringey GreenwichEnfield Lewisham RedbridgeHavering Newham Waltham Forest Southwark Tower Hamlets Brent Ealing
SOUTh EAST Isle of Wight Crawley MedwayEastbourne HastingsLewes CanterburyRother DoverWealden GraveshamDartford ThanetShepway Swale SOUTh WEST Cornwall Gloucester PlymouthIsles of Scilly TorridgeTorbay PurbeckWiltshire Weymouth and PortlandEast Devon Exeter Mid Devon North Devon South Hams Teignbridge West Devon Christchurch East Dorset North Dorset West Dorset Mendip Sedgemoor
Area I Area II Area III
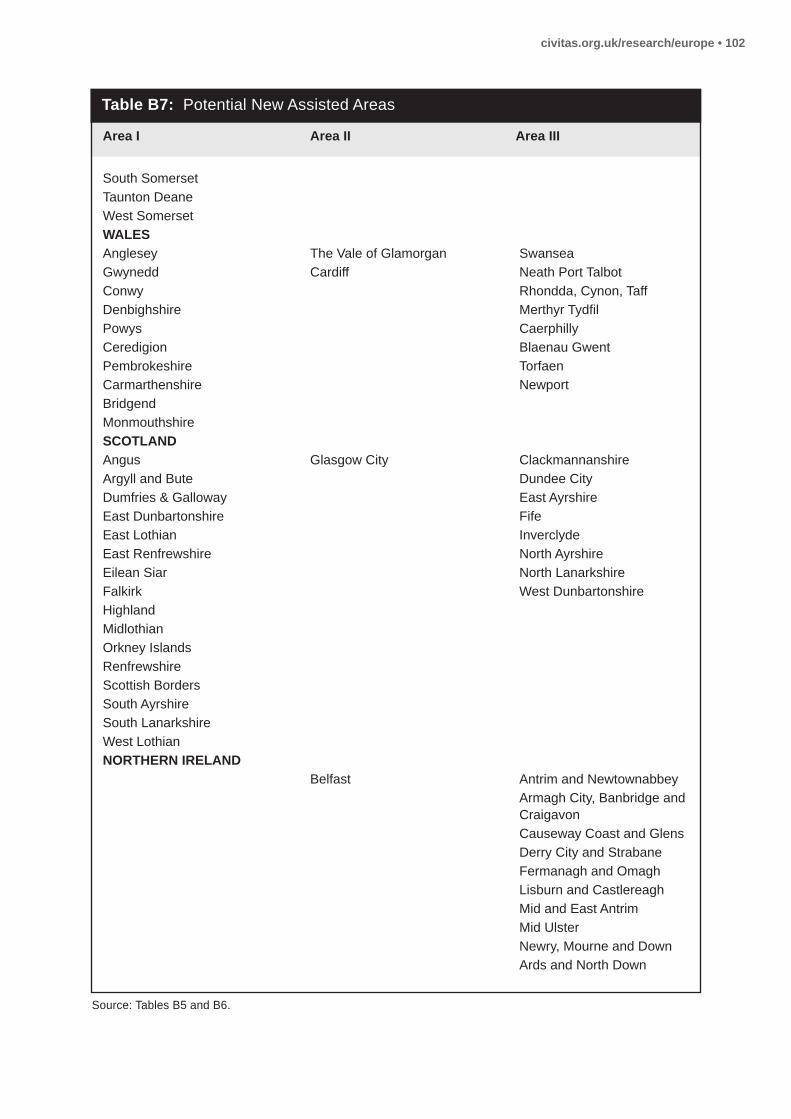
civitas.org.uk/research/europe • 102
Table B7: Potential New Assisted Areas
South Somerset Taunton Deane West Somerset WALES Anglesey The Vale of Glamorgan SwanseaGwynedd Cardiff Neath Port TalbotConwy Rhondda, Cynon, TaffDenbighshire Merthyr TydfilPowys CaerphillyCeredigion Blaenau GwentPembrokeshire TorfaenCarmarthenshire NewportBridgend Monmouthshire SCOTLAND Angus Glasgow City ClackmannanshireArgyll and Bute Dundee CityDumfries & Galloway East AyrshireEast Dunbartonshire FifeEast Lothian InverclydeEast Renfrewshire North AyrshireEilean Siar North LanarkshireFalkirk West DunbartonshireHighland Midlothian Orkney Islands Renfrewshire Scottish Borders South Ayrshire South Lanarkshire West Lothian NORThERN IRELAND Belfast Antrim and Newtownabbey Armagh City, Banbridge and
Craigavon Causeway Coast and Glens Derry City and Strabane Fermanagh and Omagh Lisburn and Castlereagh Mid and East Antrim Mid Ulster Newry, Mourne and Down Ards and North Down
Area I Area II Area III
Source: Tables B5 and B6.
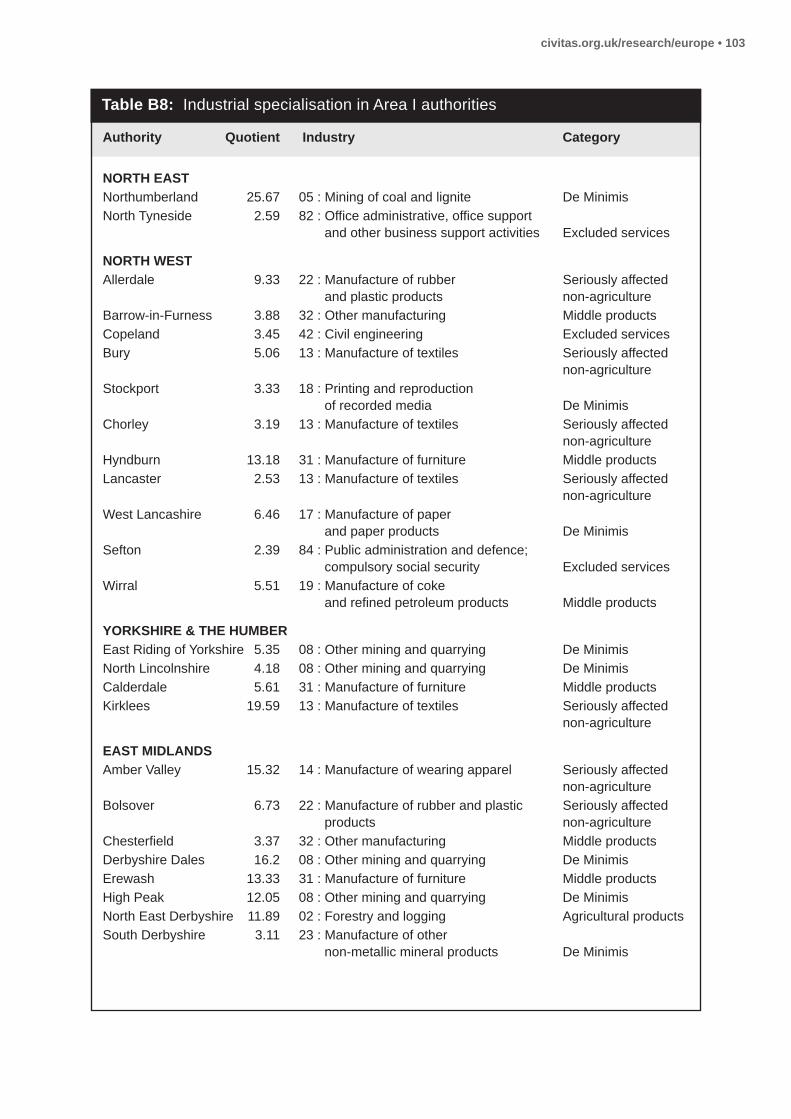
civitas.org.uk/research/europe • 103
Table B8: Industrial specialisation in Area I authorities
NORTh EAST Northumberland 25.67 05 : Mining of coal and lignite De MinimisNorth Tyneside 2.59 82 : Office administrative, office support
and other business support activities Excluded services
NORTh WEST Allerdale 9.33 22 : Manufacture of rubber Seriously affected
and plastic products non-agricultureBarrow-in-Furness 3.88 32 : Other manufacturing Middle productsCopeland 3.45 42 : Civil engineering Excluded servicesBury 5.06 13 : Manufacture of textiles Seriously affected non-agricultureStockport 3.33 18 : Printing and reproduction
of recorded media De MinimisChorley 3.19 13 : Manufacture of textiles Seriously affected non-agricultureHyndburn 13.18 31 : Manufacture of furniture Middle productsLancaster 2.53 13 : Manufacture of textiles Seriously affected non-agricultureWest Lancashire 6.46 17 : Manufacture of paper
and paper products De MinimisSefton 2.39 84 : Public administration and defence;
compulsory social security Excluded servicesWirral 5.51 19 : Manufacture of coke
and refined petroleum products Middle products
YORKShIRE & ThE hUMBER East Riding of Yorkshire 5.35 08 : Other mining and quarrying De MinimisNorth Lincolnshire 4.18 08 : Other mining and quarrying De MinimisCalderdale 5.61 31 : Manufacture of furniture Middle productsKirklees 19.59 13 : Manufacture of textiles Seriously affected non-agriculture
EAST MIDLANDS Amber Valley 15.32 14 : Manufacture of wearing apparel Seriously affected non-agricultureBolsover 6.73 22 : Manufacture of rubber and plastic Seriously affected
products non-agricultureChesterfield 3.37 32 : Other manufacturing Middle productsDerbyshire Dales 16.2 08 : Other mining and quarrying De MinimisErewash 13.33 31 : Manufacture of furniture Middle productsHigh Peak 12.05 08 : Other mining and quarrying De MinimisNorth East Derbyshire 11.89 02 : Forestry and logging Agricultural productsSouth Derbyshire 3.11 23 : Manufacture of other
non-metallic mineral products De Minimis
Authority Quotient Industry Category

civitas.org.uk/research/europe • 104
Table B8: Industrial specialisation in Area I authorities
Boston 9.86 16 : Manufacture of wood and of products of wood and cork, except furniture; manufacture of articles of straw and plaiting materials De Minimis
Lincoln 4.19 60 : Programming and broadcasting activities Excluded services
North Kesteven 9.51 02 : Forestry and logging Agricultural productsSouth Holland 13.76 10 : Manufacture of food products Agricultural productsSouth Kesteven 6.25 27 : Manufacture of electrical equipment Middle productsWest Lindsey 4.96 02 : Forestry and logging Agricultural productsKettering 24.5 15 : Manufacture of leather Seriously affected
and related products non-agricultureAshfield 12.85 14 : Manufacture of wearing apparel Seriously affected non-agricultureBassetlaw 6.4 37 : Sewerage Excluded servicesBroxtowe 3.29 53 : Postal and courier activities Excluded servicesGedling 13.93 13 : Manufacture of textiles Seriously affected non-agricultureNewark and Sherwood 4.43 02 : Forestry and logging Agricultural productsRushcliffe 3.81 93 : Sports activities and amusement
and recreation activities Excluded services
WEST MIDLANDS Herefordshire, County of 10.83 11 : Manufacture of beverages Agricultural productsShropshire 5.85 36 : Water collection, treatment and supply Excluded servicesCannock Chase 5.9 77 : Rental and leasing activities Excluded servicesEast Staffordshire 20.06 11 : Manufacture of beverages Agricultural productsLichfield 3.6 28 : Manufacture of machinery
and equipment n.e.c. Middle productsNewcastle-under-Lyme 3.92 23 : Manufacture of other non-metallic
mineral products De MinimisSouth Staffordshire 2.97 28 : Manufacture of machinery
and equipment n.e.c. Middle productsStafford 6.39 39 : Remediation activities and other
waste management services. This division includes the provision of remediation services, i.e. the cleanup of contaminated buildings and sites, soil, surface or ground water. Excluded services
Staffordshire Moorlands 6.48 28 : Manufacture of machinery and equipment n.e.c. Middle products
Bromsgrove 4.6 32 : Other manufacturing Middle productsMalvern Hills 5.21 26 : Manufacture of computer, electronic
and optical products Middle productsRedditch 7.52 27 : Manufacture of electrical equipment Middle productsWorcester 13.8 37 : Sewerage Excluded services
Authority Quotient Industry Category

civitas.org.uk/research/europe • 105
Table B8: Industrial specialisation in Area I authorities
Wychavon 4.25 95 : Repair of computers and personal and household goods Excluded services
Wyre Forest 15.73 13 : Manufacture of textiles Seriously affected non-agriculture
EAST Central Bedfordshire 6.23 02 : Forestry and logging Agricultural productsSouthend-on-Sea 3.22 32 : Other manufacturing Middle productsThurrock 4.69 52 : Warehousing and support activities
for transportation Excluded servicesBraintree 5.68 23 : Manufacture of other non-metallic
mineral products De MinimisCastle Point 2.66 77 : Rental and leasing activities Excluded servicesColchester 5.49 03 : Fishing and aquaculture Seriously affected non-agricultureBreckland 6.98 31 : Manufacture of furniture Middle productsKing's Lynn and West Norfolk 3.7 37 : Sewerage Excluded servicesNorth Norfolk 5.18 03 : Fishing and aquaculture Seriously affected non-agricultureSouth Norfolk 6.85 29 : Manufacture of motor vehicles, Seriously affected
trailers and semi-trailers non-agriculture
LONDON Bexley 30.24 39 : Remediation activities and other
waste management services. This division includes the provision of remediation services, i.e. the clean up of contaminated buildings and sites, soil, surface or ground water. Excluded services
Croydon 2.78 65 : Insurance, reinsurance and pension funding, except compulsory social security Excluded services
Enfield 2.91 80 : Security and investigation activities Excluded servicesHavering 5.06 37 : Sewerage Excluded services
SOUTh EAST Isle of Wight 7.49 30 : Manufacture of other transport
equipment Middle productsEastbourne 2.77 55 : Accommodation Excluded servicesLewes 4.62 90 : Creative, arts and entertainment
activities Excluded servicesRother 3.48 23 : Manufacture of other non-metallic
mineral products De MinimisWealden 5.78 02 : Forestry and logging Agricultural productsDartford 3.29 33 : Repair and installation of machinery
and equipment Middle productsShepway 6.35 79 : Travel agency, tour operator and other
reservation service and related activities Excluded services
Authority Quotient Industry Category

civitas.org.uk/research/europe • 106
Table B8: Industrial specialisation in Area I authorities
Swale 5.32 17 : Manufacture of paper and paper products De Minimis
SOUTh WEST Cornwall 8.71 08 : Other mining and quarrying De MinimisIsles of Scilly 12.91 55 : Accommodation Excluded servicesTorbay 12.46 03 : Fishing and aquaculture Seriously affected non-agricultureWiltshire 4.89 72 : Scientific research and development Excluded servicesEast Devon 4.71 03 : Fishing and aquaculture Seriously affected non-agricultureExeter 7.06 36 : Water collection, treatment and supply Excluded servicesMid Devon 5.7 02 : Forestry and logging Agricultural productsNorth Devon 4.6 27 : Manufacture of electrical equipment Middle productsSouth Hams 5.2 03 : Fishing and aquaculture Seriously affected non-agricultureTeignbridge 13.78 08 : Other mining and quarrying De MinimisTorridge 5.33 03 : Fishing and aquaculture Seriously affected non-agricultureChristchurch 7.24 33 : Repair and installation of machinery
and equipment Middle productsEast Dorset 5.53 33 : Repair and installation of machinery
and equipment Middle productsNorth Dorset 8.27 27 : Manufacture of electrical equipment Middle productsWest Dorset 3.92 13 : Manufacture of textiles Seriously affected non-agricultureMendip 20.19 08 : Other mining and quarrying De MinimisSedgemoor 4.55 16 : Manufacture of wood and of products
of wood and cork, except furniture; manufacture of articles of straw and plaiting materials De Minimis
South Somerset 19.8 30 : Manufacture of other transport equipment Middle products
Taunton Deane 3.27 79 : Travel agency, tour operator and other reservation service and related activities Excluded services
West Somerset 10.91 55 : Accommodation Excluded services
WALES Anglesey 5.56 03 : Fishing and aquaculture Seriously affected non-agricultureGwynedd 8.71 08 : Other mining and quarrying De MinimisConwy 4.25 55 : Accommodation Excluded servicesDenbighshire 3.83 27 : Manufacture of electrical equipment Middle productsPowys 6.51 02 : Forestry and logging Agricultural productsCeredigion 14.84 02 : Forestry and logging Agricultural productsPembrokeshire 4.45 03 : Fishing and aquaculture Seriously affected non-agriculture
Authority Quotient Industry Category

civitas.org.uk/research/europe • 107
Table B8: Industrial specialisation in Area I authorities
Carmarthenshire 4.31 02 : Forestry and logging Agricultural productsBridgend 10.19 39 : Remediation activities and other
waste management services. This division includes the provision of remediation services, i.e. the clean up of contaminated buildings and sites, soil, surface or ground water. Excluded services
Monmouthshire 5.38 36 : Water collection, treatment and supply Excluded services
SCOTLAND Angus 11.27 13 : Manufacture of textiles Seriously affected non-agricultureArgyll & Bute 41.54 03 : Fishing and aquaculture Seriously affected non-agricultureDumfries & Galloway 17.37 02 : Forestry and logging Agricultural productsEast Dunbartonshire 2.81 22 : Manufacture of rubber and Seriously affected
plastic products non-agricultureEast Lothian 4.51 03 : Fishing and aquaculture Seriously affected non-agricultureEast Renfrewshire 3.22 42 : Civil engineering Excluded servicesEilean Siar 117.14 03 : Fishing and aquaculture Seriously affected non-agricultureFalkirk 9.76 20 : Manufacture of chemicals Seriously affected
and chemical products non-agricultureHighland 32.03 03 : Fishing and aquaculture Seriously affected non-agricultureMidlothian 10.98 72 : Scientific research and development Excluded servicesOrkney Islands 96.81 03 : Fishing and aquaculture Seriously affected non-agricultureRenfrewshire 20.77 15 : Manufacture of leather Seriously affected
and related products non-agricultureScottish Borders 31.03 14 : Manufacture of wearing apparel Seriously affected non-agricultureSouth Ayrshire 11.98 33 : Repair and installation of
machinery and equipment Middle productsSouth Lanarkshire 8.86 35 : Electricity, gas, steam and air
conditioning supply Excluded servicesWest Lothian 2.85 26 : Manufacture of computer,
electronic and optical products Middle products
Authority Quotient Industry Category
Source: ONS location quotients for each local authority, derived from Business Register and Employment Survey, 2011.See the Technical Note in Appendix III.

civitas.org.uk/research/europe • 108
Table B9: Industrial specialisation in Area II authorities
NORTh EAST Darlington 5.39 25 : Manufacture of fabricated metal
products, except machinery and equipment Middle products
NORTh WEST Manchester 5.74 51 : Air transport Excluded servicesSalford 9.03 60 : Programming and broadcasting
activities Excluded servicesLiverpool 4.12 21 : Manufacture of basic pharmaceutical
products and pharmaceutical preparations De Minimis
YORKShIRE & ThE hUMBER Scarborough 4.46 55 : Accommodation Excluded servicesLeeds 2.6 80 : Security and investigation activities Excluded servicesEAST MIDLANDS Derby 19.39 30 : Manufacture of other transport
equipment Middle productsNottingham 7.53 63 : Information service activities Excluded services
WEST MIDLANDS North Warwickshire 7.54 52 : Warehousing and support activities
for transportation Excluded servicesBirmingham 2.21 29 : Manufacture of motor vehicles, Seriously affected
trailers and semi-trailers non-agriculture
EAST Luton 11.51 51 : Air transport Excluded servicesFenland 7.83 10 : Manufacture of food products Agricultural productsHarlow 4.73 28 : Manufacture of machinery and
equipment n.e.c. Middle productsMaldon 4.71 18 : Printing and reproduction of
recorded media De MinimisNorth Hertfordshire 7.74 20 : Manufacture of chemicals Seriously affected
and chemical products non-agricultureIpswich 3.46 66 : Activities auxiliary to financial
services and insurance activities Excluded servicesWaveney 7.31 18 : Printing and reproduction
of recorded media De Minimis
LONDON Hackney 7.76 15 : Manufacture of leather Seriously affected
and related products non-agricultureHaringey 5.58 14 : Manufacture of wearing apparel Seriously affected non-agriculture
Authority Quotient Industry Category

civitas.org.uk/research/europe • 109
Table B9: Industrial specialisation in Area II authorities
Lewisham 3.77 39 : Remediation activities and other waste management services. This division includes the provision of remediation services, i.e. the cleanup of contaminated buildings and sites, soil, surface or ground water. Excluded services
Newham 2.26 39 : Remediation activities and other waste management services. This division includes the provision of remediation services, i.e. the cleanup of contaminated buildings and sites, soil, surface or ground water. Excluded services
Southwark 6.02 58 : Publishing activities Excluded servicesTower Hamlets 8.89 66 : Activities auxiliary to financial services
and insurance activities Excluded servicesBrent 2.98 60 : Programming and broadcasting
activities Excluded servicesEaling 4.4 73 : Advertising and market research Excluded services
SOUTh EAST Crawley 48.5 51 : Air transport Excluded services
SOUTh WEST Gloucester 4.67 79 : Travel agency, tour operator and
other reservation service and related activities Excluded services
WALES The Vale of Glamorgan 9.22 33 : Repair and installation of machinery
and equipment Middle productsCardiff 4.54 65 : Insurance, reinsurance and pension
funding, except compulsory social security Excluded services
SCOTLAND Glasgow City 4.14 11 : Manufacture of beverages Agricultural products
NORThERN IRELAND Belfast Public administration, education and health Excluded services
Authority Quotient Industry Category
Source: ONS location quotients for each local authority, derived from Business Register and Employment Survey, 2011.See the Technical Note in Appendix III.

civitas.org.uk/research/europe • 110
Table B10: Industrial specialisation in Area III authorities
NORTh EAST County Durham 5.82 21 : Manufacture of basic pharmaceutical
products and pharmaceutical preparations De Minimis
Hartlepool 4.66 20 : Manufacture of chemicals Seriously affected and chemical products non-agriculture
Middlesbrough 2.18 86 : Human health activities Excluded servicesRedcar and Cleveland 13.11 24 : Manufacture of basic metals Seriously affectednon-agricultureStockton-on-Tees 5.11 20 : Manufacture of chemicals and Seriously affected
chemical products non-agricultureGateshead 3.6 28 : Manufacture of machinery
and equipment n.e.c. Middle productsNewcastle upon Tyne 3.03 51 : Air transport Excluded servicesSouth Tyneside 5.1 27 : Manufacture of electrical equipment Middle productsSunderland 16.38 29 : Manufacture of motor vehicles, Seriously affected
trailers and semi-trailers non-agriculture
NORTh WEST Blackburn with Darwen 7.97 17 : Manufacture of paper
and paper products De MinimisBlackpool 4.29 55 : Accommodation Excluded servicesHalton 13.79 20 : Manufacture of chemicals Seriously affected
and chemical products non-agricultureBolton 2.92 13 : Manufacture of textiles Seriously affected non-agricultureOldham 3.92 31 : Manufacture of furniture Middle productsRochdale 8.15 13 : Manufacture of textiles Seriously affected non-agricultureTameside 6.41 13 : Manufacture of textiles Seriously affected non-agricultureWigan 3.45 10 : Manufacture of food products Agricultural productsBurnley 4.68 17 : Manufacture of paper
and paper products De MinimisPendle 17.27 31 : Manufacture of furniture Middle productsRossendale 6.82 20 : Manufacture of chemicals Seriously affected
and chemical products non-agricultureWyre 5.5 20 : Manufacture of chemicals Seriously affected
and chemical products non-agricultureKnowsley 12 29 : Manufacture of motor vehicles, Seriously affected
trailers and semi-trailers non-agricultureSt. Helens 12.5 23 : Manufacture of other non-metallic
mineral products De Minimis
YORKShIRE & ThE hUMBER Kingston upon Hull, 3.01 29 : Manufacture of motor vehicles, Seriously affected City of trailers and semi-trailers non-agriculture
Authority Quotient Industry Category
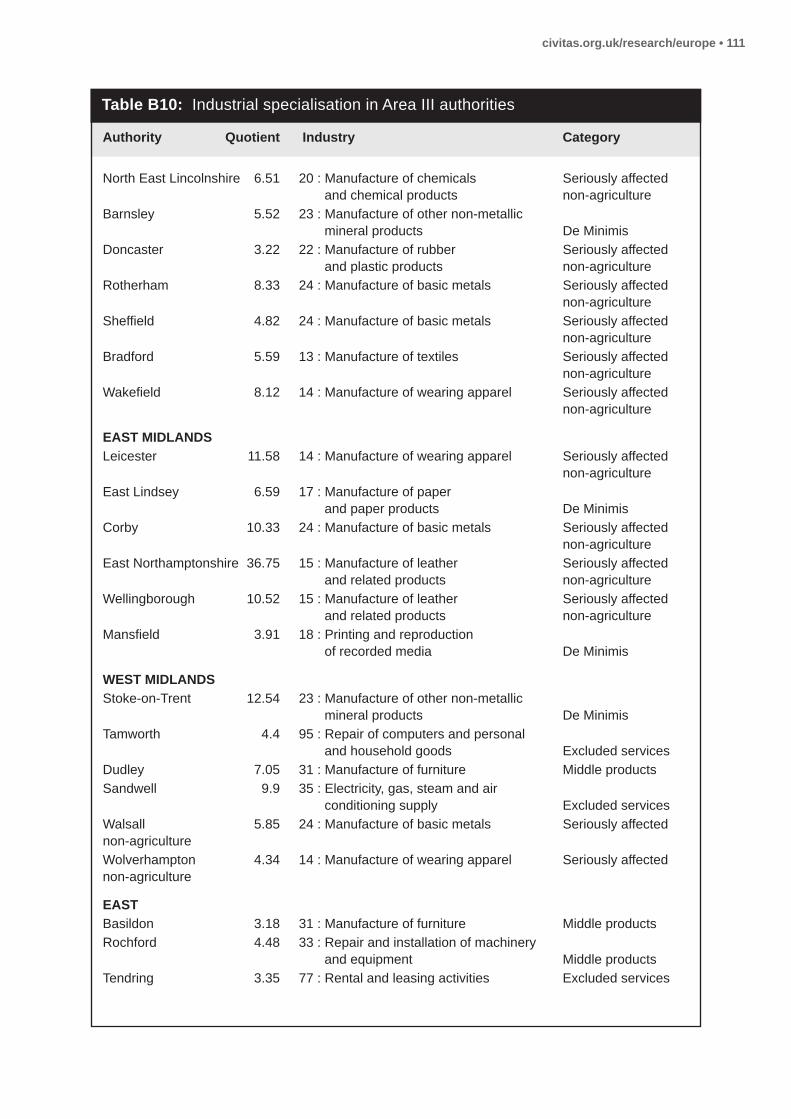
civitas.org.uk/research/europe • 111
Table B10: Industrial specialisation in Area III authorities
North East Lincolnshire 6.51 20 : Manufacture of chemicals Seriously affected and chemical products non-agriculture
Barnsley 5.52 23 : Manufacture of other non-metallic mineral products De Minimis
Doncaster 3.22 22 : Manufacture of rubber Seriously affected and plastic products non-agriculture
Rotherham 8.33 24 : Manufacture of basic metals Seriously affected non-agricultureSheffield 4.82 24 : Manufacture of basic metals Seriously affected non-agricultureBradford 5.59 13 : Manufacture of textiles Seriously affected non-agricultureWakefield 8.12 14 : Manufacture of wearing apparel Seriously affected non-agriculture
EAST MIDLANDS Leicester 11.58 14 : Manufacture of wearing apparel Seriously affected non-agricultureEast Lindsey 6.59 17 : Manufacture of paper
and paper products De MinimisCorby 10.33 24 : Manufacture of basic metals Seriously affected non-agricultureEast Northamptonshire 36.75 15 : Manufacture of leather Seriously affected
and related products non-agricultureWellingborough 10.52 15 : Manufacture of leather Seriously affected
and related products non-agricultureMansfield 3.91 18 : Printing and reproduction
of recorded media De Minimis
WEST MIDLANDS Stoke-on-Trent 12.54 23 : Manufacture of other non-metallic
mineral products De MinimisTamworth 4.4 95 : Repair of computers and personal
and household goods Excluded servicesDudley 7.05 31 : Manufacture of furniture Middle productsSandwell 9.9 35 : Electricity, gas, steam and air
conditioning supply Excluded servicesWalsall 5.85 24 : Manufacture of basic metals Seriously affectednon-agricultureWolverhampton 4.34 14 : Manufacture of wearing apparel Seriously affectednon-agriculture
EAST Basildon 3.18 31 : Manufacture of furniture Middle productsRochford 4.48 33 : Repair and installation of machinery
and equipment Middle productsTendring 3.35 77 : Rental and leasing activities Excluded services
Authority Quotient Industry Category
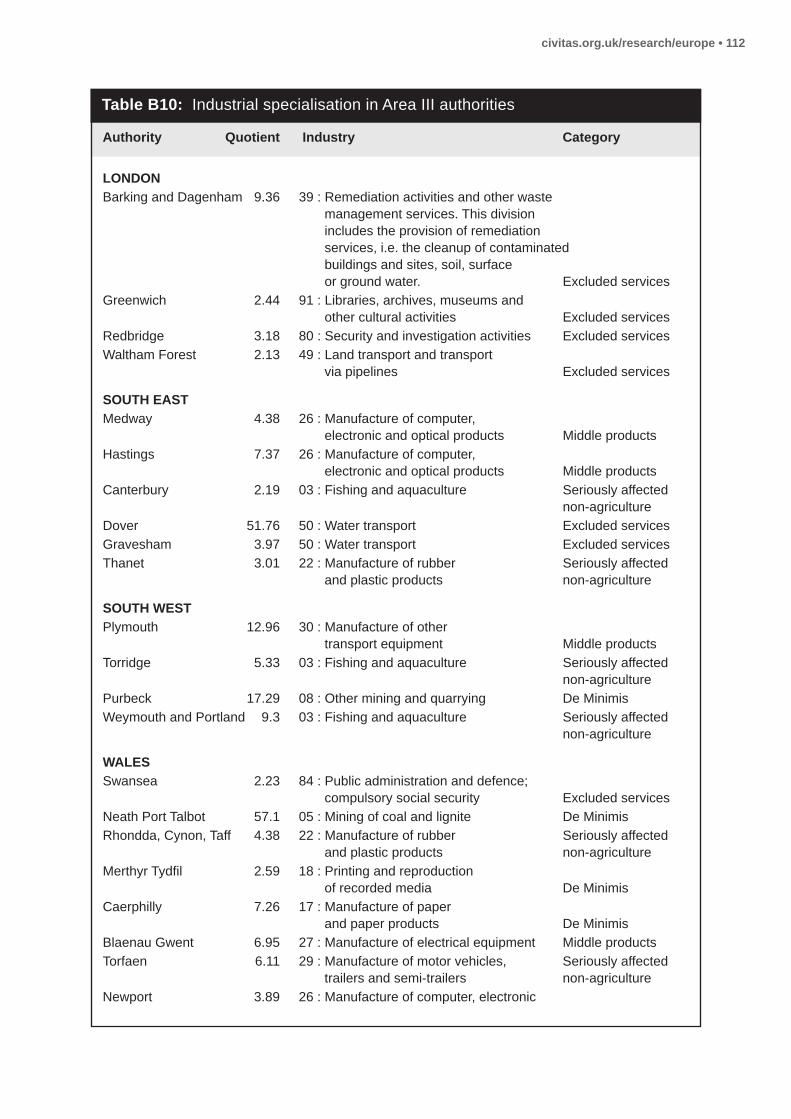
civitas.org.uk/research/europe • 112
Table B10: Industrial specialisation in Area III authorities
LONDON Barking and Dagenham 9.36 39 : Remediation activities and other waste
management services. This division includes the provision of remediation services, i.e. the cleanup of contaminated buildings and sites, soil, surface or ground water. Excluded services
Greenwich 2.44 91 : Libraries, archives, museums and other cultural activities Excluded services
Redbridge 3.18 80 : Security and investigation activities Excluded servicesWaltham Forest 2.13 49 : Land transport and transport
via pipelines Excluded services
SOUTh EAST Medway 4.38 26 : Manufacture of computer,
electronic and optical products Middle productsHastings 7.37 26 : Manufacture of computer,
electronic and optical products Middle productsCanterbury 2.19 03 : Fishing and aquaculture Seriously affected non-agricultureDover 51.76 50 : Water transport Excluded servicesGravesham 3.97 50 : Water transport Excluded servicesThanet 3.01 22 : Manufacture of rubber Seriously affected
and plastic products non-agriculture
SOUTh WEST Plymouth 12.96 30 : Manufacture of other
transport equipment Middle productsTorridge 5.33 03 : Fishing and aquaculture Seriously affected non-agriculturePurbeck 17.29 08 : Other mining and quarrying De MinimisWeymouth and Portland 9.3 03 : Fishing and aquaculture Seriously affected non-agriculture
WALES Swansea 2.23 84 : Public administration and defence;
compulsory social security Excluded servicesNeath Port Talbot 57.1 05 : Mining of coal and lignite De MinimisRhondda, Cynon, Taff 4.38 22 : Manufacture of rubber Seriously affected
and plastic products non-agricultureMerthyr Tydfil 2.59 18 : Printing and reproduction
of recorded media De MinimisCaerphilly 7.26 17 : Manufacture of paper
and paper products De MinimisBlaenau Gwent 6.95 27 : Manufacture of electrical equipment Middle productsTorfaen 6.11 29 : Manufacture of motor vehicles, Seriously affected
trailers and semi-trailers non-agricultureNewport 3.89 26 : Manufacture of computer, electronic
Authority Quotient Industry Category

civitas.org.uk/research/europe • 113
Table B10: Industrial specialisation in Area III authorities
and optical products Middle products
SCOTLAND Clackmannanshire 22.85 11 : Manufacture of beverages Agricultural productsDundee City 4.71 13 : Manufacture of textiles Seriously affected non-agricultureEast Ayrshire 69.9 05 : Mining of coal and lignite De MinimisFife 4.27 05 : Mining of coal and lignite De MinimisInverclyde 8.66 50 : Water transport Excluded servicesNorth Ayrshire 3.83 13 : Manufacture of textiles Seriously affected non-agricultureNorth Lanarkshire 7.32 11 : Manufacture of beverages Agricultural productsWest Dunbartonshire 17.73 11 : Manufacture of beverages Agricultural products
NORThERN IRELAND Antrim and Public administration,Newtownabbey education and health Excluded servicesArds and North Down Public administration, education and health Excluded servicesArmagh City, Banbridge Public administration, and Craigavon education and health Excluded servicesCauseway Coast and Glens Public administration, education and health Excluded servicesDerry City and Strabane Public administration, education and health Excluded servicesFermanagh and Omagh Public administration, education and health Excluded servicesLisburn and Castlereagh Public administration, education and health Excluded servicesMid and East Antrim Public administration, education and health Excluded servicesMid Ulster Public administration, education and health Excluded servicesNewry, Mourne and Down Public administration, education and health Excluded services
Authority Quotient Industry Category
Source: ONS location quotients for each local authority, derived from Business Register and Employment Survey, 2011.See the Technical Note in Appendix III.
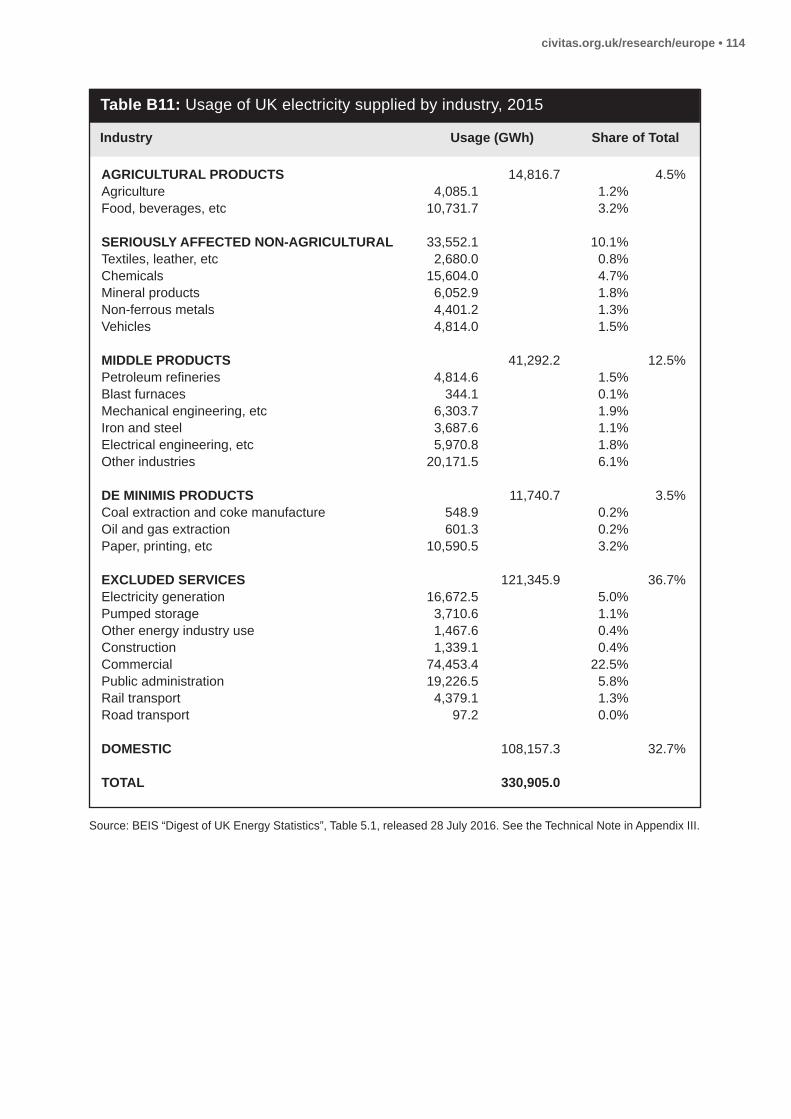
civitas.org.uk/research/europe • 114
Table B11: Usage of UK electricity supplied by industry, 2015
AGRICULTURAL PRODUCTS 14,816.7 4.5%Agriculture 4,085.1 1.2% Food, beverages, etc 10,731.7 3.2%
SERIOUSLY AFFECTED NON-AGRICULTURAL 33,552.1 10.1%Textiles, leather, etc 2,680.0 0.8% Chemicals 15,604.0 4.7% Mineral products 6,052.9 1.8% Non-ferrous metals 4,401.2 1.3% Vehicles 4,814.0 1.5%
MIDDLE PRODUCTS 41,292.2 12.5%Petroleum refineries 4,814.6 1.5% Blast furnaces 344.1 0.1% Mechanical engineering, etc 6,303.7 1.9% Iron and steel 3,687.6 1.1% Electrical engineering, etc 5,970.8 1.8% Other industries 20,171.5 6.1%
DE MINIMIS PRODUCTS 11,740.7 3.5%Coal extraction and coke manufacture 548.9 0.2% Oil and gas extraction 601.3 0.2% Paper, printing, etc 10,590.5 3.2%
ExCLUDED SERVICES 121,345.9 36.7%Electricity generation 16,672.5 5.0% Pumped storage 3,710.6 1.1% Other energy industry use 1,467.6 0.4% Construction 1,339.1 0.4% Commercial 74,453.4 22.5% Public administration 19,226.5 5.8% Rail transport 4,379.1 1.3% Road transport 97.2 0.0%
DOMESTIC 108,157.3 32.7%
TOTAL 330,905.0
Industry Usage (GWh) Share of Total
Source: BEIS “Digest of UK Energy Statistics”, Table 5.1, released 28 July 2016. See the Technical Note in Appendix III.

civitas.org.uk/research/europe • 115
Table B12: WTO analysis of EU agricultural support
EU Total AMS Commitment, € million 72,244.0 72,244.0 72,244.0 72,379.0
Amber Box measures, € million: 10,883.2 6,501.8 6,858.9 5,899.1Product-specific AMS: market price support 8,089.1 4,222.8 4,458.5 4,444.2Product-specific AMS: direct payments 3,399.2 2,921.4 2,747.2 2,548.3Product-specific AMS: other 0.0 0.0 0.0 0.0Product-specific equivalent AMS 198.8 49.8 -34.9 -107.4Non-product specific AMS 598.1 700.8 690.9 794.5Less: disregard of de minimis items -1,402.0 -1,393.0 -1,002.8 -1,780.5
Blue Box measures, € million: 5,323.6 3,141.8 2,981.1 2,754.2Payments based on fixed area and yield 3,063.9 1,136.0 977.0 833.1Payments based on base level of production 0.0 0.0 0.0 0.0Payments based on head of livestock 2,259.7 2,005.9 2,004.1 1,921.1
Green Box measures, € million: 63,798.1 68,051.5 70,976.8 71,140.0Research 986.0 1,113.1 1,028.6 1,123.6Pest & disease control 1,318.6 1,129.8 1,102.0 1,059.7Training 225.7 246.8 261.5 294.0Advisory services 779.2 773.2 817.7 824.9Inspection services 384.2 418.7 408.1 390.8Marketing services 1,021.1 1,053.6 1,029.8 856.8Infrastructure 1,866.0 2,310.5 2,691.8 2,481.4Other farm services 813.4 1,458.7 1,843.7 1,775.8Food Security Stockpiling 27.5 25 1.2 1.0Domestic Food Aid 624.8 729.9 971.1 940.8Decoupled income support 31,481.6 32,913.1 32,756.0 32,780.2Income Safety-net programmes 16.9 21.9 31.4 37.8Disaster relief payments 1,297.6 802.7 840.8 775.3Structural Adjustment – producer retirement 956.6 778.8 742.9 720.4Structural Adjustment – resource retirement 306.6 349.9 330.7 401.4Structural Adjustment – investment 6,152.5 7,134.4 7,338.5 6,641.5Environmental programmes 6,553.1 7,237.9 8,302.0 8,869.1Regional Assistance programmes 4,504.8 4,452.0 4,511.2 4,452.3Other (Single Area Payment Scheme) 4,481.7 5,101.6 5,967.9 6,713.3
Total EU Agricultural Spending 80,004.9 77,695.1 80,816.8 79,793.3Proportion counting as WTO ‘subsidies’ 14% 8% 8% 7%
Marketing Year 2009-10 2010-11 2011-12 2012-13
Note: The EU Total AMS Commitment increased for 2012/13 due to the accession of Croatia.
Source: EU Commission notifications to the WTO Agriculture Committee G/AG/N/EU/10/Rev.1 (2009/10), G/AG/N/EU/17 (2010/11), G/AG/N/EU/20 (2011/12) and G/AG/N/EU/26 (2012/13)

civitas.org.uk/research/europe • 116
Table B13: Impact of mitigation for all industries (£ million)
Industry Tariff Costs Tariff Revenues
AGRICULTURAL
Live animals 6.24 23.35 CPS abolition 6.48 R&D credits 7.22 TAP payments 0.00 Regional grants 0.00 -13.70
(GAIN) -7.46
Meat 377.88 1,022.75 CPS abolition 3.67 R&D credits 5.96 TAP payments 9.99 Regional grants 358.25 -377.88
(GAIN) 0.00
Dairy produce (including Eggs) 331.05 955.50 CPS abolition 3.08 R&D credits 5.02 TAP payments 8.40 Regional grants 314.54 -331.05
(GAIN) 0.00
Products of animal origin 0.20 955.50 CPS abolition 0.30 R&D credits 0.49 TAP payments 0.00 Regional grants 0.00 -0.79
(GAIN) -0.59
Live trees and other plants 3.16 69.90 CPS abolition 1.04 R&D credits 1.15 TAP payments 0.46 Regional grants 0.52 -3.16
(GAIN) 0.00
Edible vegetables 24.04 325.97 CPS abolition 0.75 R&D credits 1.22 TAP payments 2.04 Regional grants 20.03 -24.04
(GAIN) 0.00
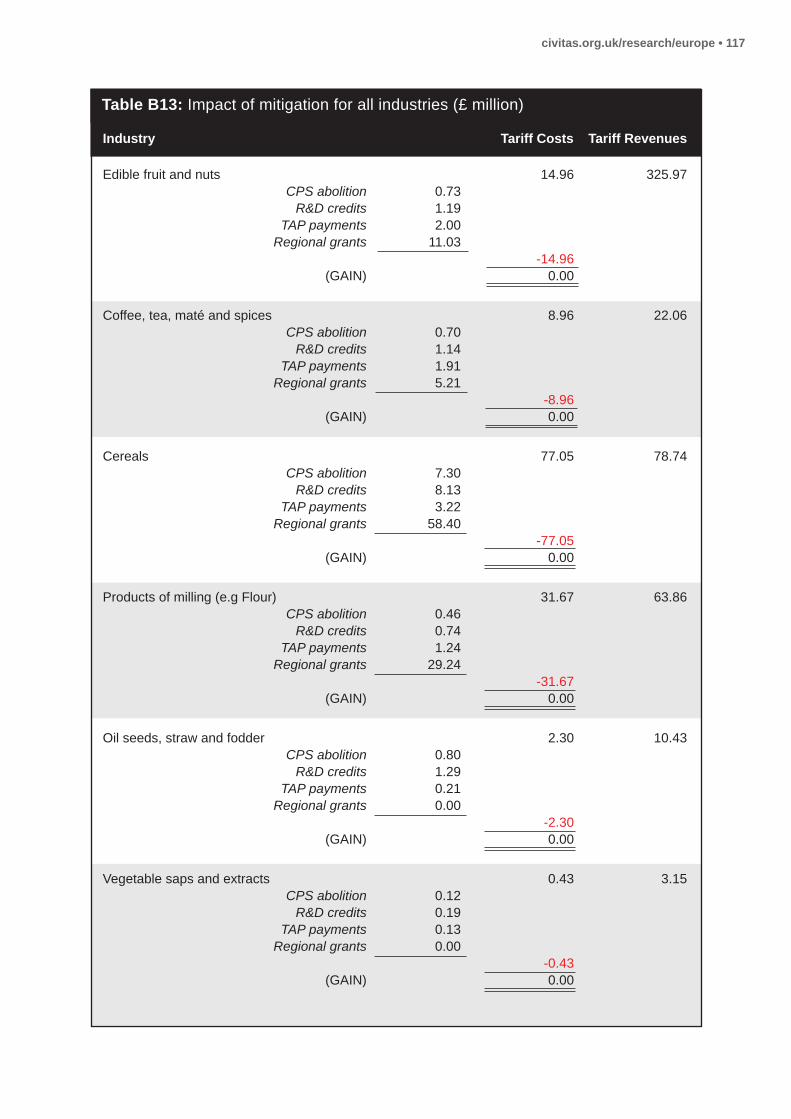
civitas.org.uk/research/europe • 117
Table B13: Impact of mitigation for all industries (£ million)
Industry Tariff Costs Tariff Revenues
Edible fruit and nuts 14.96 325.97 CPS abolition 0.73 R&D credits 1.19 TAP payments 2.00 Regional grants 11.03 -14.96
(GAIN) 0.00
Coffee, tea, maté and spices 8.96 22.06 CPS abolition 0.70 R&D credits 1.14 TAP payments 1.91 Regional grants 5.21 -8.96
(GAIN) 0.00
Cereals 77.05 78.74 CPS abolition 7.30 R&D credits 8.13 TAP payments 3.22 Regional grants 58.40 -77.05
(GAIN) 0.00
Products of milling (e.g Flour) 31.67 63.86 CPS abolition 0.46 R&D credits 0.74 TAP payments 1.24 Regional grants 29.24 -31.67
(GAIN) 0.00
Oil seeds, straw and fodder 2.30 10.43 CPS abolition 0.80 R&D credits 1.29 TAP payments 0.21 Regional grants 0.00 -2.30
(GAIN) 0.00
Vegetable saps and extracts 0.43 3.15 CPS abolition 0.12 R&D credits 0.19 TAP payments 0.13 Regional grants 0.00 -0.43
(GAIN) 0.00
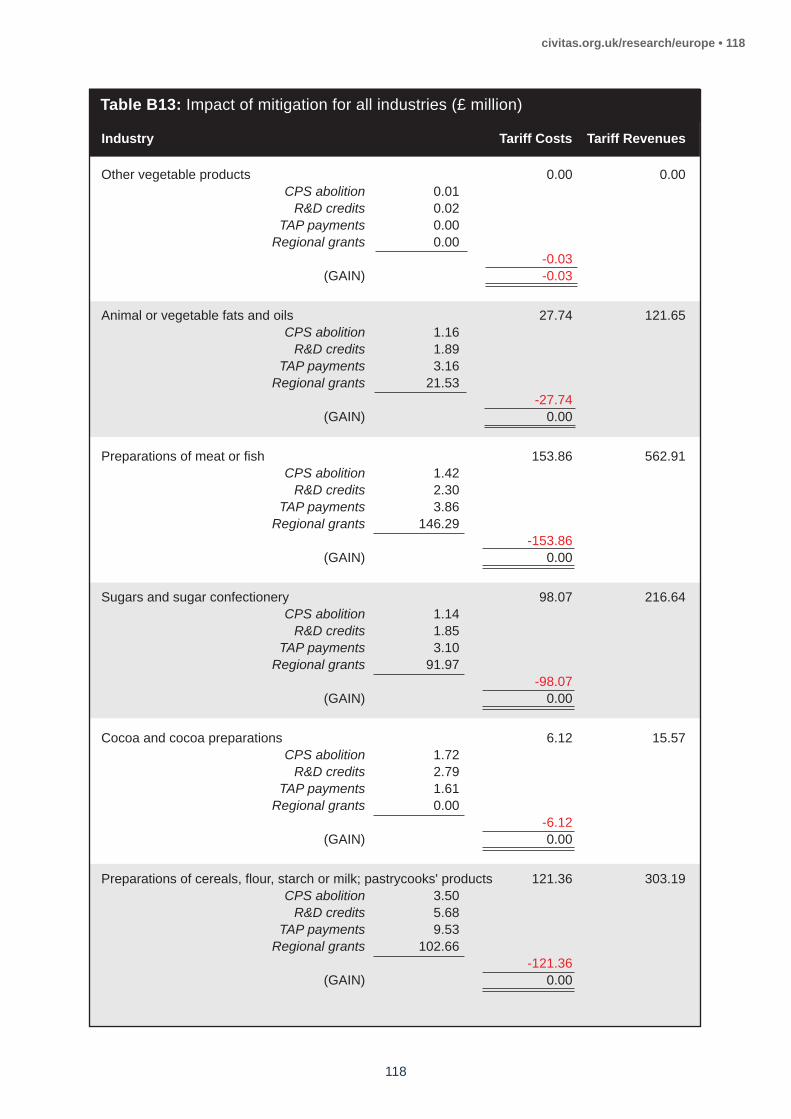
Table B13: Impact of mitigation for all industries (£ million)
Industry Tariff Costs Tariff Revenues
Other vegetable products 0.00 0.00 CPS abolition 0.01 R&D credits 0.02 TAP payments 0.00 Regional grants 0.00 -0.03
(GAIN) -0.03
Animal or vegetable fats and oils 27.74 121.65 CPS abolition 1.16 R&D credits 1.89 TAP payments 3.16 Regional grants 21.53 -27.74
(GAIN) 0.00
Preparations of meat or fish 153.86 562.91 CPS abolition 1.42 R&D credits 2.30 TAP payments 3.86 Regional grants 146.29 -153.86
(GAIN) 0.00
Sugars and sugar confectionery 98.07 216.64 CPS abolition 1.14 R&D credits 1.85 TAP payments 3.10 Regional grants 91.97 -98.07
(GAIN) 0.00
Cocoa and cocoa preparations 6.12 15.57 CPS abolition 1.72 R&D credits 2.79 TAP payments 1.61 Regional grants 0.00 -6.12
(GAIN) 0.00
Preparations of cereals, flour, starch or milk; pastrycooks' products 121.36 303.19 CPS abolition 3.50 R&D credits 5.68 TAP payments 9.53 Regional grants 102.66 -121.36
(GAIN) 0.00
118
civitas.org.uk/research/europe • 118

Table B13: Impact of mitigation for all industries (£ million)
Industry Tariff Costs Tariff Revenues
Preparations of vegetables, fruit, nuts or other parts of plants62.38 372.23 CPS abolition 1.29 R&D credits 2.10 TAP payments 3.52 Regional grants 55.47 -62.38
(GAIN) 0.00
Miscellaneous edible preparations 78.69 191.63 CPS abolition 3.26 R&D credits 5.30 TAP payments 8.89 Regional grants 61.24 -78.69
(GAIN) 0.00
Beverages, spirits and vinegar 59.68 239.76 CPS abolition 7.88 R&D credits 12.82 TAP payments 21.48 Regional grants 17.50 -59.68
(GAIN) 0.00
Residues and waste from the food industries 123.15 213.59 CPS abolition 1.98 R&D credits 3.22 TAP payments 5.39 Regional grants 112.56 -123.15
(GAIN) 0.00
Tobacco and manufactured tobacco substitutes 90.73 131.51 CPS abolition 0.76 R&D credits 1.24 TAP payments 2.08 Regional grants 86.65 -90.73
(GAIN) 0.00
Albuminoidal substances; modified starches; glues; enzymes 15.88 35.19 CPS abolition 0.81 R&D credits 1.32 TAP payments 2.21 Regional grants 11.54 -15.88
(GAIN) 0.00
civitas.org.uk/research/europe • 119

civitas.org.uk/research/europe • 120
Table B13: Impact of mitigation for all industries (£ million)
Industry Tariff Costs Tariff Revenues
SERIOUSLY-AFFECTED NON-AGRICULTURAL
Fish and crustaceans 86.72 45.36 CPS abolition 3.39 R&D credits 4.77 TAP payments 9.24 Regional grants 69.32 -86.72
(GAIN) 0.00
Dyeing extracts and colouring matter; paints and varnishes; putty and other mastics; inks 72.46 78.57 CPS abolition 5.77 R&D credits 11.58 TAP payments 12.00 Regional grants 43.11 -72.46
(GAIN) 0.00
Explosives; pyrotechnic products; matches; pyrophoric alloys; certain combustible preparations 1.60 0.64 CPS abolition 0.12 R&D credits 0.25 TAP payments 0.25 Regional grants 0.98 -1.60
(GAIN) 0.00
Photographic or cinematographic goods 16.24 13.14 CPS abolition 1.29 R&D credits 2.59 TAP payments 2.68 Regional grants 9.68 -16.24
(GAIN) 0.00
Plastics and articles thereof 285.90 497.84 CPS abolition 12.71 R&D credits 9.05 TAP payments 46.56 Regional grants 217.58 -285.90
(GAIN) 0.00
Silk 0.47 1.08 CPS abolition 0.02 R&D credits 0.00 TAP payments 0.07 Regional grants 0.38 -0.47
(GAIN) 0.00

civitas.org.uk/research/europe • 121
Table B13: Impact of mitigation for all industries (£ million)
Industry Tariff Costs Tariff Revenues
Cotton 4.88 6.98 CPS abolition 0.14 R&D credits 0.04 TAP payments 0.65 Regional grants 4.05 -4.88
(GAIN) 0.00
Other vegetable textile fibres; paper yarn and woven fabrics of paper yarn 0.55 1.61 CPS abolition 0.02 R&D credits 0.01 TAP payments 0.08 Regional grants 0.44 -0.55
(GAIN) 0.00
Man-made filaments; strip and the like of man-made textile materials 21.93 14.76 CPS abolition 0.83 R&D credits 0.25 TAP payments 3.96 Regional grants 16.90 -21.93
(GAIN) 0.00
Man-made staple fibres 9.12 10.74 CPS abolition 0.30 R&D credits 0.09 TAP payments 1.44 Regional grants 7.28 -9.12
(GAIN) 0.00
Carpets and other textile floor coverings 5.58 47.14 CPS abolition 0.15 R&D credits 0.04 TAP payments 0.72 Regional grants 4.66 -5.58
(GAIN) 0.00
Special woven fabrics; tufted textile fabrics; lace; tapestries; trimmings; embroidery 4.70 11.02 CPS abolition 0.13 R&D credits 0.04 TAP payments 0.64 Regional grants 3.89 -4.70
(GAIN) 0.00

Table B13: Impact of mitigation for all industries (£ million)
Industry Tariff Costs Tariff Revenues
Impregnated, coated, covered or laminated textile fabrics;textile articles suitable for industrial use 16.81 12.40 CPS abolition 0.50 R&D credits 0.15 TAP payments 2.38 Regional grants 13.78 -16.81
(GAIN) 0.00
Knitted or crocheted fabrics 5.15 4.80 CPS abolition 0.14 R&D credits 0.04 TAP payments 0.65 Regional grants 4.33 -5.15
(GAIN) 0.00
Articles of apparel and clothing accessories, knitted or crocheted 101.64 230.21 CPS abolition 1.80 R&D credits 0.53 TAP payments 8.59 Regional grants 90.72 -101.64
(GAIN) 0.00
Articles of apparel and clothing accessories, not knitted or crocheted 112.66 283.41 CPS abolition 2.05 R&D credits 0.61 TAP payments 9.79 Regional grants 100.21 -112.66
(GAIN) 0.00
Other made-up textile articles; sets; worn clothing and worn textile articles; rags 20.68 27.65 CPS abolition 0.51 R&D credits 0.15 TAP payments 2.43 Regional grants 17.59 -20.68
(GAIN) 0.00
Footwear, gaiters and the like; parts of such articles 82.62 208.93 CPS abolition 1.51 R&D credits 0.45 TAP payments 7.23 Regional grants 73.43 -82.62
(GAIN) 0.00
122
civitas.org.uk/research/europe • 122

civitas.org.uk/research/europe • 123
Table B13: Impact of mitigation for all industries (£ million)
Industry Tariff Costs Tariff Revenues
Ceramic products 9.55 37.84 CPS abolition 2.52 R&D credits 0.70 TAP payments 1.41 Regional grants 4.92 -9.55
(GAIN) 0.00
Aluminium and articles thereof 66.37 148.76 CPS abolition 7.09 R&D credits 3.42 TAP payments 11.74 Regional grants 44.12 -66.37
(GAIN) 0.00
Vehicles other than railway or tramway rolling stock 1,347.95 3,896.20 CPS abolition 17.46 R&D credits 452.90 TAP payments 154.39 Regional grants 723.21 -1,347.95
(GAIN) 0.00
MIDDLE PRODUCTS
Mineral fuels, oils and products; bituminous substances; mineral waxes 166.86 127.15 CPS abolition 21.63 R&D credits 28.19 TAP payments 117.04 Regional grants 0.00 -166.86
(GAIN) 0.00
Inorganic chemicals 23.91 37.23 CPS abolition 4.46 R&D credits 8.96 TAP payments 9.28 Regional grants 1.20 -23.91
(GAIN) 0.00
Organic chemicals 134.39 209.16 CPS abolition 16.90 R&D credits 33.93 TAP payments 35.16 Regional grants 48.41 -134.39
(GAIN) 0.00
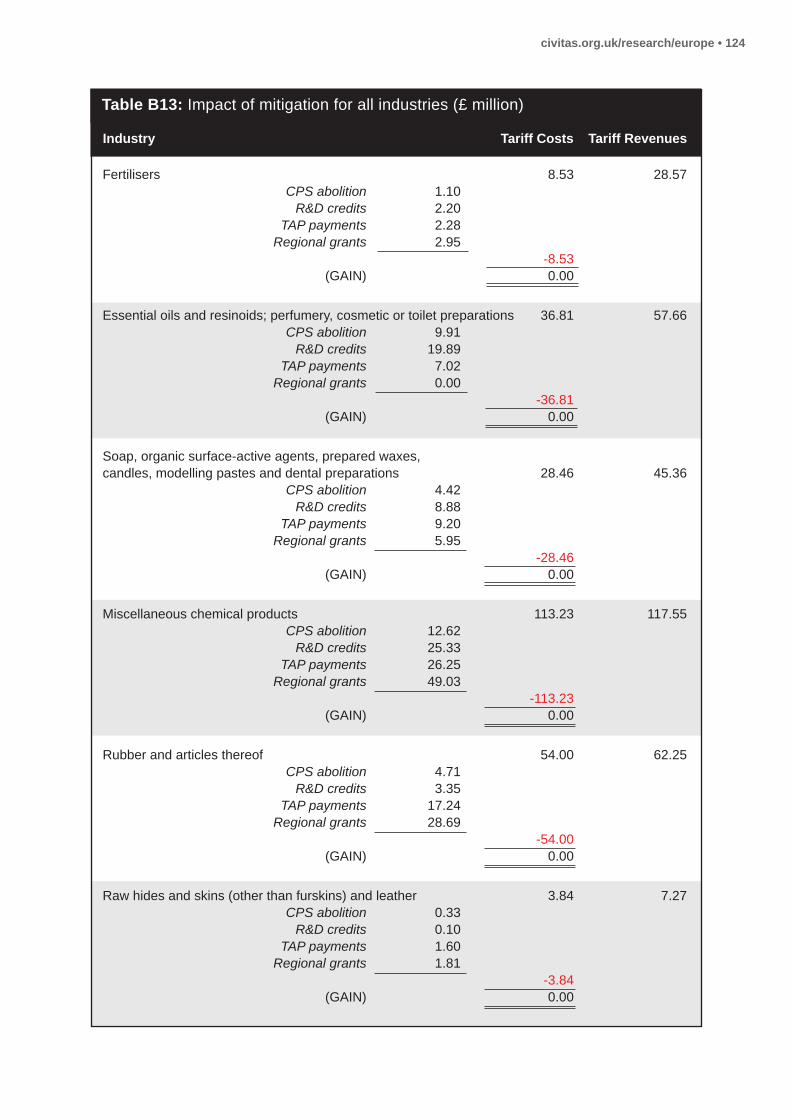
civitas.org.uk/research/europe • 124
Table B13: Impact of mitigation for all industries (£ million)
Industry Tariff Costs Tariff Revenues
Fertilisers 8.53 28.57 CPS abolition 1.10 R&D credits 2.20 TAP payments 2.28 Regional grants 2.95 -8.53
(GAIN) 0.00
Essential oils and resinoids; perfumery, cosmetic or toilet preparations 36.81 57.66 CPS abolition 9.91 R&D credits 19.89 TAP payments 7.02 Regional grants 0.00 -36.81
(GAIN) 0.00
Soap, organic surface-active agents, prepared waxes, candles, modelling pastes and dental preparations 28.46 45.36 CPS abolition 4.42 R&D credits 8.88 TAP payments 9.20 Regional grants 5.95 -28.46
(GAIN) 0.00
Miscellaneous chemical products 113.23 117.55 CPS abolition 12.62 R&D credits 25.33 TAP payments 26.25 Regional grants 49.03 -113.23
(GAIN) 0.00
Rubber and articles thereof 54.00 62.25 CPS abolition 4.71 R&D credits 3.35 TAP payments 17.24 Regional grants 28.69 -54.00
(GAIN) 0.00
Raw hides and skins (other than furskins) and leather 3.84 7.27 CPS abolition 0.33 R&D credits 0.10 TAP payments 1.60 Regional grants 1.81 -3.84 (GAIN) 0.00

civitas.org.uk/research/europe • 125
Table B13: Impact of mitigation for all industries (£ million)
Industry Tariff Costs Tariff Revenues
Articles of leather and articles of animal gut (other than silkworm gut) 12.57 40.72 CPS abolition 0.62 R&D credits 0.18 TAP payments 2.96 Regional grants 8.81 -12.57
(GAIN) 0.00
Furskins and artificial fur; manufactures thereof 0.35 1.11 CPS abolition 0.04 R&D credits 0.01 TAP payments 0.18 Regional grants 0.13 -0.35
(GAIN) 0.00
Wood and articles of wood; wood charcoal 8.45 48.82 CPS abolition 3.91 R&D credits 0.77 TAP payments 2.71 Regional grants 1.06 -8.45 (GAIN) 0.00
Cork and articles of cork 0.05 0.97 CPS abolition 0.02 R&D credits 0.00 TAP payments 0.01 Regional grants 0.01 -0.05
(GAIN) 0.00
Manufactures of straw, of esparto or of other plaiting materials; basketware and wickerwork 0.08 0.19 CPS abolition 0.03 R&D credits 0.01 TAP payments 0.02 Regional grants 0.02 -0.08
(GAIN) 0.00
Wool, fine or coarse animal hair; horsehair yarn and woven fabric 6.43 6.38 CPS abolition 0.30 R&D credits 0.08 TAP payments 1.43 Regional grants 4.61 -6.43
(GAIN) 0.00

civitas.org.uk/research/europe • 126
Table B13: Impact of mitigation for all industries (£ million)
Industry Tariff Costs Tariff Revenues
Wadding, felt and nonwovens; special yarns; twine, cordage, ropes and cables and articles thereof 7.35 15.68 CPS abolition 0.33 R&D credits 0.09 TAP payments 1.57 Regional grants 5.37 -7.35
(GAIN) 0.00
Headgear and parts thereof 1.40 2.67 CPS abolition 0.13 R&D credits 0.32 TAP payments 0.47 Regional grants 0.49 -1.40
(GAIN) 0.00
Umbrellas, sun umbrellas, walking sticks, seat-sticks, whips, riding-crops and parts 0.22 0.42 CPS abolition 0.01 R&D credits 0.03 TAP payments 0.05 Regional grants 0.12 -0.22
(GAIN) 0.00
Prepared feathers and down; artificial flowers; articles of human hair 0.17 0.29 CPS abolition 0.02 R&D credits 0.01 TAP payments 0.06 Regional grants 0.08 -0.17
(GAIN) 0.00
Glass and glassware 23.45 49.13 CPS abolition 8.43 R&D credits 2.34 TAP payments 4.70 Regional grants 7.97 -23.45
(GAIN) 0.00
Articles of iron or steel 31.55 55.03 CPS abolition 5.08 R&D credits 2.89 TAP payments 14.93 Regional grants 8.65 -31.55
(GAIN) 0.00

Table B13: Impact of mitigation for all industries (£ million)
Industry Tariff Costs Tariff Revenues
Copper and articles thereof 9.28 40.42 CPS abolition 3.51 R&D credits 1.70 TAP payments 4.07 Regional grants 0.00 -9.28
(GAIN) 0.00
Lead and articles thereof 2.99 0.86 CPS abolition 0.94 R&D credits 0.45 TAP payments 1.55 Regional grants 0.05 -2.99
(GAIN) 0.00
Zinc and articles thereof 2.18 2.16 CPS abolition 0.47 R&D credits 0.22 TAP payments 0.77 Regional grants 0.72 -2.18
(GAIN) 0.00
Other base metals and cermets 11.50 9.01 CPS abolition 1.44 R&D credits 0.69 TAP payments 2.38 Regional grants 6.98 -11.50
(GAIN) 0.00
Tools implements of base metal 9.04 17.90 CPS abolition 0.83 R&D credits 2.05 TAP payments 3.06 Regional grants 3.09 -9.04
(GAIN) 0.00
Miscellaneous articles of base metal 9.19 20.75 CPS abolition 1.00 R&D credits 2.46 TAP payments 3.66 Regional grants 2.07 -9.19
(GAIN) 0.00
civitas.org.uk/research/europe • 127

civitas.org.uk/research/europe • 128
Table B13: Impact of mitigation for all industries (£ million)
Industry Tariff Costs Tariff Revenues
Nuclear reactors, boilers, and mechanical appliances 210.35 366.27 CPS abolition 22.86 R&D credits 145.70 TAP payments 41.79 Regional grants 0.00 -210.35
(GAIN) 0.00
Electrical machinery 143.53 477.43 CPS abolition 21.65 R&D credits 230.30 TAP payments 0.00 Regional grants 0.00 -251.95
(GAIN) -108.42
Railway or tramway locomotives rolling stock 1.42 6.13 CPS abolition 0.23 R&D credits 12.50 TAP payments 0.00 Regional grants 0.00 -12.73
(GAIN) -11.30
Aircraft, spacecraft, and parts thereof 62.90 48.54 CPS abolition 10.51 R&D credits 206.20 TAP payments 0.00 Regional grants 0.00 -216.71
(GAIN) -153.81
Ships, boats and floating structures 4.28 1.88 CPS abolition 1.09 R&D credits 30.00 TAP payments 0.00 Regional grants 0.00 -31.09
(GAIN) -26.80
Optical, photographic, cinematographic, measuring, medical instruments and apparatus 51.55 73.51 CPS abolition 11.25 R&D credits 86.12 TAP payments 0.00 Regional grants 0.00 -97.37
(GAIN) -45.83

civitas.org.uk/research/europe • 129
Table B13: Impact of mitigation for all industries (£ million)
Industry Tariff Costs Tariff Revenues
Clocks and watches 1.51 7.59 CPS abolition 0.28 R&D credits 2.13 TAP payments 0.00 Regional grants 0.00 -2.40
(GAIN) -0.90
Musical instruments 0.85 2.50 CPS abolition 0.07 R&D credits 0.57 TAP payments 0.21 Regional grants 0.00 -0.85
(GAIN) 0.00
Arms and ammunition 1.18 2.50 CPS abolition 0.15 R&D credits 1.18 TAP payments 0.00 Regional grants 0.00 -1.33
(GAIN) -0.16
Furniture 12.90 58.16 CPS abolition 2.03 R&D credits 5.00 TAP payments 5.87 Regional grants 0.00 -12.90
(GAIN) 0.00
Toys, games and sports requisites 9.96 12.84 CPS abolition 1.79 R&D credits 4.41 TAP payments 3.75 Regional grants 0.00 -9.96
(GAIN) 0.00
Miscellaneous manufactured articles 7.69 25.27 CPS abolition 0.71 R&D credits 1.74 TAP payments 2.59 Regional grants 2.65 -7.69
(GAIN) 0.00

civitas.org.uk/research/europe • 130
Table B13: Impact of mitigation for all industries (£ million)
Industry Tariff Costs Tariff Revenues
DE MINIMIS PRODUCTS
Salt; sulphur; earths and stone; plastering materials, lime and cement 0.72 1.40 CPS abolition 4.73 R&D credits 1.32 TAP payments 0.00 Regional grants 0.00 -6.05
(GAIN) -5.33
Ores, slag and ash 0.00 0.00 CPS abolition 1.25 R&D credits 0.11 TAP payments 0.00 Regional grants 0.00 -1.36
(GAIN) -1.36
Pharmaceutical products 0.00 0.00 CPS abolition 19.56 R&D credits 616.40 TAP payments 0.00 Regional grants 0.00 -635.96
(GAIN) -635.96
Pulp of wood or of other fibrous cellulosic material;recovered (waste and scrap) paper or paperboard 0.00 0.00 CPS abolition 1.97 R&D credits 0.39 TAP payments 0.00 Regional grants 0.00 -2.37
(GAIN) -2.37
Paper and paperboard; articles of paper pulp, of paper or of paperboard 0.00 0.00 CPS abolition 19.02 R&D credits 3.76 TAP payments 0.00 Regional grants 0.00 -22.78
(GAIN) -22.78

Table B13: Impact of mitigation for all industries (£ million)
Industry Tariff Costs Tariff Revenues
Printed books, newspapers, pictures and other products of the printing industry 0.00 0.00 CPS abolition 13.45 R&D credits 2.66 TAP payments 0.00 Regional grants 0.00 -16.11
(GAIN) -16.11
Articles of stone, plaster, cement, asbestos, mica or similar materials 2.20 6.62 CPS abolition 6.26 R&D credits 1.74 TAP payments 0.00 Regional grants 0.00 -8.00
(GAIN) -5.80
Pearls, precious or semi-precious stones and metals 8.73 32.73 CPS abolition 5.69 R&D credits 14.01 TAP payments 0.00 Regional grants 0.00 -19.70
(GAIN) -10.97
Iron and steel 2.91 2.53 CPS abolition 8.29 R&D credits 1.18 TAP payments 0.00 Regional grants 0.00 -9.47
(GAIN) -6.56
Nickel and articles thereof 2.30 2.97 CPS abolition 2.26 R&D credits 1.09 TAP payments 0.00 Regional grants 0.00 -3.36
(GAIN) -1.06
Tin and articles thereof 0.00 0.00 CPS abolition 0.25 R&D credits 0.12 TAP payments 0.00 Regional grants 0.00 -0.37
(GAIN) -0.37
civitas.org.uk/research/europe • 131

civitas.org.uk/research/europe • 132
Table B13: Impact of mitigation for all industries (£ million)
Industry Tariff Costs Tariff Revenues
Works of art, collectors' pieces and antiques 0.00 0.00 CPS abolition 0.38 R&D credits 0.93 TAP payments 0.00 Regional grants 0.00 -1.31
(GAIN) -1.31
Source: supporting calculations
Table B14: SIC Industry Classifications
01 : Crop and animal production, hunting and related service activities Agricultural products
02 : Forestry and logging Agricultural products03 : Fishing and aquaculture Seriously affected non-agriculture05 : Mining of coal and lignite De Minimis06 : Extraction of crude petroleum and natural gas De Minimis08 : Other mining and quarrying De Minimis09 : Mining support service activities De Minimis10 : Manufacture of food products Agricultural products11 : Manufacture of beverages Agricultural products12 : Manufacture of tobacco products Agricultural products13 : Manufacture of textiles Seriously affected non-agriculture14 : Manufacture of wearing apparel Seriously affected non-agriculture15 : Manufacture of leather and related products Seriously affected non-agriculture16 : Manufacture of wood and of products of wood
and cork, except furniture; manufacture of articles of straw and plaiting materials De Minimis
17 : Manufacture of paper and paper products De Minimis18 : Printing and reproduction of recorded media De Minimis19 : Manufacture of coke and refined petroleum products Middle products20 : Manufacture of chemicals and chemical products Seriously affected non-agriculture21 : Manufacture of basic pharmaceutical products and
pharmaceutical preparations De Minimis22 : Manufacture of rubber and plastic products Seriously affected non-agriculture23 : Manufacture of other non-metallic mineral products De Minimis24 : Manufacture of basic metals Seriously affected non-agriculture25 : Manufacture of fabricated metal products,
except machinery and equipment Middle products26 : Manufacture of computer, electronic and optical products Middle products27 : Manufacture of electrical equipment Middle products28 : Manufacture of machinery and equipment n.e.c. Middle products29 : Manufacture of motor vehicles, trailers and semi-trailers Seriously affected non-agriculture30 : Manufacture of other transport equipment Middle products
SIC2 Assigned category

civitas.org.uk/research/europe • 133
Table B14: SIC Industry Classifications
31 : Manufacture of furniture Middle products32 : Other manufacturing Middle products33 : Repair and installation of machinery and equipment Middle products35 : Electricity, gas, steam and air conditioning supply Excluded services36 : Water collection, treatment and supply Excluded services37 : Sewerage Excluded services38 : Waste collection, treatment and disposal activities;
materials recovery Excluded services39 : Remediation activities and other waste management
services. This division includes the provision of remediation services, i.e. the cleanup of contaminated buildings and sites, soil, surface or ground water. Excluded services
41 : Construction of buildings Excluded services42 : Civil engineering Excluded services43 : Specialised construction activities Excluded services45 : Wholesale and retail trade and repair of
motor vehicles and motorcycles Excluded services46 : Wholesale trade, except of motor vehicles and motorcycles Excluded services47 : Retail trade, except of motor vehicles and motorcycles Excluded services49 : Land transport and transport via pipelines Excluded services50 : Water transport Excluded services51 : Air transport Excluded services52 : Warehousing and support activities for transportation Excluded services53 : Postal and courier activities Excluded services55 : Accommodation Excluded services56 : Food and beverage service activities Excluded services58 : Publishing activities Excluded services59 : Motion picture, video and television programme
production, sound recording and music publishing activities Excluded services60 : Programming and broadcasting activities Excluded services61 : Telecommunications Excluded services62 : Computer programming, consultancy and related activities Excluded services63 : Information service activities Excluded services64 : Financial service activities, except insurance and pension funding Excluded services65 : Insurance, reinsurance and pension funding, except compulsory
social security Excluded services66 : Activities auxiliary to financial services and insurance activities Excluded services68 : Real estate activities Excluded services69 : Legal and accounting activities Excluded services70 : Activities of head offices; management consultancy activities Excluded services71 : Architectural and engineering activities; technical testing
and analysis Excluded services72 : Scientific research and development Excluded services73 : Advertising and market research Excluded services74 : Other professional, scientific and technical activities Excluded services75 : Veterinary activities Excluded services77 : Rental and leasing activities Excluded services78 : Employment activities Excluded services79 : Travel agency, tour operator and other reservation service
and related activities Excluded services
SIC2 Assigned category

civitas.org.uk/research/europe • 134
Table B14: SIC Industry Classifications
80 : Security and investigation activities Excluded services81 : Services to buildings and landscape activities Excluded services82 : Office administrative, office support and
other business support activities Excluded services84 : Public administration and defence; compulsory social security Excluded services85 : Education Excluded services86 : Human health activities Excluded services87 : Residential care activities Excluded services88 : Social work activities without accommodation Excluded services90 : Creative, arts and entertainment activities Excluded services91 : Libraries, archives, museums and other cultural activities Excluded services92 : Gambling and betting activities Excluded services93 : Sports activities and amusement and recreation activities Excluded services94 : Activities of membership organisations Excluded services95 : Repair of computers and personal and household goods Excluded services96 : Other personal service activities Excluded services
SIC2 Assigned category

Appendix III: Technical notes
The compilation of the base study for this paper
The data on tariff costs and revenues are taken from Protts “Potential post-Brexit tariff costsfor EU-UK trade” (Civitas, October 2016). That paper analysed import data from 2015,combined with the EU’s Most Favoured Nation tariff schedule, to provide the most up-to-dateestimate of tariffs that would be payable on UK-EU trade if that trade continued under the‘WTO-only’ option. The study is ‘static’, i.e. it does not take into account the elasticity of salesin response to tariff-induced price increases.
Categorisation of agricultural products
The formal definition of ‘agricultural products’154 is:
HS Chapters 1 to 24 less fish and fish productsHS Code 2905.43 (mannitol)HS Code 2905.44 (sorbitol)HS Heading 33.01 (essential oils)HS Headings 35.01 to 35.05 (albuminoidal substances, modified starches, glues)HS Code 3809.10 (finishing agents)HS Code 3823.60 (sorbitol n.e.p.)HS Headings 41.01 to 41.03 (hides and skins)HS Heading 43.01 (raw furskins)HS Headings 50.01 to 50.03 (raw silk and silk waste) HS Headings 51.01 to 51.03 (wool and animal hair)HS Headings 52.01 to 52.03 (raw cotton, waste and cotton carded or combed)HS Heading 53.01 (raw flax)HS Heading 53.02 (raw hemp)
The base study from which the data for this paper has been derived is conducted at the HSChapter level and is insufficiently granular to apply this definition precisely. Therefore, theresults for Chapters 1-2, 4-24 and 35 have been used as a very close proxy for the actualfigures. Chapter 16 (preparations of meat and fish) and Chapter 35 (albuminoidal substances)have been included because the bulk of the underlying value within those Chapters wouldqualify as agricultural products. In contrast, Chapter 41 (leather and animal gut), Chapter 43(furskins and artificial fur), Chapter 50 (silk), Chapter 52 (cotton) and Chapter 53 (othervegetable textile fabrics) have been excluded because, whilst sub-sections of the trade inthose areas would qualify, the bulk of the value exported by the UK would not.
Exchange rates
The underlying study on which this paper is based used COMTRADE data for 2015 on importsby the UK and the EU-27. This data is reported in US dollars using an annual averageexchange rate for 2015 of £1 = $1.528854155 on the cif value of the imports. That value hasbeen used to convert COMTRADE figures back into sterling values.
civitas.org.uk/research/europe • 135
154 Agriculture Agreement 1994, Annex 1.155 See https://comtrade.un.org/db/mr/daExpNoteDetail.aspx?r=826&y=2015, (accessed 17/11/16).

Since 2015 there has been considerable volatility in the foreign exchange markets, causednot the least by the prospect of Brexit. For the foreseeable future all currency conversionestimates are likely to be unreliable. Therefore the decision has been taken to compile thispaper on the basis of 2015 values, as a consistent basis for illustrative comparison, and tonot attempt to update them in the light of subsequent events.
It is a reasonable assumption that, given currency movements since June 2016, in practicethe headline sterling value of both tariff costs for UK exporters and the revenue raised onimports from the EU-27 would be greater than suggested in this paper. However the relativemagnitudes between them, and more importantly the effective tariff rates on particularcommodities used in this paper to categorise the various industries, will not differ materially.
Currency conversion is only relevant in regard to factors which, because of the UK’smembership of the EU, are at present denominated in euros: (i) international trade limitsnegotiated by the EU collectively, of which the most significant is the Total AMS Commitmentfor agricultural products; and (ii) domestic restrictions imposed on the UK by EU law, such asthe criteria for qualification as an SME.
In regard to the first group, as explained in the main text, the calculation of any exchange ratefor setting the new sovereign UK limit will itself be a matter for negotiation. There is no valuein attempting to pre-empt that aspect of the Brexit process in this paper. In regard to the secondgroup, since they derive from EU law, such limits are of no relevance in the post-Brexitenvironment. Were there to be a UK-EU treaty governing access to the single market, the UKwould almost certainly have to concede limits on its freedom of action over matters such asstate aid. But the premise of this paper is that no such agreement is reached, and so therefore there is no need to consider the sterling equivalent of limits which are of no furtherconcern.
Classification of industries
The ONS classify businesses by reference to the Standard Industrial Classification (SIC)system, based around 84 activities undertaken by enterprises.156 It does not dovetail with theHS Classification system used elsewhere in this paper, which tracks the commodity being soldrather than the enterprise responsible for producing it.
The following broad assignments have been made:
• ‘Agricultural products’ are taken as the SIC divisions for crop and animal production (01);forestry (02); and the manufacture of food products, beverages and tobacco (10-12).
In the analysis of R&D, the high-level grouping ‘Agriculture, hunting and forestry; fishing’ meansthat fish products are included within this category, but that is unlikely to cause a materialdistortion.
• ‘Seriously-affected non-agricultural products’ are taken as the SIC divisions for textiles,apparel and leather goods (13-15); chemicals (20); rubber and plastic (22); basic metals(24); and motor vehicles (29).
civitas.org.uk/research/europe • 136
156 The numbering goes up to 96, but there is no assignment for 04, 07, 34, 40, 44, 48, 54, 57, 67, 76, 83 or 89.

All of these involve difficulties. Rubber products and most of the basic metals actually fall intothe ‘middle products’ category, but at the 2-digit SIC coding level they are grouped with othercommodities (plastics and aluminium, respectively) which are ‘seriously-affected’ for thepurposes of this paper. Since the ONS does not publish usable data with greater detail, thedecision has been taken to treat both divisions as ‘seriously-affected’. This overstates the trueposition, but errs on the side of caution. Therefore in Table B11, relating to energy usage, ‘non-ferrous metals’ in the underlying BEIS data is treated as referring to aluminium.
• ‘De minimis products’ are taken as the SIC divisions for mining and quarrying (05-09);wood products, paper products and printing (16-18); pharmaceuticals (21); and othernon-metallic mineral products (23).
This is a reasonably close alignment. Any discrepancies are likely to arise from the high-levelaveraging approach taken in the underlying base study. The only difficult issue relates to theceramics industry, which falls within division 23 and which is a seriously-affected non-agricultural product. As it happens SIC division 23 does not figure in the Top 3 location rankingsof any of the disadvantaged Areas, so this does not change the outcome of Tables B8, B9 orB10. It does become an issue in considering electricity usage (see later note).
• ‘Excluded services’ are taken as the SIC divisions for electricity and gas (35); watersupply and waste (36-39); construction (41-43); wholesale and retail trade (45-47);transportation and storage (49-53); accommodation (55-56); information andcommunication (58-63); financial services (64-66); real estate (68); professional services(69-75); administrative and support services (77-82); public administration (84); education(85); health and social work (86-88); arts and entertainment (90-93); and other services(94-96).
These are areas which are not engaged to any great degree in the export of commodity goods,and hence which will not be affected by tariffs.
• ‘Middle products’ represent everything else in the SIC coding and ONS source data.
These results are summarised in Table B13.
Geographical tests for Map 2
The original grounds for a ‘non-actionable’ regional policy under the SCM Agreement157 were:
• A “disadvantaged region” had to represent a contiguous geographical area with adefinable economic and administrative identity
• The region has to be assessed as disadvantaged on neutral and objective criteria capableof verification
• Those criteria must include at least one of:
civitas.org.uk/research/europe • 137
157 SCM Agreement 1994, Article 8.2(b).

o An income test, in which either income per capita, household income per capita,or GDP per capita, does not exceed 85% of the national average
o An unemployment test, in which the local unemployment rate is at least 110% ofthe national average
• The criteria have to be measured over three years.
In compiling Map 2, the obvious basis for measurement is the lowest available administrativeunit, i.e. unitary authorities, metropolitan and London boroughs, and district councils in England(326), principal areas in Wales (22), council areas in Scotland (32) and district councils inNorthern Ireland (from 2015, 11).
In respect of the income test, ONS produces a consistent measure of Gross Value Added(GVA) per head for the whole of the UK, broken down by local administrative units. This is agood proxy for GDP per head. The data used is taken from the ONS statistical bulletin“Regional Gross Value Added (Income Approach)” Table 2, released 9 December 2015(accessed 16/11/16). There are two drawbacks with this data for the purposes of compilingMap 2: (i) at the time of writing, the most recent available data only extended to 2014, i.e. itmissed out the base year for this paper (2015); and (ii) GVA averages are published down tothe NUTS 3 measurement unit, i.e. although standalone figures are available for the largerlocal authorities, in some cases smaller administrative units are amalgamated.
In applying the income test, the decision has been taken to use only two-year averages, for2013 and 2014. That is the most consistent comparison with the unemployment test and therest of the data used in this paper. It would be more distortive to use a three-year average2012-2014. The assumption has also been made that all local authorities within a NUTS 3grouping have the same GVA per head as that of the grouping as a whole. This is the onlypracticable approach. Although it clearly leads to distortive results at the individual localauthority level, across the UK as a whole the effect should even out. For every low-incomeauthority which fails the test because it has been amalgamated with more affluent neighbouringdistricts, some districts will pass the test because of the statistical influence of a low-incomeblackspot. The issue is theoretically most acute in Northern Ireland because, following a localgovernment reorganisation in 2015 (which amalgamated 26 councils into 11), the currentboundaries do not dovetail with the NUTS 3 areas. It is less relevant in practice because theavailable data indicates that, apart from Belfast City, the whole of Northern Ireland would passthe income test anyway.
In respect of the unemployment test, ONS do not publish data for a consistent measure ofunemployment in each local authority across the whole of the UK. The widest coverage is dataextracted from the Annual Population Survey (accessed 16/11/16 from the NOMIS website)for each local authority in Great Britain for the unemployment rate for those aged 16-64 overthe calendar years 2013, 2014 and 2015. There are two drawbacks with this data for thepurposes of compiling Map 2: (i) although there is a comparable unemployment rate forNorthern Ireland as a whole, results for the individual councils are not available; and (ii) in anumber of instances ONS suppress the data for a given local authority in a given year on thegrounds that they do not consider the result to be statistically reliable.
civitas.org.uk/research/europe • 138

In applying the unemployment test to Northern Ireland, NISRA data (accessed from the NINISwebsite 16/11/16) on average claimant count rates for each local authority for the calendaryears 2013, 2014 and 2015, compared to the UK average over the same period, has beenused as a proxy. This is unlikely to give a distortive result since the available evidence indicatesthat all local authority areas in Northern Ireland would pass the unemployment test in anyevent. In respect of Great Britain authorities, where the underlying data for any year has beenwithheld by ONS as being unreliable, that year has been excluded from the averaging. Thatleft four authorities (the City of London; the Isles of Scilly; Ryedale; and West Somerset) whereno local unemployment average could be derived. Therefore ONS data on December claimantcount rates for each year were again compared to the UK average as a proxy figure. In allfour cases, the test was not passed.
The location of industries
ONS produces data on ‘location quotients’ for each industry in the SIC classification. Thesemay be calculated in one of either two ways:
• Industry X’s share of the jobs in Area A, compared to the Industry X share of the nationaltotal of jobs – this would be a measure of the degree to which Area A specialises inworkers for Industry X (i.e. Industry X has a higher or lower share of the jobs in Area Athan its national average)
• The proportion of the jobs in Industry X which occur in Area A, compared to the proportionof the national total of jobs which fall in Area A – this would be a measure of the degreeto which Industry X is relatively concentrated in Area A (i.e. Industry X has placed a higheror lower proportion of its workforce in Area A than the national average would suggest)
Algebraically, these expressions are identical. If the quotient equals 1.00, it means that thepresence of Industry X in Area A is identical to the national average. A figure greater than 1.00indicates both that Industry X is concentrated in Area A, and that Area A specialises in jobs inIndustry X. The larger the quotient, the stronger the effect being exhibited.
This is not the same as saying that the industry with the highest quotient for Area A isnecessarily the largest employer in Area A. It would be quite possible for an industry with alow national workforce to be wholly concentrated within one local authority (with, inconsequence, a very high location quotient in that area) and yet to be relatively insignificantin absolute terms within the employed workforce for that authority as a whole. For example, ifthe only breeder of pink flamingos in the country happened to live in Sunderland, Sunderlandwould have a very high location quotient for the pink flamingo industry, and the locationquotient for the car industry would be smaller (although higher than 1.00) notwithstanding themuch larger workforce employed at the local Nissan factory.
However, what a high quotient for an industry in a given authority indicates is the degree towhich assistance directed at that area would benefit that industry, because of the extent of itsconcentration at that locality. It is in that sense that the figures are used in this paper.
The ONS data used in this paper is derived from the 2011 Business Register and EmploymentSurvey, covering local authorities within Great Britain. There are no comparable data forNorthern Ireland. The best available reports proportions of the workforce for NUTS 3 areas in
civitas.org.uk/research/europe • 139

terms of very broad industry groupings. The figures indicate that in all five of these sub-areasof Northern Ireland, the largest employer is the public sector (“Public Administration, educationand health”), followed by Excluded services (“Distribution, Hotels and Restaurants”). In all five sub-areas “Manufacturing” is ranked third, but there is no further analysis by product type,and hence no means of assessing the degree to which each local authority is affected by EU-27 tariffs.
In assessing industrial location, therefore, the simple assumption has been made that none ofthe authority areas in Northern Ireland count as having a seriously-affected industry (whetheragricultural or otherwise) in the Top 3 rankings, and none of them have Top 3 rankings drawnwholly from Excluded services. That is probably unrealistic. The point is somewhat academicin practice since the whole of Northern Ireland passes the tests for qualifying as a‘disadvantaged region’, with everywhere outside Belfast City falling within Area III, so there ismaximum scope for mitigation through regional aid.
In compiling the specific details for each ‘seriously-affected’ industry (Tables 16, 18, 20, 22,24 and 26) a significance threshold of a quotient of 3.0 has been used, i.e. a location is notincluded unless the workforce employment in the industry is at least three times the nationalaverage (although this is relaxed slightly for Table 26).
Electricity figures
The source data for electricity usage is taken from BEIS “Digest of UK Energy Statistics”(DUKES), Table 5.1, released 28 July 2016. For the purposes of that publication a distinctionis drawn between usage by the energy industry itself, and ultimate end-users. This distinctionis not relevant for this paper, which is concerned with the actual users of all generatedelectricity, so energy industry usage is added back. Some might have a conceptual difficultywith the notion of passing a cost saving on electricity to a generator who uses their own productanyway and is not buying it in from outside, but every GWh of their own electricity which agenerating company uses is a GWh which they cannot sell to a customer and have lost income,and these businesses are surely recognising their own energy costs somewhere in theiraccounts. Therefore there are differences between the official DUKES figures and this paperin regard to headline total usage and shares for each industry.
DUKES reports user industries in very broad categories which are derived from the SIC systemand which do not reconcile easily to the categories used in this paper. The main difficultiesarise in regard to DUKES groupings ‘Non-ferrous metals’ and ‘Mineral products’. It is assumedthat these refer to aluminium production and ceramics respectively, industries which are knownto be energy-intensive and which both fall within the ‘seriously-affected non-agriculturalproducts’ category. That almost certainly overstates the true position, but introduces a lessmaterial discrepancy than would treating either in a different category. Less contentious is theassumption that the DUKES grouping ‘Other industries’ refers to a form of manufacturing thatcomes within the ‘middle products’ category.
Costing of the mitigation proposals
In assessing the benefit of the CPS abolition, the total revenue raised for HM Treasury (£1.2 billion) is apportioned among each consumer group in the percentages given in Table B11. Where any of the consumer groups in Table B11 straddles more than one HS
civitas.org.uk/research/europe • 140

Chapter, the benefit is apportioned among them using the value of their exports, as a proxyfor economic activity.
In assessing the benefit of increased R&D credits, the basic assumption is as explained in themain text, that a 1% increase in RDEC rate is equivalent to a benefit of 10/11% of actual R&Dspending by businesses. The total R&D expenditure for 2015 is taken from Table B4 and therelevant increased rates applied to each type of R&D. Where any of the business groups inTable B4 straddles more than one HS Chapter, the benefit is apportioned among them usingthe value of their exports, as a proxy for economic activity.
TAP payments are calculated as being 1% of exports for each HS Chapter, but further cappedat the amount required to fully mitigate those costs. If CPS abolition and R&D credits havealready done so, no TAP payments are scored for a product.
Regional aid payments are taken as the balancing amount required to fully mitigate costs.Payments to agricultural product groups are taken as incurring no leakage. Payments to‘middle product’ and ‘de minimis product’ groups are taken as incurring leakage at the averagerate for all assisted areas. In the case of ‘seriously-affected’ products, a more precisecalculation is made using an average leakage rate. The assisted areas in Tables 16, 18, 20,22, 24 and 26 are scored by type, weighted according to the location quotient of each (e.g. anArea I authority with a location quotient of 10 would score as a weighting of 10 for the Area Ileakage rate). This produces a blended rate which varies from product to product dependingon the composition of the areas in which it is concentrated.
civitas.org.uk/research/europe • 141

Author
William Norton is a non-practising solicitor who has worked in the City of London and as a policy adviser in Westminster. He was a core member of the James Review on Taxpayer Value and the Conservative Party Policy Unit (2004-5). He worked for the victorious designated lead campaigns in the North East referendum (2004), the AV referendum (2011) and the EU referendum (2016). Among numerous articles, papers and books, William is the author of Monument and Bank: Capitalism and the Anglo-Saxon Mind (SAU, 2011).
civitas.org.uk/research/europe • 142
55 Tufton Street, London SW1P 3QLT: 020 7799 6677E: [email protected]
Civitas: Institute for the Study of Civil Society is an independent think tank which seeks to facilitate informed publicdebate. We search for solutions to social and economic problems unconstrained by the short-term priorities ofpolitical parties or conventional wisdom. As an educational charity, we also offer supplementary schooling to helpchildren reach their full potential and we provide teaching materials and speakers for schools.
Civitas is a registered charity (no. 1085494) and a company limited by guarantee, registered in England and Wales(no. 04023541).