Embed Size (px)
Citation preview
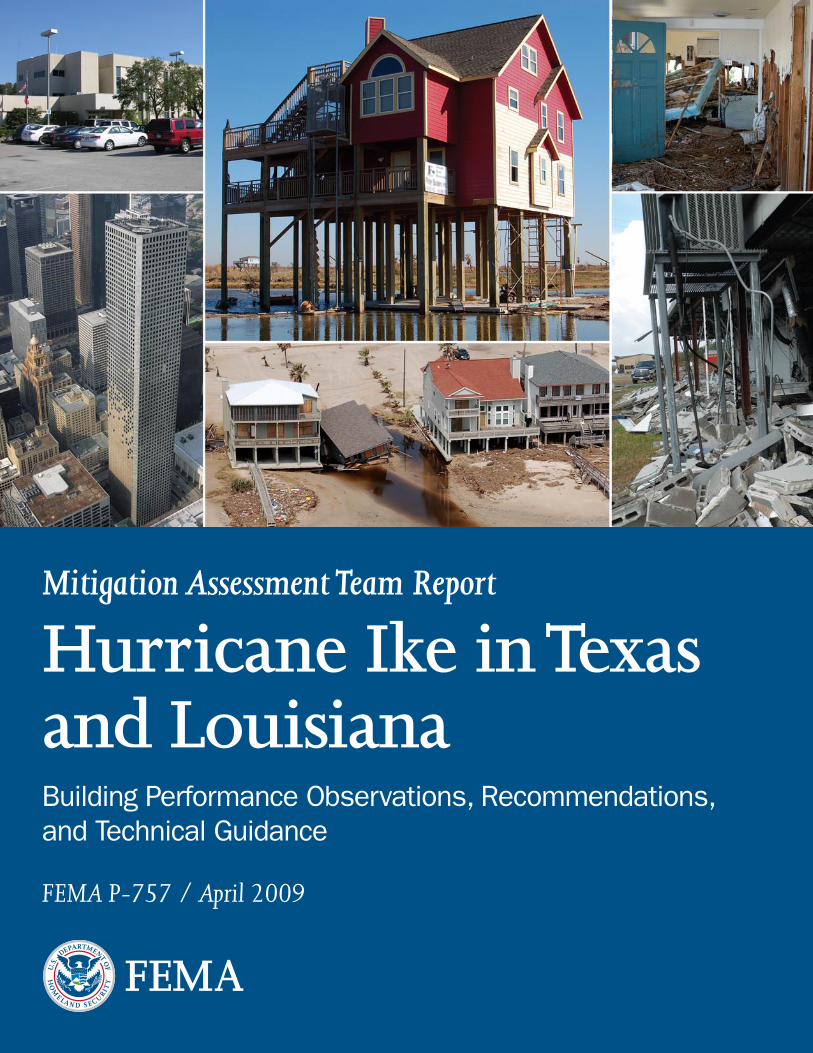
Mitigation Assessment Team Report
Hurricane Ike in Texasand LouisianaBuilding Performance Observations, Recommendations, and Technical Guidance
FEMA P-757 / April 2009
FEMA
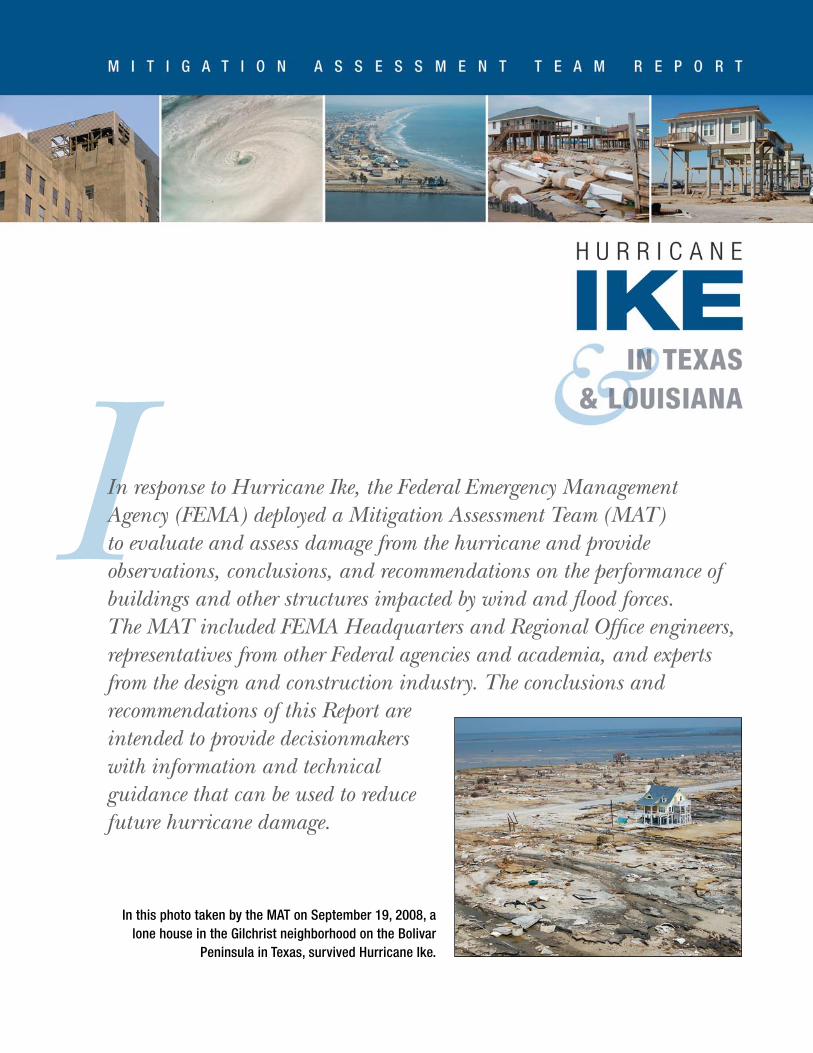
IIn response to Hurricane Ike, the Federal Emergency Management Agency (FEMA) deployed a Mitigation Assessment Team (MAT) to evaluate and assess damage from the hurricane and provide observations, conclusions, and recommendations on the performance of buildings and other structures impacted by wind and flood forces. The MAT included FEMA Headquarters and Regional Office engineers, representatives from other Federal agencies and academia, and experts from the design and construction industry. The conclusions and recommendations of this Report are intended to provide decisionmakers with information and technical guidance that can be used to reduce future hurricane damage.
In this photo taken by the MAT on September 19, 2008, a lone house in the Gilchrist neighborhood on the Bolivar
Peninsula in Texas, survived Hurricane Ike.


FEMA P-757Catalog No: 09035-1
M I T I G A T I O N A S S E S S M E N T T E A M R E P O R T
Hurricane Ike in Texas and Louisiana
Building Performance Observations, Recommendations, and Technical Guidance
FEMA P-757 / April 2009
FEMA
MITIGATION ASSESSMENT TEAM REPORT HURRICANE IKE IN TEXAS ANd LoUISIANA
Executive SummaryEric Letvin
Chapter 1Vassiliki Koumoudis
Chris Jones
Larry Tanner
Wallace Wilson
Chapter 2Larry Tanner Chris Jones
Dave Low
Wallace Wilson
Chapter 3Chris Jones
Larry Tanner David Johnston
Dave Low
Mark Matulik
Tom Smith
Wallace Wilson
Chapter 4Tom Smith
David Conrad
Dave Low
Mark Matulik
Wallace Wilson
Chapter 5Tom Smith
David Conrad
Chapter 6All
Chapter 7 All
Chapter 8 Janice Olshesky
Team LeaderPaul Tertell, PE, FEMA HQ
Team ManagerEric Letvin, PE, Esq., CFM, URS Group, Inc.
Team MembersKent Baxter, FEMA Region 6
David L. Conrad, PE, PBS&J
Claudette Fetterman, FEMA HQ
Lois Forster, FEMA HQ
Philip Grankowski, International Code Council
David S. Johnston, Vinyl Siding Institute, Inc.
Christopher P. Jones, PE
Vassiliki Koumoudis, URS Group, Inc.
Emanuel Lain, Jr., MPA, FEMA LA TRO
Dave Low, PE, D.K. Low & Associates
CW Macomber, APA
Mark Matulik, CFM, MPA, Dewberry
Janice Olshesky, AIA, Olshesky Design Group LLC
Tim Reinhold, Institute for Business and Home Safety
Thomas L. Smith, AIA, RRC, TLSmith Consulting, Inc.
Larry J. Tanner, PE, MASCE, MAAWE, Wind Engineering Research Center, Texas Tech University
Charles Tobelman, FEMA LA TRO
Jonathan Westcott, PE, FEMA HQ
Brian Willsey, FEMA HQ
Wallace A. Wilson, PE, CFM, W.A. Wilson Consulting Services, LLC
Gary Zimmerer, PE, FEMA Region 6
Technical Editor: Susan Ide Patton, URS Group, Inc.
Publication Designer: Wanda Rizer, Consultant
Graphic Artist: Julie Liptak, Greenhorne & O’Mara, Inc.
Chapter Leaders and Authors
Team Members
Members of the Mitigation Assessment Team
HURRICANE IKE IN TEXAS ANd LoUISIANA MITIGATION ASSESSMENT TEAM REPORT ix
TOC TABLE OF CONTENTS
Table of Contents Executive Summary .................................................................................................................... i
Mitigation Assessment Team (MAT)............................................................................................... ii
Assessment Observations ................................................................................................................ iii
Flood Damage ..................................................................................................................... iii
Wind Damage ....................................................................................................................... iv
Critical Facilities Damage ..................................................................................................... v
Recommendations ............................................................................................................................v
Flood .................................................................................................................................... v
Wind ..................................................................................................................................vii
Critical Facilities .................................................................................................................vii
1 Introduction ........................................................................................................................ 1-1
1.1 Hurricane Ike – The Event ............................................................................................... 1-2
1.1.1 Summary of Damage and Economic Loss ...........................................................1-5
1.1.2 Timeline and History of Hurricane Ike ................................................................1-7
1.2 Coastal Flooding ............................................................................................................... 1-9
1.2.1 Shoreline Characteristics ......................................................................................1-9
1.2.2 Subsidence ..............................................................................................................1-9
1.2.3 Hurricane Ike High Water Marks .......................................................................1-10
x MITIGATION ASSESSMENT TEAM REPORT HURRICANE IKE IN TEXAS ANd LoUISIANA
TABLE OF CONTENTS TOC
1.3 Wind Hazard Analysis and Discussion ........................................................................... 1-12
1.3.1 H*Wind ................................................................................................................1-15
1.3.2 HAZUS-MH ..........................................................................................................1-16
1.4 Historic Hurricanes ........................................................................................................ 1-21
1.5 FEMA Mitigation Assessment Teams ............................................................................. 1-27
1.5.1 Purpose of the MAT .............................................................................................1-27
1.5.2 Team Composition ...............................................................................................1-27
1.5.3 Methodology ........................................................................................................1-28
2 Floodplain Management Regulations, Building Codes, and Standards ..................... 2-1
2.1 Floodplain Management Regulations.............................................................................. 2-1
2.1.1 Flood Studies and Flood Maps .............................................................................2-2
2.1.1.1 Accuracy of Flood Insurance Studies and Flood Insurance Rate Maps ..................................................................2-4
2.1.1.2 Implication of FIRMs on Rebuilding and Building Safety ...................2-6
2.1.1.3 Higher Regulatory Standards ................................................................2-6
2.2 Building Codes and Standards ......................................................................................... 2-6
2.2.1 Flood Requirements ..............................................................................................2-8
2.2.1.1 Flood Requirements in the IBC and the IRC ........................................2-8
2.2.1.2 Flood Requirements in ASCE 7-05 .........................................................2-9
2.2.1.3 Flood Requirements in ASCE 24-05 .....................................................2-10
2.2.1.4 Flood Requirements in Texas ...............................................................2-11
2.2.1.5 Flood Requirements in Louisiana ........................................................2-112.2.2 Wind Requirements .............................................................................................2-11
2.2.2.1 Wind Requirements in the IBC ............................................................2-11
2.2.2.2 Wind Requirements in Texas ...............................................................2-11
2.2.2.3 Wind Requirements in Louisiana ........................................................2-172.2.3 HUD Manufactured Housing Design Standards ..............................................2-17
2.2.3.1 Manufactured Housing in Texas ..........................................................2-19
2.2.3.2 Manufactured Housing in Louisiana ..................................................2-192.2.4 Galveston Residential Hurricane Resistance Study, 1990 .................................2-20
2.2.4.1 Ike MAT Observations of Houses in the 1990 Galveston Study .........2-21
2.2.4.2 MAT Summary of Findings Regarding the Galveston Study .............2-25
HURRICANE IKE IN TEXAS ANd LoUISIANA MITIGATION ASSESSMENT TEAM REPORT xi
TOC TABLE OF CONTENTS
2.3 Texas Windstorm Program ............................................................................................ 2-26
2.3.1 Texas Department of Insurance ..........................................................................2-26
2.3.2 Basic Tenets of the Texas Windstorm Code .......................................................2-27
2.3.3 Texas Windstorm Program – Insights and Opinions .........................................2-29
2.4 Enhanced Code Construction ....................................................................................... 2-30
3 Performance of Residential Buildings (Flood and Wind), One- to Two-Family and Multi-Family ............................................................................ 3-1
3.1 Structural Performance .................................................................................................... 3-1
3.1.1 Foundation Performance .....................................................................................3-2
3.1.1.1 Foundation Function 1: Elevate the Building .......................................3-5
3.1.1.2 Foundation Function 2: Resist Scour and Erosion .............................3-11
3.1.1.3 Foundation Function 3: Provide a Continuous Load Path to the Ground ........................................................................................3-17
3.1.1.4 Foundation Function 4: Resist Flood Loads ........................................3-213.1.2 Main Wind Force Resisting System .....................................................................3-27
3.1.2.1 High Winds ...........................................................................................3-27
3.1.2.2 Combination of Loads – MWFRS and C&C ........................................3-30
3.1.2.3 Load Paths .............................................................................................3-323.1.3 Elevation and Freeboard .....................................................................................3-39
3.1.4 Siting Effects on Structural Performance ...........................................................3-40
3.2 Envelope Damage ........................................................................................................... 3-42
3.2.1 Roof Systems .........................................................................................................3-43
3.2.1.1 Asphalt Shingles ....................................................................................3-44
3.2.1.2 Metal Panels ..........................................................................................3-50
3.2.1.3 Tile ........................................................................................................3-513.2.2 Non-Load-Bearing Walls and Wall Coverings ....................................................3-52
3.2.2.1 Brick Veneer ..........................................................................................3-55
3.2.2.2 Vinyl Siding............................................................................................3-57
3.2.2.3 Fiber Cement Siding .............................................................................3-64
3.2.2.4 Wood and Hardboard Siding ...............................................................3-683.2.3 Doors .....................................................................................................................3-69
3.2.4 Windows and Shutters .........................................................................................3-69
3.2.5 Soffit and Roof Ventilation ..................................................................................3-75
xii MITIGATION ASSESSMENT TEAM REPORT HURRICANE IKE IN TEXAS ANd LoUISIANA
TABLE OF CONTENTS TOC
3.2.5.1 Soffits .....................................................................................................3-75
3.2.5.2 Ridge Vents ...........................................................................................3-77
3.2.5.3 Gable End Vents ....................................................................................3-783.2.6 Exterior-Mounted Equipment .............................................................................3-79
3.3 Other Damage ................................................................................................................. 3-81
3.3.1 Breakaway Walls ...................................................................................................3-81
3.3.2 Sheathing on the Underside of Elevated Buildings ...........................................3-84
3.3.3 Parking Slabs and Grade Beams..........................................................................3-87
3.3.4 Mold and Contamination ....................................................................................3-91
3.3.5 Other Issues and Problems ..................................................................................3-91
3.4 Manufactured Housing................................................................................................... 3-92
3.4.1 Texas .....................................................................................................................3-93
3.4.2 Louisiana .............................................................................................................3-95
3.4.2.1 Cameron and Vermilion Parishes ........................................................3-95
3.4.2.2 Jefferson Parish .....................................................................................3-95
3.4.2.3 Lafourche Parish ...................................................................................3-97
3.4.2.4 Manufactured Home Anchoring and Support Systems ......................3-97
3.5 Mitigation Projects .......................................................................................................... 3-98
4 Performance of Critical Facilities ................................................................................... 4-1
4.1 Schools/Shelters ............................................................................................................... 4-4
4.1.1 Crenshaw Elementary and Middle School (Port Bolivar, TX) ............................4-4
4.1.2 South Cameron Parish High School (Grand Chenier, LA) ................................4-8
4.1.3 Johnson’s Bayou School, (Cameron,LA) ..............................................................4-9
4.2 Hospitals/Health Centers .............................................................................................. 4-12
4.2.1 San Jacinto Methodist Hospital (Baytown, TX) .................................................4-12
4.2.2 Winnie Community Hospital (Winnie, TX) .......................................................4-17
4.2.3 University of Texas Medical Branch (Galveston, TX) .......................................4-20
4.2.4 South Cameron Parish Hospital, (Cameron,LA)...............................................4-27
4.2.5 Hackberry Rural Medical Clinic (Hackberry, LA) .............................................4-31
4.2.6 Oceanview Transitional Care Center (Texas City, TX) ......................................4-32
4.3 First Responder Facilities (Police/Fire/EOC) .............................................................. 4-35
HURRICANE IKE IN TEXAS ANd LoUISIANA MITIGATION ASSESSMENT TEAM REPORT xiii
TOC TABLE OF CONTENTS
4.3.1 Houston Transtar – Regional EOC (Houston, TX) ..........................................4-35
4.3.2 Deer Park Police (Deer Park, TX) ......................................................................4-40
4.3.3 Port Neches Fire Station, (Port Neches,TX) ......................................................4-42
4.3.4 High Island Fire Station (High Island, TX) .......................................................4-45
4.3.5 Louisiana Fire Stations ........................................................................................4-46
4.4 Other Government Buildings ........................................................................................ 4-50
4.4.1 U.S. Army Corps of Engineers Administration Building (Galveston, TX) .......4-50
4.4.2 Federal Courthouse and Post Office (Galveston, TX) ......................................4-51
4.4.3 Tiki Island City Hall (Tiki Island, TX) ...............................................................4-54
4.4.4 Terrebonne Parish Criminal Justice Complex (Houma, LA) ...........................4-56
5 Performance of Buildings in Houston’s Central Business District ............................ 5-1
5.1 Areas Outside Clusters A and B ....................................................................................... 5-2
5.2 Cluster A – JP Morgan Chase Area .................................................................................. 5-6
5.2.1 Granite Veneer ....................................................................................................5-12
5.2.2 Roof Systems and Rooftop Equipment ...............................................................5-12
5.2.3 Nearby Building Performance ...........................................................................5-13
5.3 Cluster B – Chevron Center Area .................................................................................. 5-16
5.3.1 Glazing ..................................................................................................................5-17
5.3.2 Roof Systems and Rooftop Equipment ..............................................................5-20
5.3.3 Nearby Building Performance ............................................................................5-21
5.4 Vegetative Roofs .............................................................................................................. 5-25
6 Conclusions ........................................................................................................................ 6-1
6.1 Residential ......................................................................................................................... 6-2
6.1.1 Flood .......................................................................................................................6-2
6.1.2 Wind ........................................................................................................................6-5
6.2 Critical Facilities ................................................................................................................ 6-8
6.2.1 Flood .......................................................................................................................6-8
6.2.2 Wind ........................................................................................................................6-9
6.3 Houston’s Central Business District ............................................................................... 6-12
xiv MITIGATION ASSESSMENT TEAM REPORT HURRICANE IKE IN TEXAS ANd LoUISIANA
TABLE OF CONTENTS TOC
7 Recommendations ............................................................................................................ 7-1
7.1 Residential ......................................................................................................................... 7-1
7.1.1 Flood .......................................................................................................................7-2
7.1.2 Wind ........................................................................................................................7-6
7.2 Critical Facilities ................................................................................................................ 7-7
7.2.1 Flood .......................................................................................................................7-8
7.2.2 Wind ........................................................................................................................7-8
7.3 Further Studies and Standards Revisions ...................................................................... 7-10
7.3.1 Flood .....................................................................................................................7-10
7.3.2 Wind ......................................................................................................................7-10
7.3.3 Critical Facilities ...................................................................................................7-13
8 Planning for a Sustainable Coast .................................................................................... 8-1
8.1 Geologic Hazards and Coastal Communities ................................................................. 8-2
8.1.1 Geologic Hazards That Threaten Coastal Communities .....................................8-2
8.1.1.1 Subsidence and Relative Sea Level Rise.................................................8-3
8.1.1.2 Shoreline Erosion ...................................................................................8-6
8.1.1.3 Dunes and Wetland Loss ........................................................................8-88.1.2 Discussion of Conflicts Between Coastal Communities and Geological Hazards .........................................................................................8-9
8.2 Existing Planning Resources and Programs .................................................................. 8-10
8.2.1 Texas ....................................................................................................................8-10
8.2.2 Louisiana .............................................................................................................8-11
8.2.3 Nationwide Initiatives ..........................................................................................8-12
8.3 Recommendations for Rebuilding After Ike ................................................................. 8-15
8.3.1 Specific to Local Communities ...........................................................................8-15
8.3.2 General Recommendations – State Level ..........................................................8-17
8.3.3 General Recommendations – Federal Level ......................................................8-18
HURRICANE IKE IN TEXAS ANd LoUISIANA MITIGATION ASSESSMENT TEAM REPORT xv
TOC TABLE OF CONTENTS
Appendices
Appendix A Acknowledgments
Appendix B References and FEMA Publication List
Appendix C Acronyms and Glossary
Appendix D FEMA Recovery Advisories
Appendix E High Water Marks
List of FiguresChapter 1Figure 1-1. Satellite image of Hurricane Ike as it moved toward Texas
and Louisiana ........................................................................................................1-4
Figure 1-2. Areas affected by Hurricane Ike ............................................................................1-5
Figure 1-3. Hurricane Ike storm track .....................................................................................1-8
Figure 1-4. Land subsidence in the Houston-Galveston area, 1906–2000 (Harris-Galveston Subsidence District, retrieved January 2009) ......................1-10
Figure 1-5. FEMA’s surveyed locations of Hurricane Ike’s HWMs in Texas ........................1-11
Figure 1-6. FEMA’s surveyed locations of Hurricane Ike’s HWMs in Louisiana .................1-12
Figure 1-7. Locations of monitoring stations and portable towers that reported data in Texas during Hurricane Ike ....................................................................1-14
Figure 1-8. Wind swath contour plot based on H*Wind analysis; wind speeds given in mph with contours of the 1-minute sustained wind speed .................1-16
Figure 1-9. Wind swath contour plot (3-second gust at 10-meter elevation [33 feet above ground level]) at Texas and Louisiana based on HAZUS-MH wind field methodology .................................................................1-17
Figure 1-10. HAZUS-MH-estimated maximum peak gust wind speeds near radius of maximum winds. ..................................................................................1-18
Figure 1-11. Map showing 1-minute sustained winds 3 hours after Galveston landfall with continued high back bay winds ....................................................1-20
Figure 1-12. Roofing damage to north and west exposures produced by Hurricane Ike backside winds .............................................................................1-21
Figure 1-13. Hurricane tracks of significant historic hurricanes in Texas and Louisiana ............................................................................................1-22
xvi MITIGATION ASSESSMENT TEAM REPORT HURRICANE IKE IN TEXAS ANd LoUISIANA
TABLE OF CONTENTS TOC
Figure 1-14. Plaques near the Great Galveston Hurricane Memorial were destroyed by Ike. ..................................................................................................1-26
Figure 1-15. The memorial capstone was moved off center by Ike........................................1-26
Figure 1-16. Flight plan for pre-MAT aerial reconnaissance ..................................................1-29
Figure 1-17. Locations visited by the MAT in Texas and Louisiana .......................................1-30
Chapter 2Figure 2-1. Floodplain management regulations and building design in
communities with adopted building codes ..........................................................2-2
Figure 2-2. Relationship between the stillwater elevations, BFE, wave effects, and flood hazard zones. .........................................................................................2-4
Figure 2-3. Elevation of residential structures to the BFE is required in Zone V .................2-4
Figure 2-4. Comparison of ASCE 7-05 and Ike gust wind speeds.........................................2-14
Figure 2-5. Galveston Island houses investigated for the 1990 report that were visited by the MAT in 2008 after Hurricane Ike ........................................2-22
Figure 2-6. Indian Beach house, post-Ike (number 3289 in 1990 Galveston study) ...........2-23
Figure 2-7. Point San Luis house (number 3083 in 1990 Galveston study) ........................2-24
Figure 2-8. Jamaica Beach house on the West Bay with “backside” wind damage (number 2480 in 1990 Galveston study) ............................................................2-24
Figure 2-9. First floor walls removed and floor slab undermined by flooding and waves at this Jamaica Beach house (number 2480 in 1990 Galveston study) ...................................................................................................2-25
Figure 2-10. Texas Windstorm Designated Catastrophe Areas .............................................2-28
Chapter 3Figure 3-1. Louisiana house sufficiently elevated on a foundation that withstood
Ike flood loads ........................................................................................................3-3
Figure 3-2. A house on timber piles was pushed over by wind and flood loads and the load path failed at the connection between the floor beam and the piles.. 3-3
Figure 3-3. Broken timber piles, Galveston Island, TX ..........................................................3-4
Figure 3-4. This concrete column failed due to lateral loads.................................................3-4
Figure 3-5. Typical bolted connection between wood columns and wood beams ................3-5
HURRICANE IKE IN TEXAS ANd LoUISIANA MITIGATION ASSESSMENT TEAM REPORT xvii
TOC TABLE OF CONTENTS
Figure 3-6. Unlike the older and lower house on the right, the Zone V house on the left was elevated approximately 5 feet above the 16-foot National Geodetic Vertical Datum (NGVD) BFE and sustained no structural damage due to flooding (Crystal Beach, TX). .....................................................3-5
Figure 3-7. The landward displacement of shore-parallel floor joists indicates the onset of wave damage to an elevated floor system (Bolivar Peninsula). ............3-6
Figure 3-8. This elevated house (Zone V, BFE = 15 feet) suffered no significant damage due to flooding (Baytown, TX).. .............................................................3-7
Figure 3-9. Adjacent houses south of Baytown, TX. ...............................................................3-7
Figure 3-10. The Ike flood level reached approximately 3 feet above the floor slab (1 foot above the 6-foot BFE) of this Zone A house (see inset), which was reported to have been similarly inundated during Hurricane Rita (Lake Charles, LA).................................................................................................3-8
Figure 3-11. This house sustained significant structural damage due to storm surge and small waves above the 9-foot BFE in Zone A (Bridge City, TX) ...................3-8
Figure 3-12. This house floated off its foundation due to insufficient elevation and inadequate connections between the foundation and the house (Golden Meadow, LA) ..........................................................................................3-9
Figure 3-13. Looking toward the Gulf, past Zone V houses on tall concrete column foundations (with the lowest floor 10 feet above the 17-foot BFE) (Bolivar Peninsula, TX) .......................................................................................3-10
Figure 3-14. Ground-level view of elevated houses with inset showing typical column damage where the timber deck broke away (Bolivar Peninsula, TX). .............3-10
Figure 3-15. Concrete column cracking caused by extreme loads (Bolivar Peninsula, TX) 3-11
Figure 3-16. Pre- and post-Ike aerial photographs of the east end of Galveston Island, illustrating some of the most significant loss of dunes and vegetation during Ike. ............................................................................................................3-13
Figure 3-17. Exposed geotextile tubes formerly covered by sand and dune vegetation. Note erosion behind the tubes and under Zone V (BFE = 18 feet) buildings (yellow arrow at left). ...........................................................................................3-14
Figure 3-18. Foundation scour observed at Holly Beach, LA .................................................3-14
Figure 3-19. Foundation scour observed at Holly Beach, LA (Zone V, ABFE = 16 feet) ......3-15
Figure 3-20. Foundation scour was reported to be 10 feet deep—note the bottoms of the piles on the right side of building that have been pushed toward the building (Bolivar Peninsula, TX, Zone V). ........................................................3-15
Figure 3-21. Failure of a timber pile foundation undermined by scour and erosion (Galveston Island, TX, Zone V). .........................................................................3-16
xviii MITIGATION ASSESSMENT TEAM REPORT HURRICANE IKE IN TEXAS ANd LoUISIANA
TABLE OF CONTENTS TOC
Figure 3-22. Linear scour features tend to align with canals and roads as storm surge returns to the Gulf (Bolivar Peninsula, TX) ......................................................3-17
Figure 3-23. Example load path through a pile foundation ..................................................3-18
Figure 3-24. This Bridge City, TX, house sustained no structural damage, despite the fact that the owner reported that Ike flood levels rose above the lowest floor............................................................................................................3-18
Figure 3-25. A 5/8-inch diameter galvanized steel anchor bolt in red circle (with washer and nut, not visible in this photograph) provided connections between beam and column for the house shown in Figure 3-24 .3-19
Figure 3-26. Reinforcing steel extending from the top of a concrete column (building under construction) (Galveston Island, TX) ....................................3-19
Figure 3-27. Deterioration in the wood piling likely contributed to the foundation failure (Bolivar Peninsula, TX). ......................................................................................3-20
Figure 3-28. Deterioration in wood piling (Galveston Island, TX) .......................................3-20
Figure 3-29. House resting (i.e., with no structural connection) on top of precast concrete piers, stacked CMUs, and shallow footing pads (New Iberia, LA) .......3-21
Figure 3-30. Idealized depth-damage relationship for an elevated building subject to waves .................................................................................................................3-22
Figure 3-31. Pre- and post-Ike aerial photographs of the Crystal Beach area of Bolivar Peninsula .................................................................................................3-24
Figure 3-32. Seaward side of Zone V house struck by waves (Bolivar Peninsula, TX) ..........3-25
Figure 3-33. Roofs, walls, and other parts of destroyed houses washed landward to and inland of this location, approximately ½ mile from the Gulf shoreline of Bolivar Peninsula. ............................................................................................3-25
Figure 3-34. Broken piles beneath destroyed Gulf-front houses, Galveston Island (west of the seawall) .............................................................................................3-26
Figure 3-35. Damage to at-grade house in Zone V likely caused by wave and surge along the northern Galveston Bay shoreline in Baytown, TX ...........................3-26
Figure 3-36. Likely wave and debris damage to townhouse building along the western Galveston Bay in Seabrook, TX .............................................................3-27
Figure 3-37. ASCE wind speed map (ASCE 7-05) ...................................................................3-28
Figure 3-38. Code-defined MWFRS wind loads on an elevated residential structure ...........3-29
Figure 3-39. Galveston west end beach house with roof structure removed by Hurricane Ike .......................................................................................................3-29
HURRICANE IKE IN TEXAS ANd LoUISIANA MITIGATION ASSESSMENT TEAM REPORT xix
TOC TABLE OF CONTENTS
Figure 3-40. This West Bay Galveston Island apartment experienced gable-end wind damage as a result of sheathing failure and poor connection of the brick veneer to the stud walls (Hurricane Ike estimated wind speed in this area: 90 mph, Exposure B). .....................................................................3-30
Figure 3-41. The roof structure was poorly connected to this house in Grand Isle (Jefferson Parish, LA) and was blown off by 50-mph Ike winds (Exposure B) 3-30
Figure 3-42. Areas of roof covering loss (red arrows) indicate zones of higher wind pressure on a roof. ...............................................................................................3-31
Figure 3-43. Galveston west end house with roof damage in high pressure zones (Hurricane Ike estimated wind speed in this area: 95 mph, Exposure C) .......3-31
Figure 3-44. Effect of wind on an enclosed building and a building with a wall opening producing a partially enclosed building by allowing internal pressurization of the structure .....................................................................................................3-32
Figure 3-45. Depiction of a building load path .......................................................................3-33
Figure 3-46. Load path around openings and connection to foundation pile ....................3-34
Figure 3-47. Collapse of a west Galveston Island house due to foundation failure ..............3-34
Figure 3-48. Though much of the cladding and structural sheathing was destroyed by Ike’s surge, the MWFRS of this Bolivar Peninsula beach house remained intact and connected. ..........................................................................................3-35
Figure 3-49. Strong concrete column-to-beam steel saddle connector .................................3-35
Figure 3-50. Strong interior wood column-to-beam connector with building shear wall connector..............................................................................................................3-36
Figure 3-51. Poor beam connection to corner column ..........................................................3-36
Figure 3-52. Studs and sill plate connected in new house (sill bolts yellow arrows and clips red arrows) (Webster, TX). .........................................................................3-37
Figure 3-53. Studs clipped to double top plate; rafter-to-top-plate connector has yet to be installed .......................................................................................................3-37
Figure 3-54. Wall-to-roof strapping.. ........................................................................................3-38
Figure 3-55. Toe-nailed connection of floor joists on band beam on house under construction (LaPorte, TX) ................................................................................3-38
Figure 3-56. Existing house shear wall connector incorrectly located (red arrow) (Sunset Crystal Beach, Bolivar Island, TX). .......................................................3-39
Figure 3-57. Post-Ike photograph of west Galveston Island, illustrating increased severity of flood damage near the shoreline ......................................................3-40
Figure 3-58. Post-Ike photograph of Bolivar Peninsula, illustrating increased severity of flood damage near the shoreline ......................................................3-40
xx MITIGATION ASSESSMENT TEAM REPORT HURRICANE IKE IN TEXAS ANd LoUISIANA
TABLE OF CONTENTS TOC
Figure 3-59. A substantial amount of siding (the white lines scattered around the ground), along with roofing materials, blew off these West Galveston houses (Hurricane Ike estimated wind speed in this area: 90 mph). ......................................................................................................3-42
Figure 3-60. Some of the roofs on these Jamaica Beach, TX, houses had no roof covering damage, while one had moderate damage (blue arrow) and one had extensive damage, including loss of underlayment (red arrow) (Hurricane Ike estimated wind speed in this area: 90 mph). ...........................3-43
Figure 3-61. View of a shingle bundle wrapper at the Webster, TX, house shown in the inset ............................................................................................................3-45
Figure 3-62. Shingle damage at a house near the one shown in Figure 3-61 (Webster, TX) .......................................................................................................3-45
Figure 3-63. Loss of shingles along the eave in Bolivar Peninsula, TX (Hurricane Ike estimated wind speed in this area: 110 mph) ..........................3-46
Figure 3-64. Loss of shingles and underlayment in a corner area, and loss of shingles from the field of this roof in Bolivar Peninsula (Hurricane Ike estimated wind speed in this area: 110 mph) .....................................................3-46
Figure 3-65. Loss of hip shingles and portions of the underlayment in Bolivar Peninsula (Hurricane Ike estimated wind speed in this area: 110 mph) .........3-47
Figure 3-66. Roof covering and roof structure damage at Fortified…for safer living® houses in the Audubon Village area on Bolivar Peninsula (Hurricane Ike estimated wind speed in this area: 110 mph) ..........................3-48
Figure 3-67. This Fortified…for safer living® house had taped sheathing joints (red arrow). ..........................................................................................................3-49
Figure 3-68. This tape did not provide a watertight seal (Audubon Village, TX). ...............3-49
Figure 3-69. These snap-lock seam panels were attached with fasteners through one side of the seam (Galveston Island, TX; Hurricane Ike estimated wind speed in this area: 110 mph). .....................................................................3-50
Figure 3-70. These architectural metal panels unlatched from the concealed clips (Galveston Island, TX; Hurricane Ike estimated wind speed in this area: 110 mph). .........................................................................................3-51
Figure 3-71. This tile roof on Galveston Island did not experience any wind damage (Hurricane Ike estimated wind speed in this area: 106 mph). .........................3-52
Figure 3-72. This tile roof on Galveston Island experienced hip, eave, and field damage (Hurricane Ike estimated wind speed in this area: 106 mph). ..........3-52
Figure 3-73. Loss of siding due to winds, Chauvin, LA (Terrebonne Parish; Hurricane Ike estimated wind speed in this area: 50 to 60 mph, Exposure B) ........................3-53
HURRICANE IKE IN TEXAS ANd LoUISIANA MITIGATION ASSESSMENT TEAM REPORT xxi
TOC TABLE OF CONTENTS
Figure 3-74. Loss of siding at Holly Beach, LA, home (Cameron Parish; Hurricane Ike estimated wind speed in this area 80 mph, Exposure C)..........3-53
Figure 3-75. Complete loss of thin gypsum sheathing and brick veneer from gable end (West Bay, Galveston Island; Hurricane Ike estimated wind speed in this area: 90 mph, Exposure B) ......................................................................3-54
Figure 3-76. Loss of fiberboard sheathing and fiber cement siding from gable end wall of an apartment complex (West Bay, Galveston Island; Hurricane Ike estimated wind speed in this area: 90 mph, Exposure B) .........3-54
Figure 3-77. Collapsed brick veneer wall with brick ties at varied spacing, some of which were only partially imbedded or not embedded (West Bay Galveston, TX; Hurricane Ike estimated wind speed in this area: 90 mph, Exposure B) ...........................................................................................3-55
Figure 3-78. Misalignment of the tie reduces the embedment and promotes veneer failure........................................................................................................3-56
Figure 3-79. Proper installation and embedment of corrugated brick ties ...........................3-56
Figure 3-80. Typical vinyl siding failure (Sea Isle; Hurricane Ike estimated wind speed in this area: 95+ mph, Exposure C). ........................................................3-58
Figure 3-81. Improper installation led to extensive loss of siding up the house wall (Tiki Island, TX; Hurricane Ike estimated wind speed in this area: 88 mph, Exposure B). .................................................................................3-59
Figure 3-82. Vinyl siding rated for high wind has a double-layer nail hem ...........................3-60
Figure 3-83. Use of a generic starter strip contributed to loss of siding on this house (Tiki Island, TX; Hurricane Ike estimated wind speed in this area: 88 mph, Exposure B). .................................................................................3-61
Figure 3-84. Loosely locked panel led to the siding failure of this Tiki Island house (Hurricane Ike estimated wind speed in this area: 90 mph, Exposure B). .........................................................................................................3-62
Figure 3-85. Use of utility trim under window to securely attach cut and notched siding section .........................................................................................3-63
Figure 3-86. Siding partially detached by wind as a result of improper placement of joint directly under window (Tiki Island, TX; Hurricane Ike estimated wind speed in this area: 88 mph). ......................................................3-63
Figure 3-87. Fiber cement plank siding, installed as a reside over the original plywood siding, was torn from this West Bay Galveston house (Hurricane Ike estimated wind speed in this area: 100 mph, Exposure C)..........................................................................................................3-64
xxii MITIGATION ASSESSMENT TEAM REPORT HURRICANE IKE IN TEXAS ANd LoUISIANA
TABLE OF CONTENTS TOC
Figure 3-88. Fiber cement lap siding was blown off this West Galveston Bay house (Hurricane Ike estimated wind speed in this area: 100 mph, Exposure B). .........................................................................................................3-65
Figure 3-89. Damaged fiber cement plank siding (Hurricane Ike estimated wind speed in this area: 93 mph, Exposure B)...................................................3-65
Figure 3-90. Standard wind zone installation ..........................................................................3-66
Figure 3-91. Shim placement (red arrow) allowed the lower edge (red circles) of siding to be exposed, resulting in loss of siding at several locations around this elevated structure on Bolivar Peninsula (Hurricane Ike estimated wind speed in this area: 110 mph, Exposure C). ........................3-67
Figure 3-92. Loss of fiber cement panels due to lower edge exposure. (Bolivar Peninsula; Hurricane Ike estimated wind speed in this area: 110 mph, Exposure C).........................................................................3-67
Figure 3-93. Clapboard-sided house with siding that performed well; damage resulted from failure of a non-breakaway wall (Tiki Island, TX; Hurricane Ike estimated wind speed in this area: 103 mph, Exposure C)..........................................................................................................3-68
Figure 3-94. Decayed plywood siding removed by wind pressures (Tiki Island, TX; Hurricane Ike estimated wind speed in this area: 103 mph, Exposure C)..........................................................................................................3-68
Figure 3-95. Impact-resistant door and window glazing in new East Galveston house .....................................................................................................................3-70
Figure 3-96. Clear Lake, TX, house with plywood shutters installed on the accessible first floor and roll-down shutters installed on the less accessible second floor (Hurricane Ike estimated wind speed in this area: 90 mph, Exposure B) ...........................................................................3-70
Figure 3-97. Tiki Island, TX, house with adjustable shutters (Hurricane Ike estimated wind speed in this area: 103 mph, Exposure C) ...............................3-71
Figure 3-98. Texas City, TX, house with corrugated clear plastic shutters (Hurricane Ike estimated wind speed in this area: 88 mph, Exposure B) ..........................................................................................................3-71
Figure 3-99. Traditional wood swinging shutters on Tiki Island (Hurricane Ike estimated wind speed in this area: 103 mph, Exposure B) ...............................3-72
Figure 3-100. Corrugated metal shutters on west Galveston house (Hurricane Ike estimated wind speed in this area: 95 mph, Exposure C) .................................3-72
Figure 3-101. Snapped-on vinyl canvas window covers (red arrows) in West Bay, Galveston Island (Hurricane Ike estimated wind speed in this area: 90 mph, Exposure B) ...........................................................................................3-73
HURRICANE IKE IN TEXAS ANd LoUISIANA MITIGATION ASSESSMENT TEAM REPORT xxiii
TOC TABLE OF CONTENTS
Figure 3-102. Common methods for plywood shutter attachment to wood-frame and masonry walls ...............................................................................................3-74
Figure 3-103. Plywood shutters installed into the wall cladding (red circles) in Clear Lake, TX (Hurricane Ike estimated wind speed in this area: 90 mph, Exposure B) ...........................................................................................3-74
Figure 3-104. Fiber cement soffit remained connected; soffit vent slots shown with red arrows(Tiki Island, TX; Hurricane Ike estimated wind speed in this area: 88 mph, Exposure B). ..........................................................................3-76
Figure 3-105. Loss of aluminum fascia cover (red arrows) exposed ends of vinyl soffit (blue arrows) to direct entry of wind-driven rain (Location Tiki Island; Hurricane Ike estimated wind speed in this area: 88 mph) ..................3-77
Figure 3-106. Loss of fascia cover (red arrow) led to loss of soffit (blue arrow), exposing the attic to wind-driven rain (San Luis, TX; Hurricane Ike estimated wind speed in this area: 93 mph, Exposure C) .................................3-77
Figure 3-107. The roof ridge vent (red arrows) on this Bolivar Peninsula home leaked, and it is presumed that the water was shed down the underside of the roof decking and/or structure thereby producing ceiling damage along the wall of this second story room (Hurricane Ike estimated wind speed in this area: 110 mph, Exposure C). ........................3-78
Figure 3-108. Gable end vent (red arrow) .................................................................................3-79
Figure 3-109. Shuttered gable end vent (red arrow) ................................................................3-79
Figure 3-110. Gable end vent blew off Galveston Back Bay apartment building (Hurricane Ike estimated wind speed in this area: 90 mph, Exposure B) .......3-79
Figure 3-111. Typical cantilevered condenser (Jamaica Beach, TX; Hurricane Ike estimated wind speed in this area: 80 mph, Exposure B) .................................3-80
Figure 3-112. Improperly secured condensing unit was knocked from its platform (Kahala Beach, TX; Hurricane Ike estimated wind speed in this area: 80 mph, Exposure B) ...........................................................................................3-80
Figure 3-113. Elevated condenser is tightly enclosed making service access difficult (Bermuda Beach; Hurricane Ike estimated wind speed in this area: 95 mph, Exposure C) ...........................................................................................3-81
Figure 3-114. Propagation of damage above lowest floor when breakaway walls broke free (Seabrook, TX) ..................................................................................3-81
Figure 3-115. Attachment of utilities to breakaway wall may have prevented the wall from breaking away, thereby resulting in additional damage to the structure (Galveston Island, TX). .................................................................3-82
Figure 3-116. This 11-foot high breakaway wall panel was pushed out by floodwaters trapped inside the enclosure (Galveston Island, TX). ......................................3-83
xxiv MITIGATION ASSESSMENT TEAM REPORT HURRICANE IKE IN TEXAS ANd LoUISIANA
TABLE OF CONTENTS TOC
Figure 3-117. Louvered panels allowed Ike floodwaters to pass into and out of the below-BFE enclosure without damage to the panels. ..................................3-83
Figure 3-118. Solid breakaway walls lost during Ike are being replaced with louvered panels (Tiki Island, TX).......................................................................3-84
Figure 3-119. Plywood sheathing removed by storm surge (Jamaica Beach house on West Bay) .........................................................................................................3-85
Figure 3-120. Fiber cement board sheathing (red arrow) was removed from the underside of this house, which was elevated approximately 12 feet above ground level (Bolivar Peninsula). ............................................................3-85
Figure 3-121. Tiki Island house with vinyl soffit applied without sheathing removed by storm surge (netting was used to contain insulation in joist space) ............3-86
Figure 3-122. Vinyl soffit covering over plywood sheathing partially removed (Tiki Island, West Galveston Bay; Estimated Hurricane Ike wind speed: 103 mph, Exposure C) ........................................................................................3-86
Figure 3-123. Typical concrete parking slab beneath a pile-supported house (Bolivar Peninsula) .............................................................................................3-87
Figure 3-124. Undermining of concrete slab that settled, but remained intact (Galveston Island, TX) ........................................................................................3-87
Figure 3-125. Pile-founded house with a slab thickened to create grade beams. ...................The unthickened portion of the slab collapsed when undermined (Galveston Island, TX). .......................................................................................3-88
Figure 3-126. Slab failure probably contributed to foundation damage (West Galveston Island, TX)................................................................................3-89
Figure 3-127. Slab undermining and settlement during Ike probably pulled piles downward (Holly Beach, LA). .............................................................................3-89
Figure 3-128. The weight of this slab, undermined due to scour and erosion, could have contributed to settlement and racking of this elevated house (Surfside Beach, TX). ...............................................................................3-90
Figure 3-129. Thin, unreinforced parking slab sections separated when undermined and collapsed in place, with no apparent adverse impact to the foundation (Galveston Island, TX).....................................................................3-90
Figure 3-130. Mildew and mold forming on wall sheathing following flooding (Golden Meadow, LA) .........................................................................................3-91
Figure 3-131. Floor joists and beams were notched to allow for plumbing (Sulphur, Calcasieu Parish). ................................................................................3-92
Figure 3-132. Flood vent openings (red circles) that do not extend through the walls (Hackberry, Cameron Parish) ....................................................................3-92
HURRICANE IKE IN TEXAS ANd LoUISIANA MITIGATION ASSESSMENT TEAM REPORT xxv
TOC TABLE OF CONTENTS
Figure 3-133. Destroyed manufactured home (San Leon, TX) ..............................................3-93
Figure 3-134. Scour depressions existed around the masonry piers, pads, and ground anchor stabilizer plates (San Leon, TX). .............................................3-94
Figure 3-135. Manufactured home in Oak Island, TX .............................................................3-94
Figure 3-136. Two manufactured homes in Cameron, LA.. .....................................................3-95
Figure 3-137. This elevated manufactured home in Grand Isle of Jefferson Parish had siding and roof damage, but did not move from its foundation. ..............3-96
Figure 3-138. The framing and anchoring system of the house shown in Figure 3-137.Strapping secured the home’s walls and frames to its foundation. (Estimated wind speed during Ike: less than 60 mph, 3-second gust). ............3-96
Figure 3-139. Zone A manufactured home in the Golden Meadows section of Lafourche Parish sustained 3 to 4 feet of flooding above the floor, but did not shift or float off of its foundation ....................................................3-97
Figure 3-140. Prescriptive Flood-Resistant Foundation Design ..............................................3-98
Figure 3-141. Zone A house elevated with Increased Cost of Compliance funds on masonry piers (Iberia Parish, LA). ................................................................3-99
Figure 3-142. House elevated with Increased Cost of Compliance funds (Kemah, TX)(Hurricane Ike estimated wind speed in this area: 90 mph, Exposure B). ..........................................................................................3-99
Chapter 4Figure 4-1. September 19, 2008, aerial view of Crenshaw Elementary and
Middle School .......................................................................................................4-4
Figure 4-2. General view of Crenshaw Elementary and Middle School ...............................4-5
Figure 4-3. Wall of house washed underneath Crenshaw School during Ike (note shutters still attached to wall) ....................................................................4-5
Figure 4-4. Location where the gutter blew off the gym roof; gutter bracket shown at inset ........................................................................................................4-6
Figure 4-5. Wind blew off the hood, allowing rain to directly enter the building ..................................................................................................................4-7
Figure 4-6. Missing access panel allowed rain intrusion; ductwork could be easily flexed ...........................................................................................................4-7
Figure 4-7. Damage to South Cameron Parish School modular units ..................................4-8
Figure 4-8. High school gymnasium at South Cameron Parish School .................................4-9
Figure 4-9. Johnson’s Bayou School interior building damage ............................................4-9
xxvi MITIGATION ASSESSMENT TEAM REPORT HURRICANE IKE IN TEXAS ANd LoUISIANA
TABLE OF CONTENTS TOC
Figure 4-10. Johnson’s Bayou School – damage to wall on front side of facility (soffit of driveway canopy was also damaged) ...................................................4-10
Figure 4-11. Johnson’s Bayou School gymnasium interior damage ......................................4-10
Figure 4-12. Johnson’s Bayou School CMU wall collapse .......................................................4-11
Figure 4-13. Johnson’s Bayou School gymnasium...................................................................4-12
Figure 4-14. General view of San Jacinto Methodist Hospital ................................................4-13
Figure 4-15. Condenser with tie-down cables .........................................................................4-14
Figure 4-16. Detached LPS conductor .....................................................................................4-14
Figure 4-17. This satellite dish was held down with CMU only; inset shows all that remains from a similarly mounted dish after a strong hurricane .............4-15
Figure 4-18. View of one of the mitigated roofs ......................................................................4-17
Figure 4-19. A Winnie Community Hospital entry canopy (red oval) blew away. ................4-18
Figure 4-20. Water entered the building where ductwork blew away. ...................................4-18
Figure 4-21. Collapsed communications tower and blown-away access panels (red circle) ..........................................................................................................4-19
Figure 4-22. The emergency generator was housed within this shed; a portable generator (inset) was brought to the site after the emergency generator failed. ...................................................................................................4-20
Figure 4-23. High water mark (dashed blue line) shown from the outside of UTMB Building 1 .................................................................................................4-21
Figure 4-24. Clean-up underway inside the basement of UTMB Building 1 ........................4-22
Figure 4-25. The Ike flood level in UTMB Building 56 pump room was approximately 30 inches above the floor, and controls and equipment were damaged. .....................................................................................................4-22
Figure 4-26. Replaced lower interior wall sections leading to UTMB Building 90 ..............4-23
Figure 4-27. A very high parapet kept the blown-off metal panels on the roof. ...................4-24
Figure 4-28. The roofs shown by the blue arrows were aggregate-surfaced BURs at the time Ike struck; the roof shown by the red arrow is a new roof replacing one that blew off. .................................................................................4-25
Figure 4-29. A guyed stack that blew over ..............................................................................4-26
Figure 4-30. A relief air hood blew off the curb allowing rainwater to enter the building. .........................................................................................................4-26
Figure 4-31. Nine broken windows are shown in the red oval; the brown openings above the oval are louvers. ...................................................................................4-27
HURRICANE IKE IN TEXAS ANd LoUISIANA MITIGATION ASSESSMENT TEAM REPORT xxvii
TOC TABLE OF CONTENTS
Figure 4-32. Hurricane Ike crested approximately 6 inches below the floor of the South Cameron Parish Hospital ...................................................................4-28
Figure 4-33. Conduits and pipes beneath South Cameron Parish Hospital .........................4-29
Figure 4-34. Damage to canopy over emergency room entrance driveway ...........................4-29
Figure 4-35. Lack of proper fastening of rooftop equipment—a MAT member was able to easily lift this condenser unit off the curb .......................................4-30
Figure 4-36. Hackberry Rural Medical Clinic ..........................................................................4-31
Figure 4-37. Hackberry Rural Medical Clinic interior repairs in progress ...........................4-32
Figure 4-38. General view of Oceanview Transitional Care Center .......................................4-33
Figure 4-39. The fan shown in the inset blew off of this curb. ...............................................4-34
Figure 4-40. Detached LPS conductor .....................................................................................4-35
Figure 4-41. Houston Transtar Regional EOC; significant permanent outward deformation occurred at the gutter shown in the inset. ...................................4-36
Figure 4-42. The coping blew off because of inadequate attachment of the cleats ..............4-37
Figure 4-43. Coping debris (red arrow); the membrane was gouged (blue arrow) by coping debris (an ink pen shows the scale)..................................................4-38
Figure 4-44. Coping debris (blue arrow) on a lower roof; note leaf debris near the scupper (red arrow) ......................................................................................4-38
Figure 4-45. Guyed flue blew over (red arrow indicates one of the guys).............................4-39
Figure 4-46. The emergency generator is housed in the circled building; the coiling door (red arrow) and the louver (blue arrow) appeared to provide inadequate protection for the generator. .........................................4-40
Figure 4-47. General view Deer Park Police Station ...............................................................4-41
Figure 4-48. The gutters are not attached to the gutter bracket; the inset shows a bracket at another building that provides a positive connection between the bracket and gutter. ..........................................................................4-41
Figure 4-49. The emergency generator is inadequately protected from wind and windborne debris. ................................................................................................4-42
Figure 4-50. General view of Port Neches Fire Station ..........................................................4-43
Figure 4-51. View of a new motorized shutter; the toggle in the red circle allows the shutter to be manually raised. .......................................................................4-43
Figure 4-52. The emergency generator is susceptible to windborne debris and damage caused by collapse of the masonry screen wall.....................................4-44
Figure 4-53. General view of High Island Fire Station............................................................4-45
xxviii MITIGATION ASSESSMENT TEAM REPORT HURRICANE IKE IN TEXAS ANd LoUISIANA
TABLE OF CONTENTS TOC
Figure 4-54. The metal wall at the red oval area was pushed outward because of inadequate attachment of the wall angle to the slab .....................................4-46
Figure 4-55. The Bayou Grand Caillou Fire Station is elevated above the ABFE and sustained no damage. ...................................................................................4-47
Figure 4-56. Rear of Dularge Fire Station; note canal bank erosion sustained during Hurricane Ike ...........................................................................................4-48
Figure 4-57. 7th Ward Fire District No.1 Fire Station; wall repairs were in progress during MAT inspection ........................................................................4-48
Figure 4-58. Condenser units were installed at Hackberry Fire Station after Ike and are vulnerable to future flooding. ...............................................................4-49
Figure 4-59. Wind damage (red arrows) to Grand Isle Fire Station remaining from Hurricane Katrina .......................................................................................4-49
Figure 4-60. General view of the USACE Administration Building in Galveston, TX ..........4-50
Figure 4-61. The black material on top of the curb is a temporary covering to replace the sheet metal covering originally on the curb; shown in the red circle and inset ........................................................................................4-51
Figure 4-62. General view of Federal Courthouse and Post Office; some flashing damage occurred during Hurricane Ike (shown by red arrow) .......................4-52
Figure 4-63. All of the tile tails were hooked. ..........................................................................4-52
Figure 4-64. The access panel (red arrow) nearly blew away; the yellow arrows indicate supplementary anchor straps. ...............................................................4-53
Figure 4-65. The emergency generator is housed in a separate wind- and windborne-debris-resistant building (red arrow) ...............................................4-54
Figure 4-66. One of the shutters at the Tiki Island City Hall is shown in the red oval; blue arrows indicate breakaway walls that performed successfully by breaking away. .............................................................................4-54
Figure 4-67. The oval shows where ridge flashing blew away. ................................................4-55
Figure 4-68. The electrical service entered through the wall rather than the roof; the blue arrows indicate missing breakaway walls. .............................................4-56
Figure 4-69. Terrebonne Parish Criminal Justice Complex ..................................................4-57
Chapter 5Figure 5-1. View of a portion of downtown Houston..............................................................5-3
Figure 5-2. Building with glazing damage; location shown by yellow square in inset ..........5-4
Figure 5-3. Random breakage of first floor glazing ................................................................5-5
HURRICANE IKE IN TEXAS ANd LoUISIANA MITIGATION ASSESSMENT TEAM REPORT xxix
TOC TABLE OF CONTENTS
Figure 5-4. Portions of the mechanical equipment screen wall blew away ...........................5-5
Figure 5-5. The wire mesh of this stucco wall was penetrated by windborne debris ............5-6
Figure 5-6. JP Morgan Chase Tower and JP Morgan Chase Center .......................................5-7
Figure 5-7. Most of the glazing in the yellow oval was broken (JP Morgan Chase Tower). .........................................................................................................5-8
Figure 5-8. Northwest façade glazing damage on JP Morgan Chase Center .........................5-9
Figure 5-9. View of repairs to an office damaged in the JP Morgan Chase Center ............5-10
Figure 5-10. Locations of possible debris sources that impacted the JP Morgan Tower and Center ................................................................................................5-11
Figure 5-11. The Tower is on the left and the Center is on the right. It is believed that vortices developed between these façades, and that glass shards entrapped within the vortices were slammed against and broke glazing in the opposing façades. .........................................................................5-12
Figure 5-12. View of the JP Morgan Chase Tower roof ...........................................................5-13
Figure 5-13. The main roof of the JP Morgan Chase Center (blue arrow) and several other roofs (indicated by yellow arrows) were blown off or damaged by debris. ..............................................................................................5-14
Figure 5-14. Glazing damage (yellow arrows) at two of the buildings shown in the white rectangle in Figure 5-13 ......................................................................5-15
Figure 5-15. Several metal panels blew off of two façades of this building, along with a wall-mounted sign (yellow arrow) ............................................................5-15
Figure 5-16. A substantial amount of glazing damage occurred to the façade of the Chevron Center, indicated by the yellow arrow. ................................................................5-16
Figure 5-17. Chevron Center glazing damage .........................................................................5-17
Figure 5-18. Broken glazing held in place with temporary film ............................................5-18
Figure 5-19. Portions of the roof system were blown off building B-1 ...................................5-19
Figure 5-20. The lightweight insulating concrete deck was gouged in many locations. ......5-20
Figure 5-21. View of the damaged window washing track (green arrow) .............................5-21
Figure 5-22. Locations of nearby damaged buildings ............................................................5-21
Figure 5-23. View of buildings with glazing, roof and wall covering, and rooftop equipment damage ................................................................................5-22
Figure 5-24. Roof and wall covering, skylight, and roof-top equipment damage at building B-2 ......................................................................................................5-23
Figure 5-25. Roof aggregate from building B-5 was the likely cause of the majority of the building B-4 glass damage ...................................................................................5-23
xxx MITIGATION ASSESSMENT TEAM REPORT HURRICANE IKE IN TEXAS ANd LoUISIANA
TABLE OF CONTENTS TOC
Figure 5-26. View of the aggregate-surfaced roofs on building B-5 and broken glazing on building B-4 beyond. .........................................................................5-24
Figure 5-27. Stone veneer damage on backside of building B-5 (side facing B-4) ...................................................................................................5-24
Figure 5-28. Roof covering damage on the main and penthouse roofs of building B-1 ..........................................................................................................5-25
Figure 5-29. View of a vegetative roof in the downtown area ..............................................5-26
Chapter 6
Figure 6-1. Two examples of elevation of equipment above grade on pile/column foundations, a good practice that ensured continuity of cell phone service on Bolivar Peninsula, TX ..........................................................................6-4
Figure 6-2. The upper windows on this Seabrook residence were not shuttered and were vulnerable to windborne damage. ........................................................6-7
Figure 6-3. The tree shown by the red line nearly fell on the hospital’s emergency generator (red arrow). The tree hit and damaged a metal roof that was over the compressed gas cylinders (blue arrow). ...............................................6-10
Figure 6-4. Aggregate-surfaced BURs on two mid-rise buildings on the periphery of Houston’s central business district. ................................................................6-13
Chapter 7Figure 7-1. Comparison of Effective BFEs and flood hazard zones (upper figure),
with MAT-recommended freeboard and flood hazard zones (lower figure) ........................................................................................................7-3
Figure 7-2. Several windows at this house on Bolivar Peninsula leaked and wetted the carpet. .............................................................................................................7-12
Figure 7-3. The breakaway walls at this house were destroyed. ............................................7-13
Chapter 8Figure 8-1. Long-term trends in average annual sea level at selected tide gauges
in the Gulf of Mexico ............................................................................................8-3
Figure 8-2. Relative sea level rise at Pier 21, Galveston...........................................................8-4
Figure 8-3. Broken geotextile tube at Beachside Drive, Galveston Island, TX .....................8-6
Figure 8-4. Broken geotextile tube at Beachside Drive, Galveston Island, TX .....................8-6
Figure 8-5. West end of the seawall at Galveston, TX. The concrete ramp (right foreground) was the road leading to the beach in the mid-1960s. ..............................................................................................................8-7
HURRICANE IKE IN TEXAS ANd LoUISIANA MITIGATION ASSESSMENT TEAM REPORT xxxi
TOC TABLE OF CONTENTS
Figure 8-6. Beachtown, TX, under construction ..................................................................8-13
Figure 8-7. Beachtown, TX, under construction ..................................................................8-14
List of TablesChapter 1Table 1-1. Saffir-Simpson Hurricane Scale Wind Speeds and Pressures ..............................1-3
Table 1-2. Notable Wind Speeds Recorded in Texas for Hurricane Ike ...........................1-14
Table 1-3. Estimated Maximum 3-Second Gust Wind Speeds for MAT Investigation Sites in Texas Based on Reporting Stations and HAZUS-MH Wind Model ....................................................................................1-19
Table 1-4. Damage Costs of Historic Hurricanes—Original and 2009 Dollars .................1-22
Chapter 2Table 2-1. Codes in Effect at the Time of Hurricane Ike for Impacted Counties
and Cities in Texas ...............................................................................................2-12
Table 2-2. Approximate Range of Basic Design Wind Speeds in the Coastal Counties Visited by the MAT (3-Second Gust, Exposure C, at 33 Feet Above Ground) ..................................................................................2-13
Table 2-3. Design Loads for a Typical Single-Family Residence in the City of Galveston, Galveston County, TX ...........................................................2-16
Table 2-4. Texas Counties covered by TWIA ........................................................................2-26
Chapter 3
Table 3-1. Brick Veneer Tie Spacing ....................................................................................3-57
Chapter 4Table 4-1. Critical Facilities Observed by the MAT ...............................................................4-2
Table 4-2. ASCE 24-05 Elevation Requirements for Critical Facilities ................................4-3
Table 4-3. Observations of Louisiana Fire Stations .............................................................4-47
Chapter 8Table 8-1. Predicted Sea Level Increases ..............................................................................8-5
HURRICANE IKE IN TEXAS ANd LoUISIANA MITIGATION ASSESSMENT TEAM REPORT i
ExEcuTIvE SuMMARy
Executive SummaryHurricane Ike made landfall over Galveston, TX, on September 13, 2008 at 2:10 a.m. Central Daylight Time (CDT). Hurricane Ike was the ninth named storm during the 2008 hurricane season and the most significant of the three that hit Texas in 2008. It was the seventh storm of the season to hit the United States mainland. At one point in time, the tropical-force winds spanned 600 miles across the Gulf of Mexico as the hurricane approached Texas. It is estimated that the storm surge generated by Hurricane Ike affected an area of approximately 310 miles along the Gulf of Mexico coastline.
Hurricane Ike is likely to be one of the costliest and most destructive hurricanes in U.S. history. Although Hurricane Ike was only a Category 2 hurricane when it made landfall near Galveston, TX, the large wind field of Hurricane Ike and the timing of when it struck, which included a period of increased tides, led to storm surge levels more typically associated with a Category 4
Eric Letvin
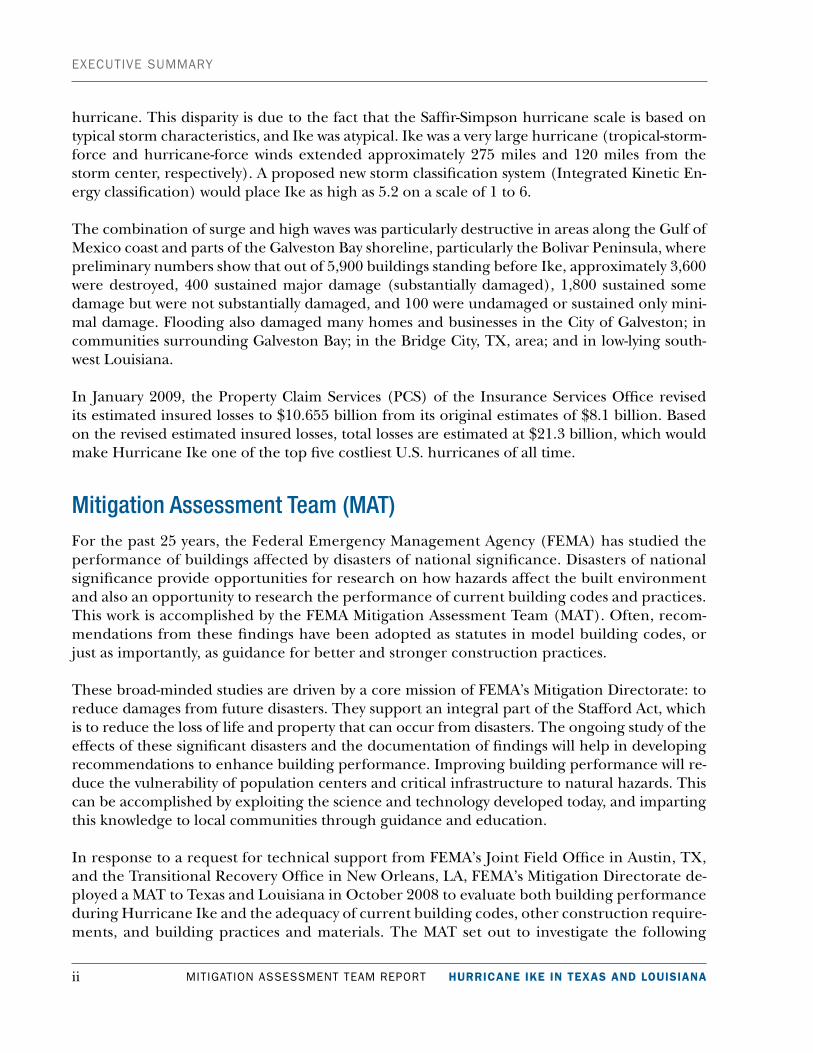
ii MITIGATION ASSESSMENT TEAM REPORT HURRICANE IKE IN TEXAS ANd LoUISIANA
hurricane. This disparity is due to the fact that the Saffir-Simpson hurricane scale is based on typical storm characteristics, and Ike was atypical. Ike was a very large hurricane (tropical-storm-force and hurricane-force winds extended approximately 275 miles and 120 miles from the storm center, respectively). A proposed new storm classification system (Integrated Kinetic En-ergy classification) would place Ike as high as 5.2 on a scale of 1 to 6.
The combination of surge and high waves was particularly destructive in areas along the Gulf of Mexico coast and parts of the Galveston Bay shoreline, particularly the Bolivar Peninsula, where preliminary numbers show that out of 5,900 buildings standing before Ike, approximately 3,600 were destroyed, 400 sustained major damage (substantially damaged), 1,800 sustained some damage but were not substantially damaged, and 100 were undamaged or sustained only mini-mal damage. Flooding also damaged many homes and businesses in the City of Galveston; in communities surrounding Galveston Bay; in the Bridge City, TX, area; and in low-lying south-west Louisiana.
In January 2009, the Property Claim Services (PCS) of the Insurance Services Office revised its estimated insured losses to $10.655 billion from its original estimates of $8.1 billion. Based on the revised estimated insured losses, total losses are estimated at $21.3 billion, which would make Hurricane Ike one of the top five costliest U.S. hurricanes of all time.
Mitigation Assessment Team (MAT)For the past 25 years, the Federal Emergency Management Agency (FEMA) has studied the performance of buildings affected by disasters of national significance. Disasters of national significance provide opportunities for research on how hazards affect the built environment and also an opportunity to research the performance of current building codes and practices. This work is accomplished by the FEMA Mitigation Assessment Team (MAT). Often, recom-mendations from these findings have been adopted as statutes in model building codes, or just as importantly, as guidance for better and stronger construction practices.
These broad-minded studies are driven by a core mission of FEMA’s Mitigation Directorate: to reduce damages from future disasters. They support an integral part of the Stafford Act, which is to reduce the loss of life and property that can occur from disasters. The ongoing study of the effects of these significant disasters and the documentation of findings will help in developing recommendations to enhance building performance. Improving building performance will re-duce the vulnerability of population centers and critical infrastructure to natural hazards. This can be accomplished by exploiting the science and technology developed today, and imparting this knowledge to local communities through guidance and education.
In response to a request for technical support from FEMA’s Joint Field Office in Austin, TX, and the Transitional Recovery Office in New Orleans, LA, FEMA’s Mitigation Directorate de-ployed a MAT to Texas and Louisiana in October 2008 to evaluate both building performance during Hurricane Ike and the adequacy of current building codes, other construction require-ments, and building practices and materials. The MAT set out to investigate the following
ExEcuTIvE SuMMARy
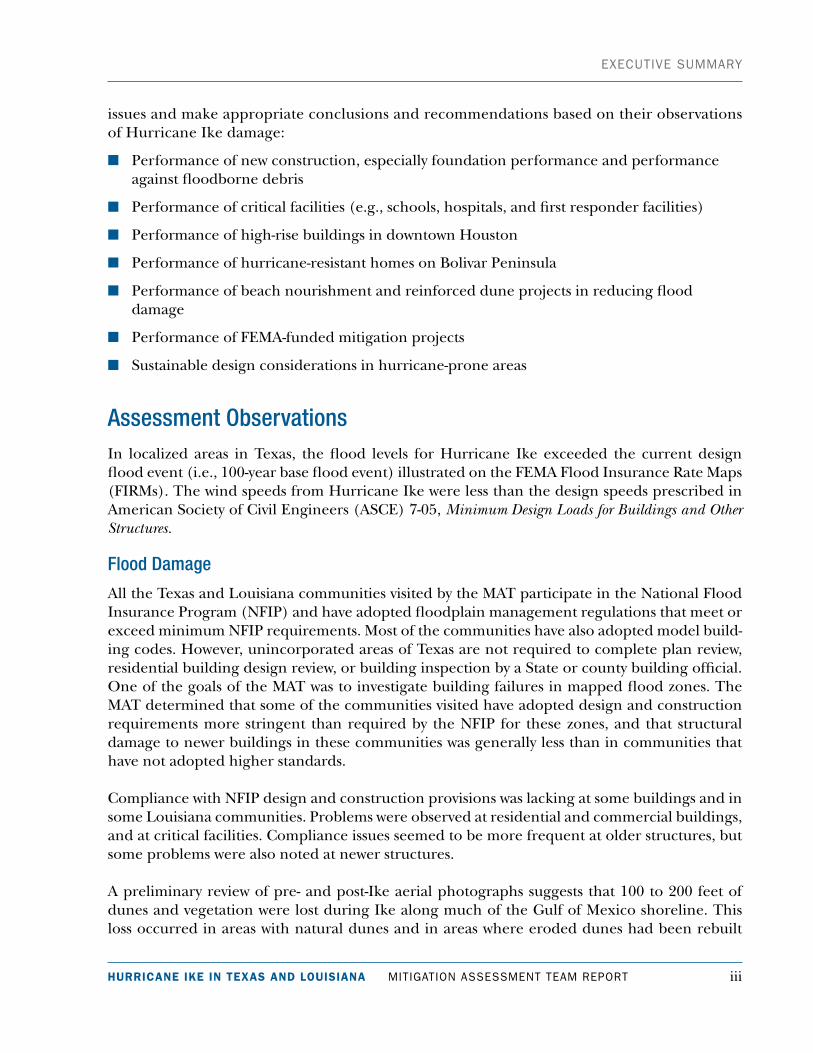
HURRICANE IKE IN TEXAS ANd LoUISIANA MITIGATION ASSESSMENT TEAM REPORT iii
issues and make appropriate conclusions and recommendations based on their observations of Hurricane Ike damage:
n Performance of new construction, especially foundation performance and performance against floodborne debris
n Performance of critical facilities (e.g., schools, hospitals, and first responder facilities)
n Performance of high-rise buildings in downtown Houston
n Performance of hurricane-resistant homes on Bolivar Peninsula
n Performance of beach nourishment and reinforced dune projects in reducing flood damage
n Performance of FEMA-funded mitigation projects
n Sustainable design considerations in hurricane-prone areas
Assessment ObservationsIn localized areas in Texas, the flood levels for Hurricane Ike exceeded the current design flood event (i.e., 100-year base flood event) illustrated on the FEMA Flood Insurance Rate Maps (FIRMs). The wind speeds from Hurricane Ike were less than the design speeds prescribed in American Society of Civil Engineers (ASCE) 7-05, Minimum Design Loads for Buildings and Other Structures.
Flood Damage
All the Texas and Louisiana communities visited by the MAT participate in the National Flood Insurance Program (NFIP) and have adopted floodplain management regulations that meet or exceed minimum NFIP requirements. Most of the communities have also adopted model build-ing codes. However, unincorporated areas of Texas are not required to complete plan review, residential building design review, or building inspection by a State or county building official. One of the goals of the MAT was to investigate building failures in mapped flood zones. The MAT determined that some of the communities visited have adopted design and construction requirements more stringent than required by the NFIP for these zones, and that structural damage to newer buildings in these communities was generally less than in communities that have not adopted higher standards.
Compliance with NFIP design and construction provisions was lacking at some buildings and in some Louisiana communities. Problems were observed at residential and commercial buildings, and at critical facilities. Compliance issues seemed to be more frequent at older structures, but some problems were also noted at newer structures.
A preliminary review of pre- and post-Ike aerial photographs suggests that 100 to 200 feet of dunes and vegetation were lost during Ike along much of the Gulf of Mexico shoreline. This loss occurred in areas with natural dunes and in areas where eroded dunes had been rebuilt
ExEcuTIvE SuMMARy
iv MITIGATION ASSESSMENT TEAM REPORT HURRICANE IKE IN TEXAS ANd LoUISIANA
and reinforced with geotextile tubes. The MAT observed significant levels of erosion and scour around buildings situated near the Gulf. Erosion was widespread along the Gulf shoreline of Follets Island, Galveston Island, Bolivar Peninsula, and portions of southwest Louisiana. The MAT did not observe any significant erosion and scour along the bay shorelines, although there may have been some locations where such erosion and scour occurred.
Overall, the damage observed by the MAT was consistent with typical wave damage patterns: damage to properly designed and constructed elevated homes was generally minor until the waves reached above the elevated floor system, at which point the damage increased dramatical-ly with increasing water level and wave height. Performance of residential building foundations to coastal and near-coastal hazards depended primarily on the residence having adequate el-evation, proper construction, and proper foundation selection. If any of these criteria were not satisfied, performance suffered. Several of the houses the MAT evaluated performed well, particularly where the foundations elevated the houses above flood levels, where the founda-tions were adequately constructed to resist the imposed forces, and where the foundations were founded deeply enough to resist scour and erosion.
Wind Damage
Though Hurricane Ike’s estimated wind speeds were less than the design wind speeds given in the current building code, the MAT observed widespread wind damage in the areas that were investigated. Although a very large number of buildings (including residential, commercial, and critical facilities) were damaged, much of the damage was light to moderate. Most of the wind damage was to building envelopes (primarily roof coverings, rooftop equipment, and wall coverings). Wind damage was most pronounced along the Bolivar Peninsula, the eastern por-tion of Galveston Island, and the areas bordering Galveston Bay.
The MAT observed various types of building envelope damage at several buildings in down-town Houston. A few high-rise buildings in downtown Houston had extensive glazing damage. According to the current building code, the basic wind speed for downtown Houston is ap-proximately 108 mph. The estimated maximum speed during Hurricane Ike was approximately 94 mph. Several failure mechanisms were observed for building envelopes, specifically glazing damage.
The wind speeds in Louisiana were even less than those in Texas, and were also less than the design wind speeds given in the current building codes. Estimated wind speeds ranged from 80 mph near the Texas/Louisiana border, to 50 mph in Vermilion Parish. East of Vermilion Parish, estimated wind speeds were less than 50 mph. Although wind damage did occur in Louisiana, it was not as significant as the damage in Texas. As is frequently observed during MAT investigations, damage to buildings and other structures is routinely produced by less than design wind speeds due to the following: lack of understanding and execution of basic wind-resistant design and construction practices; insufficient codes and standards at the time of construction; insufficient or lack of design guides and/or test methods at the time of con-struction; and improper or non-compliant building modifications or lack of maintenance by the property owners.
ExEcuTIvE SuMMARy
HURRICANE IKE IN TEXAS ANd LoUISIANA MITIGATION ASSESSMENT TEAM REPORT v
Critical Facilities Damage
Several critical facilities, such as Emergency Operations Centers (EOCs), fire and police sta-tions, hospitals, nursing homes, and schools were evaluated by the MAT in order to document building performance, as well as loss of function from Hurricane Ike. Critical facilities generally performed as expected. Those that were elevated higher and on stronger foundations sustained less damage. Those that were constructed in a manner similar to nearby, minimally compliant residential and commercial buildings sustained more damage.
Critical facilities with equipment and utilities in basements or at ground level tended to sustain flood damage to these support systems that either prohibited post-Ike resumption of opera-tions, or delayed or reduced operational capabilities. At least one critical facility destroyed by Hurricane Rita and rebuilt prior to Ike appeared to have insufficient elevation, and will likely be flooded again. While Ike flooding did not enter the building, the below-floor utilities were damaged by Ike, and facility function was lost for a period of time. Critical facilities such as this should be elevated several feet above the base flood elevation (BFE) to reduce the likelihood of future flood damage.
All of the critical facilities exposed to Hurricane Ike were subjected to wind speeds that were less than the design wind speeds given in the current building codes. Hence, while most of the critical facilities observed by the MAT experienced relatively little or no wind damage, the MAT observed issues indicating that if Hurricane Ike had delivered code design wind speeds, damage from poor wind performance would have been expected at many of these facilities.
RecommendationsA few of the main recommendations based on observed building performance related to Hur-ricane Ike are provided below, as well as specific recommendations for improving wind- and flood-resistance of critical facilities.
Flood
a. Until new flood maps are available and adopted, require the following freeboard above the Effective BFEs for new construction, substantial improvements, and repair of substantial damage: freeboard specified by the ASCE 24-05, Flood Resistant Design and Construction, plus 3 feet. Once new flood maps are available and adopted, require new construction, substantial improvements, and repair of substantial damage to be elevated to or above the freeboard elevation specified by ASCE 24-05.
b. Enforce ASCE 24-05’s Zone A design and construction standards in the area between the Effective Special Flood Hazard Area (SFHA) landward limit and a ground elevation equal to the adjacent Zone A Effective BFE plus freeboard.
c. Enforce ASCE 24-05’s Coastal A Zone design and construction requirements in areas presently mapped as Zone A on the Effective FIRM.
ExEcuTIvE SuMMARy
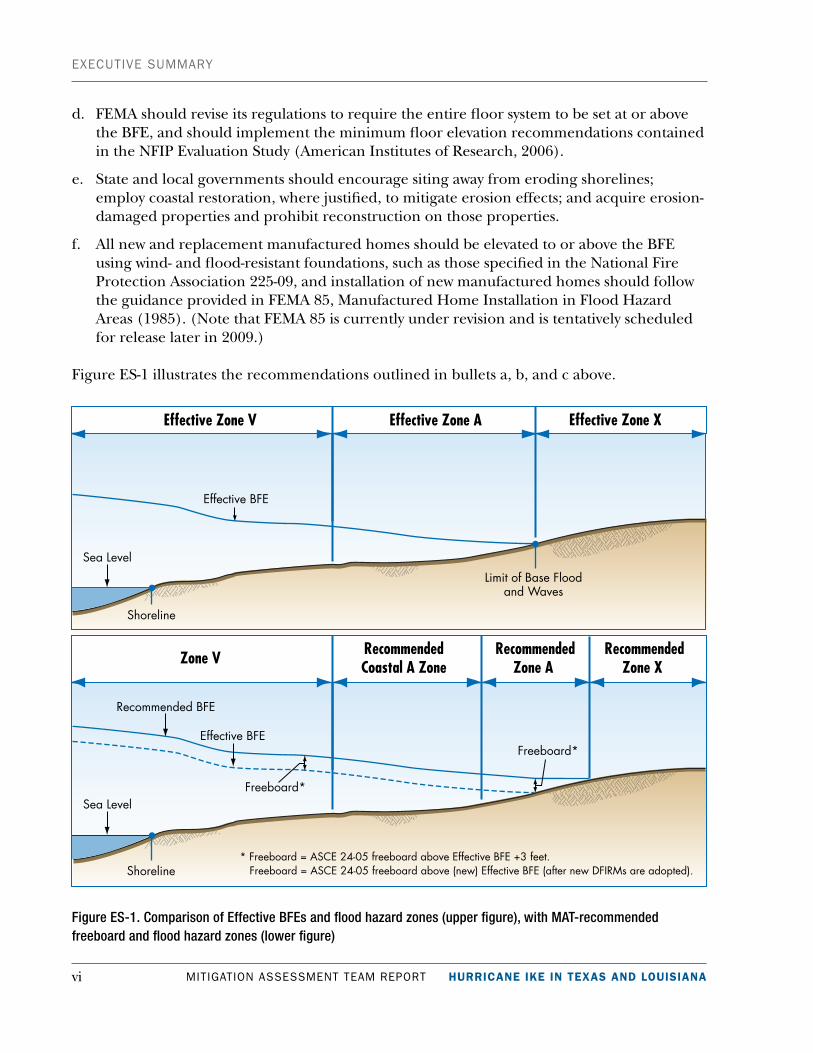
vi MITIGATION ASSESSMENT TEAM REPORT HURRICANE IKE IN TEXAS ANd LoUISIANA
d. FEMA should revise its regulations to require the entire floor system to be set at or above the BFE, and should implement the minimum floor elevation recommendations contained in the NFIP Evaluation Study (American Institutes of Research, 2006).
e. State and local governments should encourage siting away from eroding shorelines; employ coastal restoration, where justified, to mitigate erosion effects; and acquire erosion-damaged properties and prohibit reconstruction on those properties.
f. All new and replacement manufactured homes should be elevated to or above the BFE using wind- and flood-resistant foundations, such as those specified in the National Fire Protection Association 225-09, and installation of new manufactured homes should follow the guidance provided in FEMA 85, Manufactured Home Installation in Flood Hazard Areas (1985). (Note that FEMA 85 is currently under revision and is tentatively scheduled for release later in 2009.)
Figure ES-1 illustrates the recommendations outlined in bullets a, b, and c above.
Figure ES-1. Comparison of Effective BFEs and flood hazard zones (upper figure), with MAT-recommended freeboard and flood hazard zones (lower figure)
ExEcuTIvE SuMMARy
HURRICANE IKE IN TEXAS ANd LoUISIANA MITIGATION ASSESSMENT TEAM REPORT vii
Wind
a. An extensive amount of envelope wall covering, primarily vinyl siding and fiber cement siding, was damaged by Hurricane Ike. Municipalities with building code authorities, along with the Texas Department of Insurance (TDI) and their inspection program, should require that the installed products are on their approved and tested list and are installed in accordance with industry and manufacturer’s recommendations for high-wind-zone installations.
b. Vinyl soffits and attic ventilation systems frequently failed, thereby allowing water infiltration into the homes, causing damage. The TDI and Building Inspection Program should ensure that vinyl soffits are installed in accordance with industry and manufacturer’s recommendations for high-wind-zone installations.
c. Few impact-resistant laminated glass window units were observed by the MAT, with homeowners and builders opting to use shutters to provide windborne debris impact protection for glazed openings. TDI currently requires homes located in the Seaward Zone and the Inland (I) to be protected by impact-resistant glazing or shutters. The MAT recommends that opening protection by TDI include Inland (II [110 mph]) within 1 mile of the coastal mean high water line where the basic wind speed is equal to or greater than 110 mph, which is consistent with ASCE 7-05 and International Residential Code (IRC) 2003 recommendations.
Critical Facilities
a. New and replacement critical facilities should be sited outside the 500-year floodplain, where possible; where not possible, the critical facilities should be elevated higher than the residential and commercial building elevations called for in the flood recommendations. At a minimum, critical facilities should be elevated above the 500-year flood level or the freeboard requirements of ASCE 24-05, whichever offers more protection to the facility.
b. Do not locate equipment and utilities in the basements or ground levels of critical facilities; locate these above the BFE-plus-freeboard elevation. If elevation of these components is not feasible for existing critical facilities in Zone A, evaluate dry-floodproofing of these areas to an elevation several feet above the BFE; if the building structure cannot accommodate flood loads associated with dry-floodproofing to this elevation, consider relocation of the critical facility or replacement with a new critical facility.
c. Perform a comprehensive vulnerability assessment of the Main Wind Force Resisting Systems and building envelope. As part of the evaluation process, prioritize the identified vulnerabilities. FEMA 543, Design Guide for Improving Critical Facility Safety from Flooding and High Winds: Providing Protection to People and Buildings (2007) and FEMA 577, Design Guide for Improving Hospital Safety in Earthquakes, Floods, and High Winds: Providing Protection to People and Buildings (2007) recommend such an evaluation, regardless of building age, for critical facilities located in hurricane-prone regions.
ExEcuTIvE SuMMARy
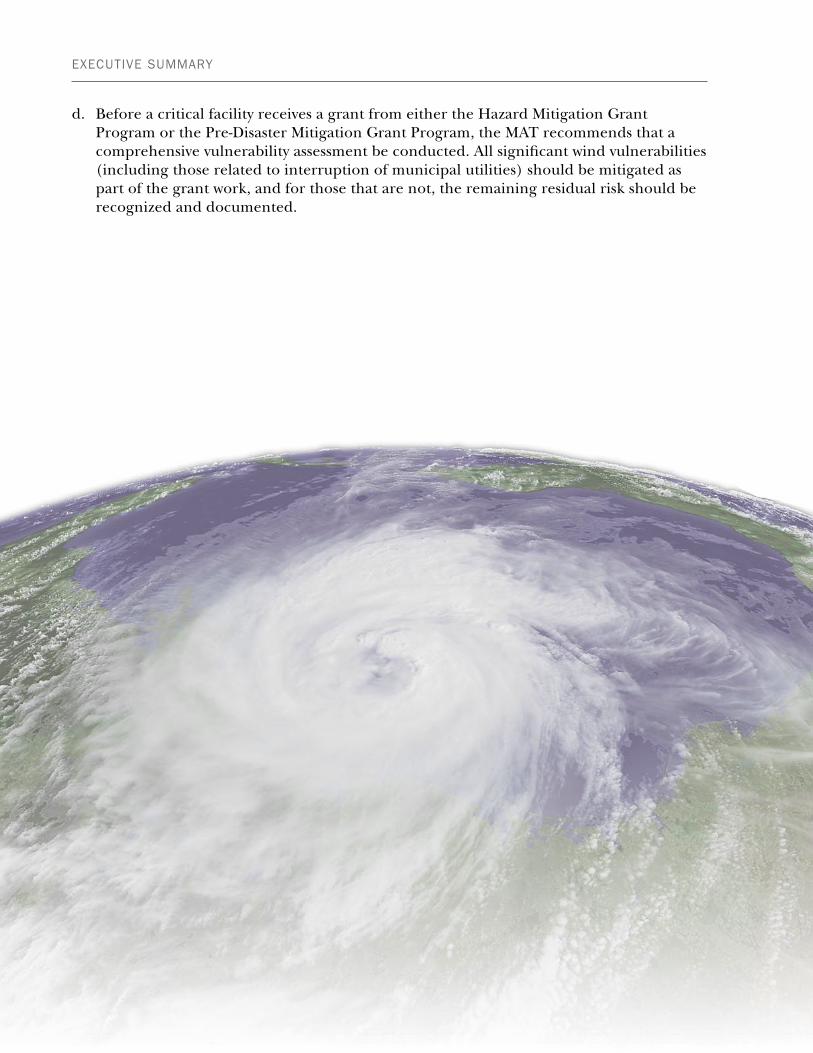
viii MITIGATION ASSESSMENT TEAM REPORT HURRICANE IKE IN TEXAS ANd LoUISIANA
d. Before a critical facility receives a grant from either the Hazard Mitigation Grant Program or the Pre-Disaster Mitigation Grant Program, the MAT recommends that a comprehensive vulnerability assessment be conducted. All significant wind vulnerabilities (including those related to interruption of municipal utilities) should be mitigated as part of the grant work, and for those that are not, the remaining residual risk should be recognized and documented.
ExEcuTIvE SuMMARy


![Origin of the Hurricane Ike forerunner surgecoast.nd.edu/reports_papers/forerunner_2011GL047090.pdf2. Hurricane Ike Forerunner Observations [4] Two days prior to Ike’s landfall,](https://img.pdfslide.net/doc/110x75/5f77c490deecde5f0019f526/origin-of-the-hurricane-ike-forerunner-2-hurricane-ike-forerunner-observations.jpg)