Embed Size (px)
Citation preview

Mitigation Targets, Burden Sharing and the Role of Economic Modeling in Climate Policy
Andrew Macintosh
May 2013
CCLP Working Paper Series 2013/1
ANU Centre for Climate Law and Policy
Sponsored by

ii
About the ANU Centre for Climate Law and Policy
The ANU Centre for Climate Law and Policy (CCLP) is part of the ANU College of Law. It was established in 2007 with the objective of providing a focal point for law and policy research related to climate change. The CCLP also runs courses in climate law and provides consulting services. Additional details of the CCLP can be found on its website: http://law.anu.edu.au/CCLP/.
The CCLP gratefully acknowledges the support of its founding sponsor, Baker & McKenzie.
CCLP Working Paper Series
The CCLP Working Paper Series provides a forum for the presentation of initial findings from CCLP research projects. The publications are intended to facilitate the exchange of information on climate law and policy issues. Through this process, the CCLP hopes to improve its final research outputs.
CCLP Working Paper Series 2013/1 corresponding author:
Andrew Macintosh Ph: 61 2 6125 3832 Email: [email protected]
About Baker & McKenzie
Baker & McKenzie provides sophisticated legal advice and services to the world’s most dynamic global enterprises and has done so for more than 50 years. Our network of lawyers is amongst the world’s most diverse and respected. We come from more than 60 countries and speak more than five dozen languages, including a common one, English. We are guided by a culture of integrity, personal responsibility, friendship and tenacious client service. Our unique approach enables clients to call upon more than 3,600 locally qualified, globally experienced lawyers in over 38 countries. We deliver the broad scope of quality legal services required to respond to any business need —consistently, confidently and with sensitivity for cultural, social and legal practice differences.
For more information about Baker & McKenzie, including details of its climate practice, please visit: www.bakernet.com.

3
Introduction
One of the current headline issues in climate policy is the resubmission process for
national targets under the Kyoto Protocol. By the end of April 2014, all parties to the
Protocol are supposed to have made a submission ‘relating to its intention to increase
the ambition of its commitment’ (UNFCCC Secretariat 2012: 3). At the time of
writing, the recently created Department of Industry, Innovation, Climate Change,
Science, Research and Tertiary Education (DIICCSRTE) was working through the
Government’s position on the target and considering whether it should move beyond
the unilateral target of a 5% reduction in emissions on 2000 levels by 2020.
Simultaneously, the Climate Change Authority —one of several new statutory
authorities created as part of the Clean Energy Future package — was effectively
doing the same thing in its ‘Caps and Targets Review’ (Climate Change Authority
2013).
If these and other similar processes elsewhere are to be based on something other than
raw self-interest, the starting point should be a decision on what ethical framework
will determine the targets. There is an extensive literature on methods and approaches
to target setting that goes back several decades (Beckerman and Pasek 1995; Rose et
al. 1998; Baer et al 2000; Berk and den Elzen 2001; Germain and van Steenberghe
2003; Gupta et al. 2007; Chakravarty et al. 2009; Ekardt and von Hövel 2009; Müller
et al. 2010; Oberheitmann 2010). Reduced to their most simple, the proposed
approaches can be divided into two groups based on their starting points: ‘resource
division’ and ‘burden sharing’. Under the resource division approach, the remaining
cumulative global emissions that are consistent with the desired climate outcome
(what is often called the ‘global emissions budget’) is treated as a resource that needs
to be divided up between countries. This is analogous to allocating a finite mineral
resource — it has even been referred to as an emissions pie (Broecker 2009).
Advocates of this approach often come down in favour of something approaching a
per capita division; each person gets an equal share of the remaining budget,
sometimes with adjustments to account for historic emissions and/or the need for a
transition period (Gupta and Bhandari 1999; Baer et al 2000; Meyer 2004; Bode
2004; Höhne et al. 2006; Ekardt and von Hövel 2009; Oberheitmann 2010).
Burden sharing starts from the premise that targets should be based on a division of
the global abatement task — or the difference between what emissions would be in
the absence of mitigation measures and where they need to be to achieve the desired
climate outcome. Under this approach, it is not an emissions pie that gets allocated
amongst the parties but an abatement pie (and rather than wanting more of it, self-
interested parties want less). Although there are a variety of burden sharing methods,
many seek to determine allocations on the basis of economic cost (Gupta et al. 2007).
Essentially, if it costs a country more in terms of lost social welfare to cut emissions,
it should receive a higher target and vice versa. Generally, the presumption in burden
sharing approaches is that the costs should be roughly equivalent, with some give and
take to account for existing levels of development and the social and economic
capacity to absorb costs (Jacoby et al. 1998; Rose et al. 1998; Ringius et al. 1998;
Babiker and Eckhaus 2002; Lecocq and Crassous 2003).
Figure 1 is a hypothetical representation of the two approaches. In resource division
approaches, the job is to divide up the remaining emissions (the blue area). For burden

4
sharing approaches, targets are determined on the basis of a division of the abatement
task (the red area).
Figure 1 Resource division versus burden sharing (hypothetical)
Of the two, the burden sharing approach has been more dominant in domestic and
international climate circles. The reason is partly due to the prominent role that
economists have played in climate policy and the tendency for many economists to
frame problems around issues they can model. The central role that modeling plays
hinges on the fact that, to assess the cost of cutting emissions, the standard method
involves forecasting the rate of economic growth under two counterfactual scenarios:
a business-as-usual case where there is no direct attempt to mitigate emissions;
and
a mitigation case where policy measures are deployed to reduce emissions.
The difference between the two scenarios in terms of reduced gross national product
(GNP) (or sometimes gross domestic product (GDP), gross national expenditure
(GNE) or gross national income (GNI)) is taken to represent the reduction in welfare,
which is then used to benchmark the ‘equitable’ contribution to the global effort to
reduce emissions (Rose et al. 1998; Babiker and Eckhaus 2002).
There are many grounds for opposing this approach, the most obvious being that GNP,
GDP, GNE, GNI and other similar macroeconomic indices are poor proxies of social
welfare (Fluerbaey 2009). Various other ethical and legal arguments could be
mounted against burden sharing, including that it is anti-liberal (e.g. it penalizes those
who have chosen not to pursue a high growth-fossil fuel dependent development path)
and runs counter to the customary law principle that no state has the right to damage
the environment outside their jurisdiction (known as the ‘no harm principle’) (Tol and
Verheyen 2004).
5
A more practical objection against burden sharing approaches is that the economic
projections on which they so often depend are unreliable. As Deidre McCloskey once
said of economic forecasting:
By all means attend to the forecasts of experts, as one must in order to live;
but expect little, and trust them not (McCloskey 1992: 42).
For burden sharing to have legitimacy, there must be an objective basis from which to
make cost comparisons on an ex-ante basis. Because ‘economists cannot predict much,
and certainly not predict profitably’ such a benchmark does not, and cannot, exist
(McCloskey 1990: 10). Even with the best of intentions and skill, projections require
modelers to make subjective judgments about uncertain variables, including
population and productivity growth, technological developments and deployment,
government policy and implementation, and greenhouse accounting rules. Not
surprisingly therefore, there is more than a reasonable chance they will be inaccurate.
For example, none of the economic analyses that were done for these purposes before
2008 foresaw the onset of the Great Recession. Now, emission reduction targets that
previously appeared ambitious, according to the logic of burden sharing, will be
achieved with little economic sacrifice — a point illustrated by the situation in Europe
and the current carbon price.
Given the significance of targets to sovereign interests, there is the added difficulty
that it is in the interests of all parties to skew the analyses in their favour. This would
not be overly problematic if the analyses were transparent but the complexity of the
modeling often shields it from scrutiny and leaves it vulnerable to manipulation.
Governments can shape the scenarios to produce results that support their negotiating
position safe in the knowledge that most people will be bamboozled by the numbers,
graphs, maps and other material that typically accompanies the analysis.
The object of this article is to demonstrate the practical problems with burden sharing
approaches that rely on economic forecasting by looking at how one of the six
greenhouse reporting sectors, known as land use, land-use change and forestry
(LULUCF), has been dealt with in the modelling exercises that have been done in
Australia for climate policy purposes. The article looks first at the modelling that was
undertaken in relation to the first commitment period of the Kyoto Protocol (2008 to
2012) (the ‘Kyoto studies’). It then reviews the two major analyses that have been
done by the Australian Treasury in relation to the post-2012 period before concluding.
First commitment period and the Kyoto studies
In 1997, in the lead up to the Kyoto Climate Conference (the 3rd
Conference of the
Parties to the United Nations Framework Convention on Climate Change), the
Australian Bureau of Agricultural and Resource Economics (ABARE) published
estimates of the cost associated with reducing developed country emissions to 1990
levels by 2010 (Brown et al. 1997). The major finding from the study was that
Australia would have to cut its emissions by 28% in 2010, involving a reduction in
real GNE of 2.6%, significantly above the projected losses in most other developed
countries. These projections provided the basis for Australia’s claims for concessional
emissions targets, which it duly received. Australia’s target in the Kyoto Protocol’s
first commitment period — to limit emission increases to 108% of 1990 levels over

6
the period 2008 to 2012 — was the second most generous of all developed countries
behind Iceland.
In 1999, after the Kyoto Protocol had been signed, ABARE published a follow-up
report that found that meeting the 108% target would require a greater than 20%
reduction in emissions and cut 0.5-0.7% off GNP (Brown et al. 1999). Two years later,
after the Kyoto Protocol’s accounting rules were finalised, ABARE revised its
estimate of the abatement task to a 6.5% reduction in emissions, and the GNP losses
were downgraded to 0.15% in 2010, rising to 0.24% by 2015 (ABARE 2002). In a
mirror report to the Australian Greenhouse Office in 2002, economist Warwick
McKibbin projected the impact of the Protocol on the Australian economy would be
roughly double the ABARE estimate: a 0.33% reduction in GNP in 2010 and a 0.47%
reduction in 2015 (McKibbin 2002).
All of these studies are likely to have significantly overestimated the costs associated
with meeting Australia’s first commitment period target because they either ignored
or underestimated the availability of low-cost, no-cost or even negative cost LULUCF
offsets (Macintosh 2012a). During the first commitment period, Australia only
accounted for three of the possible seven LULUCF activities: afforestation,
reforestation and deforestation (known as the ‘Article 3.3 activities’) (for simplicity,
hereafter, afforestation and reforestation are collectively referred to as reforestation).
Australia elected not to account for the other four LULUCF activities (forest
management, cropland management, grazing land management and revegetation —
the ‘Article 3.4 activities’), officially because of concerns about the impacts of
bushfire and drought but probably also because the Government thought they would
be unnecessary as Australia was likely to get a healthy supply of ‘hot air’ from
deforestation (‘hot air’ is credits for which no direct policy effort is required)
(Australian Government 2008a; 2008b).
The hot air stems from Article 3.7(2) of the Kyoto Protocol (known as ‘the Australia
clause’). This provision allows Australia (and a handful of other developed countries)
to include deforestation emissions in its base year for the purpose of calculating its
target. Australia insisted on the inclusion of Article 3.7(2) because its deforestation
emissions had fallen by 50% over the period 1990 to 1997. By including deforestation
emissions in its base year, the Australian Government knew it could receive credit for
the reductions that had already occurred and use these to offset emission increases in
other sectors (Macintosh 2012b).
This is what has happened. Between 1990 and 2011, emissions from the non-
LULUCF sectors increased by 135 million tonnes of carbon dioxide equivalent
(MtCO2-e). These increases are being offset by roughly 80 MtCO2-e yr-1
of offset
credits from deforestation, and a further 24 MtCO2-e yr-1
from reforestation
(DIICCSRTE 2013a).
Despite the importance of reforestation and deforestation to the end outcome, in the
analysis prepared in the lead up to Kyoto, LULUCF was completely excluded (Brown
et al. 1997). ABARE’s report on the impact of the Protocol that was released in 1999
also did not model LULUCF; even the impacts of Article 3.7(2) were omitted (Brown
et al. 1999). The ABARE and McKibbin reports of 2002 both included reforestation
and deforestation offset projections but they underestimated the actual outcomes by
almost 50 MtCO2-e yr-1
, or roughly 80% (ABARE 2002; McKibbin 2002).

7
The treatment of LULUCF in the Kyoto studies raises a question about whether cost
comparisons in burden sharing should be based on the lowest possible ways of
reducing emissions or whether there should be some scope to exclude abatement
opportunities if they are considered inconvenient or otherwise unachievable. For
example, does the fact that Australia elected not to account for the Article 3.4
activities mean that, for the purposes of a burden sharing analysis, these activities
should be excluded, even if the inclusion of one or more of these activities could have
lowered the welfare losses? The obvious problem with excluding abatement
opportunities is that it sacrifices any claims that burdening sharing may have to
objectivity. It is the equivalent of having a handicap race where the size of the
handicap is set on the basis of prior performances and then allowing the runners to ‘go
slow’ in the benchmark races. Note that the Kyoto studies published after the 3rd
Conference of the Parties cannot be critiqued on these grounds as their aim was
merely to evaluate the cost of meeting Australia’s targets under the agreed rules. But
I’ll return to this issue later in the context of the analyses that have been done for the
post-2012 era.
Returning to the Kyoto studies, the obvious response to the critique about the
exclusion of LULUCF is to claim that the fall in deforestation and increase in
reforestation were the product of government policies. Hence, while the cost may not
have been as much as predicted, the LULUCF credits were not ‘effort free’. The
rejoinder to this argument has two parts. First, as a matter of fact, while policy
changes have been a major driver of the increase in reforestation, they are not the
main reason for the decline in deforestation.
It is widely believed that the downward trend in deforestation has been brought about
by land clearing laws in New South Wales and Queensland — a view that has been
aired by numerous politicians and found its way into several government reports
(Australian Treasury 2008; Garnaut 2008; Department of Climate Change and Energy
Efficiency 2012a; Macintosh 2012b). Reform of land clearing laws commenced in
both New South Wales and Queensland in 1995 (Macintosh 2010; 2012b). In New
South Wales, further rounds of reform occurred in 1997 and 2003, with the last of
these coming into effect in 2005 with the promise it would end broad-scale clearing.
Queensland went through a similar staggered reform process, with the initial 1995
changes being followed by major modifications in 1999, 2004 and 2009.1
Due to the timeline of reform, the laws could not have been the driver of the fall in
deforestation that occurred in the early- to mid-1990s; they did not exist. The
observed trends were a product of three factors.
Declining availability of uncleared productive land. Since European
settlement, most areas that are suitable for agriculture in Australia have been
deforested and converted to either cropland or grazing land (and more recently
urban land uses). Generally, the remaining uncleared areas are less productive
and often require accompanying large-scale irrigation infrastructure. The
diminishing opportunities for profitable agricultural development on uncleared
land has contributed to the gradual downward trend in deforestation.
Long-term deterioration in farmers’ terms of trade. Since the 1970s, the prices
paid for farm inputs have risen faster than the price of farm outputs, reducing
1 In May 2013, some of these changes were wound back by the Newman LNP Government.

8
the surplus generated by farm businesses. This has reduced the demand for
forest conversion — farmers have been better off putting their money in other
ventures than expanding agricultural output through deforestation. The
influence of these market forces is evident from Figure 2, which shows
farmers’ terms of trade and total deforestation (forest conversion plus
reclearing). The coefficient of determination (R2) from a linear least squares
regression using annual percentage change in total deforestation and farmers’
terms of trade over the period 1973-1997, with a one year lag in clearing, is
0.60 (p<0.01), suggesting that falling terms of trade was an important
contributor to the decline in deforestation over this period.
The late 1980s and early 1990s spike. During the late 1980s and early 1990s,
there was above average rainfall and high commodity prices, the combination
of which helped trigger a spike in clearing — the rate of deforestation went
from 450,000-500,000 ha yr-1
in the mid- to late-1980s to 600,000 ha yr-1
in
1990. With the onset of the global recession in the early 1990s and the 1991-
1995 drought that struck parts of Australia, the main deforestation drivers
subsided and deforestation rates fell. This chain of events ensured that
Australia had a relatively high rate of deforestation in 1990, which is now used
as the baseline in calculating the net impact of deforestation under the Kyoto
Protocol (Macintosh 2010; 2012b).
Figure 2 Australia total deforestation (forest conversion plus reclearing) and
farmers’ terms of trade, 1973-2009
Source: ABARES (2012); DIICCSRTE (2013a). Data for 2010 and 2011 have been omitted because
they are preliminary.
The land clearing reform process that started in 1995 has had mixed effects. In New
South Wales, the clearing laws have not triggered a decline in the rate of either forest
conversion or reclearing. As Figure 3 shows, the rate of forest conversion increased in

9
the mid-2000s, probably as a result of landholders trying to pre-empt the legal
changes, and has since stabilised at levels similar to those seen prior to their
introduction. The rate of reclearing has increased since the laws were introduced.
Figure 3 New South Wales forest conversion and reclearing, 1990-2009
Source: DIICCSRTE (2013a). Data for 2010 and 2011 have been omitted because they are preliminary.
Queensland’s reform process followed a similar trajectory to New South Wales until a
moratorium on broad-scale clearing applications was introduced by the Beattie Labor
Government in May 2003, which was then formalised with the legal changes of 2004
(Macintosh 2010; 2012b). These changes aimed to phase out broad-scale clearing by
the end of 2006. Owing to a combination of good design and effective monitoring and
enforcement, the laws succeeded in driving down the rate of both forest conversion
and reclearing (Figure 4). However, despite these recent successes, the market and
climatic factors identified above will still be responsible for the majority of the
deforestation offsets that Australia will receive in the first commitment period.

10
Figure 4 Queensland forest conversion and reclearing, 1990-2009
Source: DIICCSRTE (2013a). Data for 2010 and 2011 have been omitted because they are preliminary.
The second flaw in the argument that the deforestation and reforestation credits were
the product of government policies is that it assumes all policy measures, whether or
not they were directed at mitigating greenhouse emissions, are relevant. The price
paid for reducing emissions in the burden sharing approach should not include costs
associated with policies that are introduced for non-climate reasons — that is, policies
that would have been introduced in the absence of concerns about climate change.
These policies should form part of the business-as-usual scenario. The land clearing
laws were intended to address concerns about land degradation and biodiversity loss.
The New South Wales laws make no mention of climate change and it was not raised
as a significant issue while the laws were being designed and formulated (Knowles
2003; Costa 2003; P Cosier pers comms 2009; P Gibbons pers comms 2009;
Macintosh 2010).2 In Queensland, the mitigation of greenhouse gas emissions was not
raised as a material issue until the 2004 reforms and, even then, there is little doubt
the laws would have been introduced irrespective of concerns about climate change (P
Beattie pers comms 2009; Macintosh 2010).3
The same applies for reforestation. The Plantations for Australia: The 2020 Vision —
a joint Australian Government/state government/industry initiative launched in 1997
— aimed to triple Australia’s plantation estate over the period 1996-2020; from 1.1
million hectares (Mha) to 3.3 Mha (Plantation 2020 Vision Implementation
Committee 1997; Senate Rural and Regional Affairs and Transport References
Committee 2003). To realise this objective, generous tax concessions were offered to
the plantation sector, including through managed investment schemes (Ajani 2007;
2011; Macintosh 2013). As a result of these incentives and favourable market
2 Native Vegetation Act 2003 (NSW). 3 Vegetation Management Act 1999 (Qld); Vegetation Management Bill 1999: Explanatory Notes;
Vegetation Management and Other Legislation Amendment Act 2004 (Qld); Vegetation Management
and Other Legislation Amendment Bill 2004: Explanatory Notes.

11
conditions, the national plantation estate expanded rapidly in the late 1990s through to
the late 2000s (Figure 5). This upswing in plantation establishment, most of which are
short rotation hardwoods designed to produce pulplogs, is the primary reason
Australia will record around 24 MtCO2-e yr-1
of credits from reforestation over the
first commitment period.
Figure 5 Australia area of new forest plantings, by planting type, 1990-2011
Source: DIICCSRTE (2013a).
As with the Queensland land clearing laws, greenhouse gas abatement was not the
main driver behind the 2020 Vision. The 2020 Vision was primarily intended to help
reduce the trade deficit in wood and wood products and promote growth in the forest
sector. A related factor behind its introduction was that policy measures, and
management and market factors, were leading to reduced log supply from native
forests. By promoting the expansion of plantations, the 2020 Vision hoped to ensure
the forestry sector would have an ongoing supply of logs. The sequestration of carbon
dioxide and generation of LULUCF offsets were acknowledged as benefits of the
policy but there are few who would claim that, in the absence of climate change, the
2020 Vision and associated plantation incentives would not have been created
(Plantation 2020 Vision Implementation Committee 1997; Senate Rural and Regional
Affairs and Transport References Committee 2003).
Second commitment period studies
Two major modelling exercises have been done by the Australian Treasury in relation
to the post-2012 era; both have had similar problems with LULUCF. The first of these,
Australia’s Low Pollution Future: The Economics of Climate Change Mitigation, was
released in 2008 and analysed the costs associated with meeting mitigation targets
under four scenarios: two based on a multi-stage emission entitlement allocation
approach (CPRS-5 and CPRS-15) and two based on a modified contraction-and-
convergence model (Garnaut-10 and Garnaut-25) (Australian Treasury 2008).

12
The multi-stage emission entitlement allocation approach is a burden sharing method
in which mitigation obligations are determined on the basis of an assumed rate of
divergence from a projected business-as-usual or reference case. In the Australia’s
Low Pollution Future report, all countries had the same rate of divergence from their
reference scenario but they were assumed to take on mitigation obligations at different
dates. Contraction-and-convergence is a well-known resource division approach
where countries’ per capita emissions are assumed to converge to an agreed global
level over a specified timeframe. For current purposes, it is sufficient to confine the
discussion to the CPRS-5 scenario, under which it was assumed that the international
community agrees to stabilise the atmospheric concentration of greenhouse gases at
~550 ppm in 2100 and Australia undertakes to reduce its emissions by 5% on 2000
levels by 2020, consistent with the current unilateral target.
According to the Australia’s Low Pollution Future report, meeting the 5% target
under the CPRS-5 scenario would reduce GDP by 1.1% and GNP by 1.1% in 2020
relative to a reference case that included pre-existing policy measures like the 9,500
gigawatt hour (GWh) Mandatory Renewable Energy Target and the NSW and ACT
Greenhouse Gas Reduction Scheme (note that this is a reference case not a true
business-as-usual scenario, which would exclude the impacts of policy measures
explicitly designed to reduce emissions and address climate concerns). This cost was
assessed as being larger than those incurred by most other developed countries in
meeting equivalent mitigation obligations. Only Russia (and other CIS member states)
and Canada were found to incur similar or higher costs.
As was the case with the analysis carried out in the lead up to the Kyoto negotiations,
the findings from the Australia’s Low Pollution Future report were used to support
Australia’s negotiating position on its target. For example, in a submission to the Ad
Hoc Working Group on Further Commitments for Annex I Parties under the Kyoto
Protocol and Ad Hoc Working Group on Long-Term Cooperative Action, the
Australian Government stated:
Differentiation of targets helps reduce cost differences, ensuring greater
comparability of national efforts. The analysis shows that Australia faces high
economic costs, relative to most other developed countries, due to its large
share of emission- and energy-intensive industries and a dominance of low-
cost coal in electricity generation. … Australia’s costs are higher than both
Japan’s and the European Union’s, despite being allocated smaller percentage
reductions from 1990 levels in all of the scenarios. These broad results are
typical of modelling by other groups. They highlight that while the reduction
from 1990 is a convenient common way to express an emission target, it is not
necessarily informative about the degree effort required to achieve that target
(Australian Government 2009: 3-4).
Similar to the pre-Kyoto analysis, the Australia’s Low Pollution Future report
downplayed the roll that LULUCF could play in the second commitment period and
ignored the potential for Australia to get cheap abatement from other sources.
Specifically, the report assumed that Australia would only account for Article 3.3
activities (reforestation and deforestation) in the second commitment period (2013 to
2020). The optional Article 3.4 activities were excluded from the analysis. Although
not known at the time the report was prepared, it has now been resolved that Australia
will account for all four of the activities that were covered by Article 3.4 in the first

13
commitment period. It has chosen not to account for the new optional Article 3.4
activity; wetland drainage and rewetting.
As alluded to above, the exclusion of the Article 3.4 activities from the scope of the
analysis does not sit easily with a principled approach to burden sharing. For burden
sharing to have legitimacy, the cost comparison should be based on the economic
sacrifice associated with the cheapest possible sources of abatement or, at the very
least, the lowest cost abatement opportunities that are technically feasible to realise.
Potentially accessible abatement opportunities should not be excluded from the scope
of the analysis because, in doing so, it can artificially inflate the cost estimates. This is
what the Australia’s Low Pollution Future report did. By excluding the Article 3.4
activities, Treasury ensured that the modelling was blind to the potential for cheap
offsets to be sourced from these land management categories. It even overlooked the
potential for offsets to be recorded in these sectors as a result of market factors and
land management changes that have already occurred.
Since the early 1990s, improved crop management practices, including controlled
traffic farming and minimum tillage, have been widely adopted across Australia’s
almost 25 million hectares of croplands (Tullberg et al. 2007; Llewellyn and
D’Emden 2009; Kingwell and Fuchsbichler 2011; DIICCSRTE 2013b). Although the
relevant national accounting methods are still evolving, a rough estimate is that these
practices, if maintained, could generate in the order of 20-25 MtCO2-e of offset
credits from cropland management over the second commitment period; all at no or
negative cost (Llewellyn and D’Emden 2009; Environment Canada 2012).
Grazing land management and revegetation could provide a similar windfall.
Australia has approximately 350 million hectares of grazing land, providing
considerable scope for abatement through increases in soil organic carbon and
biomass via the adoption of sustainable grazing land management practices (e.g.
establishment of perennials and maintenance of groundcover) (DIICCSRTE 2013b).
At present, there is limited data on land management changes and those that are
available suggest the uptake of improved techniques has not been as dramatic as in
croplands. Despite this, a conservative estimate is that Australia could get around 10
MtCO2-e from grazing land management and revegetation with little or no direct
policy effort, and considerably more with targeted programs.
The last of the four Article 3.4 activities is forest management, where the potential for
effort-free offsets hinges on the state of the native forestry sector. Harvesting in native
forests has fallen steadily over the past 20 years, and dropped dramatically since 2008,
mostly because of increased domestic and international competition and declining
demand for native forest wood products. Despite considerable government assistance
and the best efforts of the sector to attract more, a dramatic revival in its fortunes
looks unlikely. If this assessment proves correct and harvesting remains around
current levels, Australia will get approximately 80 MtCO2-e of credits from forest
management over the period 2013-2020 without the need for any economic sacrifice
(Macintosh 2011a; 2011b).
All told, it is reasonable to assume that Australia could receive around 110-115
MtCO2-e of credits over the period 2013-2020 from the Article 3.4 activities with
little or no policy effort. This constitutes 7-9% of the Australia’s Low Pollution
Future report’s estimated total abatement task associated with the 5% 2020 mitigation
14
target (1,335 MtCO2-e). If all cost-effective sources of abatement were realised — say,
where the associated abatement cost is <$30/tCO2-e (real) — the credits from Article
3.4 activities could be several times greater. These estimates are subject to
uncertainties, including in relation to methods and activity data. However, there is
little doubt that, by ignoring the Article 3.4 activities, the Australia’s Low Pollution
Future report overlooked a sizeable amount of low-cost, no-cost and negative-cost
abatement.
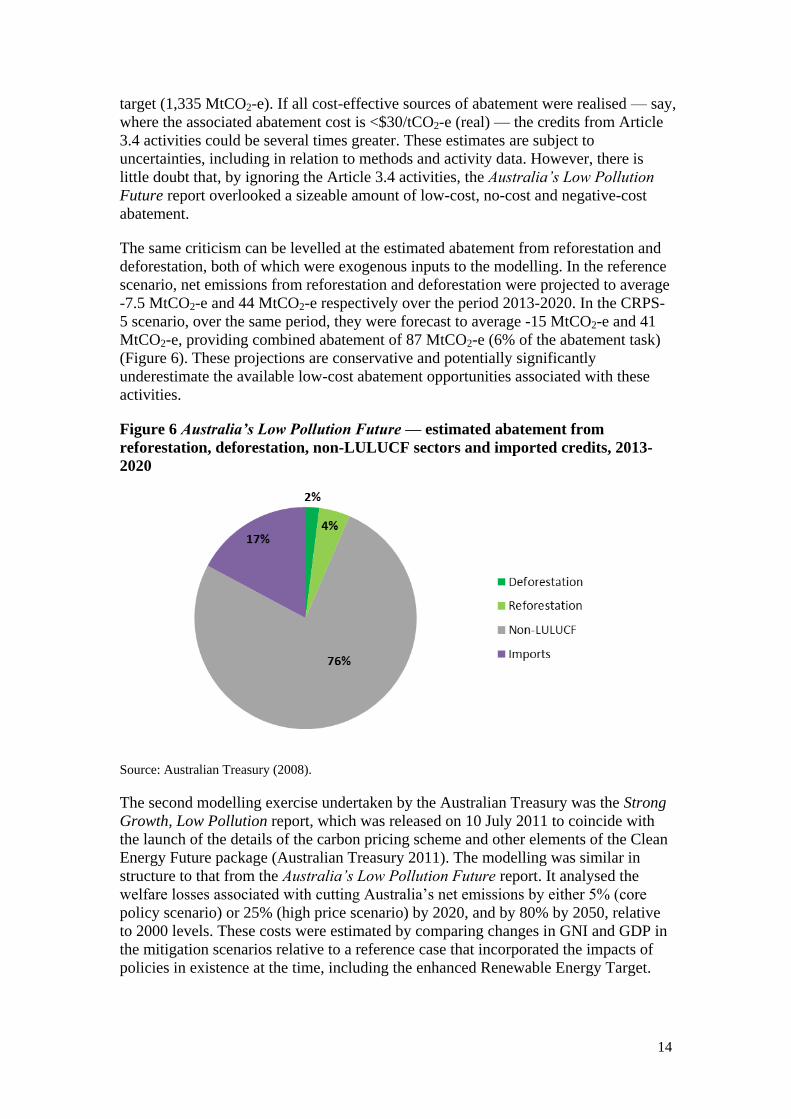
The same criticism can be levelled at the estimated abatement from reforestation and
deforestation, both of which were exogenous inputs to the modelling. In the reference
scenario, net emissions from reforestation and deforestation were projected to average
-7.5 MtCO2-e and 44 MtCO2-e respectively over the period 2013-2020. In the CRPS-
5 scenario, over the same period, they were forecast to average -15 MtCO2-e and 41
MtCO2-e, providing combined abatement of 87 MtCO2-e (6% of the abatement task)
(Figure 6). These projections are conservative and potentially significantly
underestimate the available low-cost abatement opportunities associated with these
activities.
Figure 6 Australia’s Low Pollution Future — estimated abatement from
reforestation, deforestation, non-LULUCF sectors and imported credits, 2013-
2020
Source: Australian Treasury (2008).
The second modelling exercise undertaken by the Australian Treasury was the Strong
Growth, Low Pollution report, which was released on 10 July 2011 to coincide with
the launch of the details of the carbon pricing scheme and other elements of the Clean
Energy Future package (Australian Treasury 2011). The modelling was similar in
structure to that from the Australia’s Low Pollution Future report. It analysed the
welfare losses associated with cutting Australia’s net emissions by either 5% (core
policy scenario) or 25% (high price scenario) by 2020, and by 80% by 2050, relative
to 2000 levels. These costs were estimated by comparing changes in GNI and GDP in
the mitigation scenarios relative to a reference case that incorporated the impacts of
policies in existence at the time, including the enhanced Renewable Energy Target.

15
The headline results from the report were that meeting the 5% target under the core
policy scenario would reduce GNI by 0.5% and GDP by 0.3% in 2020. The reduction
in the size of the economic cost compared to the results from the Australia’s Low
Pollution Future report is attributable to a number of factors, including the change in
the policies embodied in the reference case.
As before, LULUCF was seen as only a minor contributor to the abatement task. The
Article 3.4 activities were excluded — even though it was becoming increasingly
likely Australia would account for one or more of these activities — and the LULUCF
analysis was confined to deforestation and reforestation. In the absence of the Carbon
Farming Initiative, net deforestation emissions were projected to average 48 MtCO2-e
yr-1
over the second commitment period. The Carbon Farming Initiative was forecast
to generate 4 MtCO2-e yr-1
of abatement but, in the reference case, it was assumed
these credits would be excluded from Australia’s accounts because they would either
be exported or used in voluntary markets (the Government had undertaken to cancel
Assign Amounts Units where Carbon Farming Initiative credits were used in domestic
voluntary markets). In the core policy scenario, net deforestation emissions were
assumed to be the same as in the reference case (i.e. average 44 MtCO2-e yr-1
), only
the 4 MtCO2-e yr-1
of abatement from the Carbon Farming Initiative could be counted
towards Australia’s targets because the associated credits would be used in the
domestic carbon pricing scheme.
Net reforestation emissions were assumed to average -14 MtCO2-e yr-1
in the
reference case without the Carbon Pricing Scheme and -15 MtCO2-e yr-1
with it.
Again, in the reference case, the reforestation credits generated under the Carbon
Farming Initiative (0.3 MtCO2-e yr-1
) were assumed to be exported or used in
voluntary markets. In the core policy scenario with the carbon pricing scheme, these
credits were assumed to be used in the domestic compliance market.
As was the case with the Australia’s Low Pollution Future report, the treatment of
LULUCF in the Strong Growth, Low Pollution report was conservative. In total,
LULUCF contributed only 4% of the total abatement task over the second
commitment period (31 MtCO2-e out of 737 MtCO2-e), the vast majority of which
was expected to come from avoided deforestation (Figure 7). Reforestation was all
but irrelevant.

16
Figure 7 Strong Growth, Low Pollution — estimated domestic and international
abatement, by sector, 2013-2020
Source: Australian Treasury (2011).
The exclusion of the Article 3.4 activities is the most obvious problem with the
LULUCF projections. The other stand out LULUCF-related deficiency of the Strong
Growth, Low Pollution report is that it ignored the substantial surplus that Australia
will carry into the second commitment period. By 2011 it had become apparent that
Australia would meet its first commitment period target by a considerable margin
(Macintosh 2011c; Department of Climate Change and Energy Efficiency 2012b).
Emissions from non-LULUCF sources were not growing as fast as forecast because of
a range of factors, including the global economic slowdown, softening of commodity
prices, climatic influences (droughts and floods), changes in energy use patterns and
policy measures. Net deforestation and reforestation emissions had also fallen sharply
as a result of the impacts of the Queensland clearing reforms and the deterioration in
woodchip demand and terms of trade. The available data suggest that, as a result of
these factors, Australia will end up with a surplus of 90-100 MtCO2-e from the first
commitment period, which it is allowed to use to offset emissions in the second
commitment period. This was ignored in the Strong Growth, Low Pollution report. In
the most recent government emission projections, the fact that Australia was likely to
come under its target was noted but the surplus was not subtracted from the abatement
task (Department of Climate Change and Energy Efficiency 2012a).
If the results from the Strong Growth, Low Pollution report are to be used to evaluate
the fairness or otherwise of Australia’s targets, it could also be argued that the
reforestation and deforestation forecasts are too cautious. The Government may even
have underestimated net removals from reforestation in the reference case. In 2010

17
and 2011, they were forecast to be -21 MtCO2-e yr-1
, whereas they have recently been
reported to have averaged -26 MtCO2-e yr-1
over this period (-17 MtCO2-e yr-1
without the harvest sub-rule),4 possibly because of conditions in the forestry sector,
particularly the decline in export woodchip prices and increased foreign competition
in the Japanese and Chinese chip markets (DIICCSRTE 2013a; Macintosh 2013).
Whether net reforestation removals fall in line with the projections over the second
commitment remains to be seen and will depend on market conditions and
government policy.
Prior to the May 2013 reforms to Queensland’s land clearing laws, which wound back
the prohibition on broad-scale clearing and watered down the enforcement powers, it
appeared the Australian Government had overestimated both the likely rate of
deforestation under the existing policies and the impacts of the Carbon Farming
Initiative. Although preliminary, the most recent data suggest net deforestation
emissions in 2010 and 2011 were 45 MtCO2-e and 38 MtCO2-e respectively,
significantly below the projected levels of 49 MtCO2-e and 48 MtCO2-e (DIICCSRTE
2013a). As for the Carbon Farming Initiative, deforestation has only recently been put
on the positive list (i.e. made eligible under the scheme) and, with the current
methodology and likely future carbon price, it is unlikely to generate anything like the
forecast 29 MtCO2-e of credits from avoided deforestation.
As has been noted elsewhere, projecting trends in deforestation is particularly difficult
because of the extent of the uncertainties associated with underlying drivers and
policy factors (Macintosh 2010; 2012b). The recent trends in deforestation emissions
and the May 2013 reforms to the Queensland clearing laws illustrate this.
Significantly, the Queensland regulatory changes could result in a rebound in
deforestation emissions and increase the abatement task associated with the 5% target.
Conclusion
The treatment of LULUCF in the modelling that has been done for policy purposes in
Australia highlights the problems with burden sharing approaches that use economic
forecasts to determine national targets. Put simply, economic modelling is too
unreliable, too subjective and too vulnerable to manipulation to provide a reliable and
objective basis from which to set caps. Economic modelling has its uses, including in
relation to the formulation of climate policy. The danger lies in exactly how it is used.
In this case, the modelling has tended to ignore or underplay the role of LULUCF and
the low-cost, no-cost and negative-cost offsets it offers. This has inflated the
abatement task and welfare losses associated with meeting various targets. This is not
to say that there has been a conspiracy to manipulate the modelling to produce
particular results. As Hanlon’s razor suggests, given a choice between malice and
error, the latter is likely to be true. More specifically, all useful forecasts are uncertain
and nobody has perfect foresight. A distinction also needs to be made between the
task often given to modellers (e.g. what is the likely abatement task and welfare losses
associated with meeting a target under specified government policies?) and the uses to
which the results are put. Further, when making predictions for these purposes, there
4 The harvest sub-rule, which applied during the first commitment period, provides that debits
accounted on a reforested land unit cannot exceed the recorded credits. This rule does not apply in the
second commitment period.

18
are strong incentives for government modellers to err on the side of over-estimating
rather than under-estimating the abatement task.
Any principled approach to target setting should strive for objectivity. Burden sharing
based on projected welfare losses cannot provide this. Because of errors and
unforeseen events, the welfare losses associated with meeting a given emission
reduction target could be, and is in fact likely to be, different from the forecasts. As a
last word, it is worth noting that the true test of those who support a burden sharing
approach based on projected welfare losses is whether they also support a process for
raising targets when it becomes apparent that the welfare losses of a state are less than
projected. Without a forked tongue, it is difficult to argue for one while opposing the
other.

19
References
Ajani, J. 2007. The Forest Wars. Melbourne: Melbourne University Press.
Ajani, J. 2011. Australia’s Wood and Wood Products Industry Situation and Outlook.
Working Paper. Canberra: Australian National University Fenner School of
Environment and Society.
Australian Bureau of Agricultural and Resource Economics [ABARE]. 2002. COP7:
The economic implications of the Kyoto Protocol for Australia. Canberra:
Commonwealth of Australia.
Australian Bureau of Agricultural and Resource Economics and Sciences [ABARES].
2012. Agricultural Commodity Statistics 2012. Canberra: Commonwealth of Australia.
Australian Government. 2008a. Carbon Pollution Reduction Scheme: Australia’s Low
Pollution Future: White Paper. Canberra: Commonwealth of Australia.
Australian Government. 2008b. Land Use, Land-Use Change and Forestry
(LULUCF) Sector: Submission to the AWG-KP and AWG-LCA. Canberra:
Commonwealth of Australia.
Australian Government. 2009. Economic cost as an indicator for comparable effort:
Submission to the AWG-KP and AWG-LCA. Canberra: Commonwealth of Australia.
Australian Treasury. 2008. Australia’s Low Pollution Future: The Economics of
Climate Change Mitigation. Canberra: Commonwealth of Australia.
Australian Treasury. 2011. Strong Growth, Low Pollution: Modelling a Carbon Price.
Canberra: Commonwealth of Australia.
Babiker, M., R. Eckhaus. 2002. ‘Rethinking the Kyoto targets’. Climatic Change
54:99-114.
Baer, P., J. Harte, B. Haya, A. Herzog, J. Holdren, N. Hultman, D. Kammen, R.
Norgaard and L. Raymond. 2000. ‘Equity and Greenhouse Gas Responsibility’.
Science 289:2287.
Beckerman, W. and J. Pasek. 1995. ‘The equitable international allocation of tradable
carbon emission permits’. Global Environmental Change 5(5):405-413.
Berk, M. and M. den Elzen. 2001. ‘Options for differentiation of future commitments
in climate policy: how to realise timely participation to meet stringent climate goals?’.
Climate Policy 1:465-480.
Bode, S. 2004. ‘Equal emissions per capita over time - a proposal to combine
responsibility and equity of rights for post-2012 GHG emission entitlement
allocation’. European Environment 14: 300-316.
Broecker, W. 2009. ‘CO2 Arithmetic’. Science 315: 1371.

20
Brown, S., D. Donovan, B. Fisher, K. Hanslow, M. Hinchy, M. Matthewson, C.
Polidano, V. Tulpulé and S. Wear. 1997. The Economic Impact of International
Climate Change Policy. ABARE Research Report 97.4. Canberra: Commonwealth of
Australia.
Brown, S., D. Kennedy, C. Polidano, K. Woffenden, G. Jakeman, B. Graham, F. Jotzo
and B. Fisher. 1999. Economic Impacts of the Kyoto Protocol: Accounting for the
three major greenhouse gases. ABARE Research Report 99.6. Canberra:
Commonwealth of Australia.
Chakravarty, S., A. Chikkatur, H. de Coninck, S. Pacala, R. Socolow. 2009. ‘Sharing
global CO2 emission reductions among one billion high emitters’. Proceedings of the
National Academy of Sciences (PNAS) 106:11884-11888.
Climate Change Authority. 2013. Caps and Targets Review: Issues Paper. Canberra:
Commonwealth of Australia.
Costa, M. 2003. ‘Natural Resources Commission Bill, Native Vegetation Bill,
Catchment Management Authorities Bill — Legislative Council Second Reading
Speech’. In NSW Hansard Legislative Council, 4 December. Sydney: NSW
Parliament.
Department of Climate Change and Energy Efficiency. 2012a. Australia’s Emissions
Projections 2012. Canberra: Commonwealth of Australia.
Department of Climate Change and Energy Efficiency 2012b. Australian National
Greenhouse Accounts — Quarterly Update of Australia’s National Greenhouse Gas
Inventory: September Quarter 2011. Canberra: Commonwealth of Australia.
Department of Industry, Innovation, Climate Change, Science, Research and Tertiary
Education [DIICCSRTE]. 2013a. Australian Greenhouse Emissions Information
System (AGEIS). URL: <http://ageis.climatechange.gov.au/> Consulted 30 May 2013.
Department of Industry, Innovation, Climate Change, Science, Research and Tertiary
Education [DIICCSRTE]. 2013b. Australian National Greenhouse Accounts –
National Inventory Report 2011. Canberra: Commonwealth of Australia.
Ekardt, F. and A. von Hövel. 2009. ‘Distributive Justice, Competitiveness, and
Transnational Climate Protection: “One Human - One Emission Right”’. Carbon and
Climate Law Review 3(1):102-113.
Environment Canada. 2012. National Inventory Report 1990-2010. Ottawa: Canadian
Government.
Fluerbaey, M. 2009. ‘Beyond GDP: The Quest for a Measure of Social Welfare’.
Journal of Economic Literature 47(4):1029-1075.
Garnaut, R. 2008. The Garnaut Climate Change Review. Cambridge: Cambridge
University Press.

21
Germain, M. and V. van Steenberghe. 2003. ‘Constraining Equitable Allocations of
Tradable CO2 Emission Quotas by Acceptability’. Environmental and Resource
Economics 26:469–492.
Gupta, S. and P. Bhandari. 1999. ‘An effective allocation criterion for CO2 emissions
– an application to tradeable permits’. Energy Policy 27(12): 727-736.
Gupta, S., D. Tirpak, N. Burger, J. Gupta, N. Höhne, A. Boncheva, G. Kanoan, C.
Kolstad, J. Kruger, A. Michaelowa, S. Murase, J. Pershing, T. Saijo and A. Sari. 2007.
‘2007: Policies, Instruments and Co-operative Arrangements’. In Climate Change
2007: Mitigation. Contribution of Working Group III to the Fourth Assessment
Report of the Intergovernmental Panel on Climate Change, eds B. Metz, R. Davidson,
P. Bosch, R. Dave, L. Meyer. Cambridge: Cambridge University Press.
Höhne, N., M. den Elzen and M. Weiss. 2006. ‘Common but differentiated
convergence (CDC): a new conceptual approach to long-term climate policy’. Climate
Policy 6:181-199.
Jacoby, H., R. Prinn and R. Schmalensee. 1998. ‘Kyoto’s Unfinished Business’.
Foreign Affairs 77(4):54-66.
Kingwell, R. and A. Fuchsbichler. 2011. ‘The whole-farm benefits of controlled
traffic farming: An Australian appraisal’. Agricultural Systems 104:513-521.
Knowles, C. 2003. ‘Natural Resources Commission Bill, Native Vegetation Bill,
Catchment Management Authorities Bill — Legislative Assembly Second Reading
Speech’. In NSW Hansard Legislative Assembly, 12 November. Sydney: NSW
Parliament.
Lecocq, F. and R. Crassous. 2003. International climate regime beyond 2012 – Are
quota allocation rules robust to uncertainty? Washington DC: World Bank.
Llewellyn, R. and F. D’Emden. 2009. Adoption of no-till cropping practices in
Australian grain growing regions. Canberra: Grains Research and Development
Corporation.
Macintosh, A. 2010. Reducing emissions from deforestation and forest degradation in
developing countries: A cautionary tale from Australia. Canberra: The Australia
Institute.
Macintosh, A. 2011a. Potential carbon credits from reducing native forest harvesting
in Australia. CCLP Working Paper Series 2011/1. Canberra: Australian National
University Centre for Climate Law & Policy.
Macintosh, A. 2011b. ‘Are forest management reference levels incompatible with
robust climate outcomes? A case study on Australia’. Carbon Management 2(6):691-
707.
Macintosh, A. 2011c. Durban Climate Conference and Australia’s Abatement Task.
CCLP Working Paper Series 2011/2. Canberra: Australian National University Centre
for Climate Law & Policy.

22
Macintosh, A. 2012a. ‘LULUCF in the post-2012 regime: fixing the problems of the
past?’. Climate Policy 12:341-355.
Macintosh, A. 2012b. ‘The Australia clause and REDD: a cautionary tale’. Climatic
Change 112(2):169-188.
Macintosh, A. 2013. The Australian native forest sector: causes of the decline and
prospects for the future. Canberra: The Australia Institute.
McCloskey, D. 1990. ‘Storytelling in Economics’. In Narrative in Culture: The Uses
of Storytelling in the Sciences, Philosophy, and Literature, ed C. Nash. London:
Routledge.
McCloskey, D. 1992. ‘The Art of Forecasting: From Ancient to Modern Times’. Cato
Journal 12(1):23-43.
McKibbin, W. 2002. Modelling Results for the Kyoto Protocol: Report to the
Australian Greenhouse Office. Canberra: Commonwealth of Australia.
Meyer, A. 2004. ‘Briefing: Contraction and convergence’. Proceedings of the ICE -
Engineering Sustainability 157(4):189-192.
Müller, B., N. Höhne and C. Ellermann. 2010. ‘Differentiating (historic)
responsibilities for climate change’. Climate Policy 9:593-611.
Oberheitmann, A. 2010. A new post-Kyoto climate regime based on per-capita
cumulative CO2-emission rights—rationale, architecture and quantitative assessment
of the implication for the CO2-emissions from China, India and the Annex-I countries
by 2050’. Mitigation and Adaptation Strategies for Global Change 15(2):137-168.
Plantation 2020 Vision Implementation Committee. 1997. Plantations for Australia:
The 2020 Vision. Canberra: Commonwealth of Australia.
Ringius, L., A. Torvanger and B. Holtsmark. 1998. ‘Can multi-criteria rules fairly
distribute climate burdens? – OECD results from three burden sharing rules’. Energy
Policy 26(10):777-793.
Rose, A., B. Stevens, J. Edmonds and M. Wise. 1998. ‘International Equity and
Differentiation in Global Warming Policy’. Environmental and Resource Economics
12:25-51.
Senate Rural and Regional Affairs and Transport References Committee. 2003.
Australian forest plantations. A review of Plantations for Australia: The 2020 Vision.
Canberra: Commonwealth of Australia.
Tol, R. and R. Verheyen. 2004. ‘State responsibility and compensation for climate
change damages—a legal and economic assessment’. Energy Policy 32:1109-1130.
Tullberg, J., D. Yule and D. McGarry. 2007. ‘Controlled traffic farming – from
research to adoption in Australia’. Soil & Tillage Research 97:272-281.

23
United Nations Framework Convention on Climate Change [UNFCCC Secretariat].
2012. Report of the Ad Hoc Working Group on Further Commitments for Annex I
Parties under the Kyoto Protocol. Outcome of the work of the Ad Hoc Working Group
on Further Commitments for Annex I Parties under the Kyoto Protocol. Bonn,
Germany: UNFCCC Secretariat.

24
ANU Centre for Climate Law and Policy ANU College of Law The Australian National University Canberra ACT 0200 Ph: 61 2 6125 3832 http://law.anu.edu.au/CCLP/