Embed Size (px)
Citation preview

Mix Modeling at Coca-Cola
Ram Krishnamurthy
Group Director Marketing Strategy & Insights
Predictive Analytics World
Oct 21, 2009
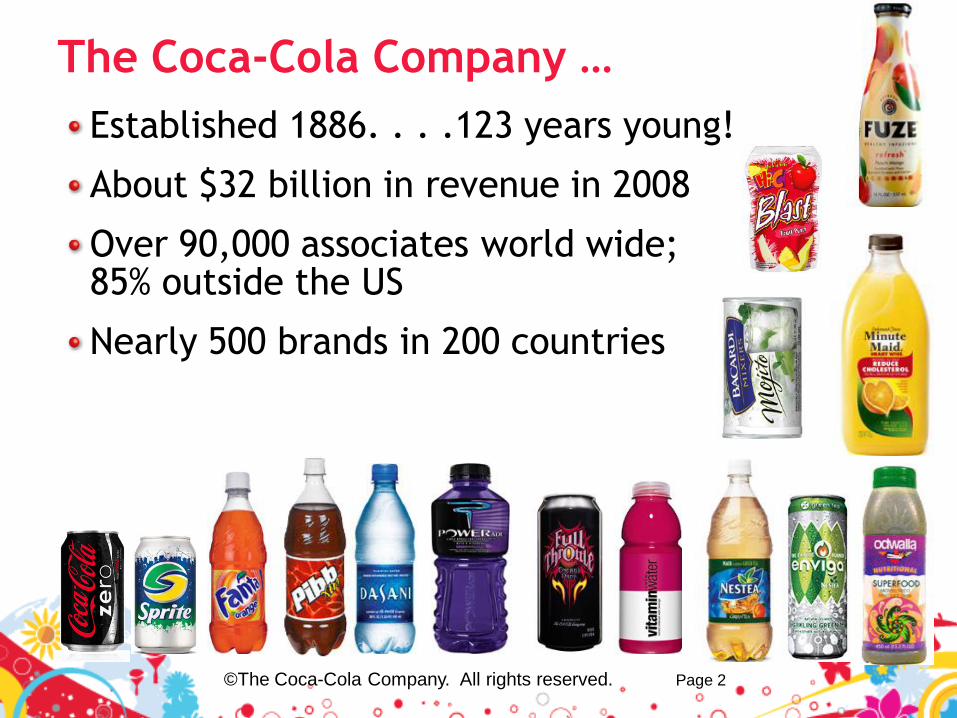
The Coca-Cola Company …
Established 1886. . . .123 years young!
About $32 billion in revenue in 2008
Over 90,000 associates world wide; 85% outside the US
Nearly 500 brands in 200 countries
©The Coca-Cola Company. All rights reserved. Page 2

And some more of our brands outside the US..
©The Coca-Cola Company. All rights reserved. Page 3
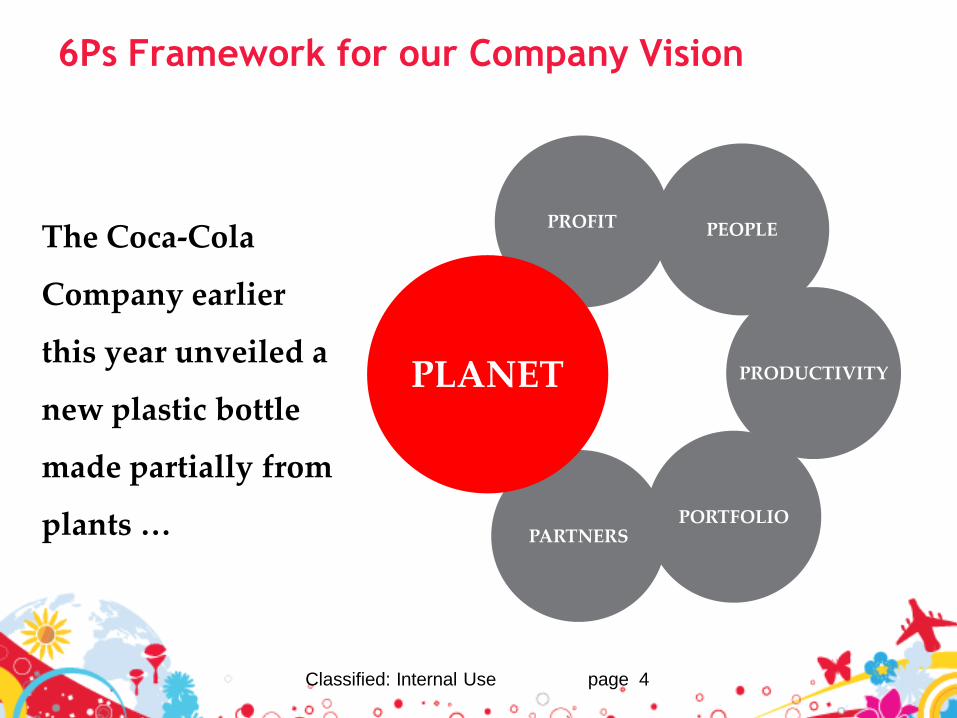
6Ps Framework for our Company Vision
Classified: Internal Use page 4
PROFIT
PRODUCTIVITY
PARTNERS
PEOPLE
PLANET
PORTFOLIO
The Coca-Cola
Company earlier
this year unveiled a
new plastic bottle
made partially from
plants …
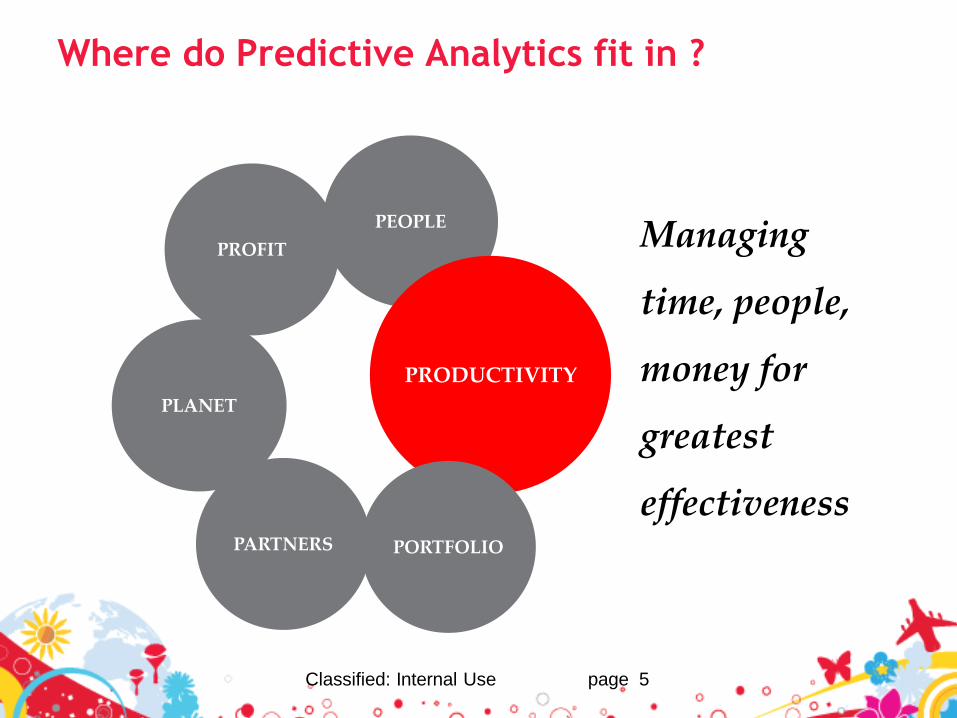
Where do Predictive Analytics fit in ?
Classified: Internal Use page 5
PROFIT
PLANET
PARTNERS
PEOPLE
PRODUCTIVITY
PORTFOLIO
Managing
time, people,
money for
greatest
effectiveness
©The Coca-Cola Company. All rights reserved. Page 6
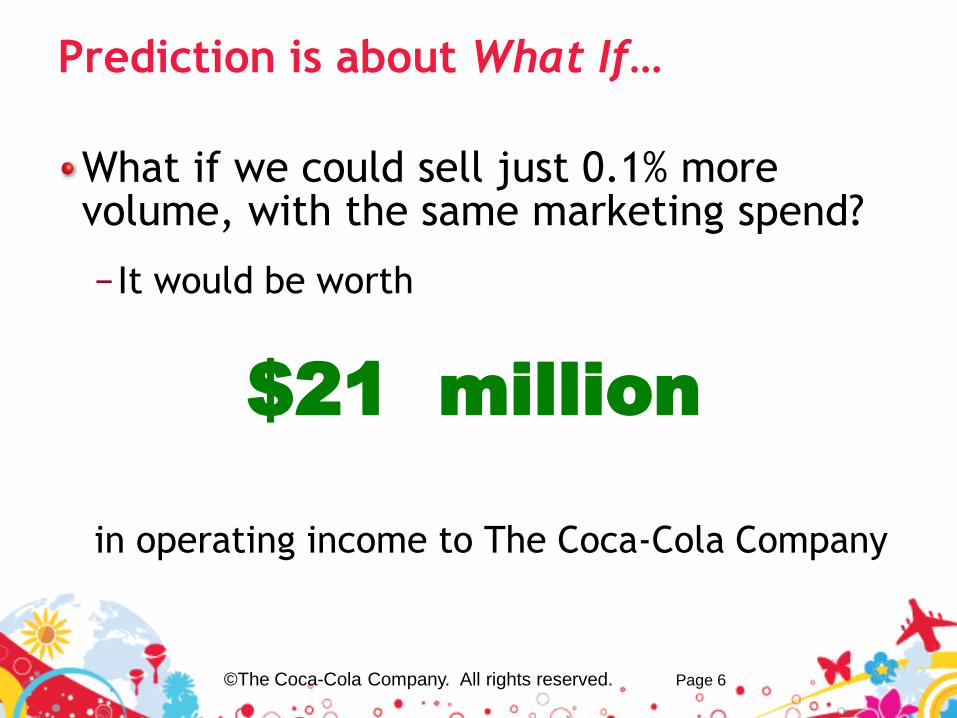
Prediction is about What If…
What if we could sell just 0.1% more volume, with the same marketing spend?
− It would be worth
in operating income to The Coca-Cola Company
$21 million
©The Coca-Cola Company. All rights reserved. Page 7
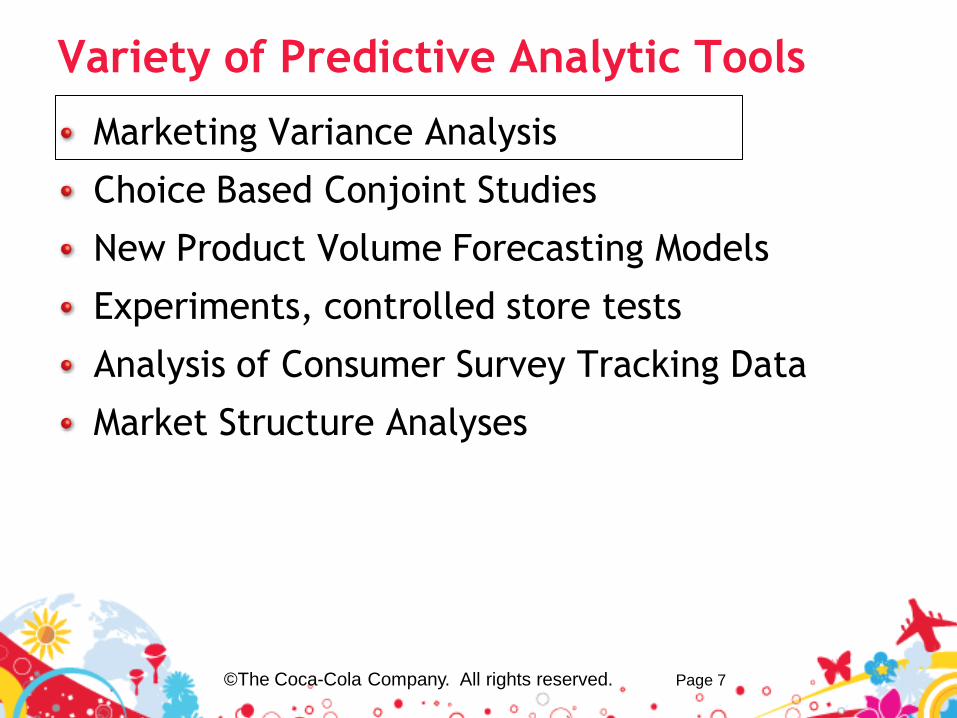
Variety of Predictive Analytic Tools
Marketing Variance Analysis
Choice Based Conjoint Studies
New Product Volume Forecasting Models
Experiments, controlled store tests
Analysis of Consumer Survey Tracking Data
Market Structure Analyses
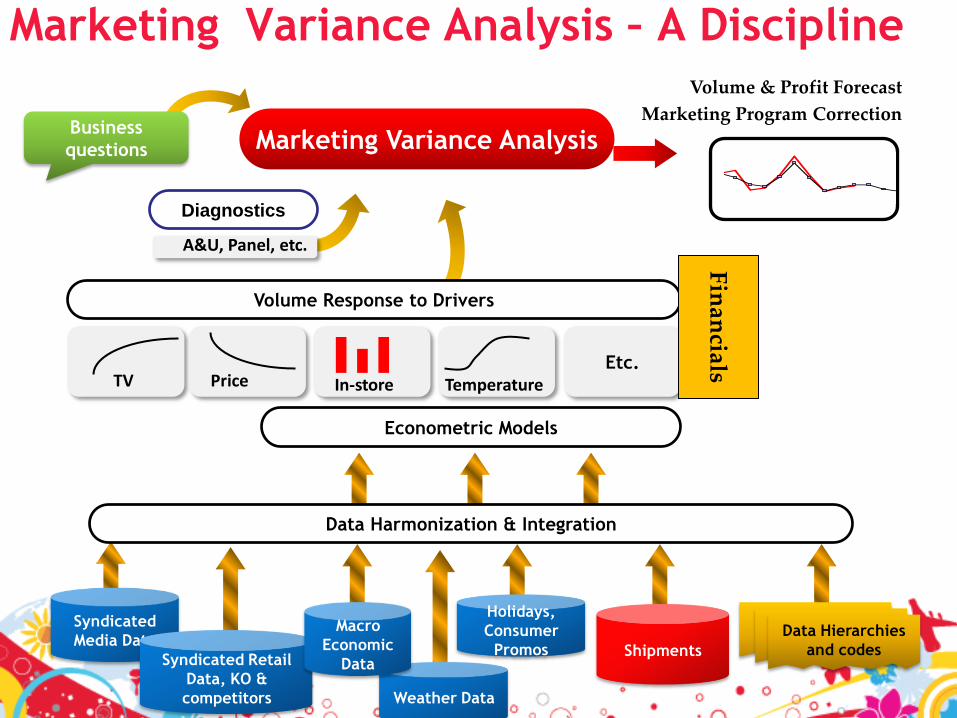
Marketing Variance Analysis – A Discipline
Etc.
Econometric Models
Syndicated
Media Data
Syndicated Retail
Data, KO &
competitors Weather Data
Shipments
Data Hierarchies
and codes
Macro
Economic
Data
Volume & Profit Forecast
Marketing Program Correction
Marketing Variance Analysis
Volume Response to Drivers
TV Price In-store Temperature
Holidays,
Consumer
Promos
Data Harmonization & Integration
Diagnostics
A&U, Panel, etc.
Business
questions
Fin
ancials

MVA in the larger context
Forecasting
ExecutingDebriefing
Planning
Business Plan
CentricVolume & OI
Objectives

MVA Competencies
PeopleProcess:
Management
RoutinesModels
Actual vs Predicted
Log(Vol) = β1 + β2*log(price) + …
DataSoftware
For Scenario Planning
Greater
Returns On
Marketing
InvestmenTs

©The Coca-Cola Company. All rights reserved. Page 11
Modeling Approaches
Suppliers: short list of strategic partners
Statistical methods:
− Tried : Neural Networks, Systems Dynamics, MCI
− Commonly used : Regression and regression like techniques
− Today’s favorite: Bayesian
Critical need to incorporate prior learning
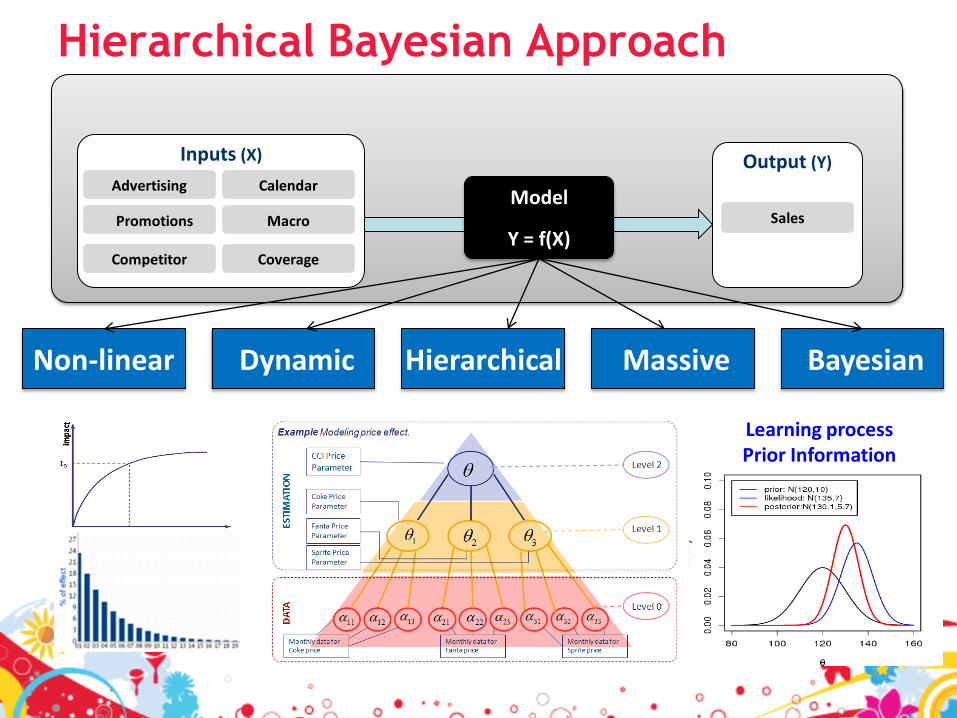
Non-linear Dynamic Hierarchical Massive
Inputs (X)
Advertising Calendar
Promotions
CoverageCompetitor
Output (Y)
SalesMacro
Model
Y = f(X)
Hierarchical Bayesian Approach
Learning processPrior Information
Bayesian
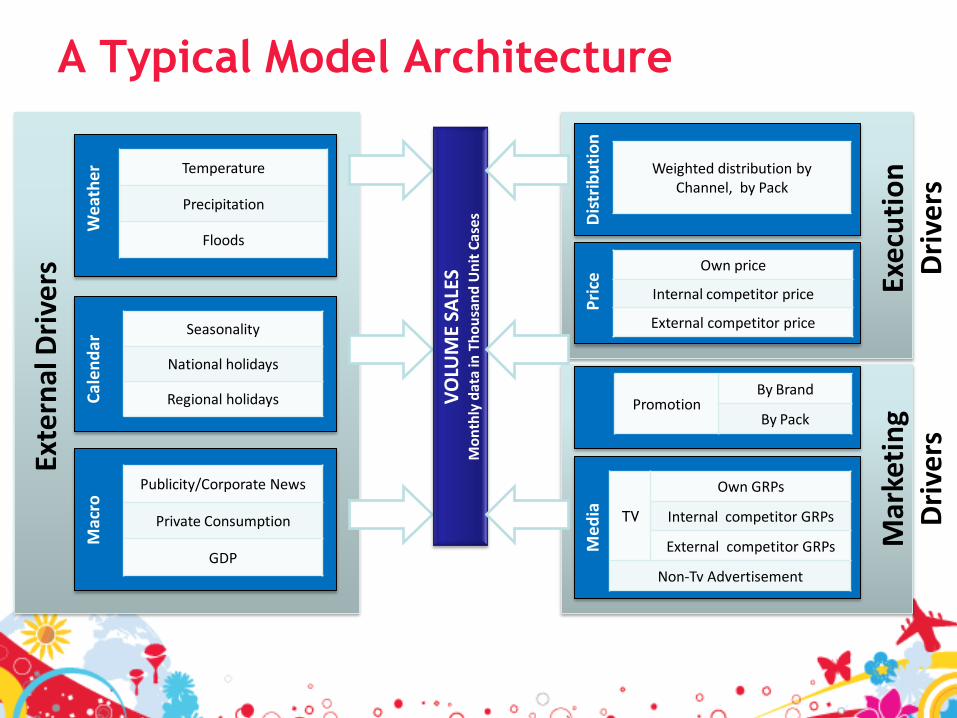
Seasonality
National holidays
Regional holidays
A Typical Model ArchitectureC
ale
nd
ar
Temperature
Precipitation
Floods
We
ath
er
Publicity/Corporate News
Private Consumption
GDP
Mac
ro
Weighted distribution by Channel, by Pack
Dis
trib
uti
on
Own price
Internal competitor price
External competitor price
Pri
ce
VO
LUM
E SA
LES
Mo
nth
ly d
ata
in T
ho
usa
nd
Un
it C
ase
s
TV
Own GRPs
Internal competitor GRPs
External competitor GRPs
Non-Tv AdvertisementM
ed
ia
Mar
keti
ng
Dri
versEx
tern
al D
rive
rs Exec
uti
on
D
rive
rs
PromotionBy Brand
By Pack

Some Standard ROI Analytics to Support Business Processes
©The Coca-Cola Company. All rights reserved. Page 14
ROI of Alternative Plans
A B C D E
Executing
ForecastingPlanning
Debriefing
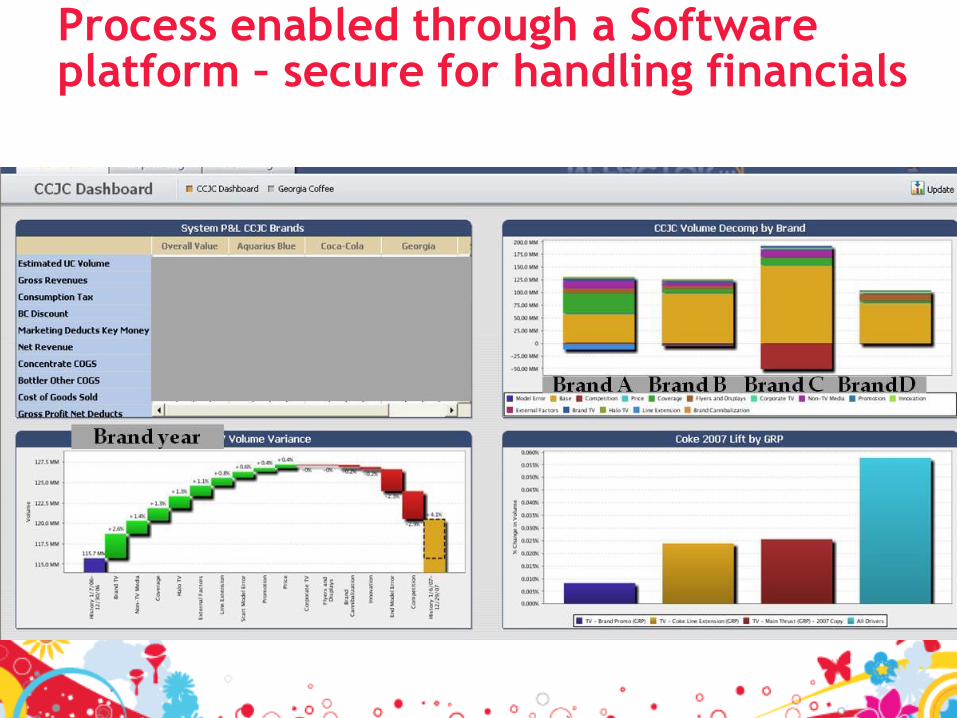
Process enabled through a Software platform – secure for handling financials

A Couple of Illustrations of MVA in Action..
How do I spend my next dollar ?
Models for Learning
©The Coca-Cola Company. All rights reserved. Page 16

A Couple of Illustrations of MVA in Action..
How do I spend my next dollar ?
Models for Learning
©The Coca-Cola Company. All rights reserved. Page 17

Marketing Spend
Lo
ca
l C
urr
en
cy
BC
Un
it C
as
es
(m
il)
Brand
Contribution
Volume,
Revenue
BC Max
How do I spend my next one dollar ?
Continue to Invest in this zone
Review Investment in
This Zone
Q : How do we get our Brand to stay in this zone ?
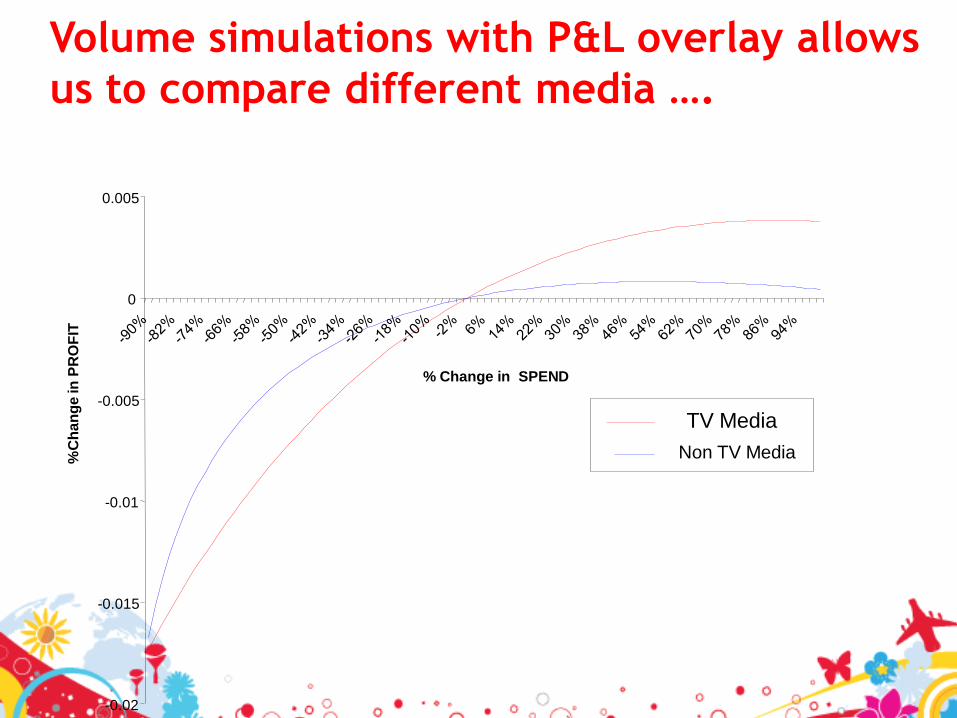
Volume simulations with P&L overlay allows
us to compare different media ….
-0.02
-0.015
-0.01
-0.005
0
0.005
% Change in SPEND
%C
ha
ng
e in
PR
OF
IT
TV Media
Non TV Media

…And Allocate The Next Media Dollar Across Brands..
©The Coca-Cola Company. All rights reserved. Page 20
Current GRP Levels
GRPs
Br 1 Br 2 Br 3Br 4 Br 5 Br 6
Incr
em
en
tal V
olu
me
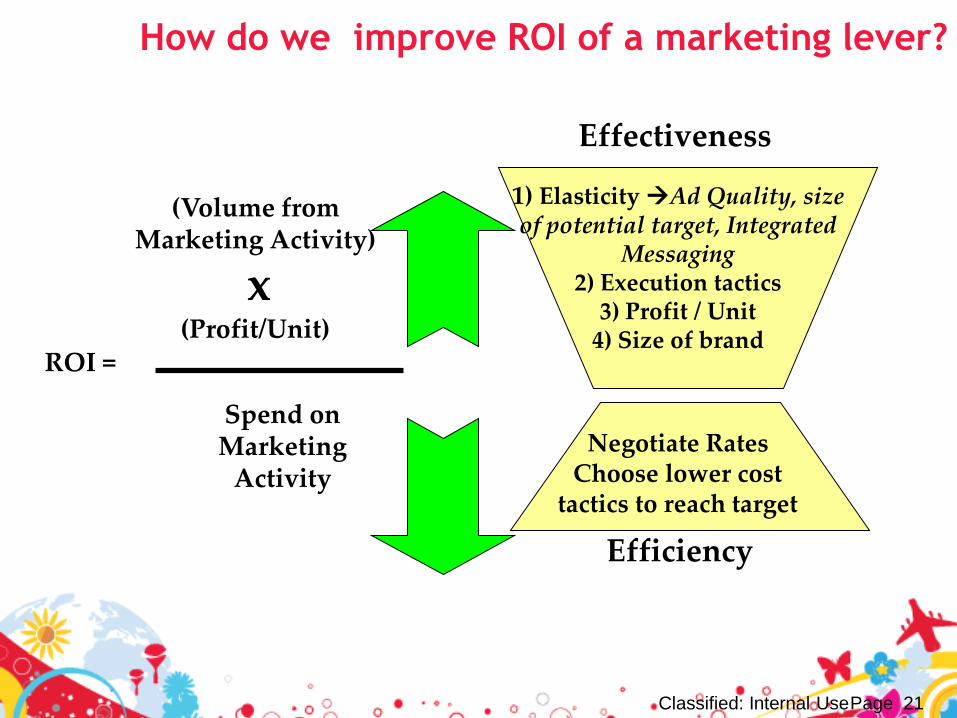
How do we improve ROI of a marketing lever?
(Volume from Marketing Activity)
x(Profit/Unit)
Spend on Marketing
Activity
ROI =
Efficiency
Effectiveness
1) Elasticity Ad Quality, size of potential target, Integrated
Messaging2) Execution tactics
3) Profit / Unit4) Size of brand
Negotiate RatesChoose lower cost
tactics to reach target
Classified: Internal UsePage 21

© 2008 The Coca-Cola Company. All rights reserved. Page 22
Optimize to grow volume 1.4%
Portfolio Volume Scenarios
100.0
101.4
-0.28
1.34
0.33
Base Case cut X mil
from Lever 1
Optimize
Lever2
Add X mil to
Lever 3 &
optimize
End result

© 2008 The Coca-Cola Company. All rights reserved. Page 23
. . . And profit grows by 2.5%
Portfolio System Brand Profit
102.5
100
0.03
2.50
- -
Base Case cut X mil
from Lever 1
Optimize
Lever 2
Add X mil to
Lever 3 &
optimize
End result

100,0 100,2
0,80 -0.56
2008 Base Case 1% Price Reduction
Cut Media $X End result
Vo
lum
e In
dex
Country X Case Study: should we reduce media to fund a price cut?
Volume
100,0
99,4
-0.46
-0.12
2008 Base Case 1% Price Reduction
Cut Media $X End result
Pro
fit
Ind
ex
Profit
© 2008 The Coca-Cola Company. All rights reserved. Page 24

A Couple of Illustrations of MVA in Action..
How do I spend my next dollar ?
Models for Learning
©The Coca-Cola Company. All rights reserved. Page 25

Models for Learning
©The Coca-Cola Company. All rights reserved. Page 26
Metrics Models
PredictedOutcome
PlanInvestment

Mental vs Formal Models
©The Coca-Cola Company. All rights reserved. Page 27
MentalModels
FormalModels
How does it work in real life ?What drives consumer behavior ?
How do we quantify this ?What should go into the equation ?
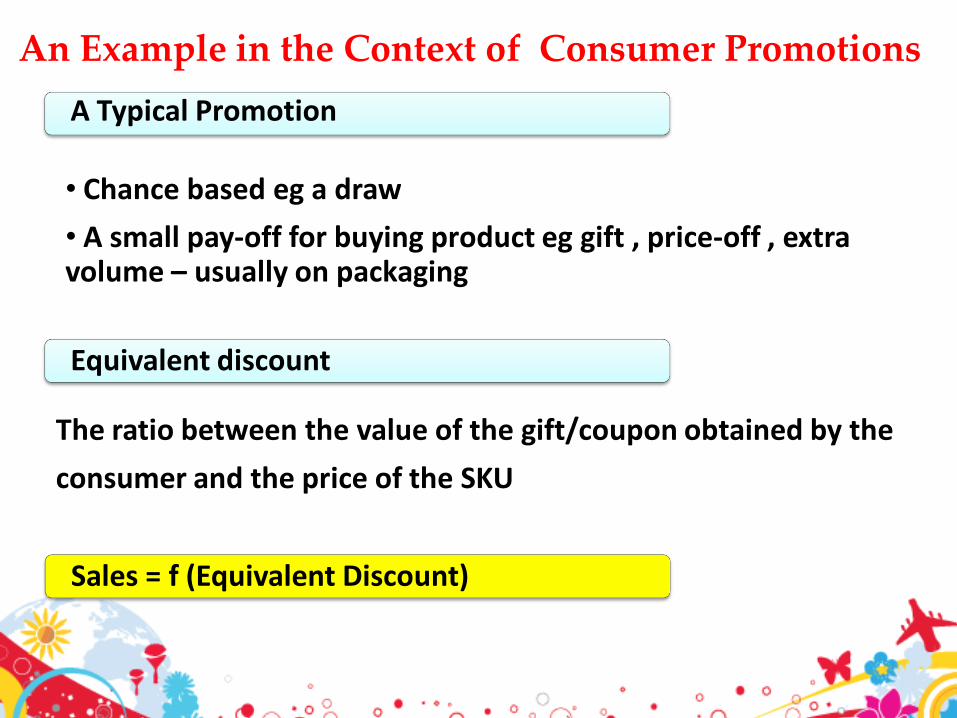
An Example in the Context of Consumer Promotions
The ratio between the value of the gift/coupon obtained by the
consumer and the price of the SKU
Equivalent discount
A Typical Promotion
• Chance based eg a draw
• A small pay-off for buying product eg gift , price-off , extra volume – usually on packaging
Sales = f (Equivalent Discount)
©The Coca-Cola Company. All rights reserved. Page 29
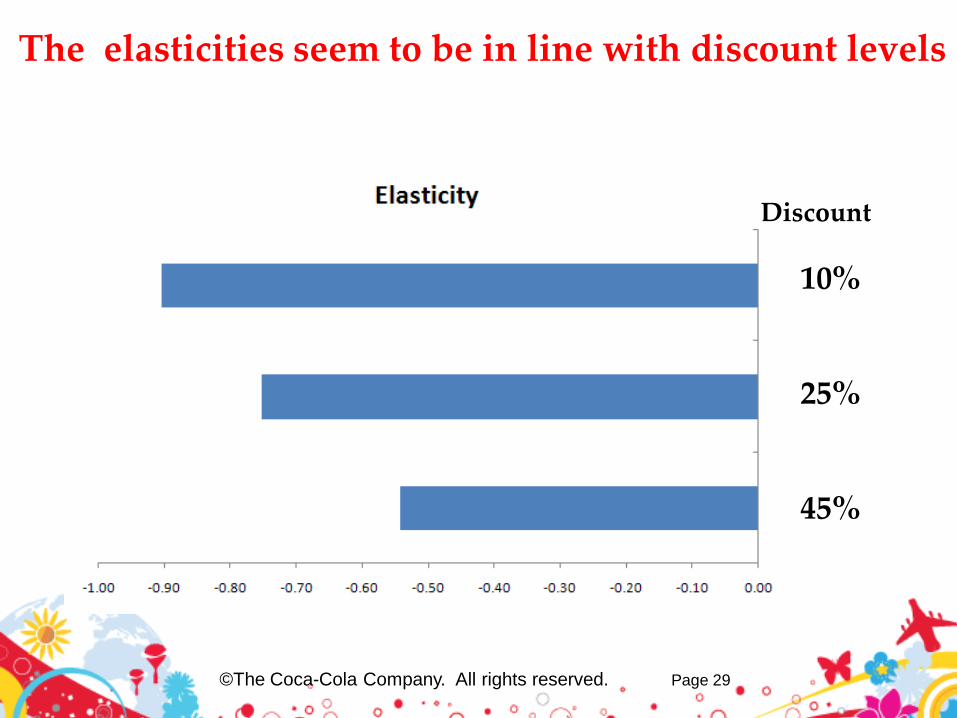
10%
25%
45%
Discount
The elasticities seem to be in line with discount levels

©The Coca-Cola Company. All rights reserved. Page 30
Discount45% 25% 10%
Volume Lift is okay – but high standard deviation suggests Discount may not explain all of the Lift..
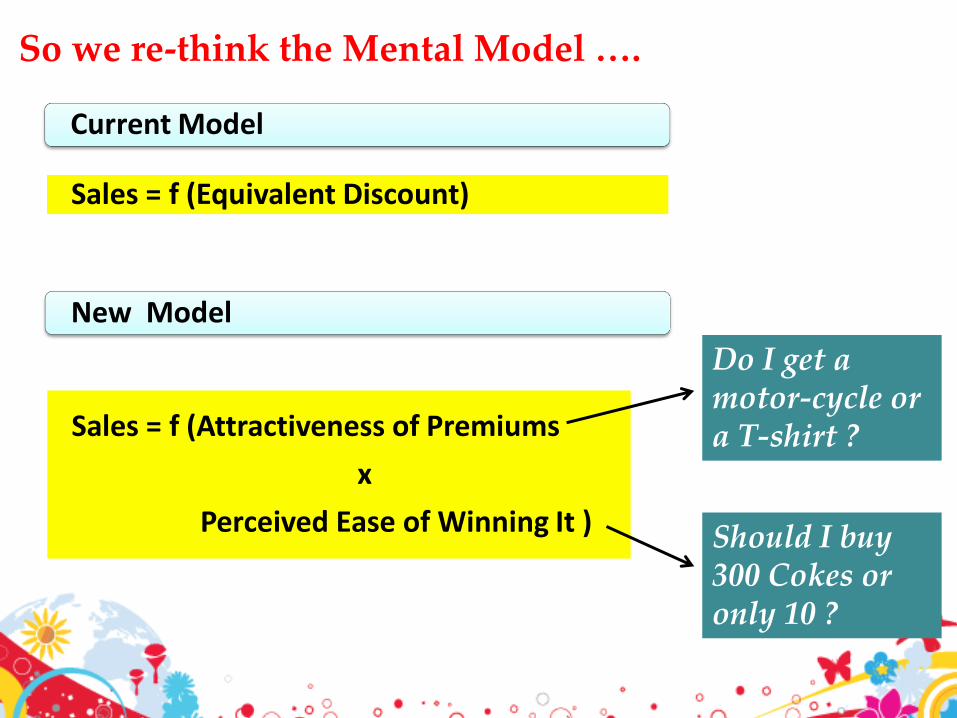
So we re-think the Mental Model ….
Current Model
Sales = f (Equivalent Discount)
New Model
Sales = f (Attractiveness of Premiums
x
Perceived Ease of Winning It )
Do I get a motor-cycle or a T-shirt ?
Should I buy 300 Cokes or only 10 ?

Models for Learning
©The Coca-Cola Company. All rights reserved. Page 32
Metrics from Consumer
SurveysModels
PredictedOutcome
PlanInvestment
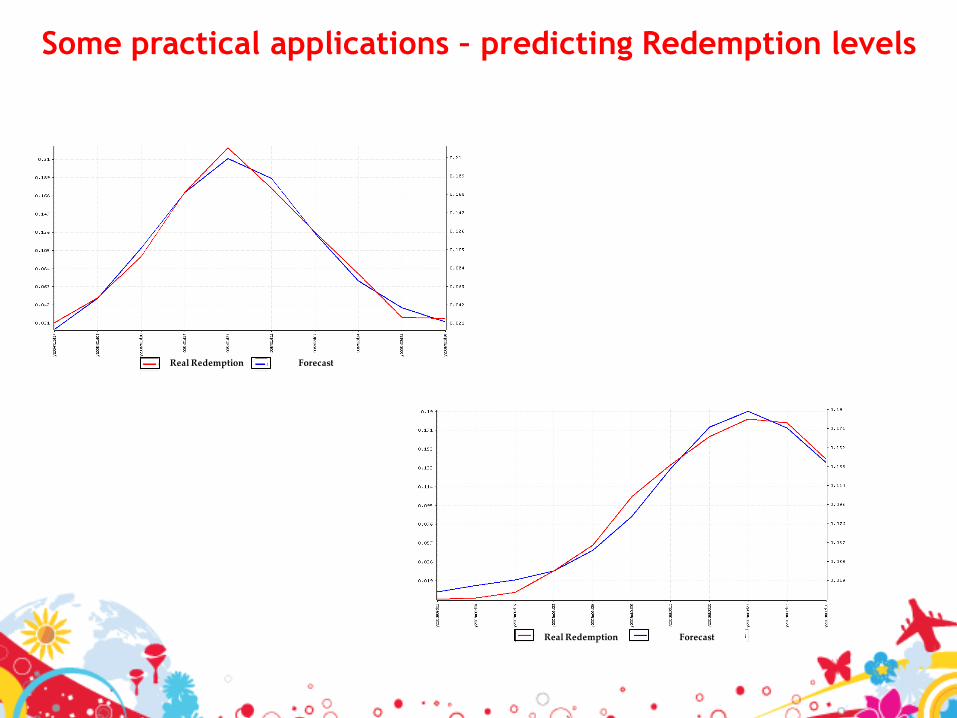
Real Redemption Forecast
Real Redemption Forecast
Some practical applications – predicting Redemption levels
©The Coca-Cola Company. All rights reserved. Page 34
“Don’t try to predict the future…make it
happen !”

©The Coca-Cola Company. All rights reserved. Page 35
Questions?


![Analisis Del Mix de Marketing Para Coca Cola[1]](https://img.pdfslide.net/doc/110x75/557201314979599169a0f9d6/analisis-del-mix-de-marketing-para-coca-cola1.jpg)