Embed Size (px)
Citation preview
1
Mixed General MeetingApril 29, 2005
2
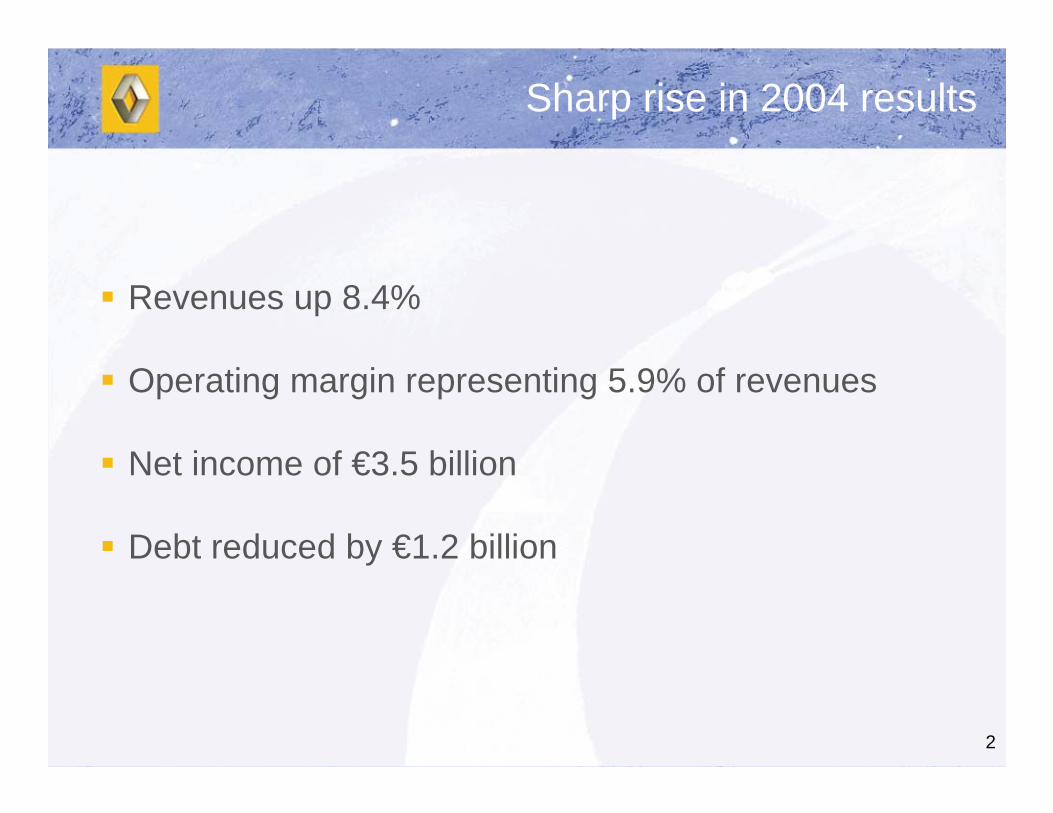
Sharp rise in 2004 results
! Revenues up 8.4%
! Operating margin representing 5.9% of revenues
! Net income of €3.5 billion
! Debt reduced by €1.2 billion
3
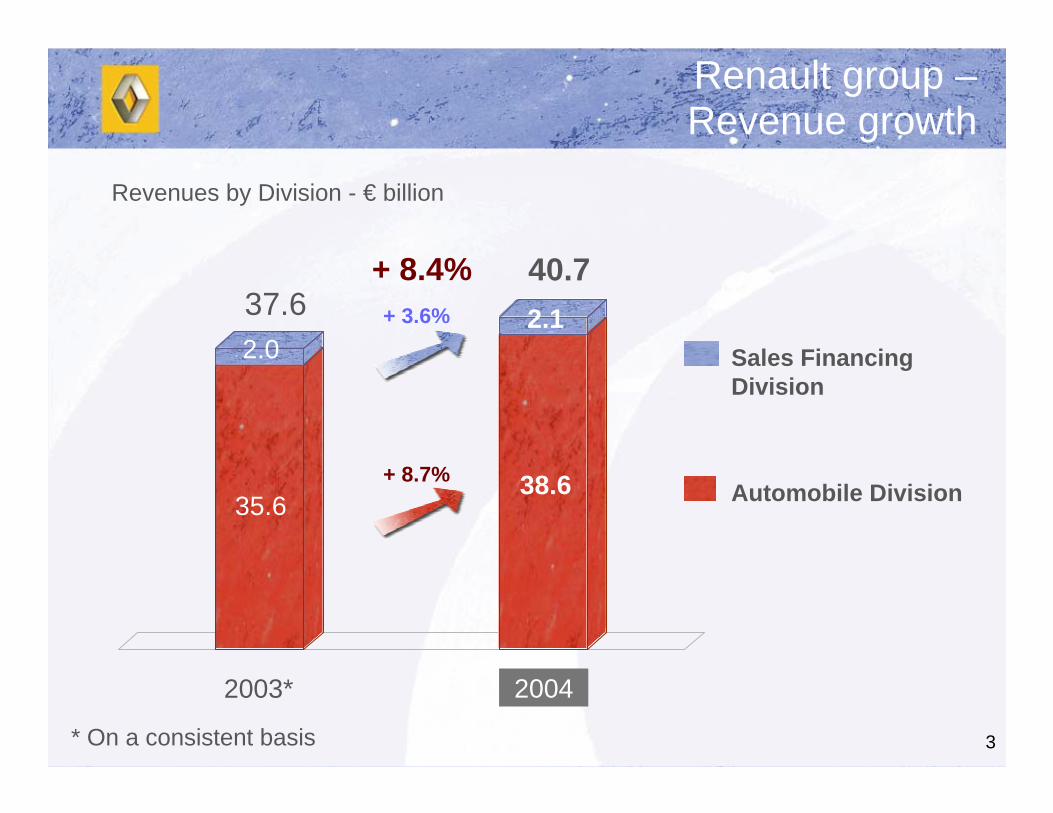
Renault group –Revenue growth
* On a consistent basis
35.6
2.02.1
Revenues by Division - € billion
37.640.7+ 8.4%
38.6
20042003*
Sales FinancingDivision
Automobile Division
+ 3.6%
+ 8.7%
4
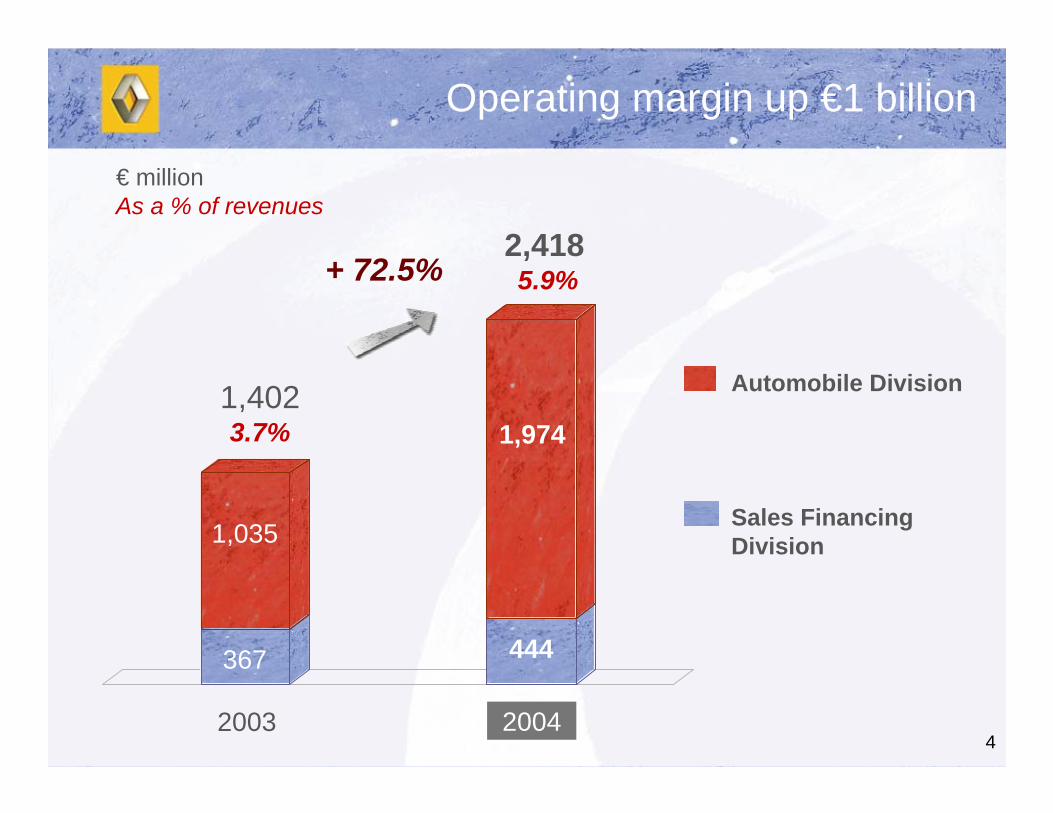
1,035
367
1,974
444
€ millionAs a % of revenues
Operating margin up €1 billion
Sales FinancingDivision
Automobile Division
20042003
+ 72.5%2,4185.9%
1,4023.7%
5
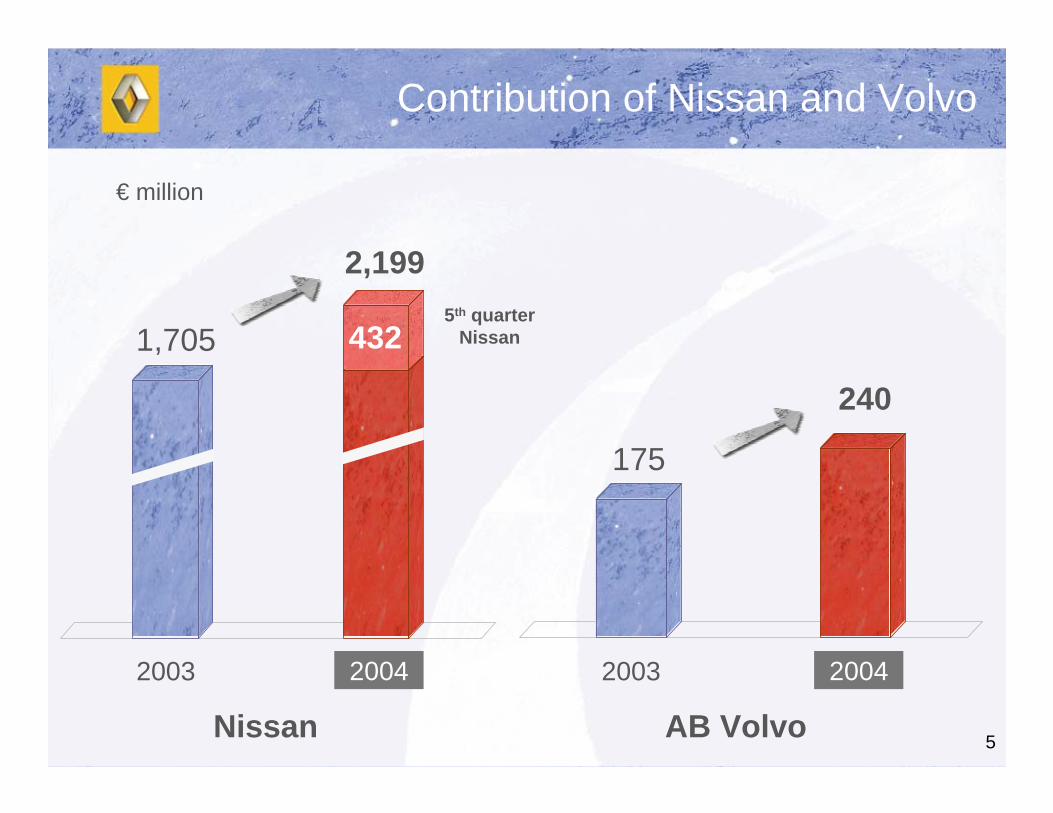
Contribution of Nissan and Volvo
1,705
2,199
175
240
Nissan AB Volvo
5th quarter Nissan432
2004200320042003
€ million
6
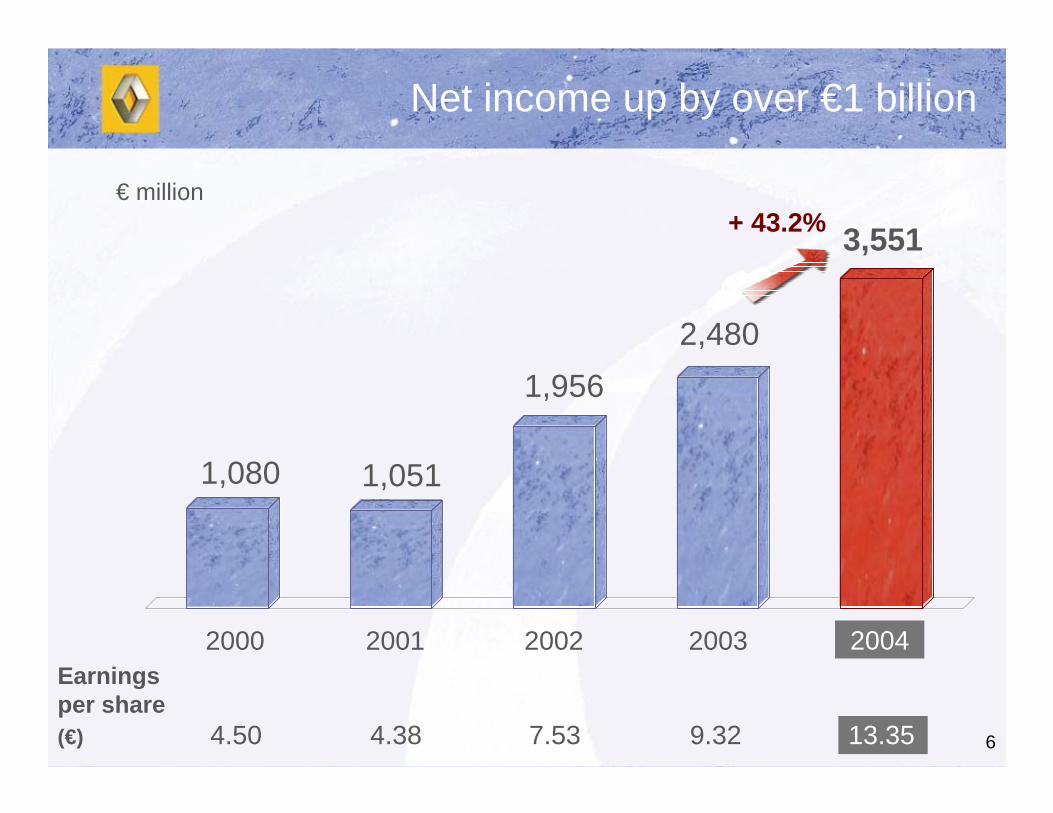
1,9562,480
1,080 1,051
Earningsper share(€) 4.50 4.38 7.53 9.32 13.35
+ 43.2% 3,551
Net income up by over €1 billion
20042003200220012000
€ million
7
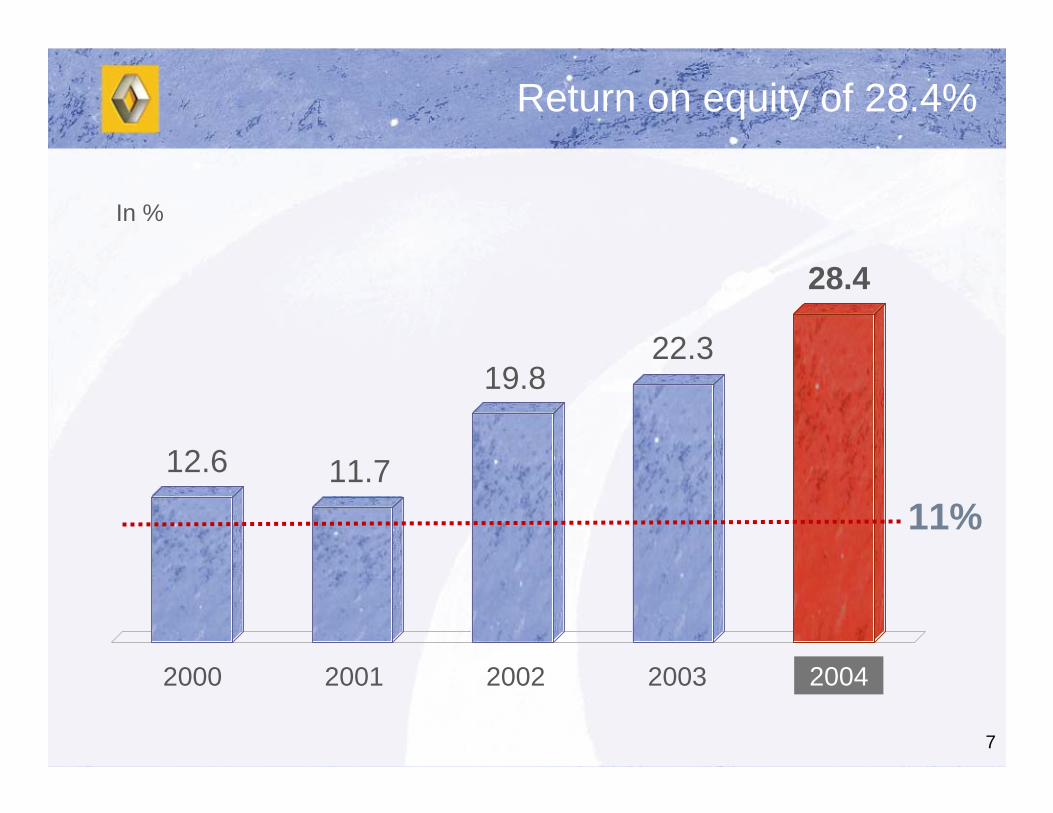
19.8
11.712.6
22.3
11%
28.4
Return on equity of 28.4%
In %
20042003200220012000
8
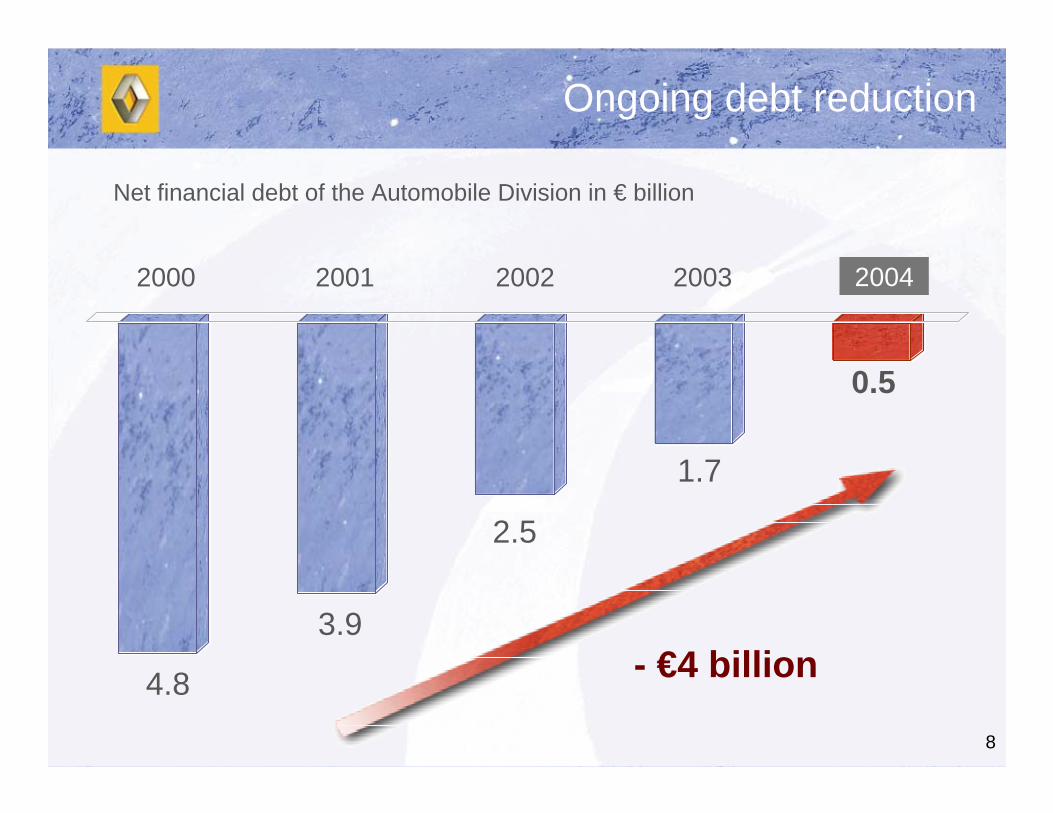
Net financial debt of the Automobile Division in € billion
2.5
1.7
4.8
0.5
Ongoing debt reduction
20042003200220012000
3.9- €4 billion
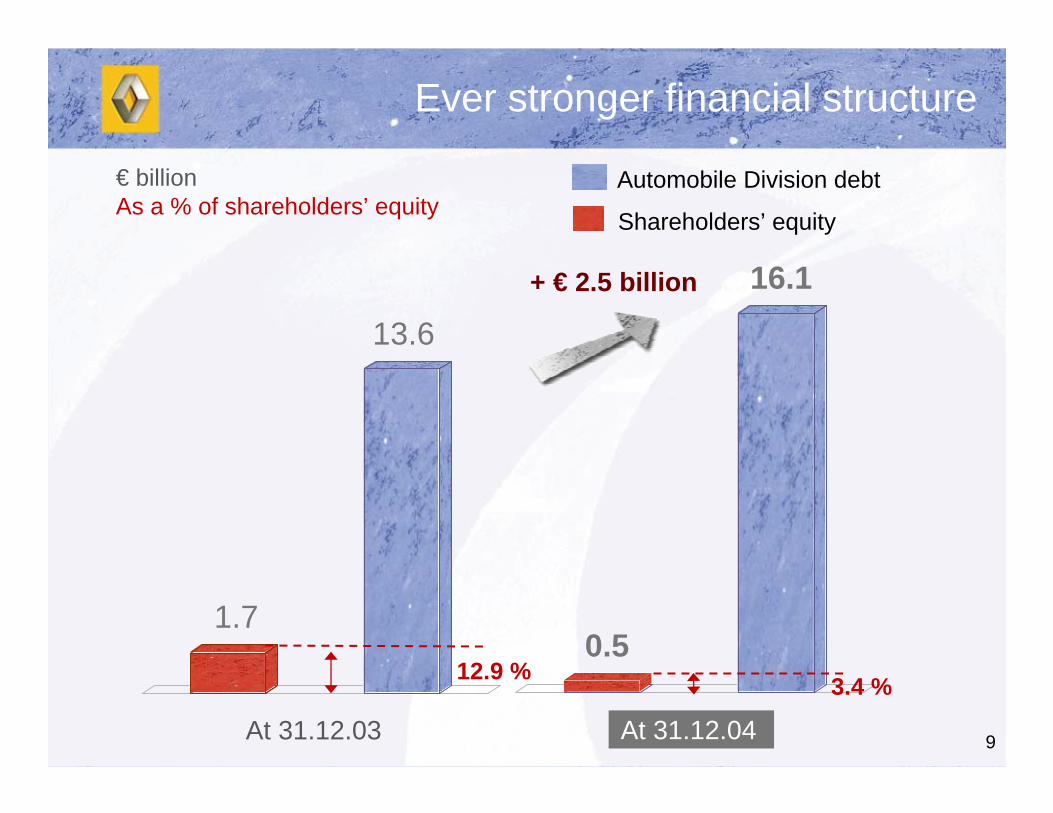
9At 31.12.03
13.6
16.1
1.70.5
12.9 %
Automobile Division debt
Shareholders’ equity
€ billionAs a % of shareholders’ equity
+ € 2.5 billion
Ever stronger financial structure
At 31.12.04
3.4 %
10
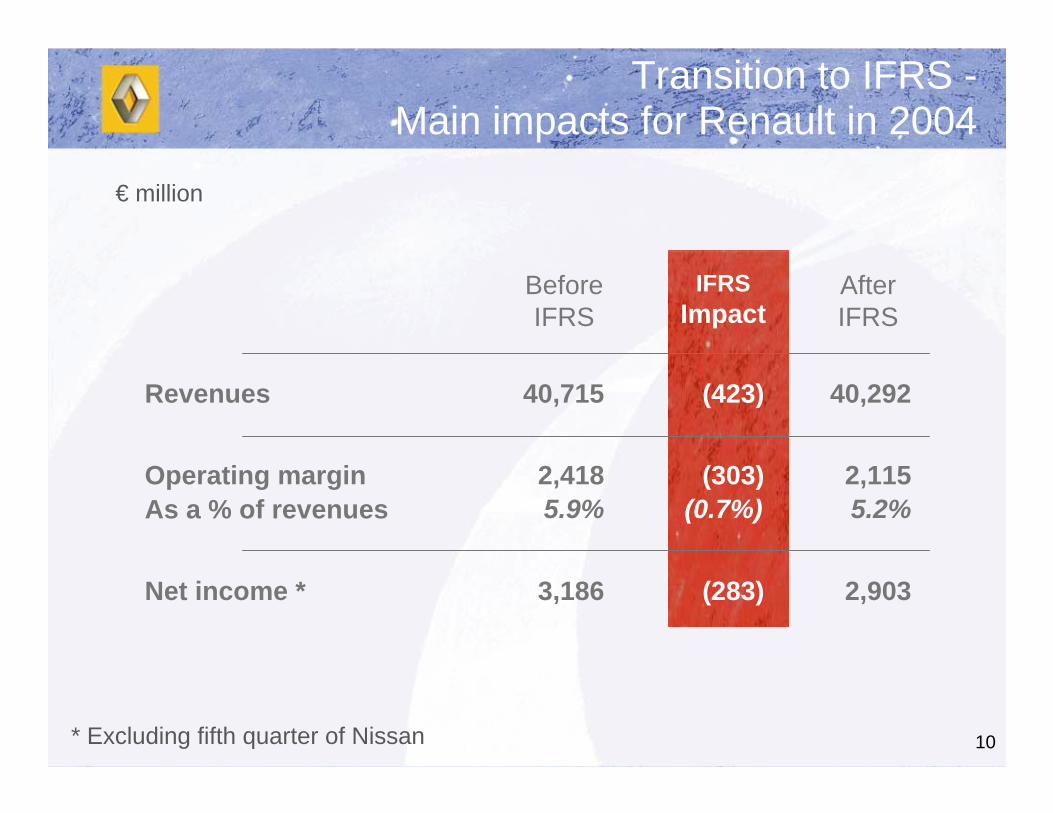
Transition to IFRS -Main impacts for Renault in 2004
IFRSImpact
BeforeIFRS
After IFRS
€ million
(423)40,715 40,292Revenues
(283)3,186 2,903Net income *
* Excluding fifth quarter of Nissan
5.2%5.9%As a % of revenues(303)2,418 2,115Operating margin
(0.7%)
11
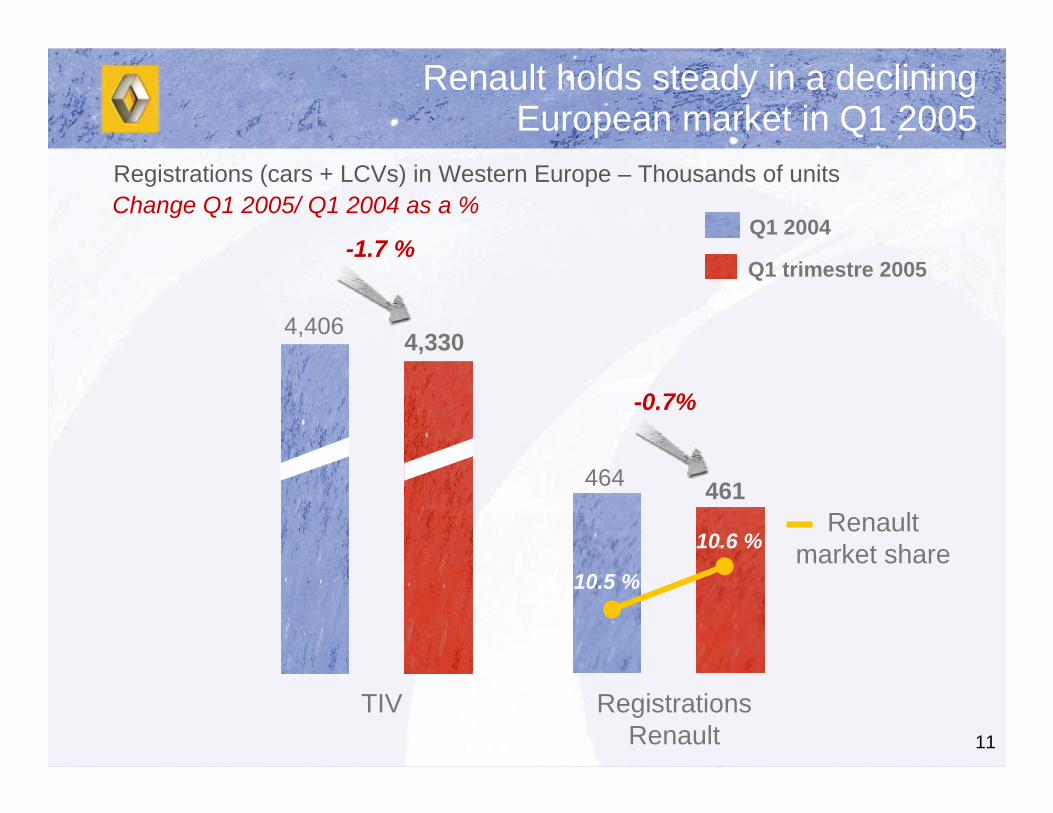
Registrations (cars + LCVs) in Western Europe – Thousands of units
Q1 2004
Q1 trimestre 2005
Change Q1 2005/ Q1 2004 as a %
Renault holds steady in a decliningEuropean market in Q1 2005
TIV
Renaultmarket share
RegistrationsRenault
-1.7 %
4,406 4,330
464 461
10.5 %
10.6 %
-0.7%
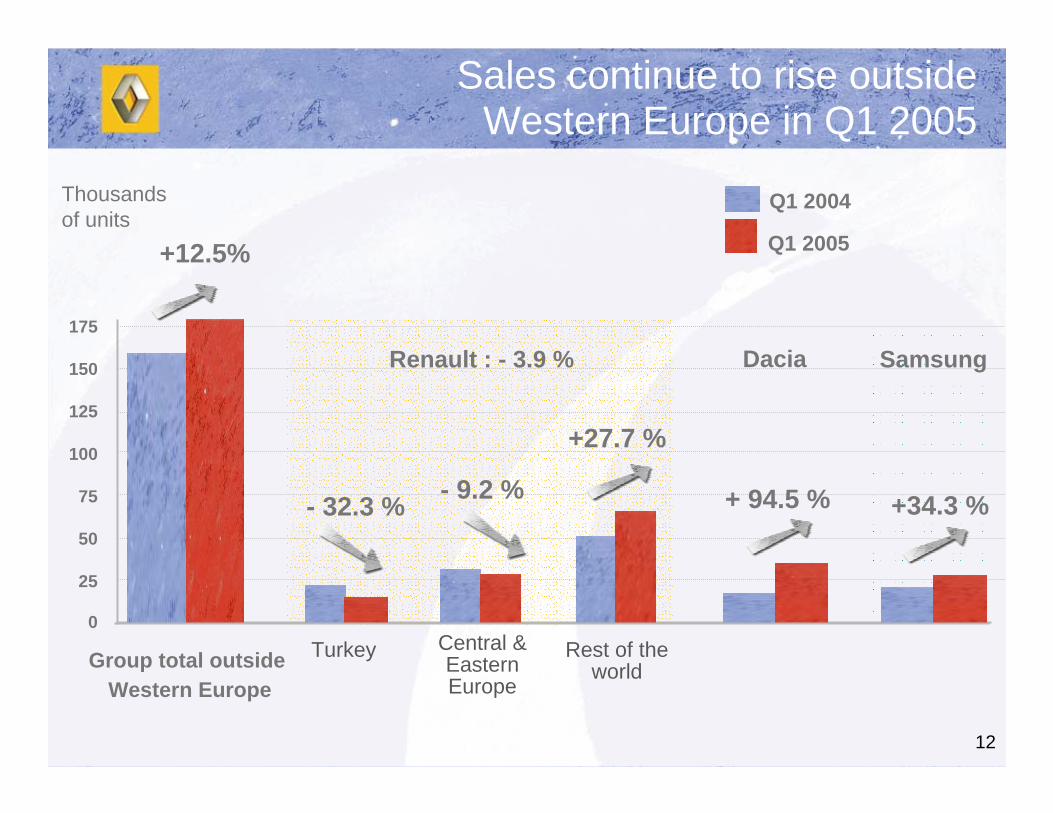
12
Thousandsof units
Sales continue to rise outsideWestern Europe in Q1 2005
Q1 2004
Q1 2005
+27.7 %
- 32.3 % + 94.5 % +34.3 %
Renault : - 3.9 % Dacia
100
75
50
25
125
150
175
- 9.2 %
0
+12.5%
Group total outsideWestern Europe
Rest of the world
Turkey Central & Eastern Europe
Samsung
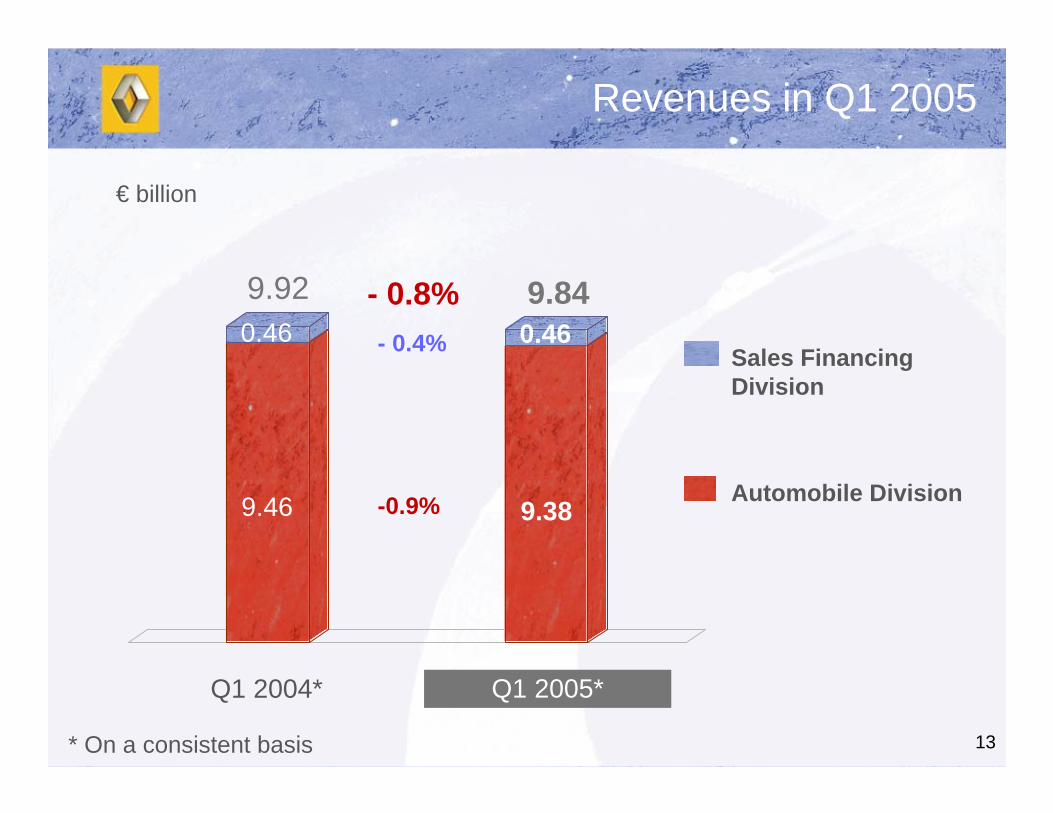
13
€ billion
* On a consistent basis
9.46
0.46 0.469.92 9.84- 0.8%
9.38
- 0.4%
-0.9%
Revenues in Q1 2005
Sales FinancingDivision
Automobile Division
Q1 2005*Q1 2004*
14
Automobile markets in 2005
! Stability in Western Europe
! International growth (except in Turkey)
15
Outlook for 2005
! Ongoing growth in worldwide sales
! Operating margin higher than 4% of revenues under IFRS
16
Profitable growth strategy
! Build recognition for our brand identity
! Be the most competitive manufacturer on our markets in terms of quality, costs and delivery times
! Extend our international reach
! Develop Renault’s core values
! Translate success into financial performance
Five strategic goals:
17
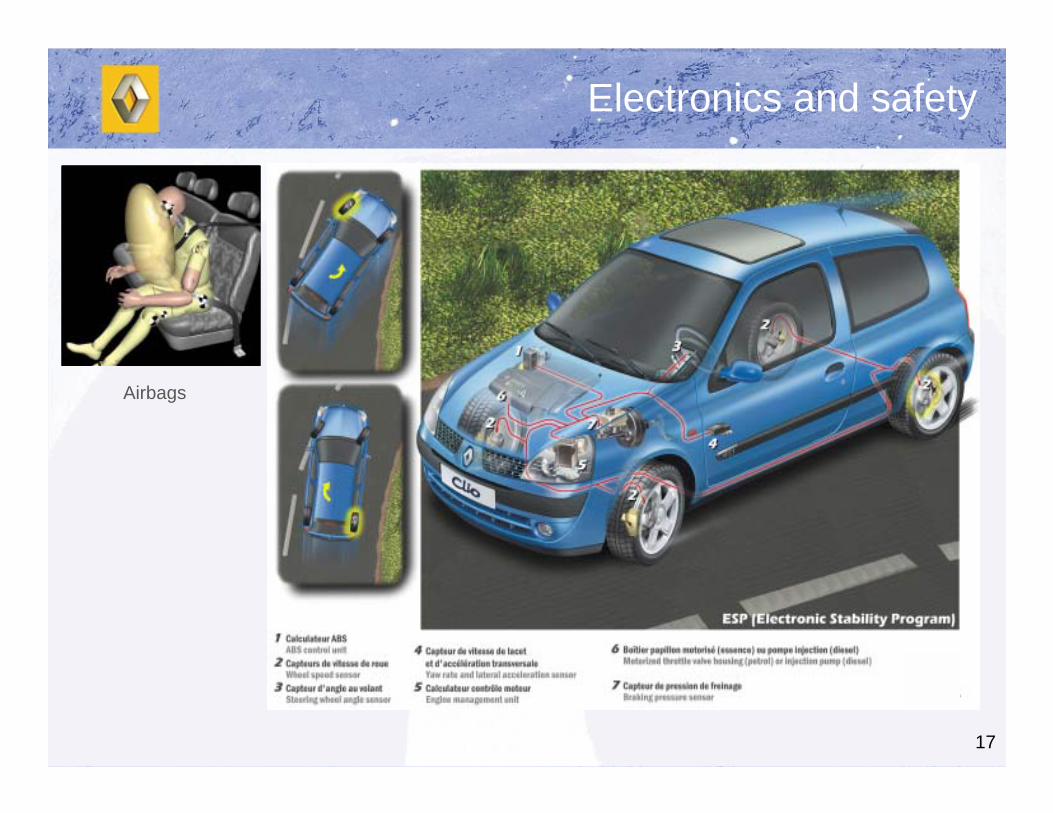
Electronics and safety
Airbags
18
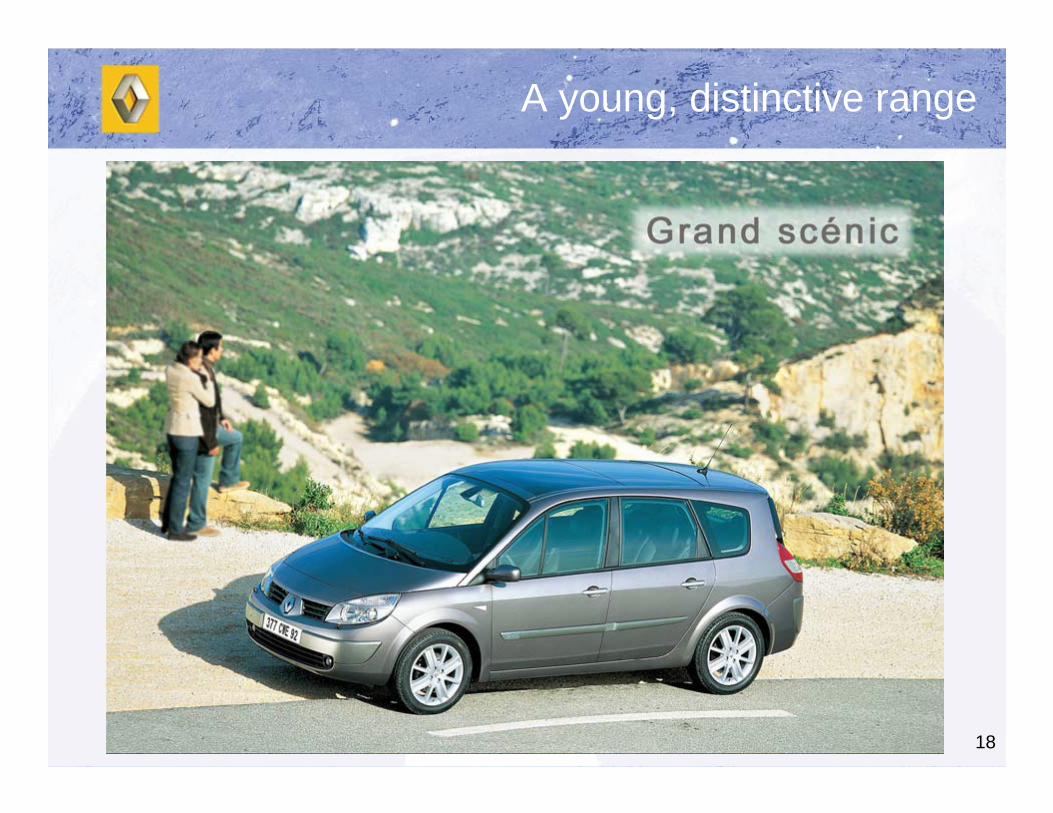
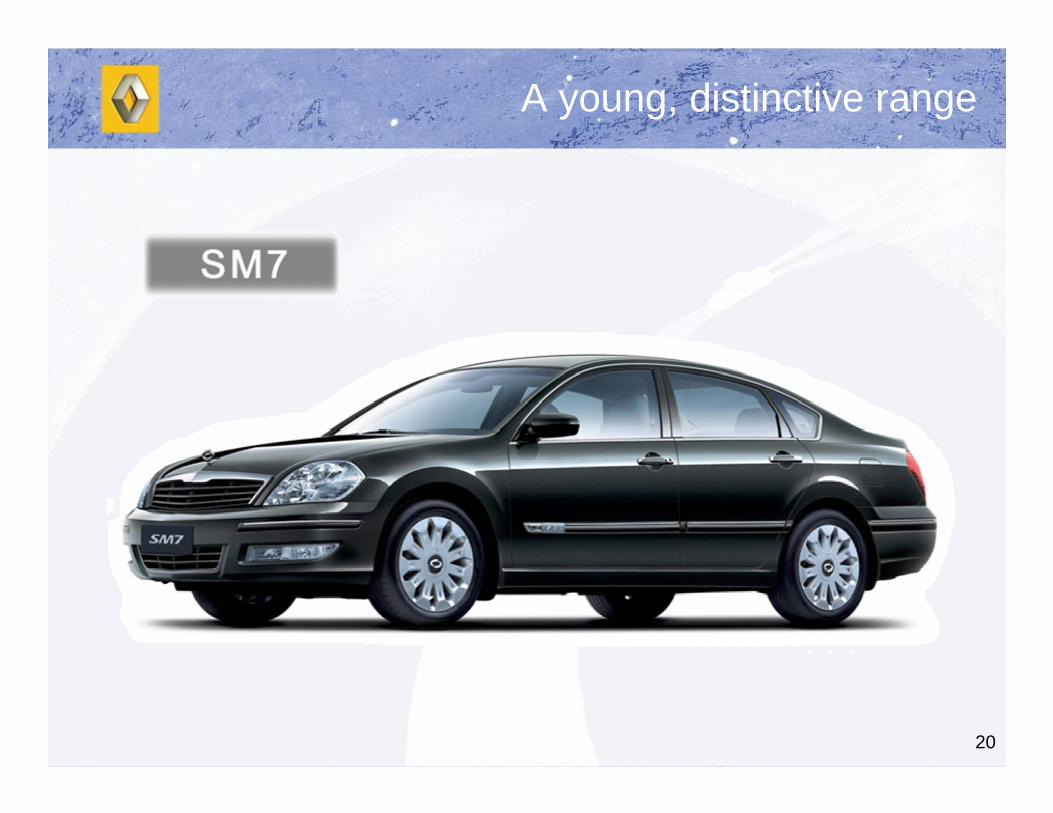
A young, distinctive range
19
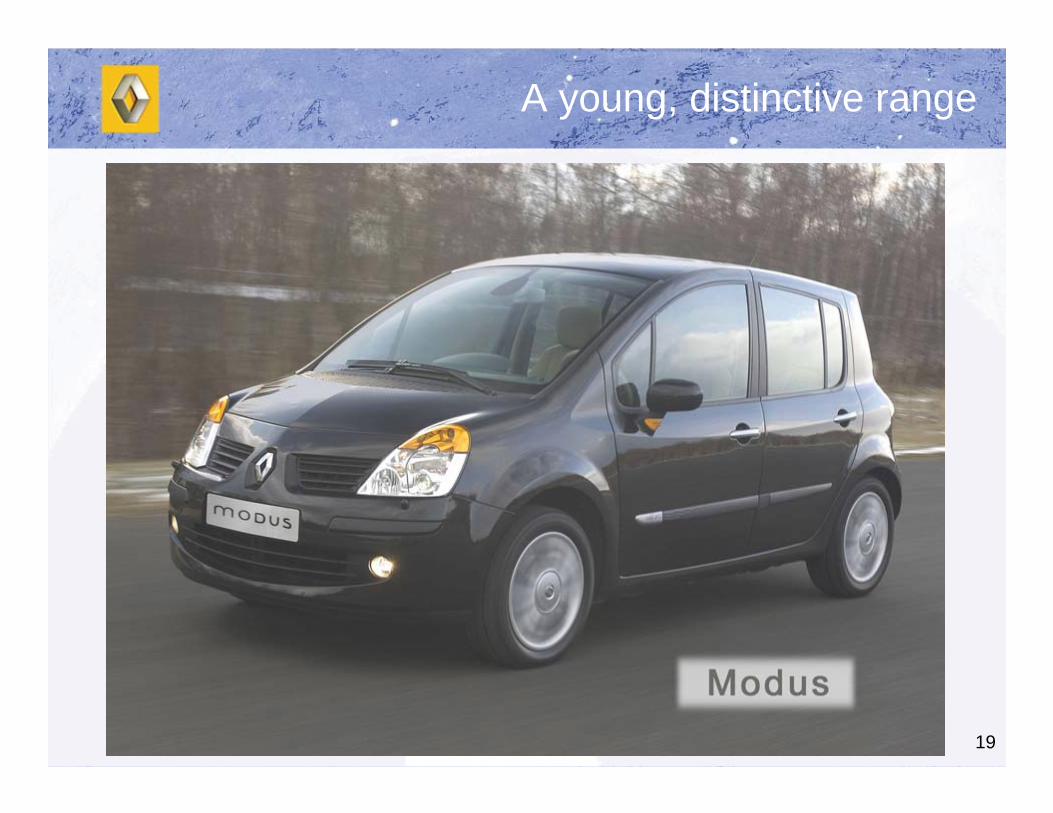
A young, distinctive range
20
A young, distinctive range
21
! Control development times and costs of projects
! Guarantee plant flexibility and productivity
! Rigorously control structural expenses
! Reduce purchasing costs, thanks to RNPO
Goal n°2:
Profitable growth strategy
Be the most competitive manufacturer on our markets in terms of quality, costs and delivery times thanks to the Alliance with Nissan
22
Renault Nissan Purchasing Organization
23
Profitable growth strategy
! Build recognition for our brand identity
! Be the most competitive manufacturer on our markets in terms of quality, costs and delivery times thanks to the Alliance with Nissan
! Extend our international reach
! Develop Renault’s core values
! Translate success into financial performance
Five strategic goals:
24
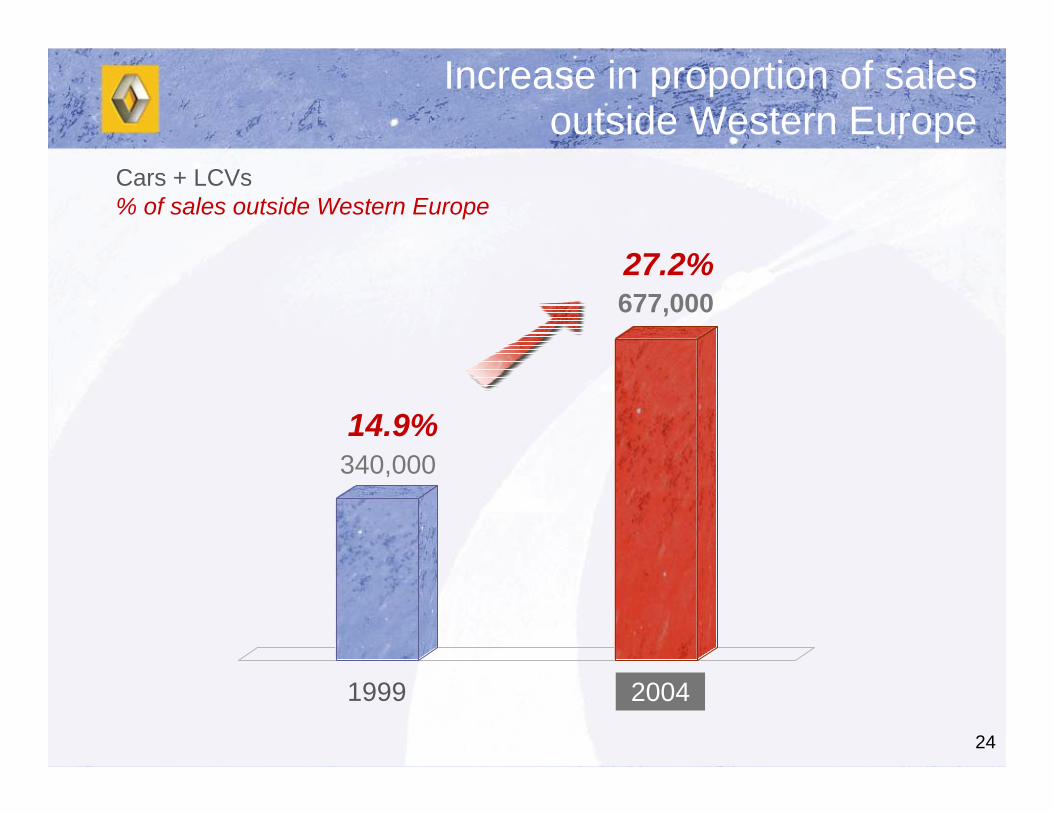
Increase in proportion of salesoutside Western Europe
20041999
Cars + LCVs % of sales outside Western Europe
14.9%
27.2%
340,000
677,000
25
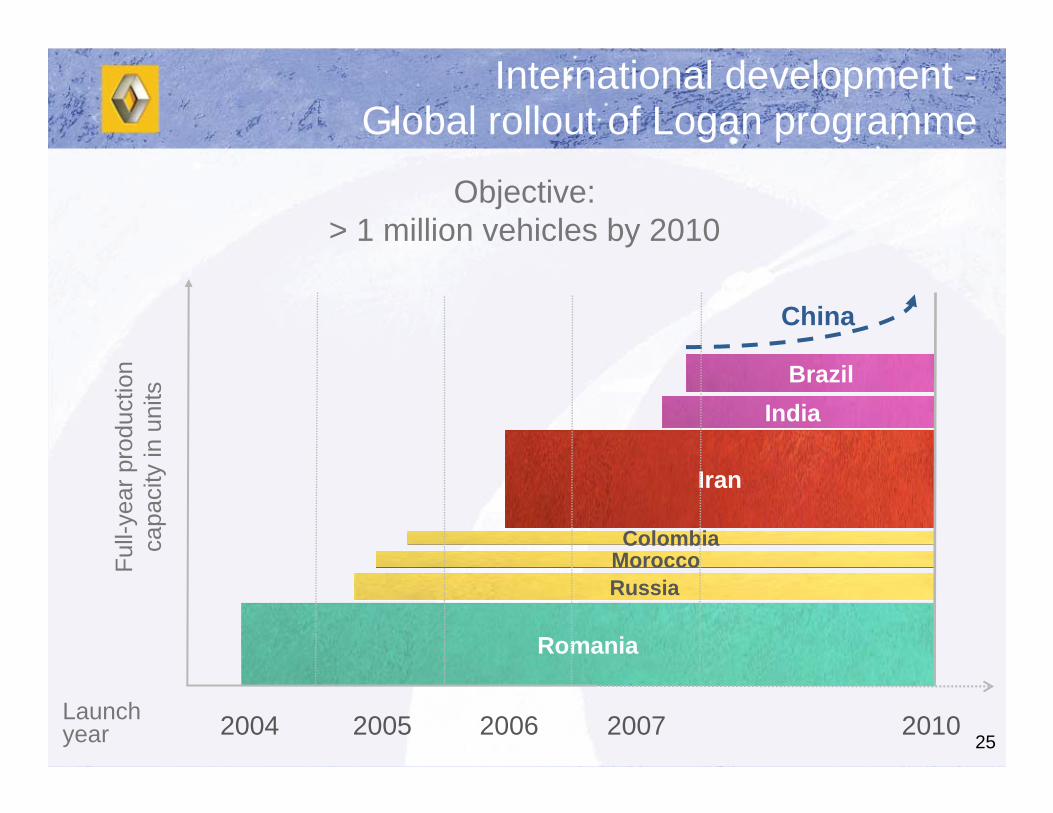
Objective:> 1 million vehicles by 2010
2004 2005 2006 2007 2010Launchyear
International development -Global rollout of Logan programme
Full-
year
pro
duct
ion
capa
city
in u
nits
Romania
Russia
Iran
India
Morocco
Brazil
China
Colombia
26
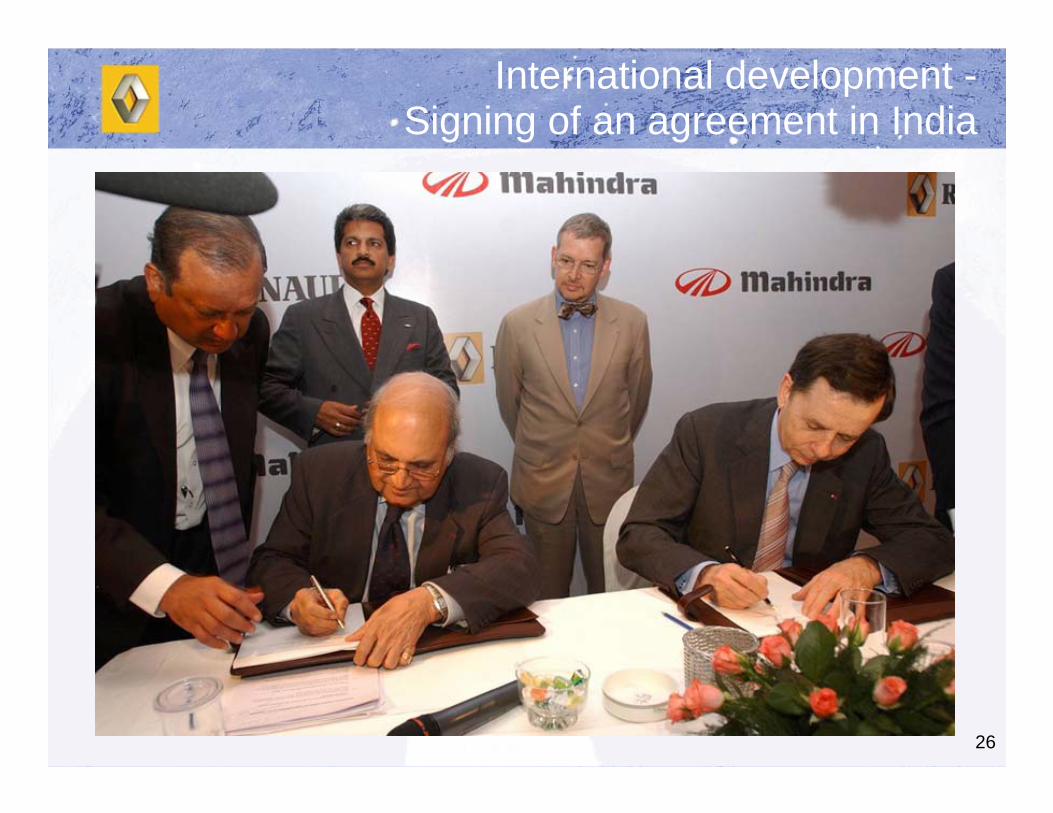
International development -Signing of an agreement in India
27
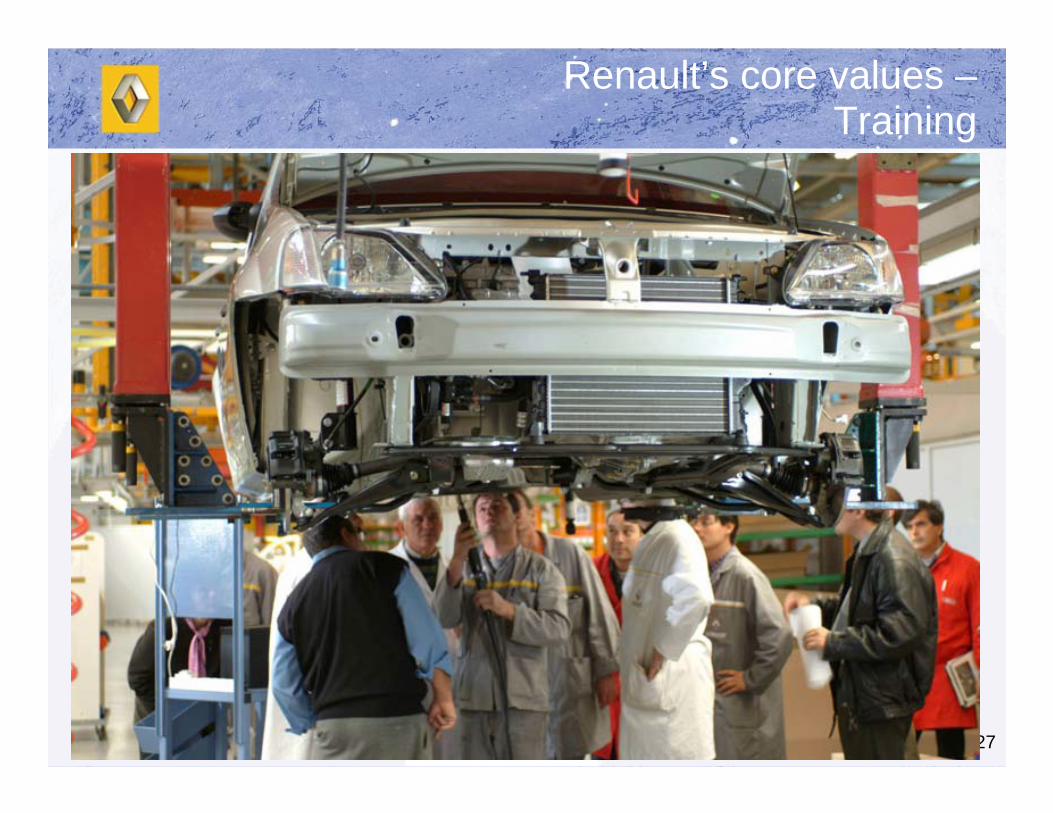
Renault’s core values –Training
28
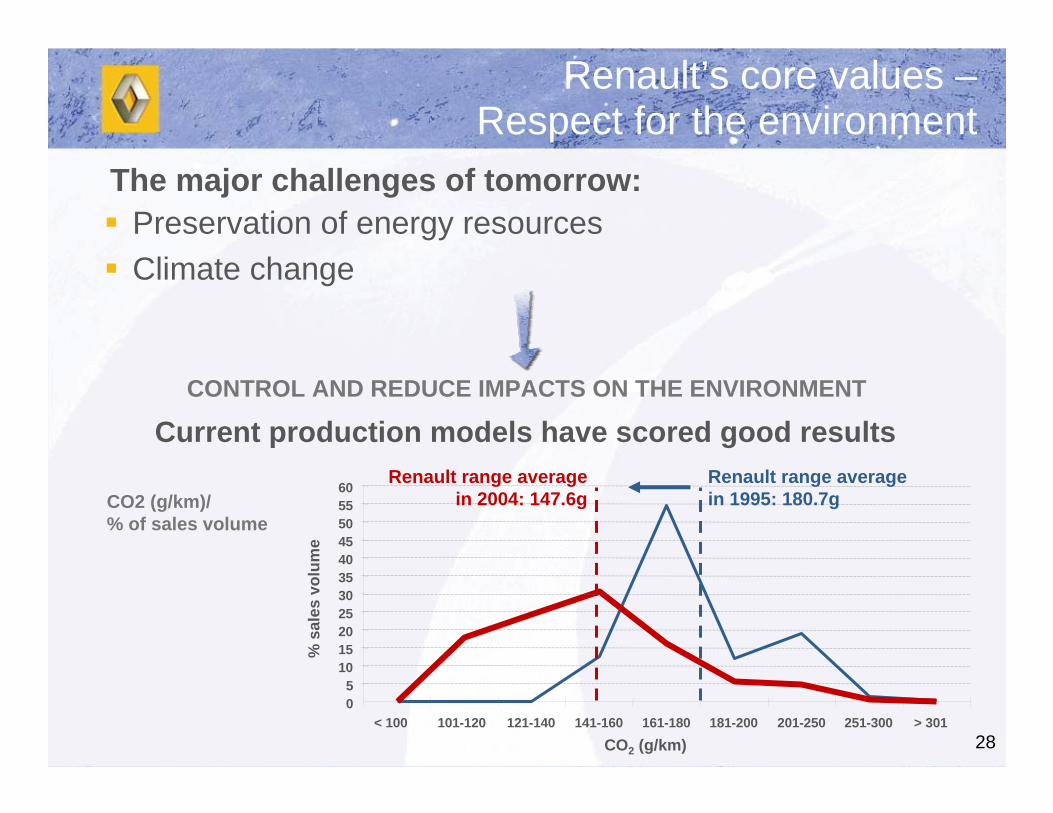
CONTROL AND REDUCE IMPACTS ON THE ENVIRONMENT
Current production models have scored good results
The major challenges of tomorrow:
Renault’s core values –Respect for the environment
! Preservation of energy resources! Climate change
CO2 (g/km)/% of sales volume
% s
ales
vol
ume
CO2 (g/km)
05
1015202530354045505560
< 100 101-120 121-140 141-160 161-180 181-200 201-250 251-300 > 301
Renault range averagein 2004: 147.6g
Renault range averagein 1995: 180.7g
29
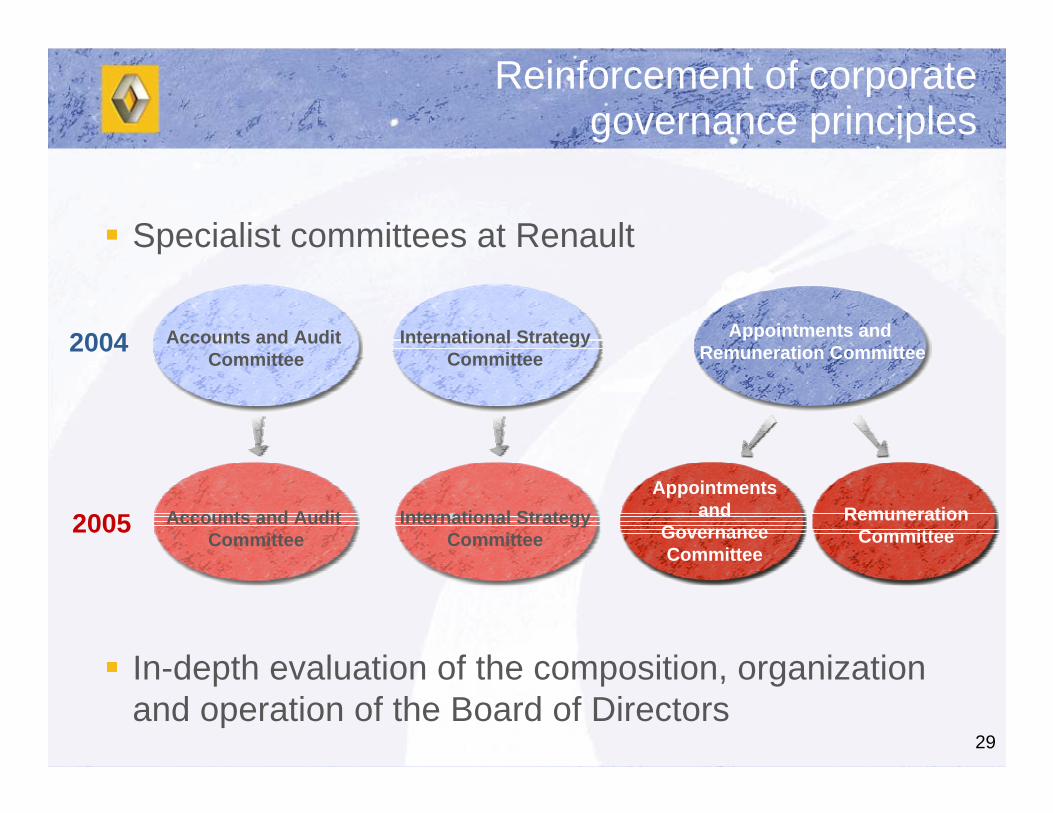
Appointments and Remuneration Committee2004
2005
Accounts and Audit Committee
International StrategyCommittee
Remuneration Committee
Appointments and
Governance Committee
Reinforcement of corporategovernance principles
! Specialist committees at Renault
! In-depth evaluation of the composition, organization and operation of the Board of Directors
Accounts and Audit Committee
International StrategyCommittee
30
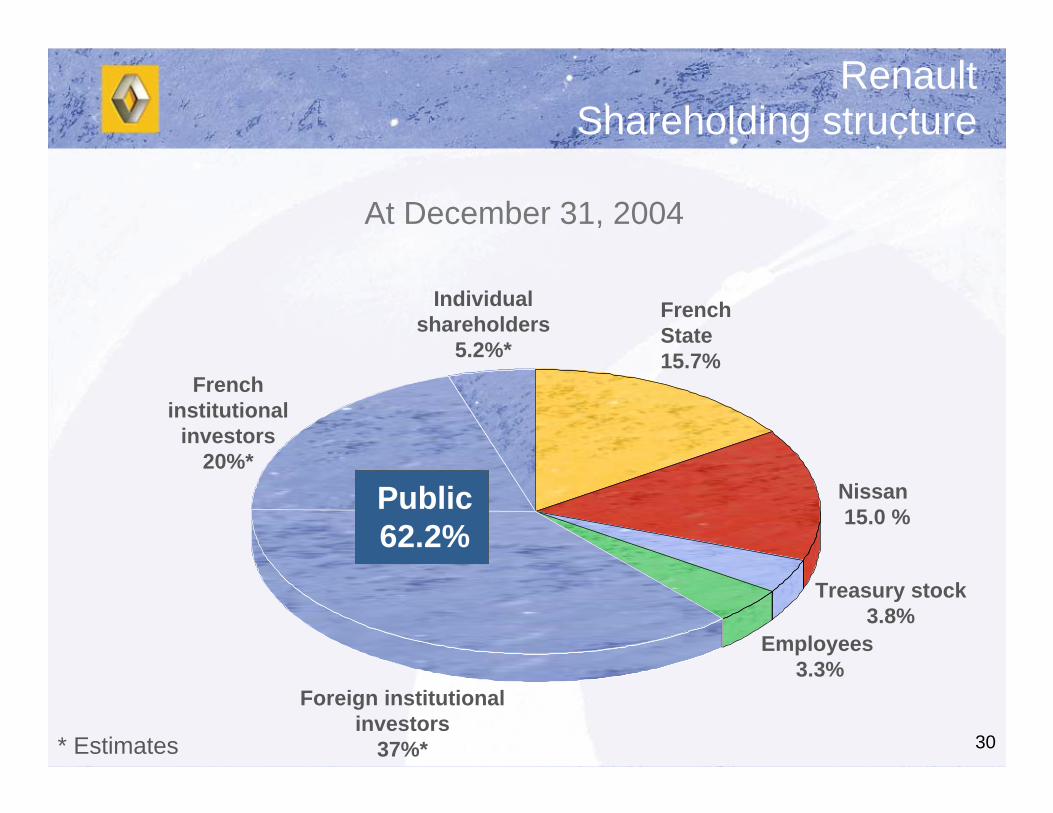
At December 31, 2004
* Estimates
Renault Shareholding structure
Nissan15.0 %
French State 15.7%
Treasury stock 3.8%
Employees 3.3%
Foreign institutional investors
37%*
French institutional
investors20%*
Individual shareholders
5.2%*
Public 62.2%
31
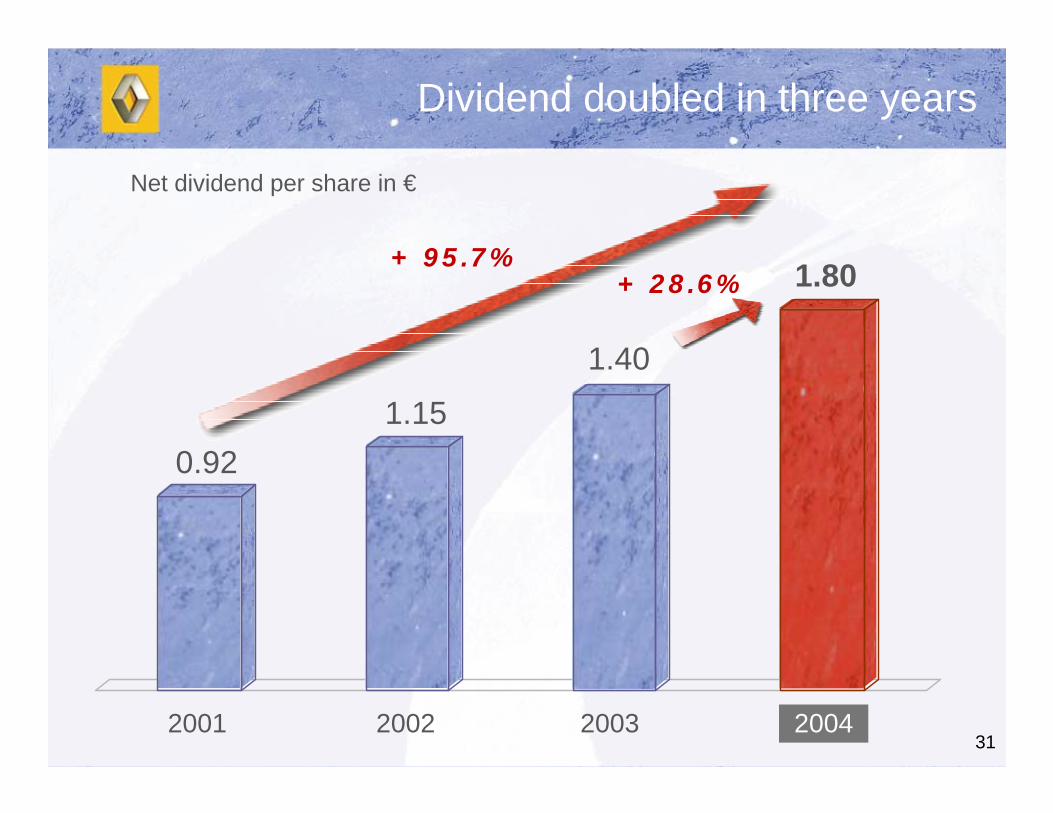
0.921.15
1.40
+ 95.7% 1.80
Dividend doubled in three years
2004200320022001
Net dividend per share in €
+ 28.6%
32
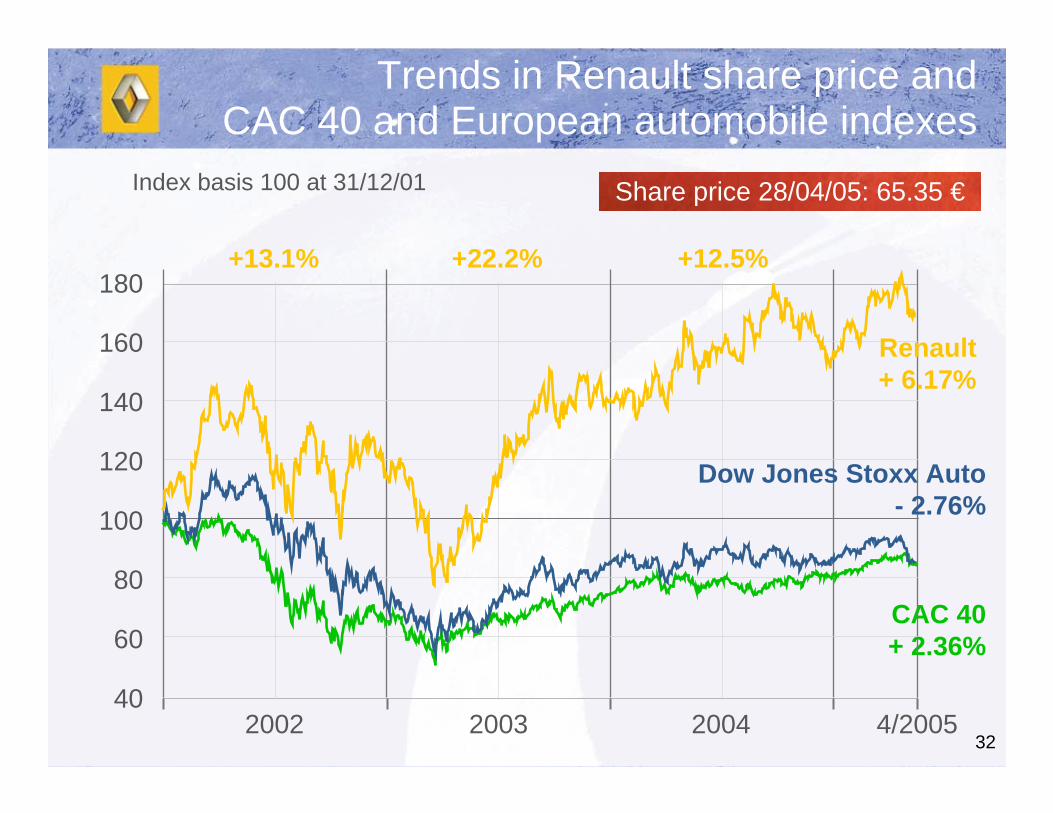
Trends in Renault share price and CAC 40 and European automobile indexes
Index basis 100 at 31/12/01 Share price 28/04/05: 65.35 €
+22.2% +12.5%+13.1%
CAC 40+ 2.36%
402002 4/20052003 2004
60
80
100
120
140
160
180
Dow Jones Stoxx Auto - 2.76%
Renault+ 6.17%
33
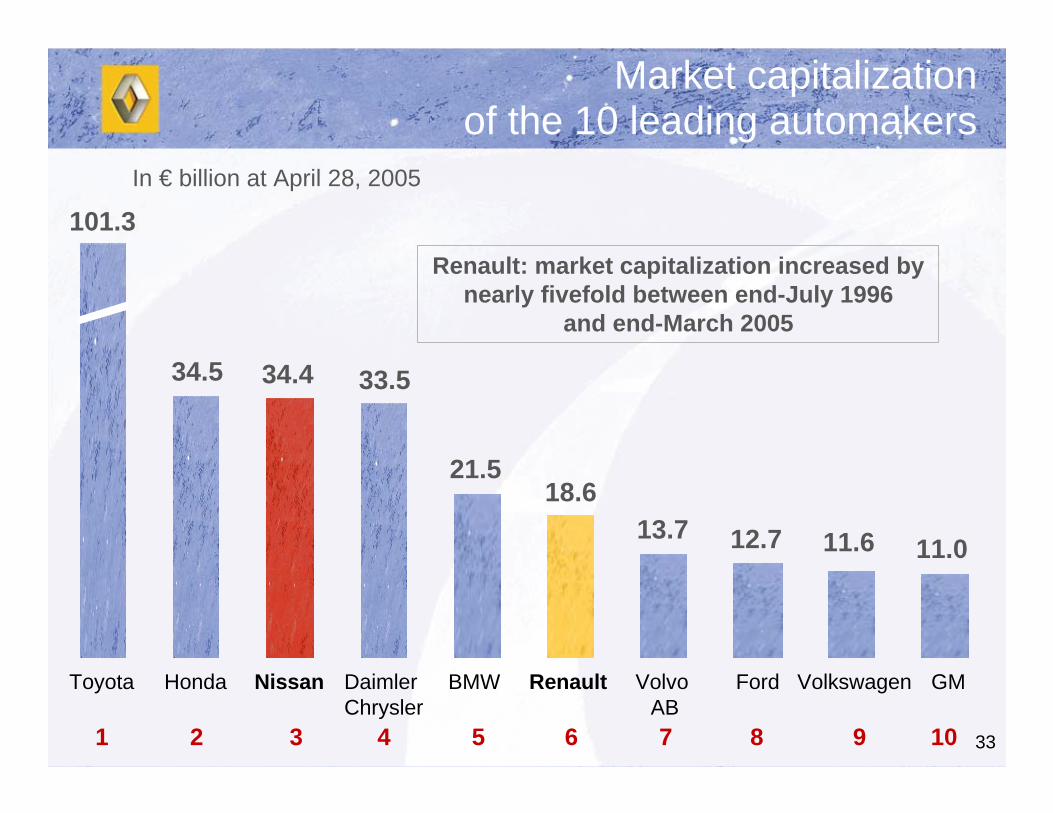
Market capitalization of the 10 leading automakers
In € billion at April 28, 2005
Renault: market capitalization increased by nearly fivefold between end-July 1996
and end-March 2005
Toyota BMWNissan Daimler Chrysler
Honda VolkswagenVolvo AB
FordRenault GM
1 2 3 4 5 6 7 8 9 10
101.3
13.718.6
21.5
33.534.434.5
12.7 11.6 11.0
34
! Performance
! Brand identity
! Efficient international development
Strategic continuity
35
Performance
We owe it to our shareholders,
our customers,
our employees,
our partners,
and society at large.
36
Brand identity
! Irreproachable safety! Product and service quality! State-of-the-art technology! Cost competitiveness
! Design personality! Perceived quality! Driving pleasure! Customer treatment
37
Efficient international development
Develop our presence and succeedin growth markets
38
Three requirements
! Commitment to objectives
! Transparency in operations
! Accountability for results
39
Nissan business plans
! Nissan Revival Plan (2000-2001)
! NISSAN 180 (2002-2004)
! NISSAN Value-Up (2005-2007)
40
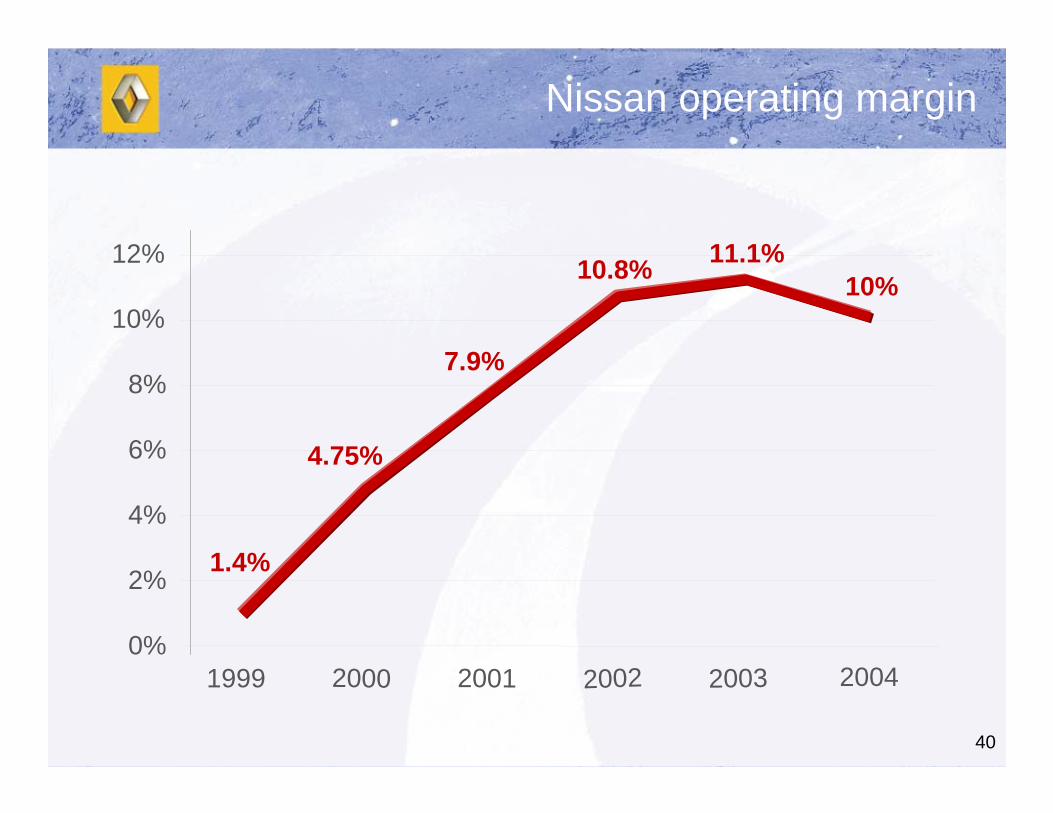
Nissan operating margin
1.4%
4.75%
7.9%
10.8% 11.1%10%
0%
2%
4%
6%
8%
10%
12%
1999 2000 2001 2002 2003 2004
41
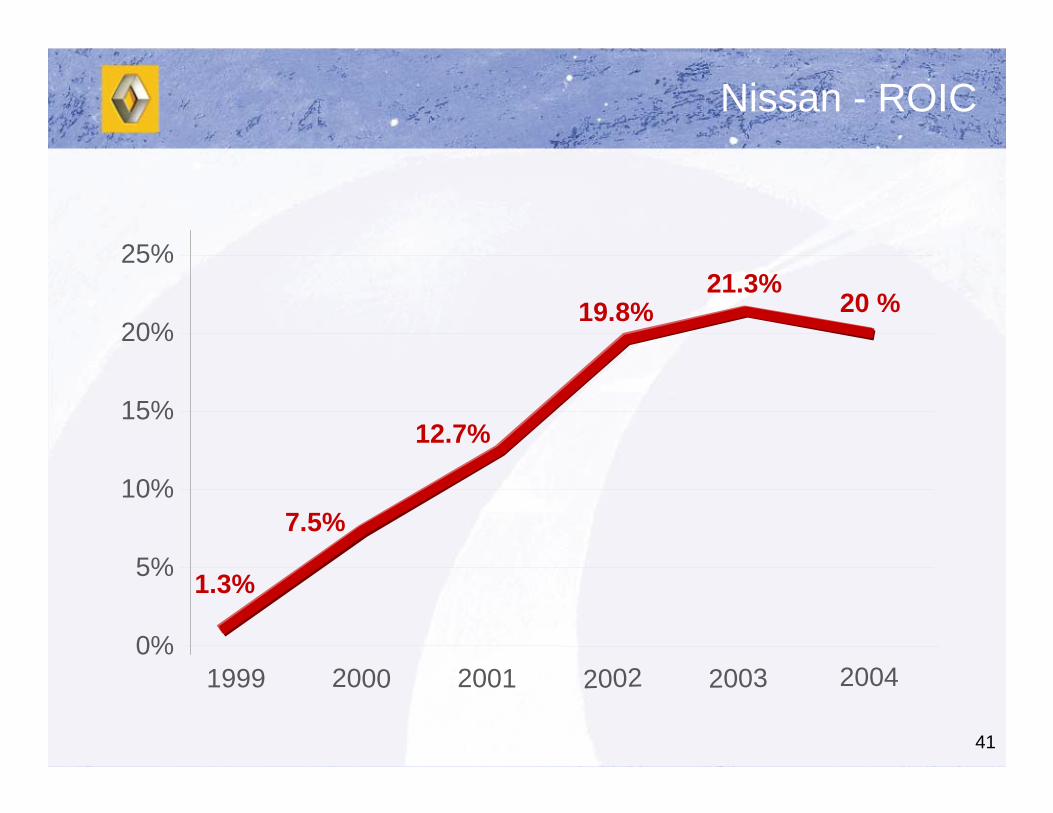
Nissan - ROIC
0%
5%
10%
15%
20%
25%
1999 2000 2001 2002 2003 2004
1.3%
12.7%
7.5%
19.8%21.3%
20 %
42
The Alliance
43
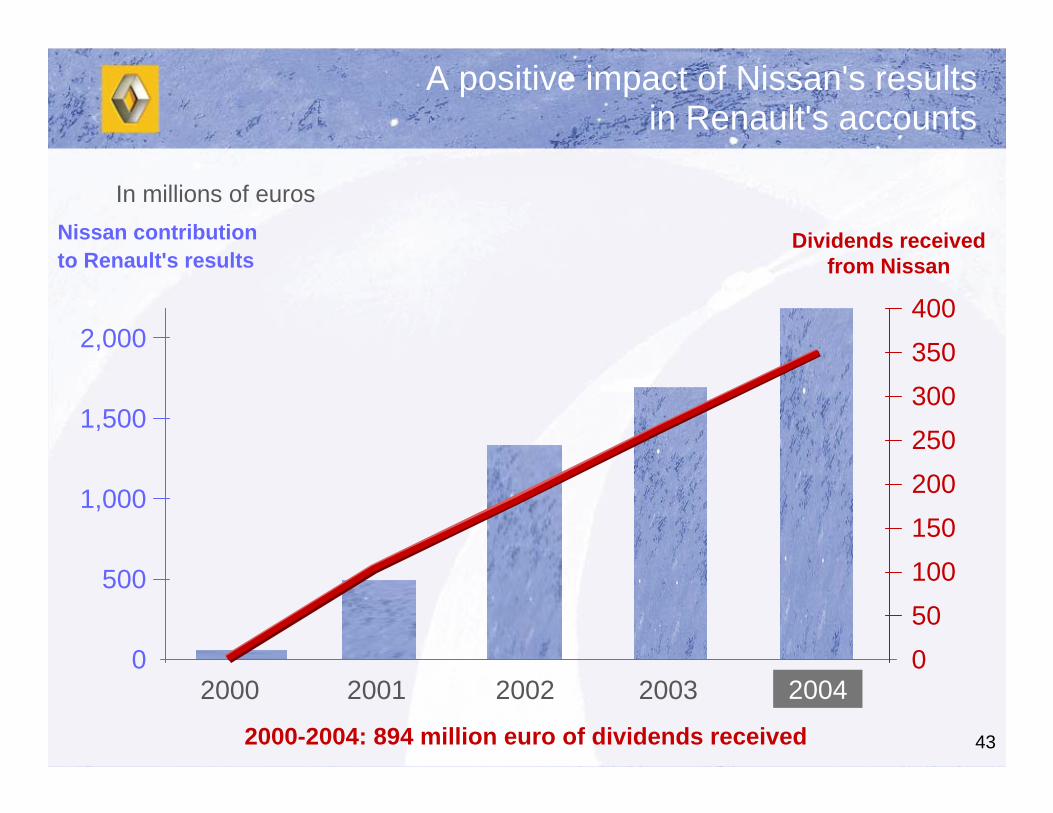
A positive impact of Nissan's resultsin Renault's accounts
Dividends receivedfrom Nissan
Nissan contributionto Renault's results
2000-2004: 894 million euro of dividends received
20042003200220012000
500
100150200250300350400
0
500
1,000
1,500
2,000
In millions of euros
44
The principles of the Alliance
! Develop synergies to boost the performance of Renault and Nissan
! A partnership based on respect for the identity and culture of each company
45
Alliance Vision - Destination
Rank among the world’s top three automotive groups in terms of:
! Quality
! Technology
! Operating profit