Embed Size (px)
Citation preview

THE COMPLETE SOLUTION FOR THE MILLING INDUSTRY
MIxOLabQuality control for cereals, flour and milling products.
Compliant with
the following standards
ICC 173/1
aaCC 54-60-01
NF V03-765
NF V03-764
GOST P 54498-2011

The Mixolab measures the consistency of dough subject to the dual stress of mixing and a temperature rise.The Mixolab analyses protein and starch quality using a 50 g flour sample.
MEASUREMENT PRINCIPLE
1. MIXOLAB STANDARD
The “Chopin +” standard protocol is used for analyzing :1. Behavior during mixing (hydration, stability, etc.)2. Protein quality3. Starch gelatinization4. Amylase activity5. Starch retrogradation.
StandardizedCompliant with ICC173/1, AACC 54-60-01, NF V03-765, NFV03-764, GOST Р 54498-2011 standards.
SimpleAutomatic water addition, fully removable mixer and quick cleaning.
User-friendly PC control for complete traceability.Software available in more than 10 languages.
Versatile Suitable for both flours and ground products.
FlexibleFully customizable protocols.
AdaptableUsed in Quality Control and R&D.
2. MIXOLAB PROFILER
The software measures all the standard curve parameters and converts them into six qualitative indexes :
These parameters are perfectly suited to set simple and effective criteria in the specifications.
3. MIXOLAB SIMULATOR
The Simulator protocol gives results fully comparable to the Farinograph® :
• Hydration • Development time • Weakening • Stability
1. Absorption index2. Gluten+ index3. Amylase index
4. Mixing index5. Viscosity index6. Retrogradation index
BENEFITS
MIXOLAB PROFILER
MIXOLAB SIMULATOR
MIXOLAB STANDARD
1 2 3 4 5
1
0
10
20
30
40
50
60
70
80
90
100
0,0
0,5
1,0
1,5
2,0
2,5
3,0
0 5 10 15 20 25 30 35 40 45
Tem
péra
ture
(°C)
Coup
le (N
m)
Temps (min)
14475
14501
14511
14529
14539
14581
T°C pétrin
T°C pâte
ANALYZE GROUND WHEAT
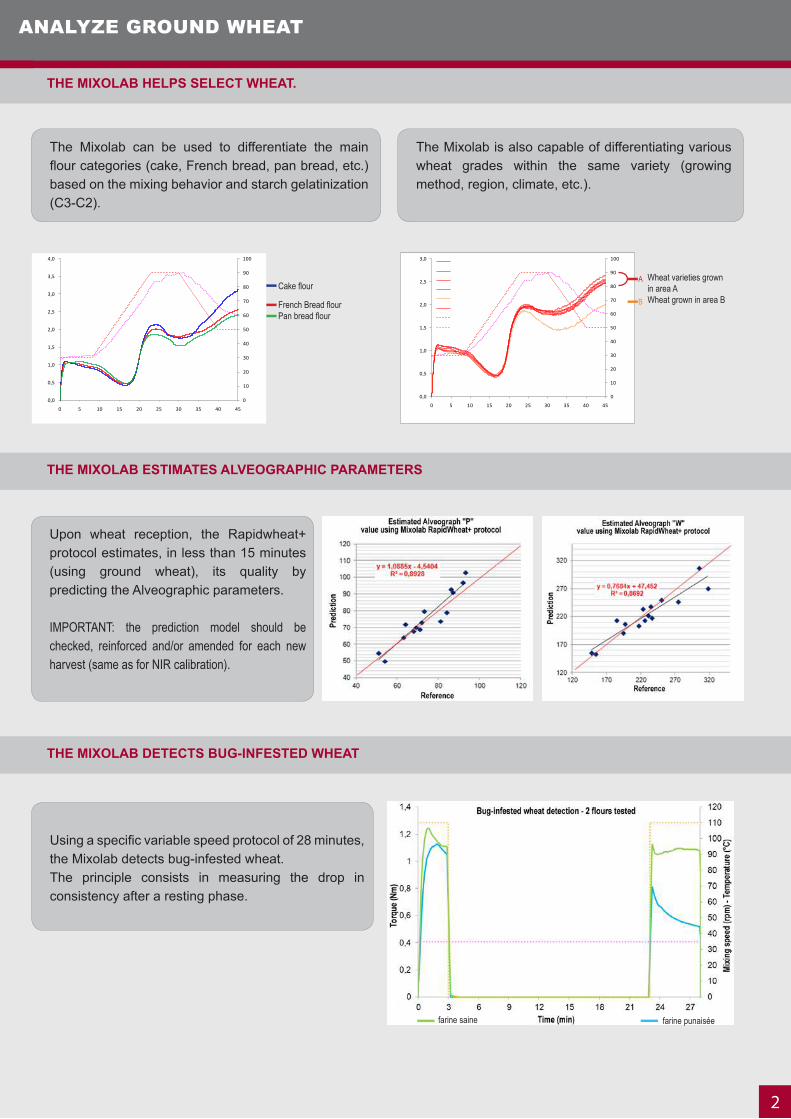
The Mixolab can be used to differentiate the main flour categories (cake, French bread, pan bread, etc.) based on the mixing behavior and starch gelatinization (C3-C2).
Upon wheat reception, the Rapidwheat+ protocol estimates, in less than 15 minutes (using ground wheat), its quality by predicting the Alveographic parameters.
IMPORTANT: the prediction model should be checked, reinforced and/or amended for each new harvest (same as for NIR calibration).
Using a specific variable speed protocol of 28 minutes, the Mixolab detects bug-infested wheat.The principle consists in measuring the drop in consistency after a resting phase.
The Mixolab is also capable of differentiating various wheat grades within the same variety (growing method, region, climate, etc.).
0
10
20
30
40
50
60
70
80
90
100
0,0
0,5
1,0
1,5
2,0
2,5
3,0
3,5
4,0
0 5 10 15 20 25 30 35 40 45
Tem
péra
ture
(°C)
Coup
le (N
m)
Temps (min)
ThE MIXOLAB hELPS SELEcT whEAT.
ThE MIXOLAB ESTIMATES ALVEOGRAPhIc PARAMETERS
ThE MIXOLAB DETEcTS BUG-INFESTED whEAT
Wheat varieties grown in area AWheat grown in area B
Cake flour
French Bread flourPan bread flour
A
B
farine saine farine punaisée
2
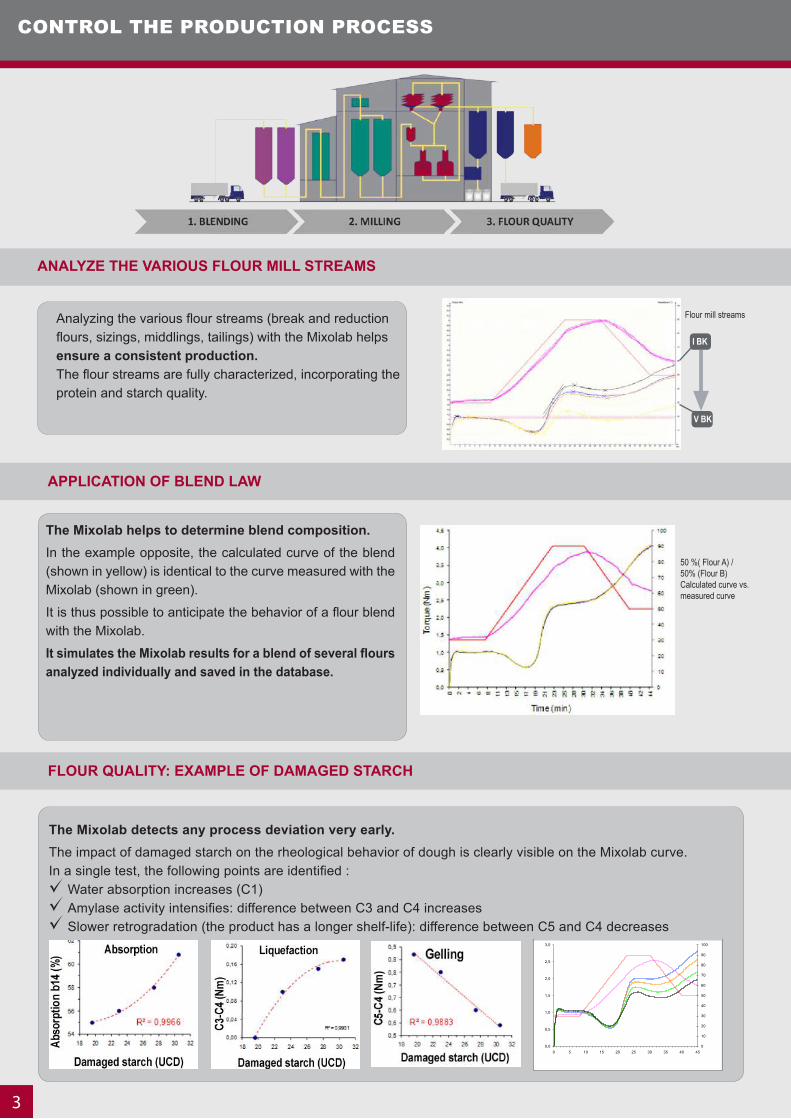
CONTROL THE PRODUCTION PROCESS
Analyzing the various flour streams (break and reduction flours, sizings, middlings, tailings) with the Mixolab helps ensure a consistent production.The flour streams are fully characterized, incorporating the protein and starch quality.
The Mixolab helps to determine blend composition.In the example opposite, the calculated curve of the blend (shown in yellow) is identical to the curve measured with the Mixolab (shown in green).
It is thus possible to anticipate the behavior of a flour blend with the Mixolab.
It simulates the Mixolab results for a blend of several flours analyzed individually and saved in the database.
ANALYZE ThE VARIOUS FLOUR MILL STREAMS
APPLIcATION OF BLEND LAw
FLOUR QUALITY: EXAMPLE OF DAMAGED STARch
The Mixolab detects any process deviation very early.The impact of damaged starch on the rheological behavior of dough is clearly visible on the Mixolab curve.In a single test, the following points are identified :
Water absorption increases (C1)Amylase activity intensifies: difference between C3 and C4 increases Slower retrogradation (the product has a longer shelf-life): difference between C5 and C4 decreases
0
10
20
30
40
50
60
70
80
90
100
0,0
0,5
1,0
1,5
2,0
2,5
3,0
0 5 10 15 20 25 30 35 40 45
Tem
péra
ture
(°C
)
Cou
ple
(Nm
)
Temps (min)
50 %( Flour A) /50% (Flour B) Calculated curve vs. measured curve
I BK
V BK
Flour mill streams
3
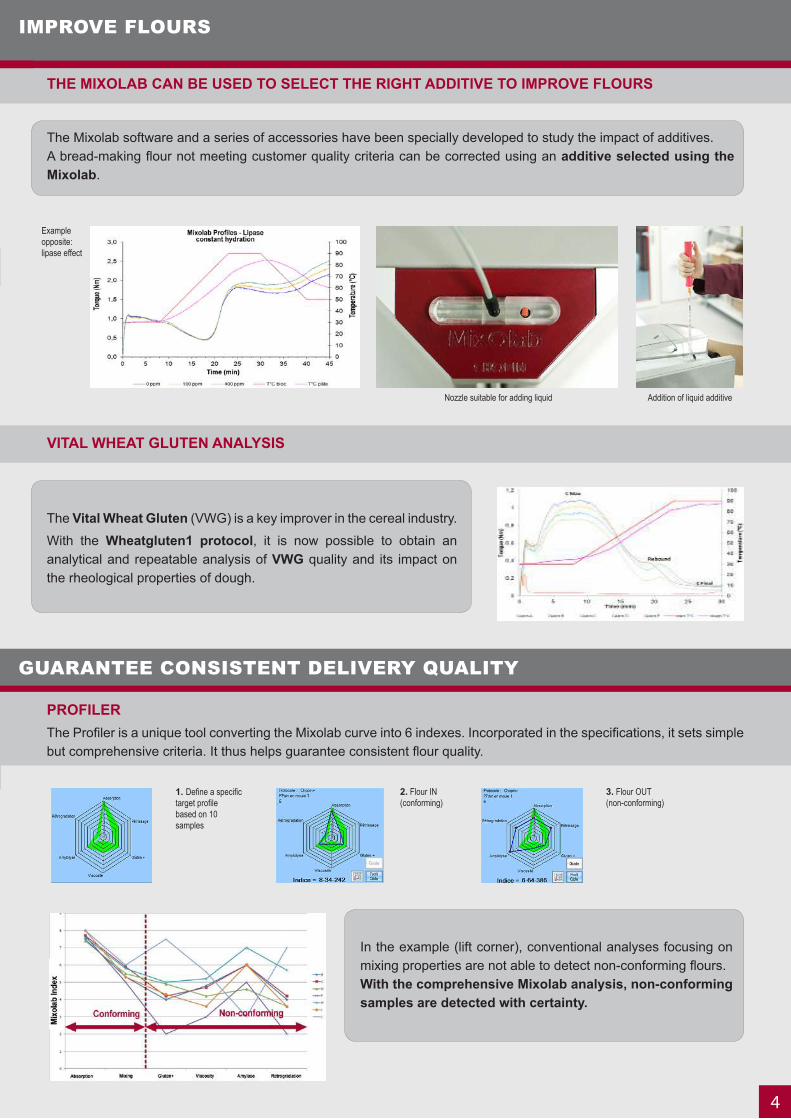
IMPROVE FLOURS
The Mixolab software and a series of accessories have been specially developed to study the impact of additives.A bread-making flour not meeting customer quality criteria can be corrected using an additive selected using the Mixolab.
The Vital wheat Gluten (VWG) is a key improver in the cereal industry.
With the wheatgluten1 protocol, it is now possible to obtain an analytical and repeatable analysis of VwG quality and its impact on the rheological properties of dough.
PROFILERThe Profiler is a unique tool converting the Mixolab curve into 6 indexes. Incorporated in the specifications, it sets simple but comprehensive criteria. It thus helps guarantee consistent flour quality.
ThE MIXOLAB cAN BE USED TO SELEcT ThE RIGhT ADDITIVE TO IMPROVE FLOURS
VITAL whEAT GLUTEN ANALYSIS
Example opposite: lipase effect
Addition of liquid additiveNozzle suitable for adding liquid
GUARANTEE CONSISTENT DELIVERY QUALITY
In the example (lift corner), conventional analyses focusing on mixing properties are not able to detect non-conforming flours.with the comprehensive Mixolab analysis, non-conforming samples are detected with certainty.
1. Define a specific target profilebased on 10 samples
2. Flour IN(conforming)
3. Flour OUT(non-conforming)
Flour mill streams
4
MethodThe method is simple and the same for developing any predictive model : - Test samples on Mixolab.- Compare the results with “reference” method via a statistical tool
to create a prediction model.- Validate the model with new samples.
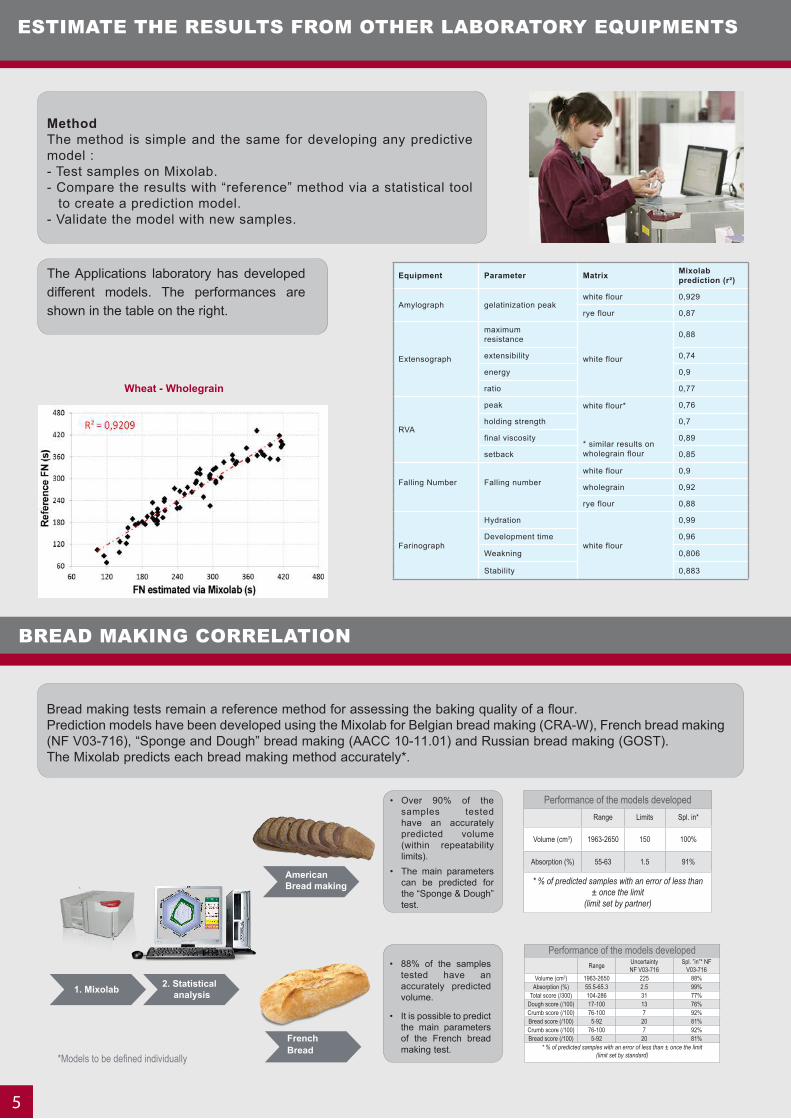
ESTIMATE THE RESULTS FROM OTHER LABORATORY EQUIPMENTS
Bread making tests remain a reference method for assessing the baking quality of a flour.Prediction models have been developed using the Mixolab for Belgian bread making (CRA-W), French bread making (NF V03-716), “Sponge and Dough” bread making (AACC 10-11.01) and Russian bread making (GOST).The Mixolab predicts each bread making method accurately*.
• Over 90% of the samples tested have an accurately predicted volume (within repeatability limits).
• The main parameters can be predicted for the “Sponge & Dough” test.
• 88% of the samples tested have an accurately predicted volume.
• It is possible to predict the main parameters of the French bread making test.
The Applications laboratory has developed different models. The performances are shown in the table on the right.
BREAD MAKING CORRELATION
1. Mixolab 2. Statistical analysis
AmericanBread making
FrenchBread
wheat - wholegrain
5
*Models to be defined individually
Performance of the models developedRange Limits Spl. in*
Volume (cm3) 1963-2650 150 100%
Absorption (%) 55-63 1.5 91%
* % of predicted samples with an error of less than ± once the limit
(limit set by partner)
Performance of the models developedRange Uncertainty
NF V03-716Spl. ”in”* NF
V03-716Volume (cm3) 1963-2650 225 88%
Absorption (%) 55.5-65.3 2.5 99%Total score (/300) 104-286 31 77%
Dough score (/100) 17-100 13 76%Crumb score (/100) 76-100 7 92%Bread score (/100) 5-92 20 81%Crumb score (/100) 76-100 7 92%Bread score (/100) 5-92 20 81%
* % of predicted samples with an error of less than ± once the limit(limit set by standard)
Equipment Parameter Matrix Mixolab prediction (r²)
Amylograph gelatinization peakwhite flour 0,929
rye flour 0,87
Extensograph
maximumresistance
white flour
0,88
extensibility 0,74
energy 0,9
ratio 0,77
RVA
peak white flour*
* similar results on wholegrain flour
0,76
holding strength 0,7
final viscosity 0,89
setback 0,85
Falling Number Falling numberwhite flour 0,9
wholegrain 0,92
rye flour 0,88
Farinograph
Hydration
white flour
0,99
Development time 0,96
Weakning 0,806
Stability 0,883
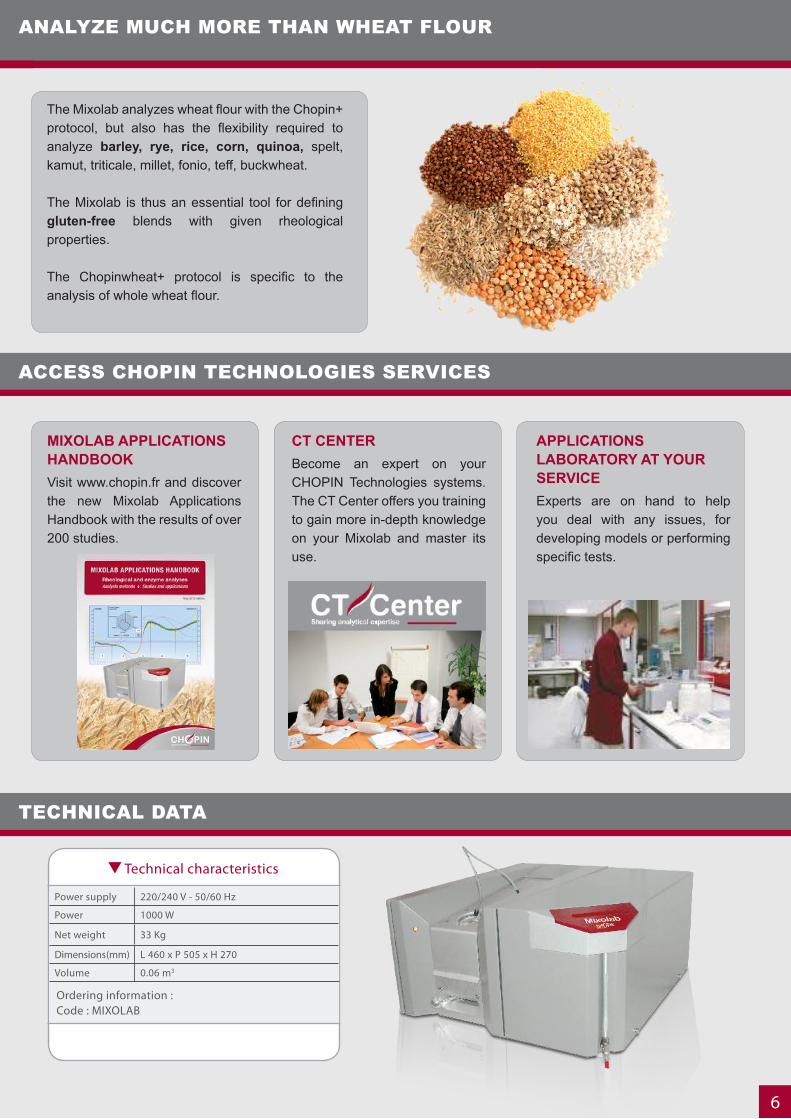
ANALYZE MUCH MORE THAN WHEAT FLOUR
The Mixolab analyzes wheat flour with the Chopin+ protocol, but also has the flexibility required to analyze barley, rye, rice, corn, quinoa, spelt, kamut, triticale, millet, fonio, teff, buckwheat.
The Mixolab is thus an essential tool for defining gluten-free blends with given rheological properties.
The Chopinwheat+ protocol is specific to the analysis of whole wheat flour.
ACCESS CHOPIN TECHNOLOGIES SERVICES
TECHNICAL DATA
MIXOLAB APPLIcATIONS hANDBOOKVisit www.chopin.fr and discover the new Mixolab Applications Handbook with the results of over 200 studies.
cT cENTERBecome an expert on your CHOPIN Technologies systems. The CT Center offers you training to gain more in-depth knowledge on your Mixolab and master its use.
APPLIcATIONS LABORATORY AT YOUR SERVIcEExperts are on hand to help you deal with any issues, for developing models or performing specific tests.
Technical characteristics
Power supply 220/240 V - 50/60 Hz
Power 1000 W
Net weight 33 Kg
Dimensions (mm) L 460 x P 505 x H 270
Volume 0.06 m3
Ordering information :Code : MIxOLab
6

CHOPIN Technologies20 avenue Marcellin berthelot
92390 Villeneuve-la-Garenne France
2 [email protected] www.chopin.fr
SaleS Department
France Division
Tél. : +33 1 41 47 50 41Fax. : +33 1 47 94 67 15
Export Division
Tél. : +33 1 41 47 50 48Fax. : +33 1 41 27 07 10
Chopin Technologies
Distributors
CHOPIN Technologies in the world
Your CHOPIN Technologies representative :