Embed Size (px)
Citation preview

1
Condensed Financial Statements as of March 31, 2018
Main Table of Contents
Condensed Report of the Board of Directors and Management 5
Overview, targets and strategy 6
Explanation and analysis of results and business standing 12
Risks overview 43
Policies and critical accounting estimates, controls and procedures Controls and Procedures 82
Certifications with regard to disclosure on the condensed financial statements 84
Independent Auditors' review report 86
Condensed Financial Statements 87
Corporate governance, other information about the Bank and its management 181
Addendums to condensed quarterly financial statements 188
Glossary and index of terms included in the condensed quarterly financial statements 192
This translation of the financial statement is for convenience purposes only. The only binding version of the financial statement is the Hebrew version.
2
Condensed Report of the Board of Directors and Management on the Financials Statements as of March 31, 2018
Table of Contents
Introduction 5
Forward-Looking Information 5
Overview, targets and strategy 6
Condensed financial information and key performance indicators for the Bank Group 6
Major risks 9
Business goals and strategy 9
Developments in capital structure 9
Developments in financing sources 10
Significant developments in management of business operations 11
Significant developments in human resources and administration 11
Other matters 11
Explanation and analysis of results and business standing 12
Trends, phenomena and material changes 12
Significant events in the bank group's business 12
The general environment and effect of external factors on the bank group 12
Key and emerging risks 15
Independent auditors' review report 15
Events after the balance sheet date 15
Changes to critical accounting policies and to critical accounting estimates 15
Material developments in revenues, expenses and other comprehensive income 16
Analysis of developments in assets, liabilities, equity and capital adequacy 21
Assets and liabilities 21
Capital, capital adequacy and leverage 26
Other Off Balance Sheet Activity 30
Financial information by operating segments 30
Major Investees 41
Risks overview 43
Developments in risks and risks management 43
Risk factor assessment 45
Credit risk 46
Market risk and interest risk 67
Operating risk 77
Liquidity and financing risk 79
Other risks 80
Compliance and regulatory risk 80
Cross-border and aml risk 80
Reputation risk 81
Strategic risk 81
Policies and critical accounting estimates, controls and procedures 82
Policies and critical accounting estimates 82
Controls and procedures 83

3
List of tables (charts) included in the Condensed Report of the Board of Directors and Management
Statement of profit and loss -highlights 6
Balance sheet -key items 7
Key financial ratios (in percent) 8
Information about official exchange rates and changes there 13
Changes in key equity indices in Israel (in %) 13
Changes in key debenture indices in Israel (in %) 14
Changes in key equity indices world-wide (in %) 14
Analysis of development in financing revenues from current operations 16
Total financing revenues by supervisory operating segment 17
Average balances of interest-bearing assets attributable to operations in Israel in
the various linkage segments 17
Interest spreads (difference between interest income on assets and interest expenses on liabilities)
based on average balances, attributable to operations in Israel in the various linkage segments 17
Development of expenses with respect to credit losses 18
Expenses with respect to credit losses by supervisory operating segments of the Group 18
Cost-Income 19
Development of Group return on equity and ratio of tier i capital
to risk elements, liquidity coverage ratio and leverage ratio at the end of the quarter 20
Earnings and dividends per share 20
Development of key balance sheet items for the Bank Group 21
Loans to the public, net by linkage basis 21
Loans to the public, net by supervisory operating segments 22
Problematic credit risk and non-performing assets before provision for credit losses, in accordance with
provisions for measurement and disclosure of impaired debts, credit risk and provision for credit losses 22
Development of key off balance sheet items for the Bank Group 23
Composition of Group securities by portfolio 24
Distribution of Group security portfolio by linkage segment 24
Distribution of Group security portfolio by issuer type 24
Composition of deposits from the public by linkage segments 25
Composition of deposits from the public by supervisory operating segments 25
Evolution of deposits from the public for the Group by depositor size 25
Composition of shareholders’ equity 26
Supervisory capital and risk assets on the consolidated report 27
Development of Group ratio of capital to risk elements 28
Composition of risk assets and capital requirements with respect to credit risk by exposure group 28
Risk assets and capital requirements with respect to market risk 28
Leverage ratio of the bank 29
Details of dividends distributed by the Bank 29
Details of dividends distributed by the Bank 29

4
Development of off balance sheet monetary assets held on behalf of Bank Group
clients, for which the Bank Group provides management, operating and/or custodial
services management, operating and/or custodial services 30
Financial results by supervisory operating segment 31
Operating results of private banking segment 34
Operating results of micro and small business segment 35
Operating results of medium business segment 36
Operating results of large business segment 37
Operating results of institutional investor segment 38
Operating results of the financial management segment 39
Operating results of overseas operations 40
Mapping of risk factors, their potential impact on the Bank Group and executives 45
Major borrowers 46
Credit for equity transactions 47
Credit to leveraged companies 48
Summary of overall problematic credit risk and non-performing assets before provision
for credit losses, in accordance with provisions measurement and disclosure of impaired
debts, credit risk and provision for credit losses 48
Major risk benchmarks related to credit quality 48
Analysis of movement in balance of provision for credit losses 49
Major risk benchmarks related to provision for credit losses 49
Credit risk to individuals -balances and various risk attributes 50
Information about problematic credit risk before provision for credit losses 51
Expense rate with respect to credit losses to individuals 51
Information about credit risk in the construction and real estate economic sector in Israel,
by real estate collateral type 53
Information about credit risk in the construction and real estate economic sector in Israel,
by asset status 54
Credit risk by economic sector 55
Exposure to Foreign Countries -Consolidated(1) 58
Credit exposure to foreign financial institutions 61
Volume of mortgages granted by the Household segment 63
Details of various risk attributes of the housing loan portfolio 64
Provision for credit losses with respect to housing loans for which a minimum provision for
credit losses was made by extent of arrears 66
VaR for the Bank Group 67
Impact of a parallel shift of the curve by 2% on the economic value of the Bank's portfolio in EVE terms 67
Exposure of the Bank and its subsidiaries to changes in interest rates 68
Fair value of financial instruments before impact of hypothetical changes in interest rates 76
Net fair value of financial instruments, after impact of changes in interest rates 76
Analysis of the sensitivity of Bank Group capital to changes in major exchange rates and in the CPI 77

5
Condensed Report of the Board of Directors and Management
on Financial Statements as of March 31, 2018
Introduction
At the meeting of the Board of Directors of Mizrahi Tefahot Bank held on May 7, 2018, it was resolved to approve and publish the Report of the Board of Directors and Management, the Risks Report and Other Supervisory Disclosures and the condensed consolidated financial statements of Mizrahi Tefahot Bank Ltd. and its subsidiaries as of March 31, 2018.
The Report of the Board of Directors and Management, the Risks Report and Other Supervisory Disclosures of the Bank are prepared in conformity with directives of the Supervisor of Banks.
The condensed financial statements are prepared in conformity with generally accepted accounting policies in Israel (Israeli GAAP) and in accordance with Public Reporting Directives of the Supervisor of Banks.
For most topics, the Supervisor of Banks' directives are based on generally acceptable accounting principles for US banks (see also Note 1 to these financial statements as of December 31, 2017 and Note 1 to these condensed financial statements).
In conformity with the reporting structure stipulated by the Supervisor of Banks, additional information to these financial statements is provided on the Bank website:
www.mizrahi-tefahot.co.il >> about the bank >> investor relations >> financial statements.
This additional information includes a detailed Risks Report in conformity with disclosure requirements of Basel Pillar 3 and in conformity with additional recommendations by the Financial Stability Board (FSB), as well as information on capital instruments issued by the Bank.
Forward-Looking Information
Some of the information in the Report of the Board of Directors and Management, which does not relate to historical facts, constitutes “forward-looking information”, as defined in the Securities Law, 1968 (hereinafter: “the Law”).
Actual Bank results may materially differ from those provided in the forward-looking information due to multiple factors including, inter alia, changes in local and global capital markets, macro-economic changes, geo-political changes, changes in legislation and regulation and other changes outside the Bank's control, which may result in non-materialization of estimates and/or in changes to business plans.
Forward-looking information is characterized by the use of certain words or phrases, such as: "we believe", "expected", "forecasted", "estimating", "intending", "planning", "readying", "could change" and similar expressions, in addition to nouns, such as: "plan", "goals", "desire", "need", "could", "will be". These forward-looking information and expressions involve risks and lack of certainty, because they are based on current assessments by the Bank of future events which includes, inter alia: Forecasts of economic developments in Israel and worldwide, especially the state of the economy, including the effect of macroeconomic and geopolitical conditions; changes and developments in the inter-currency markets and the capital markets, and other factors affecting the exposure to financial risks, changes in the financial strength of borrowers, the public’s preferences, legislation, supervisory regulations, the behavior of competitors, aspects related to the Bank’s image, technological developments and human resources issues.
The information presented here relies, inter alia, on publications of the Central Bureau of Statistics and the Ministry of Finance, on data from the Bank of Israel data, the Ministry of Housing and others who issue data and assessments with regard to the capital market in Israel and overseas as well as forecasts and future assessments on various topics, so that there is a possibility that events or developments predicted to be anticipated would not materialize, in whole or in part.

6
Overview, targets and strategy
This chapter describes major developments in the Bank Group, its operating segments for the first quarter of 2018, performance, risks to which the Bank is exposed as well as targets and strategy. This chapter should be read, as needed, in conjunction with the chapter "Overview, targets and strategy" in the 2017 audited annual financial statements.
Condensed financial information and key performance indicators for the Bank Group )NIS in millions (
For the quarter ended
March 31, 2018
For the quarter ended
December 31, 2017
For the quarter ended
September 30, 2017
For the quarter ended
June 30, 2017
For the quarter ended
March 31, 2017
All of 2017
Statement of profit and loss -highlights Interest revenues, net 1,081 1,136 1,011 1,173 1,027 4,347 Non-interest financing revenues (expenses) 90 55 61 21 (1) 136 Commissions and other revenues 373 409 374 365 369 1,517 Total revenues 1,544 1,600 1,446 1,559 1,395 6,000 Expenses with respect to credit losses 82 60 41 42 49 192 Operating and other expenses(1) 912 939 972 877 823 3,611 Of which: Payroll and associated expenses(1) 569 593 636 555 487 2,271 Pre-tax profit 550 601 433 640 523 2,197 Provision for taxes on profit 192 222 161 231 192 806 Net profit(2) 343 365 261 400 321 1,347
Group net profit in the first quarter of 2018 amounted to NIS 343 million, compared to NIS 321 million in the corresponding period last year -an increase by 6.9%. This reflects annualized return on equity of 10.3%, compared to 10.2% in 2017. According to the Bank's current dividends policy, a dividend of 40% would be distributed with respect to earnings of the first quarter of 2018 (NIS 137.2 million). For more information see chapter "Dividends", on page 29. The following major factors affected Group operating income in the first quarter of 2018 compared to the corresponding period last year: − Total revenues increased in the first quarter of 2018 by 10.9% over the corresponding period last year.
For more information on the effect of the Consumer Price Index and other non-linear effects on revenues, see "Analysis of development of financing revenues from current operations" below.
− Increase in operating and other expenses: Operating and other expenses in the first quarter of 2018 include the "auto pilot" effect on payroll and associated expenses, as well as the immediate effect of the collective bargaining agreement for 2016-2021(3) signed with the Employees’ Union in December 2017.
Data for the first quarter of 2017 exclude the effect of this agreement. This effect was charged to profit and loss in the third quarter of 2017. The accelerated implementation of the voluntary retirement program as from soon after signing the agreement and the effect of savings with respect to the program have yet to be reflected in the financial results on these financial statements. The offsetting effect of the retirement program will be reflected in subsequent reporting periods.
Therefore, operating expenses were mostly affected by higher payroll and associated expenses, for a total increase by 10.8% compared to the corresponding period last year. See below for explanation of each component of operating expenses.
(1) Comparative figures for previous periods were reclassified. For more information with regard to the Supervisor of Banks' circular re improved presentation of expenses with respect to pension and other post-employment benefits, see Note 1.D.4 to the financial statements.
(2) Any mention of "net profit" or "equity" in this Board of Directors' Report refers to net profit and equity attributable to shareholders of the Bank. (3) For more information about the effect of the agreement and implementation of a voluntary retirement program, see Note 22.A.6 to
the 2017 financial statements.

7
Condensed financial information and key performance indicators for the Bank Group -Continued )NIS in millions (
As of March 31,
2018
As of December
31, 2017
As of September
30, 2017
As of June 30,
2017
As of March 31,
2017
Balance sheet -key items
Balance sheet total 242,805 239,572 239,578 235,056 234,071
Loans to the public, net 183,628 181,118 178,621 177,133 173,068
Cash and deposits with banks 43,156 41,130 42,578 39,146 41,683
Securities 9,057 10,133 10,938 10,560 11,791
Buildings and equipment 1,378 1,403 1,359 1,391 1,550
Deposits from the public 187,066 183,573 184,221 180,680 180,722
Debentures and subordinated notes 29,864 29,923 29,129 27,851 26,924
Deposits from banks 885 1,125 1,462 1,454 1,474
Shareholders' equity(1) 13,890 13,685 13,399 13,276 13,015
Quarterly development of balance sheet items shows consistent growth in Bank business:
− Total assets as of March 31, 2018 amounted to NIS 242.8 billion, an increase by NIS 8.7 billion compared to March 31, 2017 (an increase by NIS 3.2 billion compared to the end of 2017).
− Loans to the public, net as of March 31, 2018 amounted to NIS 183.6 billion, an increase by NIS 10.6 billion compared to March 31, 2017 (an increase by NIS 2.5 billion compared to the end of 2017).
− Deposits from the public as of March 31, 2018 amounted to NIS 187.1 billion, an increase by NIS 6.3 billion compared to March 31, 2017 (an increase by NIS 3.5 billion compared to the end of 2017).
− Debentures and subordinated notes as of March 31, 2018 amounted to NIS 29.9 billion, an increase by NIS 2.9 billion compared to March 31, 2017 (essentially unchanged compared to end of 2017).
− Shareholders’ equity as of March 31, 2018 amounted to NIS 13.9 billion, an increase by NIS 0.9 billion compared to March 31, 2017 (an increase by NIS 0.2 billion compared to the end of 2017).
(1) Any mention of "net profit" or "equity" in this Board of Directors' Report refers to net profit and equity attributable to shareholders of the Bank.

8
Key financial ratios (in percent)
For the quarter ended
March 31, 2018
For the quarter ended
December 31, 2017
For the quarter ended
September 30, 2017
For the quarter ended
June 30, 2017
For the quarter ended
March 31, 2017
For 2017
Key performance benchmarks Net profit return on equity(1)(2) 10.3 11.2 (8)8.0 12.7 10.4 10.2
Net profit return on risk assets(1)(2)(3) 0.97 1.05 0.76 1.19 0.97 0.99 Return on average assets(2) 0.57 0.61 0.44 0.68 0.55 0.57
Deposits from the public to loans to the public, net 101.9 101.4 103.4 102.0 104.4 101.4
Ratio of Tier I capital to risk elements 10.16 10.20 10.16 10.15 10.12 10.20 Leverage ratio(4) 5.43 5.48 5.36 5.42 5.27 5.48 (Quarterly) liquidity coverage ratio(5) 125 118 117 122 118 118 Ratio of revenues to average assets 2.59 2.70 2.46 2.69 2.42 2.55
Cost income ratio(6) 59.1 58.7 (8)67.2 56.3 59.0 60.2
Basic earnings per share (in NIS) 1.47 1.58 1.12 1.72 1.38 5.80
Key credit quality benchmarks Ratio of provision for credit losses to total loans to the public 0.81 0.81 0.81 0.82 0.84 0.81 Ratio of impaired debts or debts in arrears 90 days or longer to total loans to the public 1.09 1.02 0.97 0.89 0.95 1.02 Expenses with respect to credit losses to loans to the public, net for the period(2) 0.18 0.13 0.09 0.09 0.12 0.11 Ratio of net accounting write-offs to average loans to the public(2) 0.13 0.11 0.09 0.09 0.11 0.09
Additional information Share price (in NIS) at end of the quarter 67.03 64.19 63.33 63.50 61.44 64.19 Dividends per share (in Agorot)(7) 47 34 52 42 17 144 Ratio of net interest revenues to average assets(2) 1.80 1.91 1.71 2.02 1.78 1.84 Ratio of commissions to average assets(2) 0.62 0.68 0.63 0.62 0.64 0.64
Financial ratios indicate:
− Net profit return in the first quarter of 2018 was at 10.3%, higher than the return for all of 2017.
− The liquidity coverage ratio as of March 31, 2018 is 125%, including the effect of implementation of Bank of Israel directives to apply a reduced withdrawal rate with respect to operational deposits, as from the first quarter of 2018.
− In the first quarter of 2018, the Bank maintained a cost-income ratio lower than 60%.
Items of profit and loss, balance sheet items and various financial ratios are analyzed in detail in the Report of the Board
of Directors and Management, in chapter "Explanation and analysis of results and business standing" and in chapter
"Risks overview", as the case may be.
(1) Any mention of "net profit" or "equity" in this Board of Directors' Report refers to net profit and equity attributable to shareholders of the Bank. (2) Calculated on annualized basis. (3) Net profit to average risk assets. (4) Leverage Ratio -ratio of Tier I capital,(according to Basel rules) to total exposure. This ratio is calculated in conformity with Proper Banking
Conduct Directive 218 (5) Liquidity Coverage Ratio -ratio of total High-Quality Liquid Assets to net cash outflow. This ratio is calculated in conformity with Proper Banking
Conduct Directive 221, in terms of simple averages of daily observations during the reported quarter. (6) Total operating and other expenses to total operating and financing revenues and expenses with respect to credit losses. (7) Therate of dividends is calculated based on the actual amount of dividends actually distributed in the reported quarter. (8) Expenses with respect to signing the MOU with the Employees’ Union and with respect to the negative known CPI in the third quarter of 2017,
resulted in a decrease in return by 4.6% (in absolute terms) and an increase in the cost-income ratio by 13.4% (in absolute terms).

9
Major risks
The Bank's risks mapping produced a listing of the following major risks: Credit risk (and credit concentration), market risk, interest risk (and, in particular, interest risk in the bank portfolio), liquidity risk, operating risk, including , information security and cyber risk, IT risk and legal risk, compliance and regulatory risk, cross-border and AML risk, reputation risk and strategic-business risk. The Bank regularly reviews the risk mapping, so as to ensure that it covers all of its business operations, market conditions and regulatory requirements. For further details see chapter "Major risks" of the 2017 Report of the Board of Directors and Management. For more information about developments in risks, see chapter "Risks overview" below and the detailed Risks Management Report on the Bank website.
For more information about an investigation by the US Department of Justice concerning Bank Group business with its US clients, see Note 10.B.4 to the financial statements.
Business goals and strategy
For more information about the Bank's business goals and strategy for 2017-2021, see chapter "Business goals and strategy" of the 2017 Report of the Board of Directors and Management. In conformity with the resolution by the Bank’s Board of Directors dated November 27, 2017, the Bank signed an agreement with shareholders of Bank Igud Le-Israel Ltd. (hereinafter: "Igud") to acquire 100% of Bank Igud and to merge it with the Bank by way of exchange of shares. Closing of this transaction will allow Mizrahi Tefahot Group to better compete with other major banks, without requiring additional capital to be raised. This merger is in line with the Group's strategic plan and objectives and offers significant potential for market share growth, with a significant increase in the business segments, as well as potential for growth in the return on capital targets compared to the strategic plan. Closing of the acquisition transaction is subject to preconditions. This information constitutes forward-looking information, as defined in the Securities Law, 1968, based on assumptions, facts and data (hereinafter jointly: "assumptions") brought before the Bank’s Board of Directors. These assumptions may not materialize due to factors not all of which are under the Bank's control. For more information about the agreement with Bank Igud shareholders, see chapter "Significant developments in management of business operations" in the Report of the Board of Directors and Management for 2017.
Other than that, since publication of the 2017 financial statements, there were no changes to the Bank's business goals and strategy.
Developments in capital structure
Investments in Bank Capital and Transactions in Bank Shares
For more information about share issuance in conjunction with an employee’ stock option plan, see statement of changes in shareholders equity in the financial statements.
Raising of capital sources
In conjunction with the Bank’s work plan, which is set by the Board of Directors and includes growth objectives for different lines of business, an assessment is made of the impact of achieving these objectives on total risk assets for the Bank, and accordingly on its capital adequacy ratio. Accordingly, along with business and profitability objectives, a plan is set to raise capital sources in order to maintain capital adequacy, in accordance with instructions of the Board of Directors concerning capital adequacy.
The plan includes issue of contingent subordinated notes (Contingent Convertibles -CoCo) as needed and should ensure that the overall capital ratio as from 2018 would be at least 13.4%.
This information constitutes forward-looking information, as defined in the Securities Law, 1968, based on assumptions, facts and data (hereinafter jointly: "assumptions") brought before the Bank’s Board of Directors. These assumptions may not materialize due to factors not all of which are under the Bank's control.

10
Developments in financing sources
Group financing sources include deposits from the public and from other banks, issuance of debentures as well as shareholder equity. The Group selects the mix of financing sources based on its business objectives, including objectives for profitability, return on equity, liquidity, capital adequacy and leverage -subject to statutory limitations applicable to banking corporations and in accordance with the state of the capital market and management forecasts regarding development therein.
Deposits The Bank distinguishes between different source types by term and by client type. The Bank reviews depositor concentration; management and the Board of Directors have specified restrictions and guidelines with regard to concentration risk which apply to individual depositors, liquid means with regard to major / institutional depositors and resource composition. Quantitative and qualitative indicators to be regularly monitored, which estimate change in concentration risk -have been specified as part of liquidity risk management. Total deposits from the public for the Group as of March 31, 2018 amounted to NIS 187.1 billion, compared to NIS 183.6 billion at end of 2017: an increase by 1.9%. Deposits from the public in the NIS-denominated, non-CPI linked segment increased in the first quarter of 2018 by 3.9%; deposits in the CPI-linked segment decreased by 10.4%; and deposits denominated in or linked to foreign currency decreased by 0.1%. For more information see chapter "Analysis of development of assets, liabilities, capital and capital adequacy" below.
Obligatory notes and debentures issued to the public
The Bank is acting to raise long-term sources via issuances, inter alia via Mizrahi Tefahot Issuance Company Ltd. ("Tefahot Issue"), a wholly-owned subsidiary of the Bank. Over the years, Tefahot Issue Company issued subordinated notes to the public under published prospectuses.
As of the balance sheet date, all obligatory notes, including subordinated notes, issued to the public by Tefahot Issue, amounted to NIS 25.7 billion in total par value (as of December 31, 2017: similar), of which NIS 0.7 billion in CoCo (Contingent Convertible) subordinated notes with loss-absorption provisions through principal write-off (compliant with Basel III provisions and recognized by the supervisor of Banks as Tier II capital), as well as NIS 0.5 billion in subordinated notes (included in Tier II capital for maintaining minimum capital ratio and gradually written down, subject to transitional provisions).
In the first quarter of 2018, there were no further issuances by Tefahot Issuances.
Complex capital instruments
The revalued balance of the complex capital instruments as of March 31, 2018 was NIS 3.7 billion (of which NIS 1.7 billion in CoCo contingent subordinated notes), similar to the end of 2017.
The Bank also has subordinated capital notes included in Tier II capital but which do not qualify as supervisory capital pursuant to Basel III directives -and are therefore gradually reduced in conformity with transitional provisions.

11
Significant developments in management of business operations
Agreement with Bank Igud shareholders
For more information see chapter "Significant developments in management of business operations" in the Report of the Board of Directors and Management for 2017.
Sale of assets and liabilities in mortgage portfolio
On March 27, 2018, the Bank and institutional investors signed an agreement for sale of 80% of assets and liabilities in a housing loan portfolio valued in total at NIS 0.9 billion. The loan portfolio consists of housing loans extended by the Bank from April 1, 2014 through September 30, 2015. The loan portfolio sold includes loans with LTV ratios ranging below 60%. The remainder of this loan portfolio is retained by the Bank, so that rights of the buyer and those of the Bank shall have equal precedence (pari passu).
According to a management agreement signed by the parties, the Bank will manage and operate, on behalf of the buyer, the portion of the loan portfolio acquired -in the same manner and based on the same rules used by the Bank to manage and operate its own housing loans, including the portion of the loan portfolio retained by the Bank.
Significant developments in human resources and administration
Developments in labor relations
For more information about an economic arbitration between the Bank and the Mizrahi Tefahot Employees’ Union, see Note 22.A.6. to the 2017 financial statements. Management believes, based on the opinion of legal counsel, that exposure with respect to this arbitration cannot be estimated.
Payroll agreements for employees represented by the Council of Managers and Authorized Signatories
The labor agreement with the Council of Managers is effective through 2017. Negotiations have started in order to sign a new labor agreement for the coming years.
Labor and payroll agreements at the Technology Division Employment terms of employees of Mizrahi Tefahot Technology Division Ltd. (hereinafter: "the Technology Division") are arranged in the labor constitution that was signed in 1989 and in a series of agreements signed by the Technology Division Employee Council, the Labor Union and the Technology Division over the years. Employees of the Technology Division have their pay linked to the pay for Bank employees. In recent months, discussions are under way with the division's employee representation and the MAOF trade union as to implementation of the linkage to the collective bargaining agreement signed by the Bank and the Employees’ Union at Bank Mizrahi Tefahot in late 2017. The Bank made appropriate provisions for this matter.
Other matters
Legal Proceedings
For material changes in legal proceedings to which the Bank is party, see Note 10.B.(2-4) to the financial statements.
Inquiry by the US Department of Justice
For more information about the US DOJ inquiry with regard to Bank Group business with its US clients and for more information about a motion for approval of a derivative claim and motion for approval of a class
action lawsuit on this matter, see Note 10.B, sections 3.A and 4 to the financial statements.

12
Explanation and analysis of results and business standing
This chapter includes a description of trends, phenomena, developments and material changes with regard to results and business standing, including analysis of revenues, expenses and profit. It also describes the results of the Bank's supervisory operating segments and operating results for holdings in major investees.
Trends, phenomena and material changes
Significant Events in the Bank Group's Business
Agreement with Bank Igud shareholders
For more information see chapter "Business goals and strategy" above and chapter "Significant developments in management of business operations" in the Report of the Board of Directors and Management for 2017.
The General Environment and Effect of External Factors on the Bank Group
Major developments in the banking industry in Israel and overseas
For more information about trends in recent years in the banking sector in Israel and overseas, see chapter "Explanation and analysis of results and business standing" of the Report of the Board of Directors and Management for 2017.
Other developments in 2018:
On February 25, 2018, the Bank of Israel issued the final outline designed to reduce the cross commission in deferred charge transactions, in multiple stages in 2019-2023, from 0.7% of transaction amount today, down to 0.5%. Furthermore, an outline was specified to reduce the cross commission for immediate charge transactions, from 0.3% of transaction amount today, down to 0.25%.
For more information about the outline to reduce the cross commission, see chapter "Corporate Governance, Audit, Other Information about the Bank and Management thereof" (Legislation and Supervision of Bank Group Operations) of these financial statements.
Developments in the Israeli and global economy in the first quarter of 2018
Israeli economy
Real Developments
In 2017, GDP growth was at 3.3%, compared to 4.0% in 2016 and to 2.6% in 2015. The GDP growth rate was more moderate due to the following effects: Decline in consumption of durable goods, after excessive growth in this item in 2016, due to increased purchasing of vehicles following changes to green taxation rules and more moderate growth in investments in the economy and in residential construction. Conversely, exports grew at an accelerated pace, led by growth in export of services. Bank of Israel estimates that economic indicators for the first quarter of 2018 indicate a strong growth rate, which may even exceed the potential growth rate of the economy.
The labor market continues to indicate strong activity at near-full employment. In the first quarter of 2018, the average unemployment rate declined to 3.7%, compared to an average 4.2% for all of 2017. The average participation rate in the labor force decreased slightly in the first quarter of this year, to 63.8% compared to 64.0% for all of 2017.
Inflation and exchange rates
In the first quarter of 2018, the Consumer Price Index decreased by 0.1%, compared to an increase by 0.1% in the corresponding period last year. The lower CPI resulted primarily from lower prices of clothing and footwear as well as fruits and vegetables. The lower prices were offset by higher prices of transportation and communications, education, culture and entertainment and food prices. In the twelve months ended March 2018, the CPI increased by 0.2%.

13
Below is information about official exchange rates and changes there to:
March 31, 2018 December 31, 2017 Change in %
Exchange rate of:
USD (in NIS) 3.514 3.467 1.4
EUR (in NIS) 4.329 4.153 4.2
On May 3, 2018, the USD/NIS exchange rate was 3.632 -a 3.4% devaluation since March 31, 2018. The EUR/NIS exchange rate on this date was 4.347 -a devaluation of 0.4% since March 31, 2018.
Monetary policy
In the first quarter of 2018, the Bank of Israel interest rate was unchanged at 0.1%. The monetary policy of the Bank of Israel year to date was impacted, inter alia, by a slight devaluation of the NIS vis-à-vis the currency basket, moderate inflationary expectations and continued expansive monetary policy in major world economies, along with higher risk due to concerns about a developing trade war and higher geo-political tensions.
Fiscal policy
At the end of the first quarter of 2018, the government budget recorded a NIS 2.1 billion cumulative deficit, compared to a NIS 2.3 billion cumulative budget deficit in the corresponding period last year. The deficit rate in relation to the GDP for the 12 months ended March 2018 was 1.9%, compared to 2.3% in the corresponding period last year. Note that the deficit target for 2018 is 2.9%. In the first quarter of this year, expenditure by Government ministries increased by 9.3% compared to the corresponding period last year. Total tax collection increased in the first quarter of 2018 by a nominal 6.3% compared to the corresponding period last year.
Residential construction and the mortgage market
According to data from the Central Bureau of Statistics, in the first two months of 2018 demand for new apartments (apartments sold and apartments constructed not for sale) was 5.7 thousand apartments, a decrease by 19% over the corresponding period last year and an increase by 32% over the corresponding period in 2016. The decrease was due, inter alia, to housing buyers (who do not currently own housing) waiting to win an apartment in the "Buyer price" program and to lower demand for apartments by investors. In the first quarter of 2018, housing loans given to the public amounted to NIS 14.3 billion, compared to NIS 13.1 billion in the corresponding period last year and NIS 15.0 billion in the corresponding period in 2016. According to data from the Central Bureau of Statistics, housing prices in terms of the most recent 12 months, increased in February 2018 by 0.8%, compared to 2.2% in 2017 and to 6.7% in 2016.
Capital market
Trading on global equity markets in the first quarter of 2018 was negative, led by stock exchanges in the USA and in Europe and carried over by major equity benchmarks in the Israeli market.
The following are changes in key equity indices in Israel (in %):
CPI
2018
First Quarter
2017
Fourth Quarter
2017
Third Quarter
2017
Second Quarter
2017
First Quarter
Tel-Aviv 35 (4.9) 6.2 (0.9) 2.6 (5.0)
Tel-Aviv 125 (4.0) 5.6 0.3 3.0 (2.4)
Tel-Aviv 90 (1.7) 4.6 2.6 4.1 8.4
The average daily trading volume of shares and convertible securities in the first quarter of 2018 amounted to NIS 1.6 billion on average -similar to the average trading volume for the corresponding period last year.
14
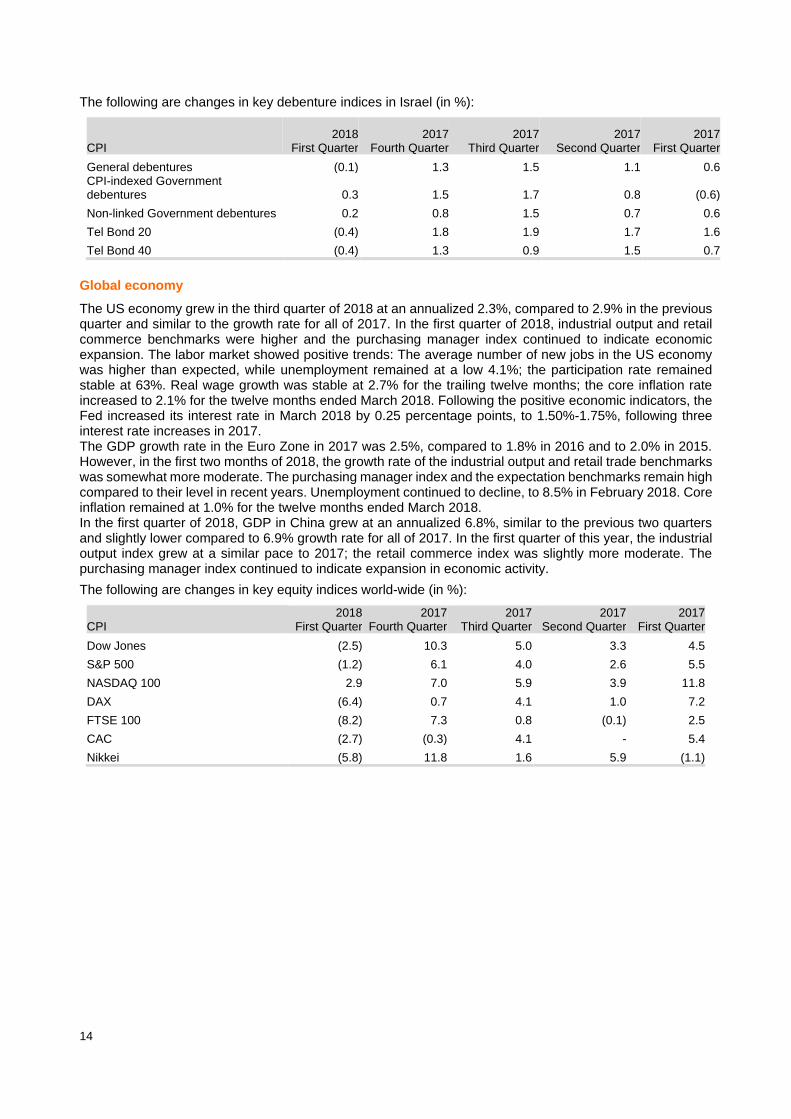
The following are changes in key debenture indices in Israel (in %):
CPI 2018
First Quarter 2017
Fourth Quarter 2017
Third Quarter 2017
Second Quarter 2017
First Quarter
General debentures (0.1) 1.3 1.5 1.1 0.6 CPI-indexed Government debentures 0.3 1.5 1.7 0.8 (0.6)
Non-linked Government debentures 0.2 0.8 1.5 0.7 0.6
Tel Bond 20 (0.4) 1.8 1.9 1.7 1.6
Tel Bond 40 (0.4) 1.3 0.9 1.5 0.7
Global economy
The US economy grew in the third quarter of 2018 at an annualized 2.3%, compared to 2.9% in the previous quarter and similar to the growth rate for all of 2017. In the first quarter of 2018, industrial output and retail commerce benchmarks were higher and the purchasing manager index continued to indicate economic expansion. The labor market showed positive trends: The average number of new jobs in the US economy was higher than expected, while unemployment remained at a low 4.1%; the participation rate remained stable at 63%. Real wage growth was stable at 2.7% for the trailing twelve months; the core inflation rate increased to 2.1% for the twelve months ended March 2018. Following the positive economic indicators, the Fed increased its interest rate in March 2018 by 0.25 percentage points, to 1.50%-1.75%, following three interest rate increases in 2017. The GDP growth rate in the Euro Zone in 2017 was 2.5%, compared to 1.8% in 2016 and to 2.0% in 2015. However, in the first two months of 2018, the growth rate of the industrial output and retail trade benchmarks was somewhat more moderate. The purchasing manager index and the expectation benchmarks remain high compared to their level in recent years. Unemployment continued to decline, to 8.5% in February 2018. Core inflation remained at 1.0% for the twelve months ended March 2018. In the first quarter of 2018, GDP in China grew at an annualized 6.8%, similar to the previous two quarters and slightly lower compared to 6.9% growth rate for all of 2017. In the first quarter of this year, the industrial output index grew at a similar pace to 2017; the retail commerce index was slightly more moderate. The purchasing manager index continued to indicate expansion in economic activity.
The following are changes in key equity indices world-wide (in %):
CPI 2018
First Quarter 2017
Fourth Quarter 2017
Third Quarter 2017
Second Quarter 2017
First Quarter
Dow Jones (2.5) 10.3 5.0 3.3 4.5
S&P 500 (1.2) 6.1 4.0 2.6 5.5
NASDAQ 100 2.9 7.0 5.9 3.9 11.8
DAX (6.4) 0.7 4.1 1.0 7.2
FTSE 100 (8.2) 7.3 0.8 (0.1) 2.5
CAC (2.7) (0.3) 4.1 - 5.4
Nikkei (5.8) 11.8 1.6 5.9 (1.1)

15
Key and emerging risks
In its operations, the Bank is exposed to a succession of risks which may potentially impact its financial results and its image. As part of the risks mapping, the Bank reviews the top risks, existing (or new) risks which may materialize over the coming 12 months which potentially may materially impact the Bank's financial results and stability, such as: credit, interest and liquidity risks. The Bank also identifies emerging risks, which may materialize over the longer term and subject to uncertainty with regard to their nature and impact on the Bank. Of these risks, one may note the following: information security and cyber risks, IT risk, reputation risk as well as compliance and regulatory risks. As noted, the risks mapping is regularly reviewed to ensure that it encompasses all business operations at the Bank, market conditions and regulatory requirements. In the first quarter of 2018 there were no significant loss events. For more information, including analysis of major risks to which the Bank is exposed and an overview of their management and evolution in the reported period, see chapter "Risks Overview" as well as the Detailed Risks Report on the Bank website
Independent Auditors' review report
The Independent Auditor has drawn attention in their review report to Note 8, section 3 and to Note 10.B.3(a-d) to the financial statements, with regard to contingent liabilities at the Bank, including claims filed against the Bank, including motions for class action status, as well as to Note 10.B.4 with regard to the US DOJ inquiry with regard to Bank Group business with its US clients.
Events after the balance sheet date
For more information about distribution of dividends with respect to earnings of the first quarter of 2018, see chapter "Analysis of developments in assets, liabilities, equity and capital adequacy" below and the statement of changes to shareholders’ equity and the Note "Events after the balance sheet date" of these condensed financial statements.
Changes to critical accounting policies and to critical accounting estimates
As stated in Note 1.C. to these financial statements, the group-based provision for credit losses is based, inter alia, on historical loss rates in various economic sectors, divided into problematic and non-problematic debt, for the 8 years ended on the report date. For more information about application of the Supervisor of Banks' directives concerning sector liability limit, see Note 1.D.3.

16
Material developments in revenues, expenses and other comprehensive income
Group net profit in the first quarter of 2018 amounted to NIS 343 million, compared to NIS 321 million in the corresponding period last year -an increase by 6.9%. This reflects annualized return on equity of 10.3%, compared to 10.2% in 2017.
Analysis of developments in revenues, expenses and other comprehensive income
Net interest revenues and non-interest financing revenues in the first quarter of 2018 amounted to NIS 1,171 million, as described on these financial statements, compared to NIS 1,026 million in the corresponding period last year, an increase by 14.1%.
Net interest revenues and non-interest financing revenues(1) from current operations in the first quarter of 2018 amounted to NIS 1,136 million, as described below, compared to NIS 1,047 million in the corresponding period last year, an increase by 8.5%.
Below is analysis of development in financing revenues from current operations (NIS in millions):
2018 First
Quarter
2017
Fourth
Quarter
2017
Third
Quarter
2017
Second
Quarter
2017
First
Quarter
Change in % First quarter of
2018 to first quarter of 2017
Interest revenues, net 1,081 1,136 1,011 1,173 1,027
Non-interest financing revenues (expenses) (1) 90 55 61 21 (1)
Total financing revenues 1,171 1,191 1,072 1,194 1,026 14.1
Less:
Effect of CPI (39) 10 (62) 105 (21) Revenues from collection of interest on problematic debts 12 10 11 9 13 Gains from realized debentures and available-for-sale securities and gains from debentures held for trading, net 2 2 16 18 7
Effect of accounting treatment of derivatives at fair value and others(2) 60 45 12 (5) (20)
Total effects other than current operations 35 67 (23) 127 (21)
Total financing revenues from current operations 1,136 1,124 1,095 1,067 1,047 8.5
(1) Non-interest financing revenues include effect of fair value and others and expense with respect to linkage differentials on CPI derivatives, where the corresponding revenue is recognized as interest revenues, in conformity with accounting rules.
(2) The effect of accounting treatment of derivatives at fair value is due to the difference between accounting treatment of balance sheet instruments, charged to the profit and loss statement on an accrual basis (interest, linkage differentials and exchange rate differentials only), vs. derivatives measured at their fair value.
Other effects include:
- Other impacts include the effect of Bank coverage against tax exposure with respect to overseas investments, by allocating excess financing sources against such investments.
17
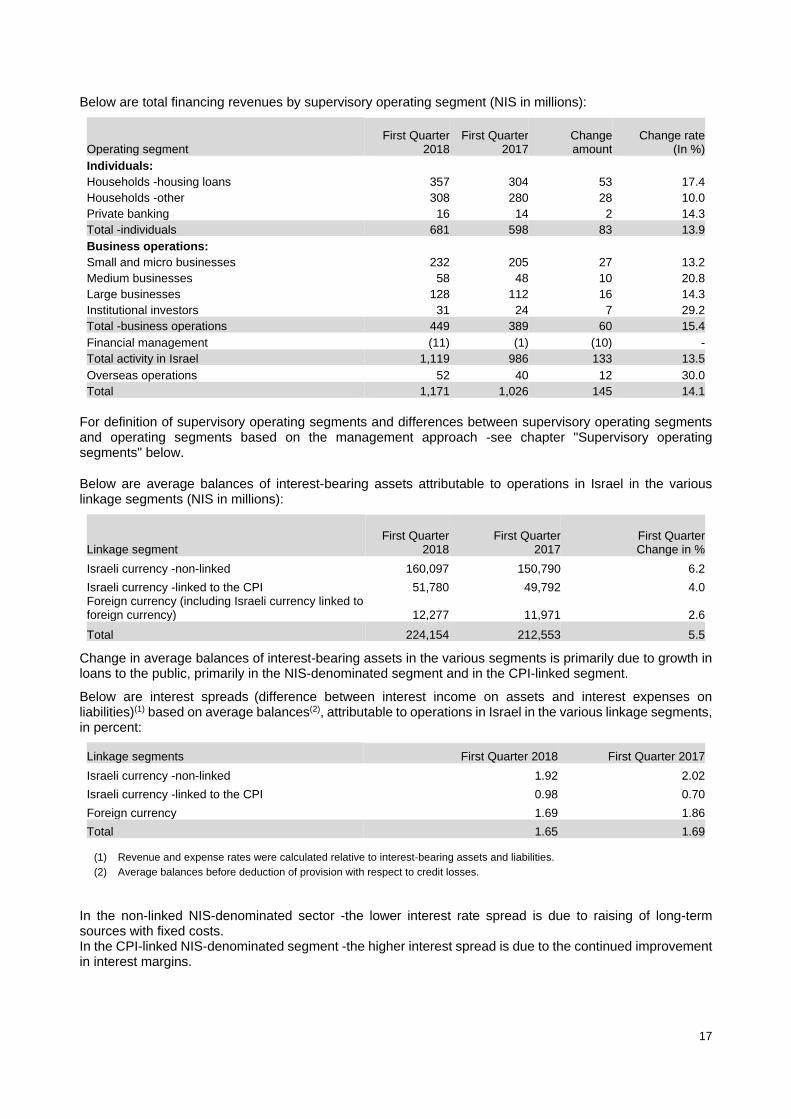
Below are total financing revenues by supervisory operating segment (NIS in millions):
Operating segment First Quarter
2018 First Quarter
2017 Change amount
Change rate (In %)
Individuals: Households -housing loans 357 304 53 17.4
Households -other 308 280 28 10.0
Private banking 16 14 2 14.3
Total -individuals 681 598 83 13.9
Business operations: Small and micro businesses 232 205 27 13.2
Medium businesses 58 48 10 20.8
Large businesses 128 112 16 14.3
Institutional investors 31 24 7 29.2
Total -business operations 449 389 60 15.4
Financial management (11) (1) (10) -
Total activity in Israel 1,119 986 133 13.5
Overseas operations 52 40 12 30.0
Total 1,171 1,026 145 14.1
For definition of supervisory operating segments and differences between supervisory operating segments and operating segments based on the management approach -see chapter "Supervisory operating segments" below.
Below are average balances of interest-bearing assets attributable to operations in Israel in the various linkage segments (NIS in millions):
Linkage segment First Quarter
2018 First Quarter
2017 First Quarter Change in %
Israeli currency -non-linked 160,097 150,790 6.2
Israeli currency -linked to the CPI 51,780 49,792 4.0 Foreign currency (including Israeli currency linked to foreign currency) 12,277 11,971 2.6
Total 224,154 212,553 5.5
Change in average balances of interest-bearing assets in the various segments is primarily due to growth in loans to the public, primarily in the NIS-denominated segment and in the CPI-linked segment.
Below are interest spreads (difference between interest income on assets and interest expenses on liabilities)(1) based on average balances(2), attributable to operations in Israel in the various linkage segments, in percent:
Linkage segments First Quarter 2018 First Quarter 2017
Israeli currency -non-linked 1.92 2.02
Israeli currency -linked to the CPI 0.98 0.70
Foreign currency 1.69 1.86
Total 1.65 1.69
(1) Revenue and expense rates were calculated relative to interest-bearing assets and liabilities. (2) Average balances before deduction of provision with respect to credit losses.
In the non-linked NIS-denominated sector -the lower interest rate spread is due to raising of long-term sources with fixed costs. In the CPI-linked NIS-denominated segment -the higher interest spread is due to the continued improvement in interest margins.

18
In the foreign currency segment -the decrease in interest spread is due to FED interest rate increases in December 2017 and in March 2018. Given the structure of sources and uses at the Bank, concurrent revenue is included under derivatives operations. For composition of interest spreads by different criteria (activity type, linkage segment and quantity and price analysis), more information about non-interest bearing assets and liabilities and information about overseas activities, see appendix "Interest Revenue and Expense Rates" to the quarterly financial statements. Expenses with respect to credit losses for the Group amounted to NIS 82 million in the first quarter of 2018, or an annualized rate of 0.18% of total loans to the public, net, compared with NIS 49 million in the corresponding period last year -an annualized rate of 0.12% of total loans to the public, net in the corresponding period last year -a decrease by NIS 33 million in total.
Development of expenses with respect to credit losses (NIS in millions) is as follows:
First Quarter 2018 First Quarter 2017
Provision for credit losses on individual basis (including accounting write-offs) 55 41 Provision for credit losses on Group basis: By extent of arrears - (5) Other 27 13 Total expenses with respect to credit losses 82 49
Rate of the expenses with respect to credit losses as percentage of total loans to the public, net (annualized) 0.18% 0.12%
Of which: With respect to commercial loans other than housing loans 0.49% 0.35%
Of which: With respect to housing loans 0.02% -
Total expenses with respect to credit losses were affected by a decrease in collection of debt previously written-off, compared to the corresponding period last year and by an increase in the group-based provision due to the increase in loans to the public in this quarter.
Below are details of expenses with respect to credit losses by supervisory operating segments of the Group (NIS in millions):
Operating segment First Quarter 2018 First Quarter 2017
Individuals: Households -housing loans 6 - Households -other 22 24 Private banking - - Total -individuals 28 24
Business operations: Small and micro businesses 38 32 Medium businesses 4 (3) Large businesses 8 (2) Institutional investors - (2) Total -business operations 50 25
Financial management 1 (1) Total activity in Israel 79 48
Overseas operations 3 1 Total 82 49
For definition of supervisory operating segments and differences between supervisory operating segments and operating segments based on the management approach -see chapter "Supervisory operating segments" below.
For more information about analysis of development of loans to the public, see chapter "Analysis of composition of assets, liabilities, capital and capital adequacy" below.
For more information about analysis of credit risk, see chapter "Credit risk" below and the detailed Risks Management Report on the Bank website.
Non-interest revenues amounted to NIS 463 million in the first quarter of 2018, compared with NIS 368 million in the corresponding period last the third -an increase by NIS 95 million. See explanation below.

19
Non-interest financing revenues (expenses) in the first quarter of 2018 amounted to NIS 90 million, compared to expenses amounting to NIS 1 million in the corresponding period last year.
This item includes, inter alia, the effect of fair value, gains (losses) from transactions in debentures and securities and expenses (revenues) with respect to linkage differentials on CPI derivatives, where the corresponding revenues (expenses) are recognized as interest revenues, in conformity with accounting rules. See analysis of financing revenues from current operations above.
Commission revenues in the first quarter of 2018, amounted to NIS 362 million compared with NIS 357 million in the corresponding period last year -an increase by NIS 5 million. This is due to continued growth in business volume and despite the negative effect of various regulatory directives.
Other revenues in the first quarter of 2018, amounted to NIS 11 million compared with NIS 12 million in the corresponding period last year -a decrease by NIS 1 million.
Operating and other expenses in the first quarter of 2018, amounted to NIS 912 million compared with NIS 823 million in the corresponding period last year -an increase by NIS 89 million.
See details by operating expense component below.
Payroll and associated expenses amounted to NIS 569 million in the first quarter of 2018, compared with NIS 487 million in the corresponding period last year -an increase by NIS 82 million. Payroll and associated expenses in the first quarter of 2018 include the "auto pilot" effect on payroll and associated expenses, as well as the immediate effect of the collective bargaining agreement for 2016-2021(1) signed with the Employees’ Union in December 2017. Data for the first quarter of 2017, as noted above, exclude the effect of this agreement. This effect was charged to profit and loss in the third quarter of 2017. The accelerated implementation of the voluntary retirement program as from soon after signing the agreement and the effect of savings with respect to the program have yet to be reflected in the financial results on these financial statements. The offsetting effect of the retirement program will be reflected in subsequent reporting periods.
Maintenance and depreciation expenses for buildings and equipment amounted to NIS 189 million in the first quarter of 2018, compared with NIS 186 million in the corresponding period last year - an increase by 1.6%.
Other expenses in the first quarter of 2018 amounted to NIS 154 million, compared to NIS 150 million in the corresponding period last year - an increase by 2.7%.
Cost-Income ratio information(2) (in percent):
2018 First Quarter
2017 Fourth Quarter
2017 Third Quarter
2017 Second Quarter
2017 First Quarter
2017 Annual
Cost-income ratio 59.1 58.7 67.2(3) 56.3 59.0 60.8
(1) For more information about the effect of the agreement and implementation of a voluntary retirement program, see Note 22.A.6 to the 2017 financial statements.
(2) Total operating and other expenses to total operating and financing revenues and expenses with respect to credit losses.
(3) Expenses in respect of the memorandum of understanding with the Employees’ Union and in respect of the negative known CPI resulted in an increase in the cost-income ratio in the third quarter of 2017, by 13.4% (absolute).
Pre-tax profit for the Group in the first quarter of 2018 amounted to NIS 550 million, compared to NIS 523 million in the corresponding period last year -an increase by NIS 27 million. See detailed explanation above.
The rate of provision for taxes on profit in the first quarter of 2018 was 34.9% -compared to 36.7% in the corresponding period last year. The rate of provision for taxes was impacted by a decrease in the statutory tax rate applicable to the Bank and by the effect of Bank coverage against tax exposure with respect to overseas investments, by allocating excess financing sources against such investments.
The Bank’s share of after-tax profit of associated companies - in the first quarter of 2018 there was no profit with respect to associated companies, compared to loss of NIS 1 million with respect to associated companies in the corresponding period last year.
The share of the non-controlling interests in net results of subsidiaries attributable to Bank Yahav in the first quarter of 2018 amounted to NIS 15 million, compared to NIS 9 million in the corresponding period last year.

20
Net profit attributable to shareholders of the Bank in the first quarter of 2018 amounted to NIS 343 million, compared to NIS 321 million in the corresponding period last year.
Other comprehensive income attributable to shareholders of the Bank decreased by NIS 47 million compared to the corresponding period last year. The change is primarily due to adjustments with respect to employees’ benefits and to adjustments with respect to presentation of securities available for sale at fair value. See Note 4 to the financial statements for details.
Below is the development of Group return(1) on equity(2) and ratio of Tier I capital to risk elements liquidity coverage ratio(3) and leverage ratio(4) at the end of the quarter (in %):
2018 First
Quarter
2017 Fourth
Quarter
2017 Third
Quarter
2017 Second Quarter
2017 First
Quarter All of 2017
Net return on equity 10.3 11.2 (5)8.0 12.7 10.4 10.2
Ratio of Tier I capital to risk elements at end of quarter 10.16 10.20 10.16 10.15 10.12 10.20
(Quarterly) liquidity coverage ratio (6)125 118 117 122 118 118
Leverage ratio at end of quarter 5.43 5.48 5.36 5.42 5.27 5.48
(1) Annualized return.
(2) Return on average shareholders' equity, including "total capital resources", as presented in reporting of revenue and expense rates, less average balance of minority interests and less/plus the average balance of unrealized gains/losses from adjustment to fair value of debentures held for trading as well as gains/losses from debentures available for sale.
(3) Liquidity Coverage Ratio -ratio of total High-Quality Liquid Assets to net cash outflow. This ratio is calculated in conformity with Proper Banking Conduct Directive 221, in terms of simple averages of daily observations during the reported quarter.
(4) Leverage Ratio -ratio of Tier I capital, according to Basel rules, to total exposure. This ratio is calculated in conformity with Proper Banking Conduct Directive 218
(5) Expenses in respect of the memorandum of understanding with the Employees’ Union and in respect of the negative known CPI resulted in a decrease in the rate of return in the third quarter of 2017, by 4.6% (absolute).
(6) Includes the effect of implementation of Bank of Israel directives to apply a reduced withdrawal rate with respect to operational deposits, as from the first quarter of 2018.
Earnings and dividends per share
Earnings and dividends per ordinary, NIS 0.1 par value share are as follows (in NIS):
First Quarter 2018
First Quarter 2017
All of 2017
Basic earnings per share 1.47 1.38 5.80
Diluted earnings per share 1.46 1.37 5.76
Dividends per share 47.03 17.14 143.91

21
Analysis of developments in assets, liabilities, equity and capital adequacy
Assets and liabilities
Development of key balance sheet items for the Bank Group (NIS in millions) is as follows:
March 31, 2018
March 31, 2017
December 31, 2017
Change in % over
March 31, 2017
Change in % over
December 31, 2017
Balance sheet total 242,805 234,071 239,572 3.7 1.3
Cash and deposits with banks 43,156 41,683 41,130 3.5 4.9
Loans to the public, net 183,628 173,068 181,118 6.1 1.4
Securities 9,057 11,791 10,133 (23.2) (10.6)
Buildings and equipment 1,378 1,550 1,403 (11.1) (1.8)
Deposits from the public 187,066 180,722 183,573 3.5 1.9
Deposits from banks 885 1,474 1,125 (40.0) (21.3)
Debentures and subordinated notes 29,864 26,924 29,923 10.9 (0.2)
Shareholders’ equity 13,890 13,015 13,685 6.7 1.5
Cash and deposits with banks -the balance of cash and deposits with banks increased in the first quarter of 2018 by NIS 2.0 billion. The increase in cash balance is part of on-going management of Bank liquidity.
Loans to the public, net -The ratio of loans to the public, net to total assets on the consolidated balance sheet as of March 31, 2018 was 76%, similar to the end of 2017. Loans to the public, net for the Group increased in the first quarter of 2017 by NIS 2.5 billion, an increase by 1.4%.
For more information about on-balance sheet and off-balance sheet credit risk, development of problematic debts and various risk benchmarks with regard to housing loans, see chapter "Risks" below and the Detailed Risks Report on the Bank website.
Loans to the public, net by linkage basis (NIS in millions) are as follows:
March 31, 2018
March 31, 2017
December 31, 2017
Change in % over March 31,
2017
Change in % over
December 31, 2017
Israeli currency Non-linked 122,386 113,615 120,730 7.7 1.4
CPI-linked 50,660 49,387 50,293 2.6 0.7
Foreign currency and foreign
currency linked 10,582 10,066 10,095 5.1 4.8
Total 183,628 173,068 181,118 6.1 1.4

22
Loans to the public, net by supervisory operating segments (NIS in millions) are as follows:
March 31, 2018
March 31, 2017
December 31, 2017
Change in % over
March 31, 2017
Change in % over
December 31, 2017
Individuals:
Households -housing loans 120,721 115,378 119,556 4.6 1.0
Households -other 20,115 18,591 19,825 8.2 1.5
Private banking 99 98 119 1.0 (16.8)
Total -individuals 140,935 134,067 139,500 5.1 1.0
Business operations:
Small and micro businesses 17,184 15,617 16,717 10.0 2.8
Medium businesses 5,906 4,907 5,779 20.4 2.2
Large businesses 14,735 13,801 14,846 6.8 (0.7)
Institutional investors 1,258 1,541 1,160 (18.4) 8.4
Total -business operations 39,083 35,866 38,502 9.0 1.5
Overseas operations 3,610 3,135 3,116 15.2 15.9
Total 183,628 173,068 181,118 6.1 1.4
For definition of supervisory operating segments and differences between supervisory operating segments and operating segments based on the management approach -see chapter "Supervisory operating segments" below.
Below are details of problematic credit risk and non-performing assets before provision for credit losses, in accordance with provisions for measurement and disclosure of impaired debts, credit risk and provision for credit losses:
Reported amounts (NIS in millions)
As of March 31,
2018 Credit risk(1)
On balance
sheet
As of March 31,
2018 Credit risk(1)
Off balance
sheet
As of March
31, 2018 Credit risk(1) Total
As of March 31,
2017 Credit risk(1)
On balance
sheet
As of March 31, 2017
Credit risk(1) Off balance
sheet
As of March
31, 2017 Credit risk(1) Total
As of December 31, 2017
Credit risk(1)
On balance
sheet
As of December
31, 2017 Credit risk(1)
Off balance
sheet
As of Decemb
er 31, 2017
Credit risk(1) Total
1. Problematic credit risk
Impaired credit risk 870 165 1,035 668 194 862 723 165 888
Inferior credit risk 278 2 280 436 - 436 315 - 315 Credit risk under special supervision(2) 1,531 28 1,559 1,448 65 1,513 1,499 30 1,529
Total problematic credit risk 2,679 195 2,874 2,552 259 2,811 2,537 195 2,732
Of which: Non-impaired debts in arrears 90 days or longer(2) 1,145 985 1,136
2. Non-performing assets(3) 843 637 697
(1) On- and off-balance sheet credit is stated before impact of provision for credit losses, and before impact of deductible collateral with respect to indebtedness of borrower and of borrower group.
(2) Including with respect to housing loans for which a provision was made by extent of arrears, and housing loans for which no provision was made by extent of arrears and which are in arrears of 90 days or longer, amounting to NIS 1,087 million (as of March 31, 2017 -NIS 900 million; as of December 31, 2017 -NIS 1,072 million).
(3) Assets not accruing interest.
For more information about credit risk with respect to individuals (excluding housing loans), credit risk in the construction and real estate economic sector in Israel and housing loan risk, see chapter "Credit risk".
See Notes 6 and 13 to the financial statements for further information.
23
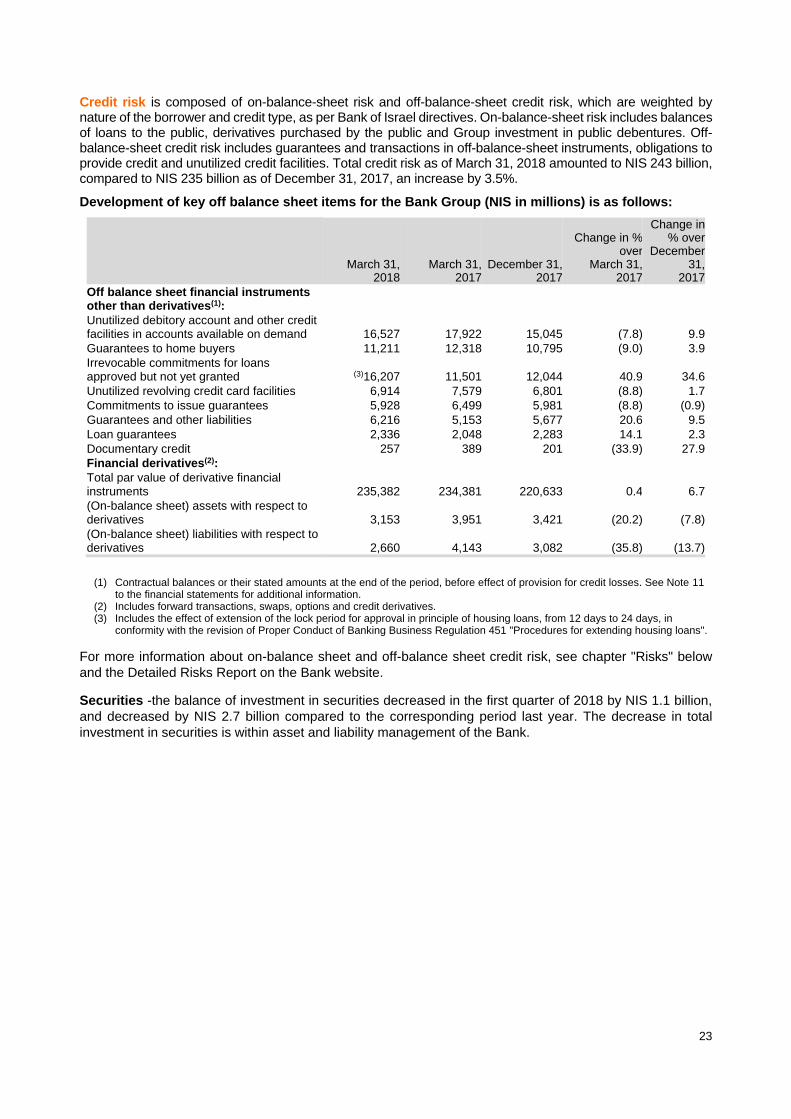
Credit risk is composed of on-balance-sheet risk and off-balance-sheet credit risk, which are weighted by nature of the borrower and credit type, as per Bank of Israel directives. On-balance-sheet risk includes balances of loans to the public, derivatives purchased by the public and Group investment in public debentures. Off-balance-sheet credit risk includes guarantees and transactions in off-balance-sheet instruments, obligations to provide credit and unutilized credit facilities. Total credit risk as of March 31, 2018 amounted to NIS 243 billion, compared to NIS 235 billion as of December 31, 2017, an increase by 3.5%.
Development of key off balance sheet items for the Bank Group (NIS in millions) is as follows:
March 31, 2018
March 31, 2017
December 31, 2017
Change in % over
March 31, 2017
Change in % over
December 31,
2017
Off balance sheet financial instruments other than derivatives(1): Unutilized debitory account and other credit facilities in accounts available on demand 16,527 17,922 15,045 (7.8) 9.9
Guarantees to home buyers 11,211 12,318 10,795 (9.0) 3.9
Irrevocable commitments for loans approved but not yet granted (3)16,207 11,501 12,044 40.9 34.6
Unutilized revolving credit card facilities 6,914 7,579 6,801 (8.8) 1.7
Commitments to issue guarantees 5,928 6,499 5,981 (8.8) (0.9)
Guarantees and other liabilities 6,216 5,153 5,677 20.6 9.5
Loan guarantees 2,336 2,048 2,283 14.1 2.3
Documentary credit 257 389 201 (33.9) 27.9
Financial derivatives(2): Total par value of derivative financial instruments 235,382 234,381 220,633 0.4 6.7
(On-balance sheet) assets with respect to derivatives 3,153 3,951 3,421 (20.2) (7.8)
(On-balance sheet) liabilities with respect to derivatives 2,660 4,143 3,082 (35.8) (13.7)
(1) Contractual balances or their stated amounts at the end of the period, before effect of provision for credit losses. See Note 11 to the financial statements for additional information.
(2) Includes forward transactions, swaps, options and credit derivatives. (3) Includes the effect of extension of the lock period for approval in principle of housing loans, from 12 days to 24 days, in
conformity with the revision of Proper Conduct of Banking Business Regulation 451 "Procedures for extending housing loans". For more information about on-balance sheet and off-balance sheet credit risk, see chapter "Risks" below
and the Detailed Risks Report on the Bank website. Securities -the balance of investment in securities decreased in the first quarter of 2018 by NIS 1.1 billion,
and decreased by NIS 2.7 billion compared to the corresponding period last year. The decrease in total
investment in securities is within asset and liability management of the Bank.

24
Composition of Group securities by portfolio (NIS in millions) is as follows:
March 31, 2018
Carrying amount
Amortized cost (for shares -cost)
Unrecognized gains from adjustments to
fair value
Unrecognized losses from adjustments to
fair value Fair
value(1)
Securities held to maturity 2,507 2,507 64 - 2,571 Securities available for sale 6,356 6,439 (2)9 (2)(92) 6,356 Securities held for trade 194 197 - (3)(3) 194 Total securities 9,057 9,143 73 (95) 9,121
March 31, 2017
Carrying amount
Amortized cost (for shares -cost)
Unrecognized gains from adjustments to
fair value
Unrecognized losses from adjustments to
fair value Fair
value(1)
Securities held to maturity 3,250 3,250 76 - 3,326 Securities available for sale 8,339 8,373 (2)19 (2)(53) 8,339 Securities held for trade 202 202 - - 202 Total securities 11,791 11,825 95 (53) 11,867
December 31, 2017
Carrying amount
Amortized cost (for shares -cost)
Unrecognized gains from adjustments to
fair value
Unrecognized losses from adjustments to
fair value Fair
value(1)
Securities held to maturity 3,267 3,267 75 - 3,342 Securities available for sale 6,657 6,678 (2)24 (2)(45) 6,657 Securities held for trade 209 209 - - 209 Total securities 10,133 10,154 99 (45) 10,208
(1) Fair value data are generally based on stock exchange prices, which do not necessarily reflect the price to be obtained on the sale of a large volume of securities.
(2) Included in shareholders' equity in "adjustments on presentation of securities available for sale at fair value". (3) Charged to statement of profit and loss but not yet realized.
Distribution of Group security portfolio by linkage segment (NIS in millions) is as follows:
March 31, 2018
March 31, 2017
December 31, 2017
Change in % over March 31,
2017
Change in % over December
31,2017
Israeli currency Non-linked 3,261 5,993 3,859 (45.6) (15.5) CPI-linked 677 773 753 (12.4) (10.1) Foreign currency and foreign currency linked 5,030 4,932 5,422 2.0 (7.2) Non-monetary items 89 93 99 (4.3) (10.1) Total 9,057 11,791 10,133 (23.2) (10.6)
Distribution of Group security portfolio by issuer type (NIS in millions) is as follows:
Carrying amount as of
March 31, 2018 Carrying amount as of
March 31, 2017 Carrying amount as of
December 31, 2017
Government debentures: Government of Israel 7,152 10,037 7,612 Government of USA 1,350 1,569 2,233 South Korea Government - 56 - Total government debentures 8,502 11,662 9,845
Debentures of banks in developed nations: Germany 172 - 173 USA - 18 - Other 277 - - Total debentures of banks in developed nations 449 18 173
Corporate debentures (composition by sector): Public and community services 10 10 10 Financial services 7 8 6 Total corporate debentures 17 18 16
Shares 89 93 99
Total securities 9,057 11,791 10,133

25
For more information about investments in securities and impairment of a temporary nature of securities available for sale, listing the duration of impairment and its rate out of the amortized cost, see Note 5 to the financial statements.
Buildings and equipment -The balance of buildings and equipment increased in the first quarter of 2018 by NIS 25 million. The change in balance of buildings and equipment is due to depreciation and realized assets as part of asset reorganization and improvements to the branch network, offset by new investments -primarily in technology.
Deposits from the public -these account for 77% of total consolidated balance sheet as of March 31, 2018, similar to their weight at the end of 2017. In the first quarter of 2018, deposits from the public with the Bank Group increased by NIS 3.5 billion, or 1.9% (increase by 3.5% over the end of the corresponding period last year).
Composition of deposits from the public by linkage segments (NIS in millions) is as follows:
March 31, 2018
March 31, 2017
December 31, 2017
Change in % over March 31,
2017
Change in % over December
31,2017
Israeli currency Non-linked 138,334 127,550 133,194 8.5 3.9 CPI-linked 14,054 17,538 15,681 (19.9) (10.4) Foreign currency and foreign currency linked 34,678 35,634 34,698 (2.7) (0.1) Total 187,066 180,722 183,573 3.5 1.9
Composition of deposits from the public by supervisory operating segments (NIS in millions) is as follows:
March 31, 2018
March 31, 2017
December 31, 2017
Change in % over March 31,
2017
Change in % over December
31,2017
Individuals: Households -other 76,809 72,500 75,008 5.9 2.4 Private banking 12,384 11,211 12,448 10.5 (0.5) Total -individuals 89,193 83,711 87,456 6.5 2.0
Business operations: Small and micro businesses 19,514 17,288 18,942 12.9 3.0 Medium businesses 7,213 5,890 7,138 22.5 1.1 Large businesses 25,910 30,293 26,284 (14.5) (1.4) Institutional investors 40,045 38,081 38,881 5.2 3.0 Total -business operations 92,682 91,552 91,245 1.2 1.6
Overseas operations 5,191 5,459 4,872 (4.9) 6.5 Total 187,066 180,722 183,573 3.5 1.9
Evolution of deposits from the public for the Group by depositor size (NIS in millions) is as follows:
March 31, 2018
March 31, 2017
December 31, 2017
Maximum deposit Up to 1 64,696 60,868 63,493 Over 1 to 10 42,287 39,146 41,125 Over 10 to 100 27,058 26,013 26,906 Over 100 to 500 23,823 27,311 23,911 Above 500 29,202 27,384 28,138 Total 187,066 180,722 183,573
Deposits from banks -The balance of deposits from banks as of March 31, 2018 amounted to NIS 0.9 billion, a decrease by NIS 0.2 billion compared to December 31, 2017.
Debentures and subordinated notes -The balance of debentures and subordinated notes as of March 31, 2018 amounted to NIS 29.9 billion, similar to December 31, 2017.

26
Capital, capital adequacy and leverage
Shareholders’ equity attributable to shareholders of the Bank -Shareholders’ equity attributable to equity holders of the Bank as of March 31, 2018 amounted to NIS 13.9 billion, compared to NIS 13.0 billion as of December 31, 2017 and as of March 31, 2017, an increase by 1.5% and 6.7%, respectively.
Below is the composition of shareholders’ equity (NIS in millions):
March 31, 2018
March 31, 2017
December 31, 2017
Share capital and premium(1) 2,185 2,246 2,180 Capital reserve from benefit from share-based payment transactions 60 52 65
Treasury shares(2) - (76) -
Total cumulative other loss(3)(4) (411) (298) (383)
Retained earnings (5) 12,056 11,091 11,823
Total 13,890 13,015 13,685
(1) For more information about share issuance, see condensed statement of changes to shareholders’ equity. (2) On September 18, 2017, the Board of Directors of the Bank decided to cancel 2.5 million shares of NIS 0.1 par value each of
the Bank's issued share capital acquired by the Bank which constitute dormant shares that do not confer any rights in the Bank. Accordingly, on September 25, 2017, the dormant shares were canceled in the Bank's records.
(3) For more information about other comprehensive income (loss), see Note 4 to the financial statements. (4) Other comprehensive income (loss) as of March 31, 2018, as of March 31, 2017 and as of December 31, 2017 includes
adjustments with respect to employees’ benefits. For more information about the effect of the streamlining plan approved by the Bank’s Board of Directors on December 27, 2016, see Notes 22 and 25 to the 2017 financial statements.
(5) For more information about developments in revenues and expenses accumulated to retained earnings in the reported period, see chapter "Material developments in revenues, expenses and other comprehensive income".
The ratio of shareholders' equity to balance sheet total for the Group as of March 31, 2018 was 5.72%
compared to 5.71% as of December 31, 2017 and 5.56% as of March 31, 2017.
Capital adequacy
Supervisory capital
The Bank assesses its capital adequacy in accordance with Basel rules, as prescribed by Proper Banking Conduct Directives 201-211. The Bank applies the standard approach in assessing exposure to credit risk, operating risk and market risk.
Capital is composed of two tiers: Tier I capital (including Tier I capital and Tier I additional capital) and Tier II capital.
Tier I capital primarily consists of equity attributable to shareholders of the Bank (accounting equity on the books) and non-controlling interests, which is the primary component for loss absorption.
Additional Tier I capital consists of equity instruments which fulfill the requirements specified in the directives. As of March 31, 2018, the Bank had no equity instruments included in additional Tier I capital.
Tier II capital consists of the group-based provision for credit losses and CoCo (Contingent Convertible) capital instruments, which include a provision for absorbing loss of principal when the Tier I Capital ratio drops below the specified quantitative trigger level, or upon receiving notice from the Supervisor of Banks, whereby activating the provision for absorbing loss of principal is required to ensure stability of the banking corporation (a Bank "non existence" event).
Subordinated notes, recognized as Tier II capital instruments under the previous directives, no longer qualify as supervisory capital under the current directives (primarily due to lacking loss absorption provisions) and are amortized over the term of the transitional provisions.

27
Capital planning at the Bank
Capital planning in the normal course business -The Bank prepares a detailed, multi-annual capital planning forecast, taking the following into consideration: Expected growth rates of risk assets and profitability, the strategic plan, dividend distribution policy, capital targets and leverage, appropriate safety margins and other factors.
The Bank regularly monitors the actual results vs. the forecast, revises the forecast as required and reviews any necessary actions in order to achieve the specified capital targets.
The sensitivity of the Bank's capital adequacy ratio to changes in Tier I capital and risk assets is:
Change in Tier I capital by NIS 100 million would result in a change in Tier I capital adequacy ratio of 0.07%. Change in risk assets by NIS 1 billion would result in a change in Tier I capital adequacy ratio of 0.07%.
Internal capital adequacy assessment process -The Bank uses this process to verify the existence of a sufficient capital absorption buffer to address various risks associated with Bank operations, including stress scenarios.
The planning horizon is three years, in which the Bank challenges the strategic plan by a range of stress tests involving significant impact to Bank profitability and erosion of Bank capital. The outcome of the Bank's most recent capital planning indicates that the capital absorption buffer is sufficient. For more information see the Detailed Risks Report on the Bank website.
Below is information about supervisory capital and risk assets on the consolidated report (NIS in millions):
March 31, 2018 March 31, 2017 December 31, 2017
Capital for purpose of calculating minimum capital ratio Tier I shareholders’ equity 14,436 13,533 14,333
Tier I capital 14,436 13,533 14,333 Tier II capital 4,813 4,442 5,251 Total capital 19,249 17,975 19,584
Weighted risk asset balances Credit risk 131,801 124,319 130,525 Market risks 1,699 1,266 1,605 Operating risk 8,629 8,198 8,394 Total weighted risk asset balances 142,129 133,783 140,524
Ratio of capital to risk elements
As from January 1, 2014, the Bank applies provisions for capital measurement and adequacy, based on Basel III provisions, as published by the Supervisor of Banks and as incorporated in Proper Banking Conduct Directives 201-211. As per instructions of the Supervisor of Banks, as from January 1, 2015 the Bank is required to maintain a minimum Tier I capital ratio of no less than 9% and a minimum total equity ratio of no less than 12.5% of weighted total of risk elements of its balance sheet assets and off-balance-sheet items. The Supervisor of Banks' instructions specifies the manner of calculation of total capital and total risk elements
An additional capital requirement was added to these ratios at 1% of the housing loan balance as of the report date.
This requirement was gradually implemented through January 1, 2017. Accordingly, the minimum Tier I capital ratio and the minimum total equity ratio required by the Supervisor of Banks, on a consolidated basis, in conformity with data as of the reporting date, are 9.86% and 13.36%, respectively. See Note 9 to the financial statements for additional information.
For more information about the Board of Directors resolutions with regard to capital to risk elements ratio and to dividend distribution policy, see Note 24 to the 2017 financial statements and chapter "Analysis of composition of assets, liabilities, capital and capital adequacy" (Dividend distribution policy) below.

28
Development of Group ratio of capital to risk elements is as follows (in %):
March 31, 2018 March 31, 2017 December 31, 2017
Ratio of Tier I capital to risk elements 10.16 10.12 10.20 Ratio of total capital to risk elements (1)13.54 13.44 13.94 Minimum Tier I capital ratio required by Supervisor of Banks 9.86 9.87 9.86 Total minimum capital ratio required by the directives of the Supervisor of Banks 13.36 13.37 13.36
(1) The decrease in overall capital ratio is due to gradual reduction of capital instruments which no longer qualify as supervisory capital. In conformity with transition provisions of Basel III, these instruments are included in Tier II capital and are reduced at the start of each year through January 1, 2022.
Composition of risk assets and capital requirements with respect to credit risk by exposure group are as
follows (NIS in millions):
Exposure group
March 31, 2018
Weighted risk asset balances
March 31, 2018 Capital
requirement(1)
March 31, 2017 Weighted risk
asset balances
March 31, 2017 Capital
requirement(2)
December 31, 2017
Weighted risk asset balances
December 31, 2017
Capital requirement(3)
Sovereign debts 712 95 643 86 688 92 Public sector entity debts 821 110 649 87 766 102 Banking corporation debts 862 115 752 100 927 124 Corporate debts 37,608 5,024 35,626 4,763 37,362 4,992 Debts secured by commercial real estate 2,515 336 2,065 276 2,459 328 Retail exposure to individuals 14,454 1,931 13,388 1,790 14,217 1,899 Loans to small businesses 6,930 926 6,581 880 6,858 916 Residential mortgages 63,006 8,418 59,446 7,948 62,265 8,319 Other assets 4,355 582 4,432 593 4,454 595 Total 131,263 17,537 123,582 16,523 129,996 17,367
Risk assets and capital requirements with respect to market risk, CVA risk(4) and operating risk are as follows (NIS in millions):
March 31, 2018 Weighted risk
asset balances
March 31, 2018 Capital
requirement(1)
March 31, 2017
Weighted risk asset balances
March 31, 2017 Capital
requirement(2)
December 31, 2017
Weighted risk asset balances
December 31, 2017
Capital requirement(3)
Credit risk 131,263 17,537 123,582 16,523 129,996 17,367 Market risk 1,699 227 1,266 169 1,605 214 CVA risk with respect to derivatives(4) 538 72 737 99 529 71 Operating Risk(5) 8,629 1,153 8,198 1,096 8,394 1,121 Total risk assets 142,129 18,989 133,783 17,887 140,524 18,773
(1) The capital requirement was calculated at 13.36% of risk asset balances. (2) The capital requirement was calculated at 13.37% of risk asset balances. (3) The capital requirement was calculated at 13.36% of risk asset balances. (4) Credit Value Adjustments -mark to market with respect to credit risk of counter-party, in conformity with Basel III provisions. (5) Capital allocation with respect to operating risk was calculated using the standard approach.

29
Leverage ratio
On April 28, 2015, the Supervisor of Banks issued a new Proper Banking Conduct Directive 218 concerning "Leverage ratio". This directive adopts the Basel Committee recommendations with regard to leverage ratio, stipulated in January 2014.
The leverage ratio is reflected in percent, defined as the ratio of Tier I capital to total exposure. Total exposure for the Bank is the sum of balance sheet exposures, exposures to derivatives and to securities financing transactions and off-balance sheet items.
According to the directive, banking corporations must maintain a leverage ratio of 5% or higher on a consolidated basis, as from January 1, 2018.
Below is the Bank's leverage ratio(1) (in %):
2018
First Quarter
2017
Fourth Quarter
2017
Third Quarter
2017
Second Quarter
2017
First Quarter
Leverage ratio 5.43 5.48 5.36 5.42 5.27
(1) The minimum leverage ratio required by the Supervisor of Banks is 5%.
For more information see Note 9 to the financial statements and the Detailed Risks Report on the Bank website.
For more information about adoption of updates to US GAAP with regard to leases, as from January 1, 2020, see Note 1.E.
Dividends
Dividend distribution policies
The Bank's revised dividends policy is to distribute dividends, as from 2018, with respect to quarterly earnings, at 40% of net profit attributable to shareholders of the Bank. For more information and for a summary of previous decisions by the Board of Directors with regard to dividend distribution policy, see Note 24 to the 2017 financial statements.
Dividend distribution
Below are details of dividends distributed by the Bank since 2016 (in reported amounts):
Declaration date Payment date
Dividends per share
(Agorot) Dividends as
percent of profit Total dividends paid
(NIS in millions)
February 24, 2016 March 21, 2016 15.52 0.15 36.0
May 18, 2016 June 21, 2016 18.62 0.15 43.2
August 10, 2016 September 11, 2016 21.99 0.15 51.0
November 14, 2016 December 12, 2016 24.12 0.15 56.0 Total dividends distributed in 2016(1) 186.2
March 20, 2017 April 26, 2017 17.12 0.15 39.8
May 15, 2017 June 20, 2017 41.45 0.30 96.3
August 28, 2017 September 26, 2017 51.63 0.30 120.0
November 13, 2017 December 10, 2017 33.67 0.30 78.3 Total dividends distributed in 2017(2) 334.4
February 26, 2018 March 26, 2018 47.03 0.30 109.5
(1) Total dividends distributed with respect to 2016 earnings -NIS 190.0 million. (2) Total dividends distributed with respect to 2017 earnings -NIS 404.1 million.

30
Dividends declared with respect to earnings in the first quarter of 2018 On May 7, 2018, the Bank’s Board of Directors resolved to distribute dividends amounting to NIS 137.2 million, or 40% of earnings in the first quarter of 2018, in conformity with the aforementioned revised dividends policy. The dividends are 589.1% of issued share capital, i.e. NIS 0.5891 per NIS 0.1 par value share. The effective date for dividends payment is May 22, 2018 and the payment date is June 5, 2018. The final dividends per share is subject to changes due to realized convertible securities of the Bank.
Other Off Balance Sheet Activity
Below is the development of off balance sheet monetary assets held on behalf of Bank Group clients, for which the Bank Group provides management, operating and/or custodial services (NIS in millions):
March 31, 2018
March 31, 2017
December 31, 2017
Change in % over March 31,
2017
Change in % over December
31,2017
Securities(1) 222,439 222,964 222,623 (0.2) (0.1) Assets of provident funds for which the Group provides operating services 79,544 76,580 76,893 3.9 3.4 Assets held in trust by the Bank Group 79,681 72,363 80,258 10.1 (0.7) Assets of mutual funds for which the Bank provides operating services 17,138 16,028 16,246 6.9 5.5
Other assets under management(2) 13,103 11,517 12,571 13.8 4.2
(1) Value of securities portfolios in Bank custody, held by clients, including balance of securities of provident funds and mutual funds to which the Bank provides operating services. Note that the balance of client operations presented includes, in addition to the balance of securities for mutual funds as noted above, also the value of participation units in such funds held by Bank clients. (2) Including:
- Loan balances secured by deposits whose repayment to the depositor is contingent upon collection of the loan balance. With respect to these balances, the Bank receives margin or commissions Revenues.
- Other loans managed by the Bank, including housing loans managed and operated by the Bank on behalf of others.
Financial Information by Operating Segments
On November 3, 2014, the Supervisor of Banks issued an update to the Public Reporting Directives concerning supervisory operating segments. According to the directive, the Bank is required to provide, on its financial statements, disclosure with regard to supervisory operating segments in conformity with a uniform, comparable layout specified by the Supervisor of Banks; attribution to supervisory operating segments is typically determined by the client's turnover (annual sales or annual revenues).
Supervisory operating segments include operating segments for individuals and operating segments for business clients other than individuals (including institutional investors and financial management of the Bank).
Individuals are defined as persons with no indebtedness to the Bank or whose indebtedness is classified as indebtedness of "individuals -housing loans and others", in conformity with definitions of credit risk classification by economic sector.
The Bank's operating segments by the "management approach" are based on client attribution to the organizational structure responsible in the past period.
However, client attribution to supervisory operating segments is based on uniform definitions specified by the Supervisor of Banks, as noted above.
There is a strong correlation between attributes specified by management for client attribution to the responsible division and the supervisory definitions.
However, according to "the management approach", in some cases the final client attribution may be based on other parameters, such as: specialization of a certain unit in activity types of clients or past experience working with the client, which result in business and service-related advantages to client attribution to the specific division.

31
Given the Supervisor of Banks' requirement to discuss and analyze the supervisory operating segments in the Report of the Board of Directors and Management and given the correlation between supervisory operating segments and the "management approach", the segment information (both quantitative and qualitative) is briefly presented below for each segment, as follows:
- Supervisory definition of the segment
- Explanation of differences between the "supervisory" definition and how business is actually managed (using the "management approach")
- Financial results of the segment (using the "supervisory approach")
For more information about principles for attribution of balances, revenues and expenses to clients in the system, see Note 12 to the financial statements.
For more information and detailed description of the segments, see chapter "Other Information about the Bank and Management thereof" on the 2017 financial statements.
Financial Information by Supervisory Operating Segments:
Below is a summary of financial results by supervisory operating segment (NIS in millions):
Net profit In the first quarter
2018
Net profit In the first quarter
2017
Share of total net profit (in %)
In the first quarter
2018
Share of total net profit (in %)
In the first quarter
2017
Individuals: Households -housing loans 157 130 41.6 39.3
Households -other 16 16 4.2 4.8
Private banking 3 2 0.8 0.6
Total -individuals 176 148 46.7 44.7
Business operations: Small and micro businesses 73 65 19.4 19.6
Medium businesses 28 26 7.4 7.9
Large businesses 68 68 18.0 20.5
Institutional investors 9 6 2.4 1.8
Total -business operations 178 165 47.2 49.8
Financial management (34) (10) - -
Total activity in Israel 320 303 93.9 94.5
Overseas operations 23 18 6.1 5.5
Total 343 321 100.0 100.0
For more information about operating results in conformity with the management approach, see Note 12 to the financial statements.

32
Household segment
Supervisory definition
In conformity with the supervisory definition, the household segment includes individuals, other than those clients included in the private banking segment. Thus, this segment excludes individuals with financial assets in excess of NIS 3 million. Individuals are defined as persons with no indebtedness to the Bank or whose indebtedness is classified as indebtedness of "individuals -housing loans and others", in conformity with definitions of credit risk classification by economic sector.
Differences between the management approach and the supervisory definition
- Some individual clients attributed to the private banking segment using the "management approach" are classified to the household segment using supervisory segments. The difference is primarily due to clients' financial assets used for client classification -the Bank threshold for client classification according to the "management approach" is NIS 2.5 million, lower than the supervisory definition.
- As a rule, individual clients are attributed to the household segment. According to the supervisory approach, individual clients with high indebtedness or with business attributes are classified to the business operating segments, rather than to the household segment.
Operating results in the household segment (NIS in millions)
For the three
months ended March
31,2018 Other
For the three
months ended
March 31, 2018
Housing
loans
For the three
months ended March
31,2018 Total
For the three
months ended
March 31, 2017 Other
For the three
months ended
March 31, 2017
Housing loans
For the three
months ended
March 31, 2017 Total
Profit and profitability Total interest revenues, net 308 357 665 280 304 584
Non-interest financing revenues - - - - - -
Commissions and other revenues 131 41 172 124 37 161
Total revenues 439 398 837 404 341 745
Expenses with respect to credit losses 22 6 28 24 - 24
Operating and other expenses 380 151 531 349 135 484
Profit before provision for taxes 37 241 278 31 206 237
Provision for taxes 13 84 97 11 76 87
After-tax profit 24 157 181 20 130 150
Net profit: Attributable to non-controlling interests (8) - (8) (4) - (4) Attributable to shareholders of the banking corporation 16 157 173 16 130 146
Balance sheet -key items: Loans to the public (end balance) 20,354 121,356 141,710 18,793 115,996 134,789
Loans to the public, net (end balance) 20,115 120,721 140,836 18,591 115,378 133,969
Deposits from the public (end balance) 76,809 - 76,809 72,500 - 72,500
Average balance of loans to the public 20,000 121,072 141,072 18,159 115,665 133,824 Average balance of deposits from the public 75,571 - 75,571 71,924 - 71,924
Average balance of risk assets 17,424 67,327 84,751 16,455 63,684 80,139
Credit margins and deposit margins: Margin from credit granting operations 200 345 545 185 296 481 Margin from activities of receiving deposits 106 - 106 93 - 93
Other 2 12 14 2 8 10
Total interest revenues, net 308 357 665 280 304 584

33
Contribution of the household segment (in conformity with supervisory definitions) to Group profit in the first quarter of 2018 amounted to NIS 173 million, compared to NIS 146 million in the corresponding period last year.
Below are key factors affecting the change in segment contribution:
Contribution of housing loans (including general-purpose loans secured by a lien on a residential apartment) in the first quarter of 2018 amounted to NIS 157 million, compared to NIS 130 million in the corresponding period last year. Total interest revenues, net amounted to NIS 357 million, compared to NIS 304 million in the corresponding period last year, an increase by 17.4% -primarily due to an increase of NIS 5.4 billion in the average loan balance and to increase in credit spread. In the current quarter, expenses with respect to credit losses amounted to NIS 6 million, primarily due to increase in group-based provision for housing loans, due to increase in housing loan balances, compared to the first quarter of 2017, in which no expenses with respect to credit losses were recognized due to significant arrears repayment by clients. Operating expenses amounted to NIS 151 million, compared to NIS 135 million in the corresponding period last year.
The increase is due to the "auto pilot" effect and to the immediate effect of the collective bargaining agreement for 2016-2021. Data for the first quarter of 2017 exclude the effect of this agreement. For more information see chapter "Explanation and analysis of results and business standing".
Commissions and other revenues increased by NIS 4 million.
Contribution of other household operations (other than housing loans) in the first quarter of 2018 amounted to a profit of NIS 16 million, similar to the corresponding period last year. Interest revenues, net increased by NIS 28 million. The increase is due to increase in lending margins and to increase in margin from deposit operations, due to higher volumes of both lending and deposits. Commissions and other revenues amounted to NIS 131 million, compared to NIS 124 million in the corresponding period last year -due to increased business.
Expenses with respect to credit losses amounted to NIS 22 million, compared to NIS 24 million in the corresponding period last year.
Operating expenses amounted to NIS 380 million, compared with NIS 349 million in the corresponding period last year, an increase by 8.9%, due to effect of the collective bargaining agreement for 2016-2021, signed with the Employees’ Union in December 2017, which increased payroll and associated expenses attributed to the segment .
For more details and extensive information about results of this segment and operating results in conformity with management’s approach - see Note 12 to the financial statements.
Private Banking Segment
Supervisory definition
According to the supervisory definition, the private banking segment consists of individuals whose financial assets with the bank (including deposits, securities portfolios and other financial assets) exceed NIS 3 million.
Differences between the management approach and the supervisory definition
- Some individual clients attributed to the private banking segment using the "management approach" are classified to the household segment using supervisory segments. The difference is primarily due to clients' financial assets used for client classification -the Bank threshold for client classification according to the "management approach" is NIS 2.5 million, lower than the supervisory definition.
- The private banking segment according to the management approach also includes businesses with liquid assets in excess of NIS 8 million. These clients are classified to the business operating segments under the supervisory approach.

34
Operating results of private banking segment (NIS in millions)
For the three months
ended March 31, 2018
For the three months
ended March 31, 2017
Profit and profitability Total interest revenues, net 16 14
Non-interest financing revenues - -
Commissions and other revenues 2 1
Total revenues 18 15
Expenses with respect to credit losses - -
Operating and other expenses 13 12
Profit before provision for taxes 5 3
Provision for taxes 2 1
Net profit 3 2
Balance sheet -key items: Loans to the public (end balance) 100 99
Loans to the public, net (end balance) 99 98
Deposits from the public (end balance) 12,384 11,211
Average balance of loans to the public 97 72
Average balance of deposits from the public 12,009 11,072
Average balance of risk assets 37 33
Credit margins and deposit margins: Margin from credit granting operations - -
Margin from activities of receiving deposits 16 14
Other - -
Total interest revenues, net 16 14
Contribution of the private banking segment (in conformity with the supervisory definitions) to Group profit in
the first quarter of 2018 amounted to NIS 3 million, compared to NIS 2 million in the corresponding period
last year.
Total interest revenues, net increased by NIS 2 million, due to increase in deposits from the public.
Commissions and other revenues, as well as other items, were essentially unchanged.
For more details and extensive information about results of this segment and operating results in conformity
with management’s approach - see Note 12 to the financial statements.
For more information about the effect of attribution of expenses related to the US DOJ inquiry on this segment,
see Note 12C to the financial statements.

35
Micro and Small Business Segment
Supervisory definition
The micro and small business segment includes businesses with annual turnover below NIS 50 million.
Differences between the management approach and the supervisory definition
- Business clients with liquid assets in excess of NIS 8 million are attributed to the private banking segment according to the management approach. According to the supervisory segment approach, these clients are classified to the micro and small business segment, based on their annual turnover.
- Business clients currently attributed to commercial banking using the management approach and whose annual turnover is lower than NIS 50 million, are classified to the micro and small business segment using the supervisory approach.
Operating results of micro and small business segment (NIS in millions)
For the three months
ended March 31, 2018
For the three months
ended March 31, 2017
Profit and profitability Total interest revenues, net 232 205 Non-interest financing revenues - - Commissions and other revenues 89 80 Total revenues 321 285
Expenses with respect to credit losses 38 32 Operating and other expenses 170 150 Profit before provision for taxes 113 103 Provision for taxes 39 38 After-tax profit 74 65
Net profit attributed to non-controlling interests (1) - Net profit attributable to shareholders of the banking corporation 73 65
Balance sheet -key items: Loans to the public (end balance) 17,511 15,894 Loans to the public, net (end balance) 17,184 15,617 Deposits from the public (end balance) 19,514 17,288 Average balance of loans to the public 17,293 15,356 Average balance of deposits from the public 19,587 17,022 Average balance of risk assets 16,644 14,680 Credit margins and deposit margins: Margin from credit granting operations 204 184 Margin from activities of receiving deposits 23 18 Other 5 3 Total interest revenues, net 232 205
Contribution of the micro and small business segment (in conformity with supervisory definitions) to Group profit in the first quarter of 2018 amounted to NIS 73 million, compared to NIS 65 million in the corresponding period last year, an increase by 12.3%. Below are key factors affecting the change in segment contribution: Interest revenues, net amounted to NIS 232 million, compared to NIS 205 million in the corresponding period last year -an increase by 13.2%, primarily due to increase in lending and deposit business. Commissions and other revenues amounted to NIS 89 million, compared to NIS 80 million in the corresponding period last year -an increase by 11.3%, attributed to significant increase in business volume. Expenses with respect to credit losses amounted to NIS 38 million, compared to NIS 32 million in the corresponding period last year. The increase in the provision for credit losses is due to a decrease in collection of debt previously written off and to an increase in the group-based provision due to an increase in loans to the public, compared to the corresponding period last year.
Operating expenses amounted to NIS 170 million, compared to NIS 150 million in the corresponding period last year -an increase by NIS 20 million, due to the "auto pilot" effect and to the immediate effect of the collective bargaining agreement for 2016-2021. Data for the first quarter of 2017 exclude the effect of this agreement. For more information see chapter "Explanation and analysis of results and business standing".

36
For more information about the effect of attribution of expenses related to the US DOJ inquiry on this segment, see Note 12C to the financial statements.
Medium business segment
Supervisory definition
The medium business segment includes businesses with annual turnover higher than NIS 50 million and lower than NIS 250 million.
Differences between the management approach and the supervisory definition
- The commercial banking segment, according to the management approach, includes businesses with turnover between NIS 30 and 120 million, and total indebtedness between NIS 6 and 25 million. This means that some commercial banking clients (under the management approach) whose turnover is below NIS 50 million are classified to the micro and small business segment using the supervisory operating segments.
- On the other hand, business clients attributed to the business banking segment using the management approach and whose annual turnover is lower than NIS 250 million, are attributed to the medium business segment using the supervisory approach.
Operating results of medium business segment (NIS in millions)
For the three months
ended March 31, 2018
For the three months
ended March 31, 2017
Profit and profitability Total interest revenues, net 58 48 Non-interest financing revenues - - Commissions and other revenues 18 15 Total revenues 76 63
Expenses with respect to credit losses 4 (3) Operating and other expenses 29 25 Profit before provision for taxes 43 41 Provision for taxes 15 15 Net profit 28 26
Balance sheet -key items: Loans to the public (end balance) 5,987 4,992 Loans to the public, net (end balance) 5,906 4,907 Deposits from the public (end balance) 7,213 5,890 Average balance of loans to the public 6,229 4,899 Average balance of deposits from the public 7,288 6,178 Average balance of risk assets 7,136 6,004 Credit margins and deposit margins: Margin from credit granting operations 48 40 Margin from activities of receiving deposits 9 6 Other 1 2 Total interest revenues, net 58 48
Contribution of the medium business segment (in conformity with supervisory definitions) to Group profit in the first quarter of 2018 amounted to NIS 28 million, compared to NIS 26 million in the corresponding period last year. Interest revenues, net increased by 20.8%, primarily due to increase in credit and deposit volumes in this segment. Commission and other revenues increased by NIS 3 million compared to the corresponding period last year, an increase by 20%. Expenses with respect to credit losses amounted to an expense of NIS 4 million, compared to a decrease in provision of NIS 3 million in the corresponding period last year, due to a decrease in collection of debt previously written off and to an increase in the group-based provision due to an increase in loans to the public, compared to the corresponding period last year. Operating expenses amounted to NIS 29 million, compared to NIS 25 million in the corresponding period last year -an increase by NIS 4 million, in line with growth of business. The increase is due to the "auto pilot"
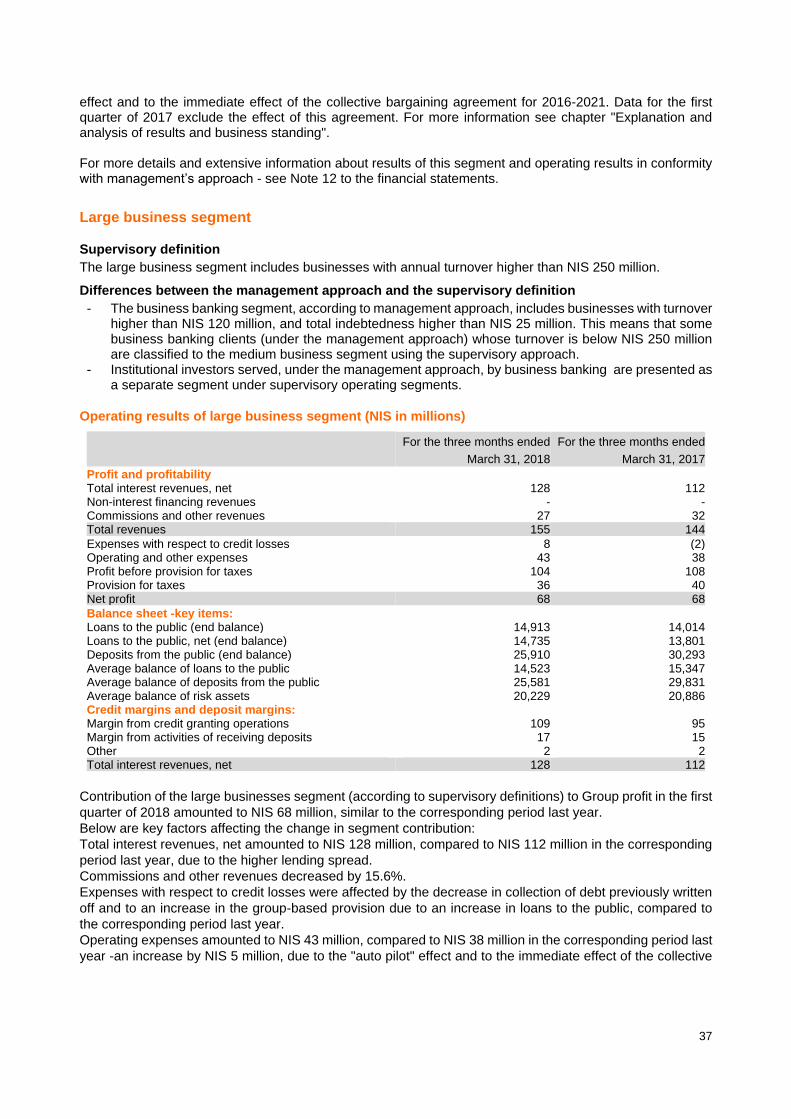
37
effect and to the immediate effect of the collective bargaining agreement for 2016-2021. Data for the first quarter of 2017 exclude the effect of this agreement. For more information see chapter "Explanation and analysis of results and business standing". For more details and extensive information about results of this segment and operating results in conformity with management’s approach - see Note 12 to the financial statements.
Large business segment
Supervisory definition
The large business segment includes businesses with annual turnover higher than NIS 250 million.
Differences between the management approach and the supervisory definition
- The business banking segment, according to management approach, includes businesses with turnover higher than NIS 120 million, and total indebtedness higher than NIS 25 million. This means that some business banking clients (under the management approach) whose turnover is below NIS 250 million are classified to the medium business segment using the supervisory approach.
- Institutional investors served, under the management approach, by business banking are presented as a separate segment under supervisory operating segments.
Operating results of large business segment (NIS in millions)
For the three months ended
March 31, 2018
For the three months ended
March 31, 2017
Profit and profitability Total interest revenues, net 128 112 Non-interest financing revenues - - Commissions and other revenues 27 32 Total revenues 155 144
Expenses with respect to credit losses 8 (2) Operating and other expenses 43 38 Profit before provision for taxes 104 108 Provision for taxes 36 40 Net profit 68 68
Balance sheet -key items: Loans to the public (end balance) 14,913 14,014 Loans to the public, net (end balance) 14,735 13,801 Deposits from the public (end balance) 25,910 30,293 Average balance of loans to the public 14,523 15,347 Average balance of deposits from the public 25,581 29,831 Average balance of risk assets 20,229 20,886 Credit margins and deposit margins: Margin from credit granting operations 109 95 Margin from activities of receiving deposits 17 15 Other 2 2 Total interest revenues, net 128 112
Contribution of the large businesses segment (according to supervisory definitions) to Group profit in the first
quarter of 2018 amounted to NIS 68 million, similar to the corresponding period last year.
Below are key factors affecting the change in segment contribution:
Total interest revenues, net amounted to NIS 128 million, compared to NIS 112 million in the corresponding
period last year, due to the higher lending spread.
Commissions and other revenues decreased by 15.6%.
Expenses with respect to credit losses were affected by the decrease in collection of debt previously written
off and to an increase in the group-based provision due to an increase in loans to the public, compared to
the corresponding period last year.
Operating expenses amounted to NIS 43 million, compared to NIS 38 million in the corresponding period last
year -an increase by NIS 5 million, due to the "auto pilot" effect and to the immediate effect of the collective

38
bargaining agreement for 2016-2021. Data for the first quarter of 2017 exclude the effect of this agreement.
For more information see chapter "Explanation and analysis of results and business standing".
For more details and extensive information about results of this segment and operating results in conformity
with management’s approach - see Note 12 to the financial statements.
Institutional investor segment
Supervisory definition
This segment includes provident funds, pension funds, study funds, mutual funds, ETFs, insurance companies and stock exchange members who manage client portfolios.
Differences between the management approach and the supervisory definition
Under the management approach, institutional investors are administered by the business banking and by the financial management segment, but are presented as a separate segment under supervisory operating segments.
Operating results of institutional investor segment (NIS in millions)
For the three months ended
March 31, 2018
For the three months ended
March 31, 2017
Profit and profitability Total interest revenues, net 31 24 Non-interest financing revenues - - Commissions and other revenues 13 16 Total revenues 44 40
Expenses with respect to credit losses - (2) Operating and other expenses 30 33 Profit before provision for taxes 14 9 Provision for taxes 5 3 Net profit 9 6
Balance sheet -key items: Loans to the public (end balance) 1,266 1,581 Loans to the public, net (end balance) 1,258 1,541 Deposits from the public (end balance) 40,045 38,081 Average balance of loans to the public 1,334 1,611 Average balance of deposits from the public 39,563 36,895 Average balance of risk assets 2,433 2,518 Credit margins and deposit margins: Margin from credit granting operations 9 8 Margin from activities of receiving deposits 22 15 Other - 1 Total interest revenues, net 31 24
Contribution of the institutional investor segment (in conformity with the supervisory definitions) to Group profit in the first quarter of 2018 amounted to NIS 9 million, compared to NIS 6 million in the corresponding period last year.
Below are key factors affecting the change in segment contribution:
Interest revenues, net amounted to NIS 31 million, compared to NIS 24 million in the corresponding period last year -an increase by 29.2%, primarily due to increase in total deposits.
There were no expenses with respect to credit losses recognized in the current period, compared to a decrease in provision by NIS 2 million in the corresponding period last year. Other items were essentially unchanged.
For more details and extensive information about results of this segment and operating results in conformity with management’s approach - see Note 12 to the financial statements.

39
Financial Management Segment
Supervisory definition
The financial management segment includes trading operations, asset and liability management and non-banking investments.
Trade operations -Investment in securities held for trade, market making operations for securities, operations involving derivatives not designated as hedges and which are not part of asset and liability management for the Bank, borrowing of securities for trading, short selling of securities, underwriting services for securities.
Asset and liability management -including investment in debentures available for sale and in debentures held to maturity, hedging using derivatives, ALM hedging, currency hedging of investments overseas.
Real investments -Investment in shares available for sale and in associated companies of businesses.
Other financial management operations -management, operation, trust and custody services for banks, sale and management of loan portfolios.
Differences between the management approach and the supervisory definition
Under the management approach, institutional investors are administered by the financial management segment, but are presented as a separate segment under supervisory operating segments.
Operating results of the financial management segment (NIS in millions)
For the three months ended
March 31, 2018
For the three months
ended March 31, 2017
Profit and profitability Total interest expenses, net (91) 2 Non-interest financing revenues 80 (3) Commissions and other revenues 46 56 Total revenues 35 55
Reduced expenses with respect to credit losses 1 (1) Operating and other expenses 77 62 Profit before provision for taxes (43) (6) Provision for taxes (15) (2) After-tax profit (28) (4) Share of banking corporation in earnings of associated companies - (1) Net profit before attribution to non-controlling interests (28) (5) Net profit attributed to non-controlling interests (6) (5) Net profit attributable to shareholders of the banking corporation (34) (10)
Balance sheet -key items: Average balance of risk assets 6,426 5,124 Credit margins and deposit margins: Margin from credit granting operations - - Margin from activities of receiving deposits - - Other (91) 2 Total interest expenses, net (91) 2
Contribution of the financial management segment (in conformity with supervisory definitions) to Group profit in the first quarter of 2018 amounted to a loss of NIS 34 million, compared to a loss of NIS 10 million in the corresponding period last year. Below are key factors affecting the change in segment contribution: Results of financing operations (net interest revenues and non-interest financing revenues) decreased by NIS 10 million compared to the corresponding period last year, primarily due to the effect of accounting treatment of derivatives at fair value and other effects and due to the effect of the Consumer Price Index. See also analysis of evolution of financing revenues in chapter "Material developments in revenues, expenses and other comprehensive income".
Commissions and other revenues amounted to NIS 46 million, compared to NIS 56 million in the corresponding period last year.

40
Overseas operations
Supervisory definition
The Bank's overseas operations are presented separately, divided into operations involving individuals and business operations.
Differences between the management approach and the supervisory definition
Business and individual clients at overseas branches classified into the various operating segments in conformity with the management approach, are classified into the overseas operations segment in the disclosure of supervisory operating segments.
Business and individual clients at overseas branches are presented as a separate segment under supervisory operating segments and under the management approach are managed by the various operating segments -mostly private and business banking.
Operating results of overseas operations (NIS in millions)
For the three months
ended March 31, 2018
For the three months
ended March 31, 2017
Profit and profitability Total interest revenues, net 42 38 Non-interest financing revenues 10 2 Commissions and other revenues 6 8 Total revenues 58 48
Expenses with respect to credit losses 3 1 Operating and other expenses 19 19 Profit before provision for taxes 36 28 Provision for taxes 13 10 Net profit 23 18
Balance sheet -key items: Loans to the public (end balance) 3,640 3,164 Loans to the public, net (end balance) 3,610 3,135 Deposits from the public, net (ending balance) 5,191 5,459 Average balance of loans to the public 3,188 3,080 Average balance of deposits from the public 5,295 5,352 Average balance of risk assets 3,671 3,459 Credit margins and deposit margins: Margin from credit granting operations 22 26 Margin from activities of receiving deposits 2 3 Other 18 9 Total interest revenues, net 42 38
Contribution of overseas operations to Group profit in the first quarter of 2018 amounted to NIS 23 million, compared to NIS 18 million in the corresponding period last year.
Below are key factors affecting the change in segment contribution:
Interest revenues, net, amounted to NIS 42 million, compared to NIS 38 million in the corresponding period last year.
Non-interest financing revenues increased by NIS 8 million, due to realized available-for-sale debentures.
Commission revenues decreased by NIS 2 million.
In the current period, a provision for credit losses was recorded, amounting to NIS 3 million, compared to a provision of NIS 1 million in the corresponding period last year. For more details and extensive information about results of this segment and operating results in conformity with management’s approach - see Note 12 to the financial statements.
For more information about the effect of attribution of expenses related to the US DOJ inquiry on overseas operations, see Note 12C to the financial statements.

41
Major Investees
The Bank's share of earnings of investees in the first quarter of 2018 amounted to NIS 53 million, compared with NIS 18 million in the corresponding period last year. These data include impact of changes in exchange rates on the balance of investment in overseas investees, covered by the Bank's own sources.
Excluding the aforementioned effect of exchange rates, contribution of investees amounted to NIS 44 million, compared to NIS 31 million in the corresponding period last year -see explanation under Investees below.
Bank Yahav for Government Employees Ltd. (hereinafter: "Bank Yahav").
Bank Yahav is a banking corporation operating in accordance with a "Bank" license as per provisions of the Banking Act (Licensing), 1981.
The Group's share of Bank Yahav's net profit in the first quarter of 2018 amounted to NIS 15 million, compared to NIS 8 million in the corresponding period last year. Bank Yahav's net profit return on equity in the first quarter of 2018 was 9.7% on annualized basis, compared to 5.5% in the corresponding period last year. Bank Yahav's balance sheet total as of March 31, 2018 amounted to NIS 25,255 million, compared to NIS 24,782 million as of December 31, 2017 -an increase by NIS 473 million, or 1.9%. Net loans to the public as of March 31, 2018 amounted to NIS 9,711 million, compared to NIS 9,569 million as of December 31, 2017 -an increase by NIS 142 million, or 1.5%. Net deposits from the public as of March 31, 2018 amounted to NIS 21,317 million, compared to NIS 20,908 million as of December 31, 2017 -an increase by NIS 409 million, or 2.0%.
Tefahot Insurance Agency (1989) Ltd. ("Tefahot Insurance")
Tefahot Insurance is an insurance agency wholly owned by the Bank, which sells life insurance policies and property insurance policies of clients obtaining mortgages from the Bank. Net profit of Tefahot Insurance Agency in the first quarter of 2018 amounted to NIS 22 million, compared to NIS 18 million in the corresponding period last year.
Net profit return on equity in the first quarter of 2018 was 9.1%, compared to 8.1% in the corresponding period last year.
Other investees operating in Israel
Other investees operating in Israel, wholly controlled by the Bank and supported by Bank infrastructure, contributed to the Bank's net profit in the first quarter of 2018 NIS 6 million, net -similar to the corresponding period last year. Of this, NIS 4 million (compared to NIS 3 million in the corresponding period last year) from trustee operations of the subsidiary, Mizrahi Tefahot Trust Company Ltd.
United Mizrahi Bank (Switzerland) Ltd.
United Mizrahi Bank (Switzerland) Ltd. ("Mizrahi Bank Switzerland") is focused on international private banking services. The Swiss bank is held by a wholly-owned Bank subsidiary, UMOHC B.V. ("United Mizrahi Overseas Holding Company"), incorporated in Holland.
Net profit of Mizrahi Bank Switzerland in the first quarter of 2018 amounted to CHF 0.1 million, compared to CHF 0.2 million in the corresponding period last year. Mizrahi Bank Switzerland's balance sheet total as of March 31, 2018 amounted to CHF 165 million, compared to CHF 174 million as of December 31, 2017.
Interest revenues and net interest revenues of Mizrahi Bank Switzerland in the first quarter of 2018 amounted to CHF 0.5 million, similar to the corresponding period last year. Pre-tax revenues in the first quarter of 2018 amounted to NIS CHF .0.2 million, compared to CHF 0.3 million in the corresponding period last year. Pre-tax revenues net of exchange rate effect amounted to NIS 1 million in the first quarter of 2018, similar to the corresponding period last year.
The balance of loans to the public as of March 31, 2018 amounted to CHF 73 million, compared to CHF 72 million as of December 31, 2017. Deposits with banks as of March 31, 2018 amounted to CHF 89 million, compared to CHF 100 million as of December 31, 2017. Deposits from the public as of March 31, 2018 amounted to CHF 103 million, compared to CHF 111 million as of December 31, 2017.
These data exclude off-balance-sheet items, such as fiduciary deposits and client security portfolios which are major components of the Bank's business operations in Switzerland.

42
For more information about an investigation by the US Department of Justice concerning Bank Group business with its US clients, see Note 10.B.4 to the financial statements.
Investment in non-banking corporations
The Bank manages nostro investments in non-banking corporations. Shares of non-banking corporations in which the Bank invested are presented at fair value in the available-for-sale security portfolio and under investment in associates, where the Bank has a material investment in such entity. 1% of these investments are negotiable and presented at their market value. The remainder of these investments are presented at cost or at their carrying amount. In case of impairment of a non-temporary nature, in accordance with management’s assessment, a provision for impairment of the investment is recorded as a loss in the Bank’s accounts.
Bank investments in non-banking corporations as of March 31, 2018 amounted to NIS 86 million, compared to NIS 93 million and NIS 97 million as of March 31, 2017 and as of December 31, 2017, respectively.
Net gains from investments in non-banking corporations, after provision for impairment, amounted in the first quarter of 2018 to NIS 6 million for the Bank, compared to NIS 4 million in the corresponding period last year.

43
Risks overview
This chapter includes a concise overview and analysis of developments of major risks to which the Bank is exposed. If needed, this chapter should be read in conjunction with the chapter "Risks overview" in the 2017 audited annual financial statements. A detailed Risks Management Report which includes disclosure requirements of Basel Pillar 3 and additional information about risks, provided based on recommendations by the Financial Stability Board (FSB) is provided on the Bank website.
Developments in risks and risks management
Day-to-day activities in a variety of balance sheet and off-balance-sheet financial instruments expose the Group to different risks, mainly -market, interest in the Bank portfolio, liquidity, credit, operating and compliance risks. The risks management and control policies, in various aspects, is designated to support achievement of the Group’s business goals while limiting exposure to such risks.
The Bank maintained a low risk profile in the first quarter of 2018 In the first quarter of this year, there were no deviations from the risk appetite specified by the Bank’s Board of Directors for various risks. Risk benchmarks are within a reasonable distance from restrictions specified and in line with the strategic plan outline and with current work plans. Key financial ratios and profitability benchmarks show stable profit and capital for the Bank. The Bank has sufficient capital buffers to achieve its capital objectives under normal business conditions as well as under stress conditions.
Risks description
The Bank is engaged in commercial banking operations (business and retail) and in mortgage operations, where the Bank is a leader in the Israeli banking system.
Credit risk is the primary risk faced by banking corporations in the course of their business. At the Bank, credit risk is primarily due to retail credit operations, mainly housing loans, which are typically associated with relatively low risk. In conformity with principles of the five-year strategic plan, the Bank strives to maintain and establish its leadership position in the retail sector and to increase focus on and expand operations of the business segments. The Bank monitors and manages risk in the loan portfolio using various tools, including by development and deployment of advanced models. For more details see chapter "Credit risk" below.
The Supervisor of Banks' directive with regard to additional capital at 1% of the mortgage portfolio, which increased the capital targets, impacted the Bank to a more significant extent than was the case for other banks in the system.
In the business sector, the Bank operates while regularly assessing risk at client level, at sector level and for the economy as a whole (sector concentration). Operations in this have been affected in recent years by expanded operations of institutional investors and insurance companies, which are focused on providing large-scale credit for long terms.
In conformity with the Supervisor of Banks' directives, the minimum regulatory required liquidity coverage ratio is 100%. The Bank maintains high liquidity ratios with appropriate safety margins and a stable source structure.
The Bank has low exposure to overseas operations, as are its operations in nostro investments, primarily designed for investment of excess liquidity in high-quality assets with minimal credit risk.
Developments in technology and ever increasing sophistication of those involved in cyber attacks result in higher risk, as well as more intense management and monitoring of operating risks, IT risks and information and cyber security risks.
The Bank Group is exposed to the effect of regulatory changes and macro-economic changes in Israel and world-wide on its business, in conformity with the strategic plan outline. The Bank reviews, monitors and prepares for these effects as part of its regular operations and estimates risk under stress scenarios, as well.
The Bank has in place an extensive framework for management and control of the risks to which the Bank is exposed, including an organizational structure to support management and control of such risks. Risks are managed at the Group in conformity with Bank of Israel's Proper Business Conduct Directive 310 "Risks management" and in conformity with the framework specified in Basel II, Pillar 2 -including required changes upon Basel III coming into effect.

44
The Bank’s Board of Directors and the Board’s Risks Management Committee are responsible for setting the required principles for management and control of the various risks to which the Bank is exposed in its operations, including setting the risk appetite and supervision of Bank compliance with the specified guidelines and risk appetite.
Bank management is committed to regular management of material risks to which the Bank is exposed and to implementation of principles stipulated by the Bank’s Board of Directors for addressing such risks.
The Bank has a structured process in place for mapping and identification of risks associated with Bank operations, based on a materiality threshold, expressed in terms of Bank capital. Guidelines for handling of material risks, as identified and mapped, including risk appetite, measurement, management and mitigation of each risk, are included in special policies documents.
Description of risk appetite and risks management
The Bank's risk appetite is specified for all material risks using quantitative and qualitative restrictions; the quantitative restrictions are mostly specified as percentage of Tier I shareholder equity at the Bank. The Bank specified restrictions, under normal market conditions and under stress conditions, for most risks -based on the outcome of various stress tests conducted by the Bank. Each year, the risk appetite is challenged by the Chief Risks Officer, management and the Board of Directors, in view of the business targets specified in work plans, in conformity with the strategic plan, the risk profile and outcome of the qualitative risk management assessment process conducted by Bank managers. This process is designed to review the level of various risks and their development over the coming year. Consequently, the Bank's business strategy is supported by an appropriate risk appetite framework with constant monitoring of the risk profile and with alerts issued if the risk profile reaches the specified limits for risk appetite.
Stress testing
Stress tests are an important tool, in addition to models as part of risks management and control at the Bank and for risk assessment from current and future viewpoints. The Bank has a wide range of calculation methodologies for conducting stress testing. The primary uses of stress testing and guidelines for setting them are included on the risk management policy document. The Bank extensively uses the stress testing results in the capital planning process, which is part of the ICAAP document. This process reviews whether the Bank has sufficient capital to fulfill the strategic plan, which is challenged by a range of stress tests at various severity levels. These stress tests impact Bank profitability by causing potential loss due to material risks for Bank operations: credit risk, credit concentration risk, market risk, interest risk in the bank portfolio, operating risk including information and cyber security etc. Stress tests strongly emphasize the Bank's mortgage portfolio, it's business lending operations, potential impact of information security and cyber events, operational failure events etc. Results of the Bank's most recent capital planning, submitted to the Bank of Israel in January 2018, based on data for the first half of 2017, based on the Bank's strategic plan and for a three-year planning horizon, indicates that the Bank has a sufficient capital absorption cushion to face the range of risks associated with Bank operations, even in case of stress events. Results of the Uniform Scenario, similar to results of the various stress tests conducted by the Bank, indicate that the potential impact on Bank performance under such scenario is low relative to the Bank's capital and annual profit.
The Bank's quarterly risks document, which is discussed by management, by the Board’s Risks Management Committee and by the Bank’s Board of Directors, provides an extensive view of the different risks at the Bank, with emphasis on the risk profile given the risk appetite specified in all policy documents. Thus, this document complements and reinforces the view of the risk profile provided in the Bank's annual ICAAP document, as noted above.

45
Risk factor assessment
Below is a mapping of risk factors, their potential impact on the Bank Group and executives appointed Risk Owners for each risk factor:
Risk factor(1) Risk factor impact Risk Owner
Overall effect of credit risks Low-medium Manager, Business Division Risk from quality of borrowers and collateral Low-medium Risk from industry concentration Low-medium Risk from concentration of borrowers/ borrower groups Low Risk with respect to mortgage portfolio Low Overall effect of market risk Low-medium Manager, Financial Division Interest risk Medium Inflation risk Low-medium Exchange rate risk Low Share price risk Low Liquidity risk Low-medium Manager, Financial Division
Overall effect of operating risk Medium Manager, Risks Control Division Cyber and information security Medium Manager, Risks Control Division Information technology risk Medium Manager, Mizrahi-Tefahot Technology
Division Ltd. Legal risk Low-medium Chief Legal Counsel
Compliance and regulatory risk Low-medium Manager, Risks Control Division
Cross-border and AML risk Low-medium Manager, Risks Control Division
Reputation risk(2) Low Manager, Marketing, Promotion and Business Development Division
Strategic-business risk Low-medium President & CEO
(1) Assessment of the effect of the aforementioned risk factors takes into account the risks associated with the US DOJ inquiry as well as all action taken by the Bank to defend its position with regard to that inquiry. For more information about the US DOJ inquiry with regard to Bank Group business with its US clients and for more information about a motion for approval of a derivative claim and motion for approval of a class action lawsuit on this matter, see Note 10.B, sections 3.A and 4 to the financial statements.
(2) The risk of impairment of the Bank's results due to negative reports about the Bank.
The impact of the various risks factors in the table above have been determined based on management assessment, as provided from time to time. These assessments, based on monitoring of various quantitative risk benchmarks specified by the Bank, includes the direction of their development and are based on qualitative assessment of risk management and the effectiveness of control circles, in line with the Bank's ICAAP process and results thereof, led by the Bank's risk managers.
For more information see the Detailed Risks Report on the Bank website.

46
Credit risk
Risk description and development
Credit risk is the risk that a borrower or counter-party of the Bank would not fulfill its obligations towards the Bank. This risk is affected by multiple factors: Business risk due to client activities, concentration risk due to over-exposure to a borrower / borrower group and to economic sectors, geographic concentration risk, risk due to exogenous changes, overseas credit risk and operating risk which, should they materialize, would have implications for credit risk. Moreover, such risk is interrelated to multiple other risks, such as market and interest risk, liquidity risk, compliance risks etc.
In the first quarter of 2018, the overall effect of credit risk remained Low-Medium, with risk in the housing loan portfolio categorized as Low.
In the first quarter of 2018, the Bank continued to deploy, implement and use advanced models under development for optimal analysis of the Bank's retail credit. As part of this effort, the Bank revised and redefined some of the risk benchmarks for estimating the Bank's risk appetite. The Bank is in the process of deployment of model results in the banking processes. Furthermore, the Bank's Training Center was included in this process, in order to develop training activities for using the model results in branches.
Analysis of developments in credit quality and problematic credit risk
Significant exposure to groups of borrowers
Disclosure of credit risk with respect to significant exposure to borrower groups is provided with regard to each group of borrowers whose net indebtedness, on a consolidated basis, after allowed deductions pursuant to Proper Banking Conduct Directive 313, exceeds 15% of the banking corporation's capital (as defined in Directive 313), NIS in millions.
As of March 31, 2018, the Bank had no borrower group which meets the aforementioned criteria.
For more information about significant exposures to borrower groups, see chapter "Credit Risk" in the Report of the 2017 Report of the Board of Directors and Management.
Major borrowers
Below is the sector composition of the top 6 borrowers for the Group as of March 31, 2018 (NIS in millions):
Borrower no. Sector
On-balance sheet
credit risk(1)
Off balance sheet
credit risk(1) Total credit risk(1)
1. Transport and storage 600 357 957
2. Construction 247 493 740
3. Construction 3 600 603
4. Construction 8 522 530
5. Construction - 522 522
6. Construction 205 244 449
(1) On- and off-balance sheet credit risk is stated before impact of provision for credit losses, and before impact of deductible collateral with respect to indebtedness of borrower and of borrower group.

47
Leveraged financing
Leveraged financing is credit financing provided to customers which fulfills one of the following criteria:
1. Credit for an equity transaction would be classified according to one of the following rules: - Credit for an equity transaction (as defined below), provided that the balance of such credit exceeds
0.5% of Bank capital or NIS 35 million, whichever is higher. - For credit financing acquisition of equity interests in another banking corporation, or in a banking
holding corporation, provided that the balance of such credit exceeds NIS 35 million. - Additional credit extended to the borrower after the financing for the equity transaction, with
repayment primarily based on the cash flows derived from the equity interest whose purchase was financed by the banking corporation.
"Equity transaction": A transaction with one of the following goals:
- Buyout -purchase or buyback, by the borrower, of the borrower’s issued capital (including an employees’ stock ownership plan).
- Acquisition of another corporation -the purchase of any capital rights in another corporation, or the purchase of all, or a significant share, of the assets of another corporation.
- Capital distribution -the payment of dividends or other transaction whose goal is to increase shareholder value.
An equity transaction, with regard to leveraged financing, is one where the loan balance exceeds 0.5% of Bank capital and where the LTV ratio exceeds 50%.
2. Financing for leveraged companies, which is credit extended to companies with attributes which indicate that an adverse change in the global economic environment or in the specific environment of the sector in which they do business, may significantly impact their capacity to repay the bank. The Bank has specified criteria for defining credit included in this category, based on the business client's credit risk rating, as reflected by the Bank's rating model; it also specified benchmarks for leveraging (i.e. for significantly high deviation from typical norms for the sector), determined based on generally accepted financial ratios among Bank clients with material credit in major sectors in which the Bank operates. Leverage benchmarks and economic sectors are reviewed based on changes to the business environment and are modified as necessary. Borrowers flagged for one or more of the criteria specified are individually reviewed by a forum which includes representatives from the Business Division, the Risks Control Division and the Accounting and Financial Reporting Division, which reviews changes to financial parameters of the company and the economic environment in which it operates.
Details of Bank exposure to credit constituting leveraged financing are as follows:
Credit for equity transactions (NIS in millions):
Economic sector of acquired company
March 31, 2018
Balance sheet
credit risk
March 31, 2018
Off-balance
sheet credit risk
March 31, 2018
Total credit risk
March 31, 2018
Individual provision for credit
losses
March 31, 2017
Balance sheet
credit risk
March 31, 2017
Off-balance
sheet credit risk
March 31, 2017
Total credit risk
March 31, 2017
Individual provision for credit
losses
December 31, 2017 Balance
sheet credit risk
December 31, 2017
Off-balance
sheet credit risk
December 31, 2017
Total credit risk
December 31, 2017
Individual provision for credit
losses
Business services and other services - 79 79 - - - - - - - - -
Total - 79 79 - - - - - - - - -

48
Credit to leveraged companies (NIS in millions):
Economic sector of borrower
March 31, 2018
Balance sheet
credit risk
March 31, 2018
Off-balance
sheet credit risk
March 31, 2018
Total credit risk
March 31, 2018
Individual provision for credit
losses
March 31, 2017
Balance sheet
credit risk
March 31, 2017
Off-balance
sheet credit risk
March 31, 2017
Total credit risk
March 31, 2017
Individual provision for credit
losses
December 31, 2017 Balance
sheet credit risk
December 31, 2017
Off-balance
sheet credit risk
December 31, 2017
Total credit risk
December 31, 2017
Individual provision for credit
losses
Industry and production 86 6 92 - - - - - - - - -
Construction and real estate(1) 460 - 460 - - - - - - - - -
Commerce 442 41 483 - 478 140 618 - 108 16 124 -
Information and communications 40 110 150 - - 95 95 - 40 90 130 -
Financial services 157 - 157 307 - 307 - 183 - 183
Public and community services 71 5 76 - - - - - - - - -
Total 1,256 162 1,418 - 785 235 1,020 - 331 106 437 -
(1) The increase in credit risk to leveraged companies in the first quarter of 2018 is primarily due to a single client, for which the credit risk was classified as leveraged credit risk in this quarter.
Developments in problematic credit risk
Below is a summary of overall problematic credit risk and non-performing assets before provision for credit losses, in accordance with provisions for measurement and disclosure of impaired debts, credit risk and provision for credit losses (NIS in millions):
Total credit risk March 31, 2018
Total credit risk March 31, 2017
Total credit risk December 31, 2017
Problematic credit risk: Impaired credit risk 1,035 862 888 Inferior credit risk 280 436 315 Credit risk under special supervision -housing 1,087 900 1,072 Credit risk under special supervision -other 472 613 457 Total problematic credit risk 2,874 2,811 2,732
The increase in impaired credit risk, compared to previous periods, is due to classification of a few individual clients.
The decrease in inferior credit risk, compared to the corresponding period last year, is due to repayment of
client loans.
The increase in housing credit under special supervision risk, compared to the corresponding period last
year, is due to increase in the total mortgage portfolio.
Major risk benchmarks related to credit quality (in percent):
March 31, 2018 March 31, 2017 December 31, 2017
Ratio of impaired loans to the public to
total loans to the public 0.5 0.4 0.4
Ratio of impaired loans to the public to
total non-housing loans 1.4 1.2 1.2
Ratio of problematic loans to the public to
total non-housing loans 2.5 2.9 2.3
Ratio of housing loans in arrears 90 days
or longer to total loans to the public (1)(2) 0.6 0.5 0.6
Ratio of problematic credit risk to total credit risk
with respect to the public 1.2 1.3 1.2
(1) This non-housing rate is negligible. (2) Balance of credit in arrears before provision by extent of arrears.
For more information see chapter "Explanation and analysis of results and business standing" above.

49
Analysis of provision for credit losses
Analysis of movement in balance of provision for credit losses (NIS in millions):
For the three months ended March 31, 2018 -Provision for credit losses
Commercial Housing Individual -
other Total Banks and
governments Total
Balance of provision as of December 31, 2017 699 630 245 1,574 1 1,575 Expenses with respect to credit losses 53 6 22 81 1 82 Accounting write-offs (61) (1) (35) (97) - (97) Recovery of debts written off for accounting purposes in previous years 20 - 17 37 - 37 Net accounting write-offs (41) (1) (18) (60) - (60) Balance of provision as of March 31, 2018 711 635 249 1,595 2 1,597
For the three months ended March 31, 2017 -Provision for credit losses
Commercial Housing Individual -
other Total Banks and
governments Total
Balance of provision as of December 31, 2017 724 615 208 1,547 2 1,549 Expenses with respect to credit losses 26 - 24 50 (1) 49 Accounting write-offs (37) (3) (30) (70) - (70) Recovery of debts written off for accounting purposes in previous years 17 - 14 31 - 31 Net accounting write-offs (20) (3) (16) (39) - (39) Balance of provision as of March 31, 2018 730 612 216 1,558 1 1,559
For more information about provision for credit losses see Notes 6 and 13 to the financial statements. Major risk benchmarks related to provision for credit losses (in percent):
March 31, 2018 March 31, 2017 December 31, 2017
Ratio of provision for credit losses to total loans to the public 0.9 0.9 0.9 Ratio of provision for credit losses to total credit risk with respect to the public 0.7 0.7 0.7 Ratio of expenses with respect to credit losses to average balance of loans to the public, gross 0.2 0.1 0.1 Ratio of net write-offs to average balance of loans to the public, gross 0.1 0.1 0.1 Ratio of expenses with respect to credit losses to average balance of loans to the public, net 0.2 0.1 0.1 Of which: With respect to commercial loans other than housing loans(1) (2)0.5 0.3 0.3 Ratio of net write-offs to average balance of loans to the public, net 0.1 0.1 0.1
(1) The rate with respect to housing loans is negligible. (2) Total expenses with respect to credit losses were affected by a decrease in collection of debt previously written-off, compared
to the corresponding period last year and by an increase in the group-based provision due to the increase in loans to the public in this quarter.

50
Credit risk to individuals (excluding housing loans)(1)
The household segment is a key growth engine and a significant component of the Bank's strategic plan for 2017-2021. The individual client segment is highly diversified -by number of clients and by geographic location. Most clients in this segment are salaried employees with an individual account or joint household account. A recession in non-banking operations is a major risk factor for household activity and higher unemployment may increase the number of clients who face difficulties. Credit policies and work procedures with regard to extending credit, including to individual clients, include directives and guidelines with regard to credit underwriting and adapting credit to client needs and repayment capacity: Review of credit objective, requested LTV, loan term, analysis of client's repayment capacity and repayment sources, for all of their indebtedness. This includes review of various economic parameters of the client based, inter alia, on the client's regular income(2), pledged or unencumbered savings, knowledge of the client and past experience working with the client. The Bank regularly monitors the risk level in the loan portfolio to individuals, including by using an internal model for credit rating of individual clients, monitoring and analysis of expenses with respect to credit losses and by conducting various stress tests, including stress tests in conformity with Bank of Israel directives, which include scenarios such as: economic recession, significant increase in unemployment and higher interest rates.
Below is information about credit risk to individuals -balances and various risk attributes (NIS in millions):
As of March 31, 2018
As of December 31, 2017
As of December 31, 2017
Debts Checking balances 1,959 1,930 2,176 Utilized credit card balances 3,755 3,053 3,623 Auto loans(3) -adjustable interest 1,300 1,344 1,366 Auto loans(3)(4) -fixed interest 818 442 738 Other loans and credit -variable interest 10,993 10,775 10,677 Other loans and credit -fixed interest 188 178 232
Total debt (on-balance sheet credit) 19,013 17,722 18,812
Unutilized facilities, guarantees and other commitments Checking accounts -unutilized facilities 4,029 3,681 3,780 Credit cards -unutilized facilities 5,734 6,616 5,661 Guarantees 175 194 187 Other liabilities 74 40 67
Total unutilized facilities, guarantees and other commitments (off-balance sheet credit) 10,012 10,531 9,695
Total credit risk to individuals 29,025 28,253 28,507
Of which: Part of loans maturing in over 5 years(5) 2,550 2,039 2,400 Bullet / balloon loans(6) 620 631 647
Financial asset portfolio and other collateral against credit risk(7) Financial assets portfolio: Deposits 2,500 2,554 2,457 Securities 380 406 362 Other monetary assets 442 468 463 Other collateral(8) 1,042 1,208 1,098
Total financial assets portfolio and other collateral against credit risk 4,364 4,636 4,380
(1) As defined in Proper Banking Conduct Directive 451. (2) For measuring regular income in client accounts, the Bank uses "credit turnover" data for the account, including inter alia salaries and regular
pensions. (3) Further to the request by the Supervisor of Banks for a credit risk analysis for the "automobile trading" sector and for consumer credit for
automobile purchase, under various stress scenarios. The Bank's Risks Control conducted a comprehensive review of this issue, which was discussed in depth by administrative forums, including by the Board of Directors. Findings and recommendations of this review were incorporated in the credit policy document for 2018. As a result of risk analysis, there was no material effect on the group-based provision for credit losses.
(4) The increase is primarily due to transactions involving assignment of loan portfolios acquired by the Bank. (5) Primarily loans to salaried Government employees, where loan repayment is directly deducted from the client's pay check and which bear
significantly lower risk than similar loans for the same term. (6) Loans with a grace period for principal longer than one year. (7) Amounts presented are the financial assets portfolio and other collateral, only up to client debt amount. (8) Collateral is after applying the safety factor, in conformity with Bank factors accounted for when extending credit.

51
Composition by increase in borrower indebtedness(1)
Loan ceiling and credit risk (NIS in thousands)
As of March 31, 2018
Number of Borrowers
As of March 31, 2018
Total credit risk
As of March 31, 2017
Number of Borrowers
As of March 31, 2017
Total credit risk
As of December 31,
2017 Number of Borrowers
As of December 31,
2017 Total credit risk
Up to 10 274,347 596 251,462 529 271,931 562 Above 10 Up to 20 85,814 1,216 79,614 1,098 84,818 1,208 Above 20 Up to 40 116,495 3,333 115,517 3,226 115,167 3,331 Above 40 Up to 80 117,937 6,697 120,170 6,646 116,728 6,559 Above 80 Up to 150 74,986 8,070 75,671 7,949 73,393 7,916 Above 150 Up to 300 36,293 7,310 35,394 6,974 35,058 7,071 Above 300 3,597 1,803 3,937 1,831 3,523 1,860
Total 709,469 29,025 681,765 28,253 700,618 28,507
(1) Number of borrowers is for total on- and off-balance sheet credit risk.
Composition of on-balance sheet credit by fixed income(1) in account:
Income
As of March 31, 2018
NIS in millions
As of March 31, 2018 In %
As of December 31, 2017
NIS in millions
As of December 31, 2017 In %
Accounts with no fixed income 642 3.4 680 3.6
Less than NIS 10 thousand. 6,027 31.7 6,143 32.7 Between NIS 10 thousand and NIS 20 thousand 6,677 35.1 6,548 34.8
Over NIS 20 thousand 5,667 29.8 5,441 28.9
Total 19,013 100 18,812 100
(1) For measuring regular income in client accounts, the Bank uses "credit turnover" data for the account, including inter alia salaries and regular pensions.
Below is information about problematic credit risk before provision for credit losses (NIS in millions):
As of March 31,
2018 Credit risk(1)
On balance
sheet
As of March 31,
2018 Credit risk(1)
Off balance
sheet
As of March 31,
2018 Credit risk(1) Total
As of March 31,
2017 Credit risk(1)
On balance
sheet
As of March 31,
2017 Credit risk(1)
Off balance
sheet
As of March 31,
2017 Credit risk(1) Total
As of December 31, 2017
Credit risk(1) On balance
sheet
As of December 31, 2017
Credit risk(1) Off balance
sheet
As of December 31, 2017
Credit risk(1) Total
Balance of problematic credit risk 215 4 219 179 4 183 217 4 221
Problematic credit risk rate(2) 1.13% 0.04% 0.75% 1.01% 0.04% 0.65% 1.16% 0.03% 0.78%
(1) On- and off-balance sheet credit before impact of provision for credit losses, and before impact of deductible collateral with respect to indebtedness of borrower and of borrower group.
(2) The ratio of problematic credit risk to total credit risk before provision for credit losses.
Below is the expense rate with respect to credit losses to individuals (annualized)
As of March 31, 2018 As of March 31, 2017 As of December 31, 2017
Expense with respect to credit losses as percentage of total loans to the public to individuals 0.46% 0.59% 0.65%
52
Data for credit risk to individuals show that:
- Total debts by individuals (on-balance sheet credit) increased by 7.6% compared to March 31, 2017 and by 1.4% compared to December 31, 2017, primarily due to increase in loans and other credit.
- There was no significant change to composition of debts by individuals in the first quarter of 2018. As of March 31, 2018
Checking accounts 10%
Credit cards 20%
Auto loans 11%
Other loans and credit 59%
- Of all debts (on-balance sheet credit) as of March 31, 2018, 23% is secured by financial assets and other collateral in the client's account (similar to rates as of March 31, 2017 and as of December 31, 2017).
Given the risk attributes of this segment, the Bank increased its qualitative group-based provision for individuals, as directed by the Supervisor of Banks.
Moreover, the increase in expenses with respect to credit losses is due, inter alia, to the impact of legislation which reduces debt repayment by individual clients who are in difficulties.
Credit risk in construction and real estate economic sector in Israel
Credit operations in this sector account for a significant component of credit operations of the Business Division. In financing the construction and real estate industry, specific analysis and monitoring tools are used to assist the Bank in reaching decisions on the granting of financial support to the various projects. Construction financing in this industry is focused mainly on residential construction in areas with strong demand in central Israel at mid-level prices. In addition, the financing is allocated between geographic regions, based inter alia on relevant demand. In providing credit for construction, the Bank focuses on the financial support method (closed assistance). The application of this method is designed to reduce the exposure to risks in the granting of the loans, because it incorporates current and close monitoring of the progress of the financed project, both before the loans are provided, and as the project receives the financial support, while maintaining a distinction between the financed projects and the business risks inherent in the other activities of the developer-borrower. The Bank is assisted by outside construction supervisors, and also relies on liens on the land in the project, to secure the loans. Loans are issued for financed projects only by business centers and branches with professional knowledge of the subject, and under the supervision of the construction and real estate sector. The Bank also sets policies and rules for financing other real estate transactions, such as financing for rental properties, purchase groups, National Zoning Plan 38 etc.
For more information about the Bank acquiring an insurance policy for guarantees, see chapter "Significant events in the Bank Group's business" of the 2017 Report of the Board of Directors and Management.

53
Below is information about credit risk in the construction and real estate economic sector in Israel, by real estate collateral type (NIS in millions)
March 31, 2018 -Credit risk to the public(1)
Credit risk
On balance
sheet(2)
Credit risk
Off
balance
sheet(3)
Credit risk
Total
Total
problematic
credit risk
Impaired
Total problematic
credit risk
Other
problematic(4)
Balance of
provision for
credit losses
Balance
sheet credit
risk
Balance of
provision for
credit losses
Off-balance
sheet credit
risk
Secured by real estate in Israel: Housing 8,462 14,699 23,161 128 4 64 27 Commercial and industrial 3,995 876 4,871 70 5 57 2
Total secured by real estate in Israel: 12,457 15,575 28,032 198 9 121 29
Not secured by real estate in Israel 2,643 3,331 5,974 141 62 45 14 Total for construction and real estate economic sector in Israel 15,100 18,906 34,006 339 71 166 44
Of which: Designated for project assistance 7,755 13,341 21,096 3 4 68 30
March 31, 2017 - Credit risk to the public(1)
Credit risk
On balance
sheet(2)
Credit risk
Off balance
sheet(3)
Credit risk
Total
Total
problematic
credit risk
Impaired
Total
problematic
credit risk
Other
problematic(4)
Balance of
provision for
credit losses
Balance
sheet credit
risk
Balance of
provision for
credit losses
Off-balance
sheet credit
risk
Secured by real estate in Israel: Housing 6,342 13,786 20,128 153 47 39 34 Commercial and industrial 3,835 1,004 4,839 63 13 62 3
Total secured by real estate in Israel: 10,177 14,790 24,967 216 60 101 37
Not secured by real estate in Israel 2,363 3,205 5,568 136 44 39 15 Total for construction and real estate economic sector in Israel 12,540 17,995 30,535 352 104 140 52
Of which: Designated for project assistance 6,067 13,582 19,649 37 6 52 35
December 31, 2017 - Credit risk to the public(1)
Credit risk
On balance
sheet(2)
Credit risk
Off balance
sheet(3)
Credit risk
Total
Total
problematic
credit risk
Impaired
Total
problematic
credit risk
Other
problematic(4)
Balance of
provision for
credit losses
Balance
sheet credit
risk
Balance of
provision for
credit losses
Off-balance
sheet credit
risk
Secured by real estate in Israel: Housing 7,783 14,204 21,987 126 5 63 30 Commercial and industrial 4,319 769 5,088 60 13 57 2
Total secured by real estate in Israel: 12,102 14,973 27,075 186 17 120 32
Not secured by real estate in Israel 2,700 2,950 5,650 132 67 47 9 Total for construction and real estate economic sector in Israel 14,802 17,923 32,725 318 84 167 41
Of which: Designated for project assistance 7,617 13,047 20,663 13 4 61 28
(1) On- and off-balance sheet credit risk, problematic credit risk and impaired loans to the public are stated before impact of
provision for credit losses, and before impact of deductible collateral with respect to indebtedness of borrower. (2) Loans to the public, investment in debentures by the public, other debt by the public and other assets with respect to
derivatives against the public. (3) Credit risk of off-balance-sheet financial instruments as calculated for the purpose of determining per-borrower
indebtedness limits. (4) On- and off-balance sheet credit risk with respect to the public, which is inferior or under special supervision.

54
Below is information about credit risk in the construction and real estate economic sector in Israel, by asset status (NIS in millions):
March 31,
2018
Credit
risk(1)
On
balance
sheet
March 31,
2018
Credit
risk(1)
Off
balance
sheet
March 31,
2018
Credit
risk(1)
Total
March 31,
2017
Credit
risk(1)
On
balance
sheet
March 31,
2017
Credit
risk(1)
Off
balance
sheet
March 31,
2017
Credit
risk(1)
Total
December
31, 2017
Credit risk(1)
On balance
sheet
December
31, 2017
Credit risk(1)
Off balance
sheet
December
31, 2017
Credit risk(1)
Total
Real estate collateral in Israel
Real estate yet to be completely constructed:
Raw land 5,556 2,459 8,015 4,351 1,343 5,694 5,090 1,853 6,943 Real estate under
construction 4,783 12,042 16,825 3,570 13,009 16,579 4,463 12,606 17,068 Real estate completely
constructed 2,118 1,074 3,192 2,256 438 2,694 2,550 514 3,064 Total credit secured by
real estate in Israel 12,457 15,575 28,032 10,177 14,790 24,967 12,102 14,973 27,075
Not secured by real estate in Israel 2,643 3,331 5,974 2,363 3,205 5,568 2,700 2,950 5,650 Total credit risk for construction and real estate 15,100 18,906 34,006 12,540 17,995 30,535 14,802 17,923 32,725
(1) On- and off-balance sheet credit risk is stated before impact of provision for credit losses, and before impact of deductible collateral with respect to borrower indebtedness.
Credit risk data for the construction and real estate clients sector as of March 31, 2018 show that 51.36% of the on-balance sheet credit risk and 70.57% of the off-balance sheet credit risk is associated with closed assistance to real estate projects, mostly for residential construction in areas of strong demand in Central Israel and in Jerusalem. Most of the off-balance sheet credit is due to guarantees provided to home buyers pursuant to the Sale Act. Most of the credit risk in the construction and real estate sector is backed by real estate fully pledged to secure loan repayment. Note that for credit not secured by real estate collateral, there is other collateral in place, such as: deposits, securities etc. The share of the construction and real estate sector in Israel out of total credit risk to the public at the Bank as of March 31, 2018, as presented in chapter "Risks" below (Credit Risk by Economic Sector) is 14.22%. Note that according to Proper Banking Conduct Directive 315, the rate of indebtedness of the construction
and real estate sector (for calculation of sector concentration) is 10.56% (excluding liabilities, including
contingent liabilities to extend credit or to provide guarantees and amounts of Sales Act guarantees for which
the Bank has obtained an insurance policy).

55
Credit risk by economic sector -Consolidated As of March 31, 2018
Reported amounts (NIS in millions)
Total credit
risk(1)
Total
Total credit
risk(1)
Credit
perfor-
mance
rating(5)
Total credit
risk(1)
Proble-
matic(6)
Off balance
sheet debts(2)
and credit risk
(other than
derivatives)(3)
Total
Off balance
sheet debts(2)
and credit risk
(other than
derivatives)(3)
Debts
Off balance
sheet debts(2)
and credit risk
(other than
derivatives)(3)
Proble-
matic(6)
Off balance
sheet debts(2)
and credit risk
(other than
derivatives)(3)
Impaired
Off balance
sheet debts(2)
and credit risk
(other than
derivatives)(3)
Expenses with
respect to
credit losses
Off balance
sheet debts(2)
and credit risk
(other than
derivatives)(3)
Credit
losses(4) Net
accounting
write-offs
Off balance
sheet debts(2)
and credit risk
(other than
derivatives)(3)
Credit
losses(4)
Balance of
provision for
credit losses
Borrower activity in Israel Public -commercial Agriculture, forestry and fishing 808 802 6 807 600 6 4 (1) - 7 Mining and excavation 604 604 - 590 223 - - (1) - 3 Industry and production 9,148 8,755 393 8,828 5,063 393 249 6 5 112 Construction and real estate -construction(7) 30,934 30,545 389 30,928 12,768 389 322 5 2 163 Construction and real estate -real estate operations 3,072 3,051 21 3,050 2,319 21 17 (2) (1) 47 Electricity and water delivery 1,471 1,442 29 1,199 646 29 3 1 - 8 Commerce 10,520 10,216 304 10,387 8,002 304 205 32 17 165 Hotels, dining and food services 1,174 1,122 52 1,174 915 52 25 4 3 26 Transport and storage 2,353 2,335 18 2,342 1,672 18 7 3 4 12 Information and communications 1,046 1,032 14 1,040 416 14 8 - 1 5 Financial services 11,214 11,038 176 8,553 3,560 176 14 - 2 66 Other business services 3,952 3,857 95 3,921 2,733 95 45 6 7 49 Public and community services 2,199 2,169 30 2,121 1,709 30 22 - 1 11
Total commercial 78,495 76,968 1,527 74,940 40,626 1,527 921 53 41 674
Private individuals -housing loans 131,341 130,217 1,124 131,341 121,356 1,124 38 6 1 634 Private individuals -other 29,314 28,819 219 29,025 19,013 219 72 22 18 249
Total public -activity in Israel 239,150 236,004 2,870 235,306 180,995 2,870 1,031 81 60 1,557
Banks in Israel 1,457 1,457 - 307 233 - - 1 - 1 Government of Israel 7,729 7,729 - - - - - - - -
Total activity in Israel 248,336 245,190 2,870 235,613 181,228 2,870 1,031 82 60 1,558
Borrower activity overseas Total public -activity overseas 5,664 5,660 4 5,510 4,132 4 4 - - 38 Overseas banks 3,948 3,948 - 2,672 2,523 - - - - 1 Overseas governments 1,312 1,312 - 493 493 - - - - -
Total activity overseas 10,924 10,920 4 8,675 7,148 4 4 - - 39
Total 259,260 256,110 2,874 244,288 188,376 2,874 1,035 82 60 1,597
(1) On- and off-balance sheet credit risk, including with respect to derivatives (NIS in millions): Debts(2) -188,376; debentures -8,967; securities borrowed or acquired in conjunction with resale agreements -46; Assets with respect to derivatives -3,153; and Credit risk of off-balance-sheet financial instruments as calculated for the purpose of determining per-borrower indebtedness limits -58,718.
(2) Loans to the public, loans to governments, deposits with banks and other debts, except for debentures and securities borrowed or acquired in conjunction with resale agreements.
(3) Credit risk of off-balance-sheet financial instruments as calculated for the purpose of determining per-borrower lending limits, except for derivatives.
(4) Includes with respect to off-balance sheet credit instruments (included on balance sheet under Other Liabilities). (5) Credit risk whose credit rating as of the report date matches the credit rating for new credit performance, in conformity with Bank
policies. This is in accordance with directives of the Supervisor of Banks. (6) On- and off-balance sheet credit risk which is impaired, inferior or under special supervision, including with respect to housing
loans for which a provision was made by extent of arrears, and housing loans for which no provision was made by extent of arrears and which are in arrears of 90 days or longer.
(7) Includes on-balance sheet credit risk amounting to NIS 1,683 million and off-balance sheet credit risk amounting to NIS 1,773 million, provided to certain purchase groups in the process of construction and includes off-balance sheet credit risk amounting to NIS 5,312 million for which insurance has been acquired to cover the Sales Act guarantee portfolio from international re-insurers.

56
Credit Risk by Economic Sector -Consolidated -continued As of March 31, 2017
Reported amounts (NIS in millions)
Total credit
risk(1)
Total
Total credit
risk(1)
Credit
perfor-
mance
rating(5)
Total credit
risk(1)
Proble-
matic(6)
Off balance
sheet
debts(2) and
credit risk
(other than
derivatives)(3
)
Total
Off balance
sheet
debts(2) and
credit risk
(other than
derivatives)(3
)
Debts
Off balance
sheet debts(2)
and credit risk
(other than
derivatives)(3)
Proble-
matic(6)
Off balance
sheet debts(2)
and credit risk
(other than
derivatives)(3)
Impaired
Off balance
sheet debts(2)
and credit risk
(other than
derivatives)(3)
Expenses with
respect to credit
losses
Off balance
sheet debts(2)
and credit risk
(other than
derivatives)(3)
Credit losses(4)
Net accounting
write-offs
Off balance
sheet debts(2)
and credit risk
(other than
derivatives)(3)
Credit losses(4)
Balance of
provision for
credit losses
Borrower activity in Israel Public -commercial Agriculture, forestry and fishing 796 779 17 796 609 17 6 4 - 12 Mining and excavation 722 722 - 688 330 - - - - 4 Industry and production 8,406 8,209 197 8,251 4,971 197 90 4 4 92 Construction and real estate -construction(7) 28,213 27,644 (8)379 28,209 10,537 (8)379 282 1 6 135 Construction and real estate -real estate operations 2,322 2,245 77 2,315 1,998 77 70 (2) - 57 Electricity and water delivery 2,157 2,152 5 1,700 537 5 3 1 1 4 Commerce 10,879 10,357 522 10,712 8,143 522 207 21 5 216 Hotels, dining and food services 1,058 1,030 28 1,058 824 28 10 5 1 23 Transport and storage 1,953 1,929 24 1,948 1,204 24 12 2 3 8 Information and communications 1,075 1,065 10 1,070 511 10 4 1 - 8 Financial services (8)11,313 (8)10,990 323 (8)9,409 (8)3,444 323 17 (20) (6) 82 Other business services 3,614 3,536 78 3,572 2,502 78 37 7 3 45 Public and community services 1,972 1,944 28 1,902 1,540 28 17 2 3 7
Total commercial 74,480 72,602 1,688 71,630 37,150 1,688 755 26 20 693
Private individuals -housing loans 122,027 121,091 936 122,027 115,996 936 36 - 3 611 Private individuals -other (8)28,359 (8)27,938 183 (8)28,253 (8)17,722 183 67 24 16 216
Total public -activity in Israel 224,866 221,631 2,807 221,910 170,868 2,807 858 50 39 1,520
Banks in Israel 2,011 2,011 - 346 262 - - - - - Government of Israel 10,673 10,673 - 1 1 - - - - -
Total activity in Israel 237,550 234,315 2,807 222,257 171,131 2,807 858 50 39 1,520
Borrower activity overseas Total public -activity overseas 7,376 7,372 4 7,143 3,665 4 4 - - 38 Overseas banks 4,236 4,236 - 2,680 2,513 - - (1) - 1 Overseas governments 1,347 1,347 - 311 311 - - - - -
Total activity overseas 12,959 12,955 4 10,134 6,489 4 4 (1) - 39
Total 250,509 247,270 2,811 232,391 177,620 2,811 862 49 39 1,559
(1) On- and off-balance sheet credit risk, including with respect to derivatives (NIS in millions): Debts(2) -177,620; debentures -11,698; securities borrowed or acquired in conjunction with resale agreements -46; Assets with respect to derivatives -3,951; and Credit risk of off-balance-sheet financial instruments as calculated for the purpose of determining per-borrower indebtedness limits -57,194.
(2) Loans to the public, loans to governments, deposits with banks and other debts, except for debentures and securities borrowed or acquired in conjunction with resale agreements.
(3) Credit risk of off-balance-sheet financial instruments as calculated for the purpose of determining per-borrower lending limits, except for derivatives.
(4) Includes with respect to off-balance sheet credit instruments (included on balance sheet under Other Liabilities). (5) Credit risk whose credit rating as of the report date matches the credit rating for new credit performance, in conformity with
Bank policies. This is in accordance with directives of the Supervisor of Banks. (6) On- and off-balance sheet credit risk which is impaired, inferior or under special supervision, including with respect to
housing loans for which a provision was made by extent of arrears, and housing loans for which no provision was made by extent of arrears and which are in arrears of 90 days or longer.
(7) Includes on-balance sheet credit risk amounting to NIS 1,374 million and off-balance sheet credit risk amounting to NIS 1,447 million, provided to certain purchase groups in the process of construction and includes off-balance sheet credit risk amounting to NIS 6,165 million for which insurance has been acquired to cover the Sales Act guarantee portfolio from international re-insurers.
(8) Reclassified.
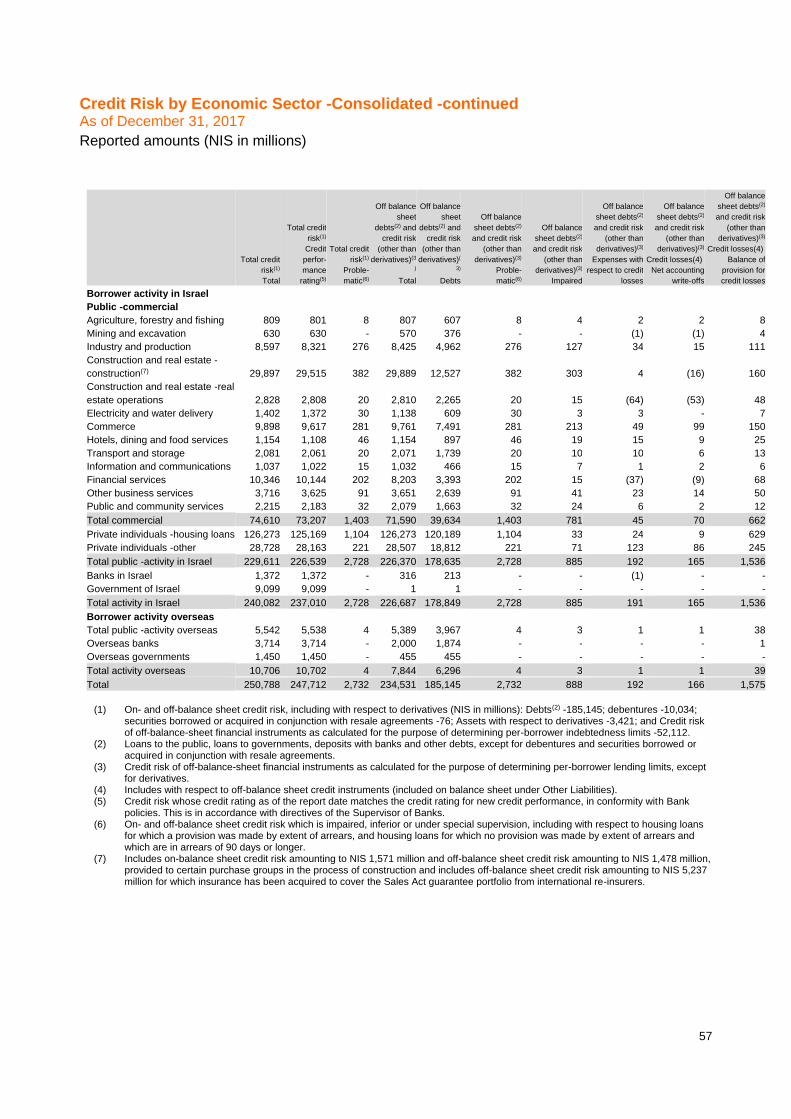
57
Credit Risk by Economic Sector -Consolidated -continued As of December 31, 2017
Reported amounts (NIS in millions)
Total credit
risk(1)
Total
Total credit
risk(1)
Credit
perfor-
mance
rating(5)
Total credit
risk(1)
Proble-
matic(6)
Off balance
sheet
debts(2) and
credit risk
(other than
derivatives)(3
)
Total
Off balance
sheet
debts(2) and
credit risk
(other than
derivatives)(
3)
Debts
Off balance
sheet debts(2)
and credit risk
(other than
derivatives)(3)
Proble-
matic(6)
Off balance
sheet debts(2)
and credit risk
(other than
derivatives)(3)
Impaired
Off balance
sheet debts(2)
and credit risk
(other than
derivatives)(3)
Expenses with
respect to credit
losses
Off balance
sheet debts(2)
and credit risk
(other than
derivatives)(3)
Credit losses(4)
Net accounting
write-offs
Off balance
sheet debts(2)
and credit risk
(other than
derivatives)(3)
Credit losses(4)
Balance of
provision for
credit losses
Borrower activity in Israel Public -commercial Agriculture, forestry and fishing 809 801 8 807 607 8 4 2 2 8
Mining and excavation 630 630 - 570 376 - - (1) (1) 4
Industry and production 8,597 8,321 276 8,425 4,962 276 127 34 15 111
Construction and real estate -
construction(7) 29,897 29,515 382 29,889 12,527 382 303 4 (16) 160
Construction and real estate -real
estate operations 2,828 2,808 20 2,810 2,265 20 15 (64) (53) 48
Electricity and water delivery 1,402 1,372 30 1,138 609 30 3 3 - 7
Commerce 9,898 9,617 281 9,761 7,491 281 213 49 99 150
Hotels, dining and food services 1,154 1,108 46 1,154 897 46 19 15 9 25
Transport and storage 2,081 2,061 20 2,071 1,739 20 10 10 6 13
Information and communications 1,037 1,022 15 1,032 466 15 7 1 2 6
Financial services 10,346 10,144 202 8,203 3,393 202 15 (37) (9) 68
Other business services 3,716 3,625 91 3,651 2,639 91 41 23 14 50
Public and community services 2,215 2,183 32 2,079 1,663 32 24 6 2 12
Total commercial 74,610 73,207 1,403 71,590 39,634 1,403 781 45 70 662
Private individuals -housing loans 126,273 125,169 1,104 126,273 120,189 1,104 33 24 9 629
Private individuals -other 28,728 28,163 221 28,507 18,812 221 71 123 86 245
Total public -activity in Israel 229,611 226,539 2,728 226,370 178,635 2,728 885 192 165 1,536
Banks in Israel 1,372 1,372 - 316 213 - - (1) - -
Government of Israel 9,099 9,099 - 1 1 - - - - -
Total activity in Israel 240,082 237,010 2,728 226,687 178,849 2,728 885 191 165 1,536
Borrower activity overseas Total public -activity overseas 5,542 5,538 4 5,389 3,967 4 3 1 1 38
Overseas banks 3,714 3,714 - 2,000 1,874 - - - - 1
Overseas governments 1,450 1,450 - 455 455 - - - - -
Total activity overseas 10,706 10,702 4 7,844 6,296 4 3 1 1 39
Total 250,788 247,712 2,732 234,531 185,145 2,732 888 192 166 1,575
(1) On- and off-balance sheet credit risk, including with respect to derivatives (NIS in millions): Debts(2) -185,145; debentures -10,034;
securities borrowed or acquired in conjunction with resale agreements -76; Assets with respect to derivatives -3,421; and Credit risk of off-balance-sheet financial instruments as calculated for the purpose of determining per-borrower indebtedness limits -52,112.
(2) Loans to the public, loans to governments, deposits with banks and other debts, except for debentures and securities borrowed or acquired in conjunction with resale agreements.
(3) Credit risk of off-balance-sheet financial instruments as calculated for the purpose of determining per-borrower lending limits, except for derivatives.
(4) Includes with respect to off-balance sheet credit instruments (included on balance sheet under Other Liabilities). (5) Credit risk whose credit rating as of the report date matches the credit rating for new credit performance, in conformity with Bank
policies. This is in accordance with directives of the Supervisor of Banks. (6) On- and off-balance sheet credit risk which is impaired, inferior or under special supervision, including with respect to housing loans
for which a provision was made by extent of arrears, and housing loans for which no provision was made by extent of arrears and which are in arrears of 90 days or longer.
(7) Includes on-balance sheet credit risk amounting to NIS 1,571 million and off-balance sheet credit risk amounting to NIS 1,478 million, provided to certain purchase groups in the process of construction and includes off-balance sheet credit risk amounting to NIS 5,237 million for which insurance has been acquired to cover the Sales Act guarantee portfolio from international re-insurers.

58
Exposure to Foreign Countries -Consolidated(1) Reported amounts (NIS in millions) Part A -Information regarding total exposure to foreign countries and exposure to countries for which total exposure to each country exceeds 1% of total consolidated
assets or 20% of capital, whichever is lower:
Country
Balance sheet exposure(2)
Cross-border balance sheet
exposure To
governments(4)
Balance sheet exposure(2)
Cross-border balance sheet
exposure To banks
Balance sheet exposure(2)
Cross-border balance sheet
exposure To others
Balance sheet exposure(2)
Balance sheet exposure of
Bank affiliates in foreign
country to local residents
Balance sheet exposure
before deduction
of local liabilities
Balance sheet exposure(2)
Balance sheet exposure of
Bank affiliates in foreign
country to local residents
Deduction with respect to local
liabilities
Balance sheet exposure(2)
Balance sheet exposure of
Bank affiliates in foreign
country to local residents
Net balance sheet exposure after deduction
of local liabilities
Balance sheet exposure(2)
Total balance sheet exposure
Balance sheet exposure(2)
On-balance sheet
problematic credit risk
Balance sheet exposure(2)
Impaired debts
Off-balance sheet
exposure(2)(3)(5) Total off-
balance sheet exposure
Off-balance sheet
exposure(2)(3)(5) Of which: Off-balance sheet troubled credit
risk
Off-balance sheet
exposure(2)(3)(5) Cross-border
balance sheet exposure
Maturing in under 1 year
Off-balance sheet
exposure(2)(3)(5) Cross-border
balance sheet exposure
Maturing in over 1 year
March 31, 2018 USA 2,902 338 1,266 400 400 - 4,506 17 - 614 - 2,034 2,472
France - 183 1,337 - - - 1,520 29 - 2,612 - 252 1,268 Germany 172 101 100 - - - 373 - - 3,000 - 145 228
Other 75 549 2,503 1,311 457 854 3,981 20 - 1,443 - 1,072 2,055
Total exposure to foreign countries 3,149 1,171 5,206 1,711 857 854 10,380 66 - 7,669 - 3,503 6,023
Of which: Total exposure to LDC countries 3 - 532 - - - 535 5 - 116 - 156 379
To Greece, Portugal, Spain, Italy and Ireland - 2 45 - - - 47 - - 66(6) - 14 33
March 31, 2017
USA 3,144 406 1,313 281 281 - 4,863 18 - 1,297 - 2,089 2,774
UK - 146 408 1,013 525 488 1,042 14 - 3,402 190 364 Other 115 406 3,267 - - - 3,788 24 - 4,004 - 1,255 2,533
Total exposure to foreign countries 3,259 958 4,988 1,294 806 488 9,693 56 - 8,703 - 3,534 5,671
Of which: Total exposure to LDC countries 2 - 493 - - - 495 3 - 148 - 151 344
To Greece, Portugal, Spain, Italy and Ireland - 2 48 - - - 50 - - 454 - 12 38

59
Country
Balance sheet exposure(2)
Cross-border balance sheet
exposure To
governments(4)
Balance sheet exposure(2)
Cross-border balance sheet
exposure To banks
Balance sheet exposure(2)
Cross-border balance sheet
exposure To others
Balance sheet exposure(2)
Balance sheet exposure of
Bank affiliates in foreign
country to local residents
Balance sheet exposure
before deduction
of local liabilities
Balance sheet exposure(2)
Balance sheet exposure of
Bank affiliates in foreign
country to local residents
Deduction with respect to local
liabilities
Balance sheet exposure(2)
Balance sheet exposure of
Bank affiliates in foreign
country to local residents
Net balance sheet exposure after deduction
of local liabilities
Balance sheet exposure(2)
Total balance sheet exposure
Balance sheet exposure(2)
On-balance sheet
problematic credit risk
Balance sheet exposure(2)
Impaired debts
Off-balance sheet
exposure(2)(3)(5) Total off-
balance sheet exposure
Off-balance sheet
exposure(2)(3)(5) Of which: Off-balance sheet troubled credit
risk
Off-balance sheet
exposure(2)(3)(5) Cross-border
balance sheet exposure
Maturing in under 1 year
Off-balance sheet
exposure(2)(3)(5) Cross-border
balance sheet exposure
Maturing in over 1 year
December 31, 2017
USA 3,231 336 1,239 368 368 - 4,806 15 - 654 - 1,532 3,274
France - 142 1,295 - - - 1,437 21 - 2,565 - 210 1,227
Germany 172 61 98 - - - 331 - - 2,999 - 106 225 Other 54 338 2,325 1,201 482 719 3,436 23 - 1,661 - 930 1,787
Total exposure to foreign countries 3,457 877 4,957 1,569 850 719 10,010 59 - 7,879 - 2,778 6,513
Of which: Total exposure to LDC countries 11 - 535 - - - 546 6 - 149 - 125 421
To Greece, Portugal, Spain, Italy and Ireland - 3 43 - - - 46 1 - 66 - 14 32
See remarks below.
ס

60
Exposure to foreign countries -consolidated(1) -continued
Reported amounts (NIS in millions)
Part B -Information regarding countries for which total exposure to each country is between 0.75%-
1% of total consolidated assets or between 15%-20% of capital, whichever is lower:
March 31, 2018
Balance sheet exposure
March 31, 2018
Off-balance sheet
exposure
March 31, 2017
Balance sheet
exposure
March 31, 2017
Off-balance sheet
exposure
December 31, 2017
Balance sheet
exposure
December 31, 2017
Off-balance sheet
exposure
UK 1,553 650 - - 1,343 687
France - - 1,297 929 - -
Part C -Information regarding balance sheet exposure to foreign countries facing liquidity issues
As of March 31, 2018, March 31, 2017 and December 31, 2017, the Bank has no balance sheet exposure to
foreign countries facing liquidity issues.
(1) Based on final risk, after effect of guarantees, liquid collateral and credit derivatives. (2) On- and off-balance sheet credit risk, problematic commercial credit risk and impaired debt are stated before impact of
provision for credit losses, and before impact of deductible collateral with respect to indebtedness of borrower and of borrower group.
(3) Credit risk of off-balance-sheet financial instruments as calculated for the purpose of determining per-borrower indebtedness limits, in conformity with Proper Banking Conduct Directive 313.
(4) Governments, official institutions and central banks. (5) The balance of off-balance sheet exposure includes NIS 5,312 million with respect to acquiring insurance from international
reinsurers for the portfolio of Sales Act guarantees for borrowers in the real estate sector in Israel. (as of December 31, 2017: NIS 5,237 million; as of March 31, 2017: NIS 6,165 million).

61
Credit exposure to foreign financial institutions
Below is information on the Bank's exposure to foreign financial institutions(1)(2) (NIS in millions): March 31, 2018
External credit rating
On-balance sheet credit risk(3)
Before offset of deposits with respect
to master netting agreements(5)
On-balance sheet credit risk(3)
After offset of deposits with respect
to master netting agreements(6)
Off balance sheet credit risk(4)
Current credit exposure
Before offset of deposits with respect
to master netting agreements
Current credit exposure
After offset of deposits with respect
to master netting agreements(5)
AAA to AA- 596 534 5,655 6,251 6,189
A+ to A- 164 97 272 436 369
BBB+ to BBB- 50 50 - 50 50
BB+ to B- - - 20 20 20
Lower than B- - - - - -
Unrated - - - - - Total credit exposure to foreign financial institutions 810 681 5,947 6,757 6,628
March 31, 2017
External credit rating
On-balance sheet credit risk(3)
Before offset of deposits with respect
to master netting agreements(5)
On-balance sheet credit risk(3)
After offset of deposits with respect
to master netting agreements(6)
Off balance sheet credit risk(4)
Current credit exposure
Before offset of deposits with respect
to master netting agreements
Current credit exposure
After offset of deposits with respect
to master netting agreements(5)
AAA to AA- 567 529 2,453 3,020 2,982
A+ to A- 413 208 4,702 5,115 4,910
BBB+ to BBB- 12 8 - 12 8
BB+ to B- - - 19 19 19
Lower than B- - - - - -
Unrated 1 1 - 1 1 Total credit exposure to foreign financial institutions 993 746 7,174 8,167 7,920
December 31, 2017
External credit rating
On-balance sheet credit risk(3)
Before offset of deposits with respect
to master netting agreements(5)
On-balance sheet credit risk(3)
After offset of deposits with respect
to master netting agreements(6)
Off balance sheet credit risk(4)
Current credit exposure
Before offset of deposits with respect
to master netting agreements
Current credit exposure
After offset of deposits with respect
to master netting agreements(5)
AAA to AA- 746 648 5,581 6,327 6,229
A+ to A- 306 94 269 575 363
BBB+ to BBB- 73 72 - 73 72
BB+ to B- - - 20 20 20
Lower than B- - - - - -
Unrated 2 2 - 2 2 Total credit exposure to foreign financial institutions 1,127 816 5,870 6,997 6,686
As of March 31, 2018, March 31, 2017 and December 31, 2017 there was no problematic credit risk, net.
Problematic credit risk -credit risk for impaired, inferior credit or credit under special supervision.
(1) Foreign financial institutions include: banks, investment banks, brokers/dealers, insurance companies, institutional entities and entities controlled by the former. Bank exposure is almost entirely to banks and investment banks primarily incorporated in the UK, USA, Germany, Switzerland and France.
(2) After deduction of provision for credit losses. (3) Bank deposits, loans to the public, investment in debentures, securities borrowed or acquired in conjunction with resale agreements
and other assets with respect to derivatives. (4) Primarily guarantees and commitments to grant credit, including guarantees to secure indebtedness of third parties. The balance of
off-balance sheet exposure to financial institutions includes NIS 5,312 million as of March 31, 2018 (as of March 31, 2017: NIS 6,165 million; as of December 31, 2017: NIS 5,237 million) with respect to acquiring insurance from international reinsurers for the portfolio of Sales Act guarantees for borrowers in the real estate sector in Israel.
(5) Presented net of fair value of liabilities with respect to derivatives for counter-parties which have signed master netting agreements. Comparative figures were reclassified.
(6) With respect to offset of cash deposits used as collateral for transactions with regard to financial derivatives.

62
The aforementioned credit exposure excludes exposure to financial institutions for which complete, explicit government guarantees are in place, and exclude investments in asset-backed securities. For more information with regard to credit exposure composition with respect to derivatives vis-à-vis banks and dealers/brokers (domestic and foreign), see Note 11.B. to the financial statements.
Some of the exposures listed in the above table are included under "Credit Risk by Economic Sector", under "Financial services". This includes deposits with banks, loans to the public, public investment in debentures and other assets with respect to derivatives. Futures transactions, weighted in accordance with rules stated in Proper Business Conduct Directive 313, are included as part of off-balance sheet credit risk, and are excluded from the above table.
In conjunction with its policies regarding management of exposure to foreign financial institutions, the Bank’s Board of Directors sets, inter alia, the risk appetite -i.e. the maximum exposure limit for states and foreign financial institutions, while adjusting the exposure limit to the risk assessment for each state and financial institution. Exposure limits are set based, inter alia, on rating of the various nations and financial institutions and on Bank assessment of the risk level in a manner which diversifies exposure.
The Bank determines the exposure limit to each financial institution based on the most recent rating available for said institution, provided by one of the leading international rating agencies are used -based on financial information for the institution under review. Exposure limits per institution include maximum exposure amount and maximum time to maturity for different types of activities and transactions. To this end, the existence (or absence) of an offset agreement for derivative operations with these financial institution is also taken into consideration. The policies also specify a hierarchy of authority for approval of specific transactions within the exposure limits.
The Bank monitors current ratings published for financial institutions to which it has exposure, and adjusts the exposure limits and actual exposure, as required, to the current rating. The Bank also reviews on a regular basis any additional information available with regard to these institutions in order to monitor exposure even where the credit rating may not reflect the complete picture.
The Bank takes into consideration the maturity dates of its credit exposure in conjunction with the Bank's liquidity requirements. Deposits are normally deposited for short terms, whereas exposure with respect to derivatives and investments in securities are for longer terms.
Housing credit risk and its development
In conjunction with credit risks management, the Bank takes various actions to manage, control and mitigate risks associated with provision of housing loans. The Bank estimates the risk profile associated with provision of housing loans as low, relative to the inherent risk in the Bank's overall loan portfolio, due to the high level of client diversification, geographic diversification of borrowers, relatively low leverage, which recently has decreased even further due to Bank of Israel directives, intensive review procedures of borrower quality and their repayment capacity, and securing credit with property as collateral.
The Bank acts regularly to control and manage the risk associated with housing loans, for which the Retail Division, the Risks Control Division and other Bank entities are responsible. This activity includes portfolio analysis by inherent risk factors (LTV, repayment ratio, geographic location, loan age, income decile etc.) and carrying out a variety of stress tests to review the impact of macro-economic factors on portfolio risk -primarily the impact of unemployment and interest rates. The Bank has developed an advanced model for rating housing loans, which includes a rating for each loan and calculation of potential loss in case of failure. This model is in addition to the Bank's existing monitoring tools.

63
Risk appetite and risk profile in mortgage segment
As part of its credit risk policies, the Bank has set various restrictions on housing loan operations, to account for major risk factors. These factors are reviewed from time to time and additional restrictions are imposed as needed, i.e. based on the actual risk profile of the mortgage portfolio and its trend, as well as on regulatory directives from the Bank of Israel.
The risk appetite for mortgages is defined using multiple risk benchmarks, which apply to credit risk and concentration risk aspects at regular performance level. These benchmarks include: differential risk premium (reflecting the risk of the mortgagee), the LTV ratio, property location (geographic risk), credit quality benchmark (see below under Credit Control), loan repayment to income ratio, loan purpose, loan term, loan track mix, property type, document quality, normative interest rate, financial wealth and cross restrictions on combinations of multiple parameters.
The Bank constantly monitors the risk profile of the mortgage portfolio and its development over time, in
view of the specified risk appetite. In particular, this monitoring is conducted through the Bank's quarterly
risks document which is presented to and approved by the Board of Directors and its Risks Management
Committee. Such monitoring reveals that leading risk benchmarks continue to remain relatively low. These
benchmarks include: LTV ratios, repayment ratio, rate of obligo in default and, in particular, the rate of
arrears for new loans (one year since origination), which is testimony to the high quality of underwriting at
the Bank. Note that the average LTV ratio for the Bank's mortgage portfolio (at end of March 2018) was
54.1% (reflecting the LTV ratio upon loan origination -see more details below). The Bank also estimates the
"actual" LTV ratio for the portfolio, based on changes to property values, based on estimates by the Central
Bureau of Statistics against the outstanding portfolio balances. This ratio is significantly lower than the
original LTV ratio due to the constantly higher housing prices. These data support the Bank's estimate that
the potential for loss due to the Bank's mortgage portfolio, even in scenarios involving material decline in
housing prices, is low. In addition, the Bank regularly reviews its mortgage portfolio under stress conditions,
including under significant change in macro-economic conditions, using multiple methodologies. The
outcome of stress testing indicates that portfolio risk has decreased and that the potential impact of a
severe stress event in the market is low.
Volume of mortgages granted by the Household segment is as follows:
Loans granted (NIS in millions)
Up to three months
2018
Up to three months
2017
Rate of change
In %
Mortgages issued (for housing and any
purpose)
From the Bank's funds 5,309 5,149 3.1
From funds of the Finance Ministry
Directed loans 72 38 89.5
Standing loans and grants 18 18 -
Total new loans 5,399 5,205 3.7
Refinanced loans 587 326 80.1
Total loans originated 5,986 5,531 8.2
Number of borrowers (includes refinanced
loans) 11,621 12,388 (6.2)

64
Below are details of various risk attributes of the housing loan portfolio(1) as of March 31, 2018 (NIS in millions):
Loan age(2) (time elapsed
since loan grant)
Loan age(2) (time elapsed since loan
grant)
Loan age(2) (time elapsed
since loan grant)
Up to 3 months
Loan age(2) (time elapsed
since loan grant)
3-12 months
Loan age(2) (time elapsed
since loan grant)
1-2 years
Loan age(2) (time elapsed
since loan grant)
2-5 years
Loan age(2) (time elapsed
since loan grant)
5-10 years
Loan age(2) (time elapsed
since loan grant)
Over 10 years
Loan age(2) (time elapsed
since loan grant) Total
Up to 60% Up to 35% 2,937 8,124 11,390 21,147 16,273 4,764 64,635 Up to 60% 35%-50% 300 1,015 1,739 3,992 4,482 1,008 12,536 Up to 60% 50%-80% - - 1 293 1,474 376 2,144 Up to 60% Over 80% - - - 36 124 68 228
60%-75% Up to 35% 1,027 3,062 5,754 14,086 7,526 1,097 32,552 60%-75% 35%-50% 87 351 757 1,845 1,873 295 5,208 60%-75% 50%-80% - - - 60 491 118 669 60%-75% Over 80% - - - - 40 15 55
Over 75% Up to 35% 54 240 213 371 1,735 1,156 3,769 Over 75% 35%-50% 4 27 19 59 373 387 869 Over 75% 50%-80% - - - 1 70 122 193 Over 75% Over 80% - - - - 7 29 36 Total 4,409 12,819 19,873 41,890 34,468 9,435 122,894
Loan age(2) (time elapsed
since loan grant)
Up to 3 months
Loan age(2) (time elapsed
since loan grant)
3-12 months
Loan age(2) (time elapsed
since loan grant)
1-2 years
Loan age(2) (time elapsed
since loan grant)
2-5 years
Loan age(2) (time elapsed
since loan grant)
5-10 years
Loan age(2) (time elapsed
since loan grant)
Over 10 years
Loan age(2) (time elapsed
since loan grant) Total
Of which: Loans granted with original amount over NIS 2 million 240 906 1,213 2,006 1,517 130 6,012 Percentage of total housing loans 5.4% 7.1% 6.1% 4.8% 4.4% 1.4% 4.9%
Loans bearing variable interest:
Non-linked, at prime lending rate 1,143 3,307 5,022 12,039 12,635 2,732 36,878
CPI-linked(3) 5 28 20 199 3,772 1,627 5,651 In foreign currency(3) 134 424 499 1,278 1,459 262 4,056 Total 1,282 3,759 5,541 13,516 17,866 4,621 46,585
Non-linked loans at prime lending rate, as percentage of total housing loans 25.9% 25.8% 25.3% 28.7% 36.7% 29.0% 30.0%
CPI-linked loans bearing variable interest as percentage of total housing loans 0.1% 0.2% 0.1% 0.5% 10.9% 17.2% 4.6%
Loans with LTV over 75% as percentage of total housing loans 1.3% 2.1% 1.2% 1.0% 6.3% 18.0% 4.0%
(1) Balance of housing loans after provision by extent of arrears. (2) The loan balances presented above are aged based on the date of loan origination, and include under the same age group
any loan balances actually provided at a later date. Furthermore, loan refinancing does not modify the loan age, i.e. the loan balance is attributed to the original loan origination
date. This treatment also applies to refinancing of "directed" loans originally guaranteed by the State and refinanced to loans for
which the Bank is responsible. (3) Pursuant to directives by the Supervisor of Banks, these include loans for which the interest rate is adjusted up to once every 5
years.

65
Attributes of the Bank's housing loan portfolio
The Bank's policies with regard to mortgages are based on a conservative approach, limiting specific risk for each loan by reviewing various attributes. These attributes include: LTV ratio, ratio of repayment to regular borrower income, and borrower capacity to make current repayments even under scenarios involving a change in interest rates. Whenever loans are granted with attributes which do not meet one or more of the standards set by the Bank for these attributes, the Bank requires additional bolstering for the loan, such as guarantors for the loan, proven repayment capacity not based on regular borrower income etc. In recent years, due to expansion of the housing market and relatively low interest environment, the Bank has enhanced measures taken to monitor and mitigate risk, as reflected by a significant decrease in loan risk factors, as detailed below (all data below as of March 31, 2018).
LTV ratio
One of the key parameters used by the Bank in minimizing risk in its housing loan portfolio is the LTV ratio (ratio of loan amount to value of the property pledged as collateral).
The average loan-to-value ratio for the Bank's mortgage portfolio as of March 31, 2018 was 54.1%, compared to 54.6% in the corresponding period last year and similar to the LTV ratio as of December 31, 2017. Out of the total loan portfolio of the Bank, amounting to NIS 122.9 million, some 96% were granted with an original LTV ratio under 75%, which secures the loan even in case of an extreme 25% decrease in value of the property pledged as collateral.
The LTV ratio in this report is the historical LTV ratio calculated upon loan approval, and does not account for any current repayments which reduce the loan balance nor any changes in value of properties pledged as collateral. The significant increase in housing prices, as from late 2008 and, conversely, reduced loan balances due to current repayments result in a decrease in the current "actual" LTV ratio and, as noted above, based on changes to property values as estimated by the Central Bureau of Statistics, against current portfolio balances. This ratio is significantly lower than the historical LTV ratio. Total loans granted at LTV ratios over 75% in the past two years amounted to NIS 0.6 billion, or only 0.5% of the total housing loan portfolio.
Note, in this regard, that the Bank's average LTV ratio as of March 31, 2018, based on current outstanding balances (with no change to property value due to changes in housing prices) would have decreased as follows: For loans originated up to one year ago -by 4%. For loans originated one to 5 years ago -by 7%; for loans originated over 5 years ago -by 19%; for all loans in total -by 11%.
The percentage of loans granted with a high LTV ratio (over 75%) out of total housing loan portfolio of the Bank to 1.2% for loans granted 1-2 years ago, 2.1% for loans granted 3-12 months ago and 1.3% for loans granted in the first quarter of 2018.
Repayment as percentage of regular income
The LTV ratio of a housing loan is a benchmark of loan security, regardless of borrower attributes. Therefore, in addition, when a mortgage is approved, the Bank requires borrowers to show their capacity to make current loan repayments on schedule, primarily by calculating the ratio of monthly repayment to regular borrower income.
The average repayment ratio for the Bank's housing loan portfolio is 26.9%. Some 82% of the Bank's mortgage portfolio were granted to borrowers with a repayment ratio under 35% (the average repayment ratio for these borrowers is 23.4%). Some 15.2% of the mortgage portfolio was granted to borrowers with a repayment ratio of 35% to 50% (the average repayment ratio for these borrowers is 39.6%). Some 2.5% of mortgages was granted to borrowers with a repayment ratio of 50% to 80% (the average repayment ratio for these borrowers is 59.6%), and only 0.3% was granted to borrowers with a repayment ratio over 80% (the average repayment ratio for these borrowers is 92.2%).
The loans with a high repayment ratio are loans granted to borrowers with significant other assets, whose repayment capacity is not necessarily based on current income, to borrowers with very high income where the repayment ratio is less significant, or where additional bolstering of the loan is in place, in addition to the pledged property and repayment capacity of the borrower, such as financially robust guarantors.
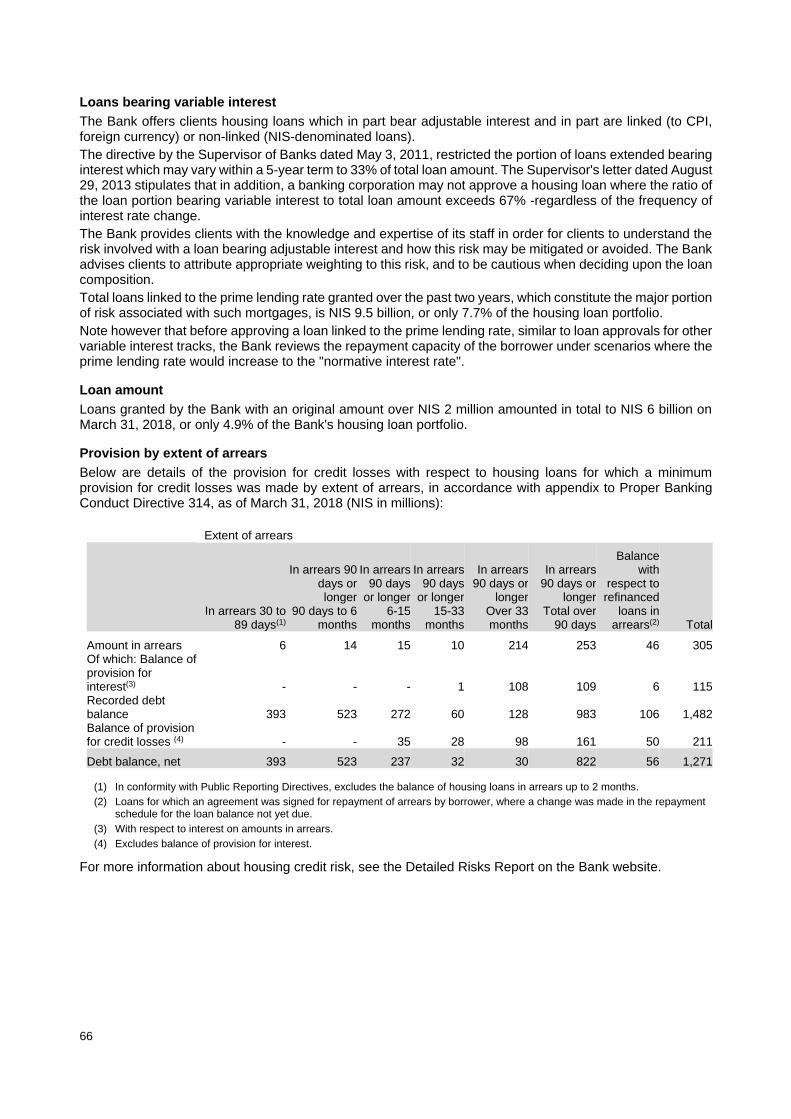
66
Loans bearing variable interest
The Bank offers clients housing loans which in part bear adjustable interest and in part are linked (to CPI, foreign currency) or non-linked (NIS-denominated loans).
The directive by the Supervisor of Banks dated May 3, 2011, restricted the portion of loans extended bearing interest which may vary within a 5-year term to 33% of total loan amount. The Supervisor's letter dated August 29, 2013 stipulates that in addition, a banking corporation may not approve a housing loan where the ratio of the loan portion bearing variable interest to total loan amount exceeds 67% -regardless of the frequency of interest rate change.
The Bank provides clients with the knowledge and expertise of its staff in order for clients to understand the risk involved with a loan bearing adjustable interest and how this risk may be mitigated or avoided. The Bank advises clients to attribute appropriate weighting to this risk, and to be cautious when deciding upon the loan composition.
Total loans linked to the prime lending rate granted over the past two years, which constitute the major portion of risk associated with such mortgages, is NIS 9.5 billion, or only 7.7% of the housing loan portfolio.
Note however that before approving a loan linked to the prime lending rate, similar to loan approvals for other variable interest tracks, the Bank reviews the repayment capacity of the borrower under scenarios where the prime lending rate would increase to the "normative interest rate".
Loan amount
Loans granted by the Bank with an original amount over NIS 2 million amounted in total to NIS 6 billion on March 31, 2018, or only 4.9% of the Bank's housing loan portfolio.
Provision by extent of arrears
Below are details of the provision for credit losses with respect to housing loans for which a minimum provision for credit losses was made by extent of arrears, in accordance with appendix to Proper Banking Conduct Directive 314, as of March 31, 2018 (NIS in millions):
Extent of arrears
In arrears 30 to
89 days(1)
In arrears 90 days or longer
90 days to 6 months
In arrears 90 days
or longer 6-15
months
In arrears 90 days
or longer 15-33
months
In arrears 90 days or
longer Over 33 months
In arrears 90 days or
longer Total over
90 days
Balance with
respect to refinanced
loans in arrears(2) Total
Amount in arrears 6 14 15 10 214 253 46 305 Of which: Balance of provision for interest(3) - - - 1 108 109 6 115 Recorded debt balance 393 523 272 60 128 983 106 1,482 Balance of provision for credit losses (4) - - 35 28 98 161 50 211
Debt balance, net 393 523 237 32 30 822 56 1,271
(1) In conformity with Public Reporting Directives, excludes the balance of housing loans in arrears up to 2 months. (2) Loans for which an agreement was signed for repayment of arrears by borrower, where a change was made in the repayment
schedule for the loan balance not yet due. (3) With respect to interest on amounts in arrears. (4) Excludes balance of provision for interest.
For more information about housing credit risk, see the Detailed Risks Report on the Bank website.

67
Market risk and interest risk
Risk description and development
Market risk -This is the risk of loss from On- and off-balance sheet positions, arising from change in fair value of financial instruments, due to change in market risk factors (interest rates, exchange rates, inflation, prices of equities and commodities).
Interest rate risk in the banking book is the risk to Bank profit (change in revenues) or to the Bank's economic value, primarily due to changes in the structure of interest rate curves relevant for Bank operations, non-identical fluctuations of various curves used by the Bank for pricing and management of its exposures, or from the fact that a change in interest rates may result in a change in composition of the Bank's assets and liabilities due to exercise of options for early repayment due to change in market interest rates.
The market risk in the negotiable portfolio is minimal, in line with Bank policy. The bank portfolio is exposed to increase in the interest rate curve due to the relatively long-term structure of uses (the mortgage portfolio) and continuing decrease in early mortgage repayment rates. Assessment of Bank exposure to interest risks in the first quarter of 2018 remains Medium. In the first quarter, risk values due to current operations increased. With regard to interest risk management. Exposure is monitored using various benchmarks in the normal course of business and under stress conditions. Following the updates to interest risk models, the limitations in terms of the EVE and VaR models were updated in the policy document.
Below is the VaR for the Bank Group (NIS in millions):
March 31, 2018 March 31, 2017 December 31, 2017
At end of period 593 764 533
Maximum value during period 640 (FEB) 764 (MAR) 781 (APR)
Minimum value during period 549 (JAN) 388 (FEB) 388 (FEB)
Market risk is primarily due to interest risk in the bank portfolio, as presented below.
Back-testing of the historical-analytic VaR model shows one case in which the daily loss exceeded the forecast VaR value. This number of cases is within the criteria specified by the Basel Committee for review of the VaR model quality.
Analysis of interest risk in bank portfolio
Below is the impact of a parallel shift of the curve by 2% on the economic value of the Bank's portfolio in EVE
terms (NIS in millions):
March 31, 2018 - Change in fair value
Israeli currency
Non-linked Israeli currency
Linked to CPI
Foreign currency
Dollar
Foreign currency
EUR Other Total
2% increase (753) (1,488) 48 (47) (1) (2,241)
Decrease of 2% 1,340 1,850 (27) 53 1 3,217
March 31, 2017 - Change in fair value
Israeli currency
Non-linked Israeli currency
Linked to CPI
Foreign currency
Dollar
Foreign currency
EUR Other Total
2% increase (1,073) (813) (50) (35) 5 (1,966)
Decrease of 2% 1,586 1,011 80 42 6 2,725
December 31, 2017 - - Change in fair value
Israeli currency
Non-linked Israeli currency
Linked to CPI
Foreign currency
Dollar
Foreign currency
EUR Other Total
2% increase (714) (1,112) 26 (47) (1) (1,848)
Decrease of 2% 1,285 1,408 (5) 53 2 2,743 In preparing the mortgage repayment cash flows forecast for the Bank, assumptions with regard to the prepayment rate and manner are taken into account. Market risk in the Bank's negotiable portfolio, primarily composed of portfolios managed in the trading room, is managed by means of quantitative limitations specified for each portfolio based on its activity.
The increase in risk values is due to current mortgage operations.

68
Exposure of the Bank and its subsidiaries to changes in interest rates
Reported amounts (NIS in millions)
As of
March 31,
2018
On Call
to
1 month
As of
March 31,
2018
Over 1
month to
3 months
As of
March 31,
2018
Over 3
months to
1 year
As of
March 31,
2018
Over
1 year to
3 years
As of
March 31,
2018
Over 3
years to
5 years
As of
March 31,
2018
Over 5
years to
10 years
As of
March 31,
2018
Over 10 to
20 years
As of
March 31,
2018
Over 20
years
As of
March 31,
2018
Without
maturity
As of
March 31,
2018
Total
fair value
As of
March 31,
2018
Internal
rate of
return
In %
As of
March 31,
2018
Average
effective
duration(2)
in years
As of
March 31,
2017
Total
fair value
As of
March 31,
2017
Internal
rate of
return
In %
As of
March 31,
2017
Average
effective
duration(2)
in years
As of
December
31, 2017
Total
fair
value
As of
December
31, 2017
Internal
rate of
return
In %
As of
December
31, 2017
Average
effective
duration(2)
in years
Israeli currency -non-linked
Financial assets, amounts
receivable with respect to
derivatives and to complex
financial assets
Financial assets(1) 128,339 1,896 5,922 11,117 8,034 6,851 3,898 365 397 166,819 3.63 1.29 160,748 4.06 0.98 164,265 3.67 1.31
Financial derivatives (other
than options) 5,717 4,928 28,022 9,315 6,825 6,162 19 - - 60,988 0.96 68,497 1.07 60,731 0.97
Options (in terms of underlying
asset) 699 1,012 1,977 461 154 - - - - 4,303 1.25 4,397 1.32 4,155 1.36
Total fair value 134,755 7,836 35,921 20,893 15,013 13,013 3,917 365 397 232,110 1.20 233,642 1.01 229,151 1.22
Financial liabilities, amounts
payable with respect to
derivatives and to complex
financial liabilities
Financial liabilities(1) 82,107 10,864 21,319 19,869 11,379 7,904 802 12 - 154,256 0.88 1.06 139,945 0.99 0.94 148,845 0.87 1.10
Financial derivatives (other
than options) 18,309 19,153 16,540 8,535 7,070 6,197 - - - 75,804 0.89 83,977 0.95 75,000 0.90
Options (in terms of underlying
asset) 522 741 2,320 242 82 - - - - 3,907 0.97 4,257 1.07 3,814 1.10
Total fair value 100,938 30,758 40,179 28,646 18,531 14,101 802 12 - 233,967 1.00 228,179 0.95 227,659 1.03
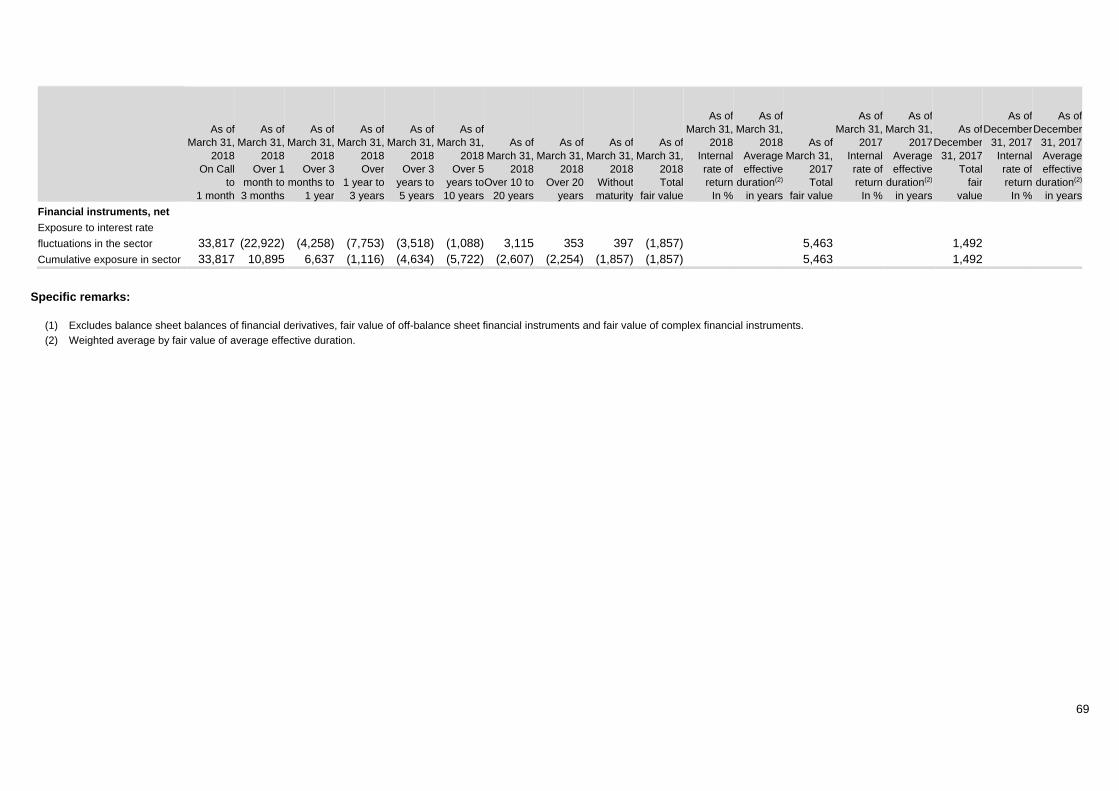
69
As of
March 31,
2018
On Call
to
1 month
As of
March 31,
2018
Over 1
month to
3 months
As of
March 31,
2018
Over 3
months to
1 year
As of
March 31,
2018
Over
1 year to
3 years
As of
March 31,
2018
Over 3
years to
5 years
As of
March 31,
2018
Over 5
years to
10 years
As of
March 31,
2018
Over 10 to
20 years
As of
March 31,
2018
Over 20
years
As of
March 31,
2018
Without
maturity
As of
March 31,
2018
Total
fair value
As of
March 31,
2018
Internal
rate of
return
In %
As of
March 31,
2018
Average
effective
duration(2)
in years
As of
March 31,
2017
Total
fair value
As of
March 31,
2017
Internal
rate of
return
In %
As of
March 31,
2017
Average
effective
duration(2)
in years
As of
December
31, 2017
Total
fair
value
As of
December
31, 2017
Internal
rate of
return
In %
As of
December
31, 2017
Average
effective
duration(2)
in years
Financial instruments, net
Exposure to interest rate
fluctuations in the sector 33,817 (22,922) (4,258) (7,753) (3,518) (1,088) 3,115 353 397 (1,857) 5,463 1,492
Cumulative exposure in sector 33,817 10,895 6,637 (1,116) (4,634) (5,722) (2,607) (2,254) (1,857) (1,857) 5,463 1,492
Specific remarks:
(1) Excludes balance sheet balances of financial derivatives, fair value of off-balance sheet financial instruments and fair value of complex financial instruments. (2) Weighted average by fair value of average effective duration.

70
Exposure of the Bank and its subsidiaries to changes in interest rates -continued Reported amounts (NIS in millions)
As of
March 31,
2018
On Call
to
1 month
As of
March 31,
2018
Over 1
month to
3 months
As of
March 31,
2018
Over 3
months to
1 year
As of
March 31,
2018
Over
1 year to
3 years
As of
March 31,
2018
Over 3
years to
5 years
As of
March 31,
2018
Over 5
years to
10 years
As of
March 31,
2018
Over 10 to
20 years
As of
March 31,
2018
Over 20
years
As of
March 31,
2018
Without
maturity
As of
March 31,
2018
Total
fair value
As of
March 31,
2018
Internal
rate of
return
In %
As of
March 31,
2018
Average
effective
duration(2)
in years
As of
March 31,
2017
Total
fair value
As of
March 31,
2017
Internal
rate of
return
In %
As of
March 31,
2017
Average
effective
duration(2)
in years
As of
December
31, 2017
Total
fair
value
As of
December
31, 2017
Internal
rate of
return
In %
As of
December
31, 2017
Average
effective
duration(2)
in years
Israeli currency -linked to
the CPI
Financial assets, amounts
receivable with respect to
derivatives and to complex
financial assets
Financial assets(1) 2,053 2,825 9,864 16,785 13,215 4,074 2,143 254 12 51,225 2.79 3.10 47,817 2.81 2.80 50,926 2.78 3.03
Financial derivatives (other
than options) 109 131 703 1,557 559 446 - - - 3,505 2.22 3,605 2.79 3,613 2.29
Total fair value 2,162 2,956 10,567 18,342 13,774 4,520 2,143 254 12 54,730 3.04 51,422 2.80 54,539 2.98
Financial liabilities,
amounts payable with
respect to derivatives and
to complex financial
liabilities
Financial liabilities(1) 425 820 6,811 10,158 9,333 7,329 2,286 - 3 37,165 0.99 3.57 40,274 1.22 3.41 38,814 1.07 3.75
Financial derivatives (other
than options) 555 485 1,700 1,789 571 318 22 - - 5,440 1.63 7,464 1.94 6,963 1.51
Total fair value 980 1,305 8,511 11,947 9,904 7,647 2,308 - 3 42,605 3.32 47,738 3.18 45,777 3.41

71
As of
March 31,
2018
On Call
to
1 month
As of
March 31,
2018
Over 1
month to
3 months
As of
March 31,
2018
Over 3
months to
1 year
As of
March 31,
2018
Over
1 year to
3 years
As of
March 31,
2018
Over 3
years to
5 years
As of
March 31,
2018
Over 5
years to
10 years
As of
March 31,
2018
Over 10 to
20 years
As of
March 31,
2018
Over 20
years
As of
March 31,
2018
Without
maturity
As of
March 31,
2018
Total
fair value
As of
March 31,
2018
Internal
rate of
return
In %
As of
March 31,
2018
Average
effective
duration(2)
in years
As of
March 31,
2017
Total
fair value
As of
March 31,
2017
Internal
rate of
return
In %
As of
March 31,
2017
Average
effective
duration(2)
in years
As of
December
31, 2017
Total
fair
value
As of
December
31, 2017
Internal
rate of
return
In %
As of
December
31, 2017
Average
effective
duration(2)
in years
Financial instruments, net
Exposure to interest rate
fluctuations in the sector 1,182 1,651 2,056 6,395 3,870 (3,127) (165) 254 9 12,125 3,684 8,762
Cumulative exposure in
sector 1,182 2,833 4,889 11,284 15,154 12,027 11,862 12,116 12,125 12,125 3,684 8,762
Specific remarks:
(1) Excludes balance sheet balances of financial derivatives, fair value of off-balance sheet financial instruments and fair value of complex financial instruments. (2) Weighted average by fair value of average effective duration.

72
Exposure of the Bank and its subsidiaries to changes in interest rates -continued Reported amounts (NIS in millions)
As of
March 31,
2018
On Call
to
1 month
As of
March 31,
2018
Over 1
month to
3 months
As of
March 31,
2018
Over 3
months to
1 year
As of
March 31,
2018
Over
1 year to
3 years
As of
March 31,
2018
Over 3
years to
5 years
As of
March 31,
2018
Over 5
years to
10 years
As of
March 31,
2018
Over 10 to
20 years
As of
March 31,
2018
Over 20
years
As of
March 31,
2018
Without
maturity
As of
March 31,
2018
Total
fair value
As of
March 31,
2018
Internal
rate of
return
In %
As of
March 31,
2018
Average
effective
duration(3)
in years
As of
March 31,
2017
Total
fair value
As of
March 31,
2017
Internal
rate of
return
In %
As of
March 31,
2017
Average
effective
duration(3)
in years
As of
December
31, 2017
Total
fair
value
As of
December
31, 2017
Internal
rate of
return
In %
As of
December
31, 2017
Average
effective
duration(3)
in years
Foreign currency(1)
Financial assets,
amounts receivable with
respect to derivatives
and to complex financial
assets
Financial assets(2) 7,554 4,987 2,060 1,130 1,824 1,289 100 - 61 19,005 2.77 1.08 18,271 1.99 1.29 18,131 2.14 0.97
Financial derivatives (other
than options) 32,351 25,225 20,592 7,879 2,531 1,688 - - - 90,266 0.39 87,241 0.40 80,083 0.45
Options (in terms of
underlying asset) 611 900 2,523 210 70 - - - - 4,314 0.16 4,848 0.14 4,228 0.06
Total fair value 40,516 31,112 25,175 9,219 4,425 2,977 100 - 61 113,585 0.50 110,360 0.54 102,442 0.53
Financial liabilities,
amounts payable with
respect to derivatives
and to complex financial
liabilities
Financial liabilities(2) 19,897 8,022 6,895 708 137 15 - - - 35,674 1.53 0.28 37,072 0.72 0.32 35,744 1.17 0.29
Financial derivatives (other
than options) 19,391 10,720 30,472 8,358 2,370 1,768 - - - 73,079 0.57 68,249 0.63 62,191 0.65
Options (in terms of
underlying asset) 757 1,131 2,207 433 125 - - - - 4,653 0.34 4,833 0.25 4,503 0.11
Total fair value 40,045 19,873 39,574 9,499 2,632 1,783 - - - 113,406 0.47 110,154 0.51 102,438 0.50

73
As of
March 31,
2018
On Call
to
1 month
As of
March 31,
2018
Over 1
month to
3 months
As of
March 31,
2018
Over 3
months to
1 year
As of
March 31,
2018
Over
1 year to
3 years
As of
March 31,
2018
Over 3
years to
5 years
As of
March 31,
2018
Over 5
years to
10 years
As of
March 31,
2018
Over 10 to
20 years
As of
March 31,
2018
Over 20
years
As of
March 31,
2018
Without
maturity
As of
March 31,
2018
Total
fair value
As of
March 31,
2018
Internal
rate of
return
In %
As of
March 31,
2018
Average
effective
duration(3)
in years
As of
March 31,
2017
Total
fair value
As of
March 31,
2017
Internal
rate of
return
In %
As of
March 31,
2017
Average
effective
duration(3)
in years
As of
December
31, 2017
Total
fair
value
As of
December
31, 2017
Internal
rate of
return
In %
As of
December
31, 2017
Average
effective
duration(3)
in years
Financial instruments,
net
Exposure to interest rate
fluctuations in the sector 471 11,239 (14,399) (280) 1,793 1,194 100 - 61 179 206 4
Cumulative exposure in
sector 471 11,710 (2,689) (2,969) (1,176) 18 118 118 179 179 206 4
Specific remarks:
(1) Includes Israeli currency linked to foreign currency. (2) Excludes balance sheet balances of financial derivatives, fair value of off-balance sheet financial instruments and fair value of complex financial instruments. (3) Weighted average by fair value of average effective duration.

74
Exposure of the Bank and its subsidiaries to changes in interest rates -continued Reported amounts (NIS in millions)
As of
March 31,
2018
On Call
to
1 month
As of
March 31,
2018
Over 1
month to
3 months
As of
March 31,
2018
Over 3
months to
1 year
As of
March 31,
2018
Over
1 year to
3 years
As of
March 31,
2018
Over 3
years to
5 years
As of
March 31,
2018
Over 5
years to
10 years
As of
March 31,
2018
Over 10 to
20 years
As of
March 31,
2018
Over 20
years
As of
March 31,
2018
Without
maturity
As of
March 31,
2018
Total
fair value
As of
March 31,
2018
Internal
rate of
return
In %
As of
March 31,
2018
Average
effective
duration(2)
in years
As of
March 31,
2017
Total
fair value
As of
March 31,
2017
Internal
rate of
return
In %
As of
March 31,
2017
Average
effective
duration(2)
in years
As of
December
31, 2017
Total
fair
value
As of
December
31, 2017
Internal
rate of
return
In %
As of
December
31, 2017
Average
effective
duration(2)
in years
Total exposure to
interest rate
fluctuations
Financial assets,
amounts receivable
with respect to
derivatives and to
complex financial
assets
Financial assets(1) 137,946 9,708 17,846 29,032 23,073 12,214 6,141 619 470 237,049 3.25 1.66 226,836 3.37 1.39 233,322 3.25 1.66
Financial derivatives
(other than options) 38,177 30,284 49,317 18,751 9,915 8,296 19 - - 154,759 0.65 159,343 0.74 144,427 0.71
Options (in terms of
underlying asset) 1,310 1,912 4,500 671 224 - - - - 8,617 0.70 9,245 0.70 8,383 0.70
Total fair value 177,433 41,904 71,663 48,454 33,212 20,510 6,160 619 470 400,425 1.25 395,424 1.11 386,132 1.29
Financial liabilities,
amounts payable with
respect to derivatives
and to complex
financial liabilities
Financial liabilities(1) 102,429 19,706 35,025 30,735 20,849 15,248 3,088 12 3 227,095 0.95 1.35 217,291 1.09 1.29 223,403 0.97 1.43
Financial derivatives
(other than options) 38,255 30,358 48,712 18,682 10,011 8,283 22 - - 154,323 0.77 159,690 0.86 144,154 0.83
Options (in terms of
underlying asset) 1,279 1,872 4,527 675 207 - - - - 8,560 0.62 9,090 0.63 8,317 0.56
Total fair value 141,963 51,936 88,264 50,092 31,067 23,531 3,110 12 3 389,978 1.10 386,071 1.10 375,874 1.18

75
As of
March 31,
2018
On Call
to
1 month
As of
March 31,
2018
Over 1
month to
3 months
As of
March 31,
2018
Over 3
months to
1 year
As of
March 31,
2018
Over
1 year to
3 years
As of
March 31,
2018
Over 3
years to
5 years
As of
March 31,
2018
Over 5
years to
10 years
As of
March 31,
2018
Over 10 to
20 years
As of
March 31,
2018
Over 20
years
As of
March 31,
2018
Without
maturity
As of
March 31,
2018
Total
fair value
As of
March 31,
2018
Internal
rate of
return
In %
As of
March 31,
2018
Average
effective
duration(2)
in years
As of
March 31,
2017
Total
fair value
As of
March 31,
2017
Internal
rate of
return
In %
As of
March 31,
2017
Average
effective
duration(2)
in years
As of
December
31, 2017
Total
fair
value
As of
December
31, 2017
Internal
rate of
return
In %
As of
December
31, 2017
Average
effective
duration(2)
in years
Financial instruments,
net
Exposure to interest rate
fluctuations in the sector 35,470 (10,032) (16,601) (1,638) 2,145 (3,021) 3,050 607 467 10,447 9,353 10,258
Cumulative exposure in
sector 35,470 25,438 8,837 7,199 9,344 6,323 9,373 9,980 10,447 10,447 9,353 10,258
Specific remarks:
(1) Excludes balance sheet balances of financial derivatives, fair value of off-balance sheet financial instruments and fair value of complex financial instruments. (2) Weighted average by fair value of average effective duration.
General remarks:
- In this table, data by terms represents the present value of future cash flows from each financial instrument, discounted using the interest rate which discounts them to the fair value consistent with assumptions according to which fair value was calculated for the financial instruments in Note 15 to the financial statements.
- Internal rate of return is the interest rate which discounts the expected cash flows from a financial instrument to its fair value recognized under Note 15 to the financial statements.
- Average effective duration of a group of financial instruments is an approximation of the change, in percent, in fair value of the group of financial instruments which would be caused by a minor change (0.1% increase) in the internal rate of return of each of the financial instruments.
- Certain transactions conducted by the Bank constitute complex financial instruments, which include embedded derivatives not detached, in accordance with Public Reporting Directives. These transactions include, inter alia, loans with exit points, deposits bearing graduated interest rates with withdrawal dates, credit and deposits with guaranteed minimum and deposits with optional linkage. The Bank reflects the interest rate risk with respect to these instruments in a reasonable manner, by spreading maturities of the cash flows in accordance with contract dates, and with various assumptions based on past experience.

76
Impact of hypothetical changes in interest rates on fair value of financial instruments of the Bank and its subsidiaries
Fair value of financial instruments before impact of hypothetical changes in interest rates (NIS in millions):
Israeli currency
Non-linked
Israeli currency Linked to
CPI
Foreign currency(2)
Dollar
Foreign currency(2)
EUR Other Total
March 31, 2018 Financial assets(1) 166,819 51,225 13,368 3,591 2,046 237,049 Amounts receivable with respect to financial derivatives(3) 65,291 3,505 75,104 14,670 4,806 163,376
Financial liabilities(1) (154,256) (37,165) (28,715) (4,499) (2,460) (227,095) Amounts payable with respect to financial derivatives(3) (79,711) (5,440) (59,493) (13,734) (4,505) (162,883)
Total (1,857) 12,125 264 28 (113) 10,447
December 31, 2017 Financial assets(1) 164,265 50,926 13,070 3,172 1,889 233,322 Amounts receivable with respect to financial derivatives(3) 64,886 3,613 68,750 10,741 4,820 152,810
Financial liabilities(1) (148,845) (38,814) (28,725) (4,643) (2,376) (223,403) Amounts payable with respect to financial derivatives(3) (78,814) (6,963) (52,978) (9,320) (4,396) (152,471)
Total 1,492 8,762 117 (50) (63) 10,258
Net fair value of financial instruments, after impact of changes in interest rates (NIS in millions)(4):
Israeli currency
Non-linked
Israeli currency Linked to
CPI
Foreign currency(2)
Dollar
Foreign currency(2)
EUR Other Total
Change in fair value
NIS in millions
Change in fair value
In %
March 31, 2018 Change in interest rates: Concurrent immediate increase of 1% (2,081) 12,046 183 (19) (116) 10,013 (434) (4.2) Concurrent immediate increase of 0.1% (1,883) 12,117 255 23 (113) 10,399 (48) (0.5) Concurrent immediate decrease of 1% (1,560) 12,217 353 78 (110) 10,978 531 5.1
December 31, 2017 Change in interest rates: Concurrent immediate increase of 1% 1,613 8,783 57 (92) (65) 10,296 38 0.4 Concurrent immediate increase of 0.1% 1,503 8,764 110 (54) (63) 10,260 2 - Concurrent immediate decrease of 1% 1,421 8,739 185 (6) (60) 10,279 21 0.2
(1) Includes Israeli currency linked to foreign currency. (2) Includes complex financial instruments. Excludes balance sheet balances of derivatives and fair value of off-balance sheet financial
instruments. Note that in calculation of the fair value of financial instruments, as stated in Note 15 to the financial instruments, the discount rate for
financial assets reflects the inherent credit risk and the discount rate for financial liabilities also reflects the Bank's premium on raising resources. This differs from calculation of the effect of interest risk in the banking portfolio, in EVE (Economic Value of Equity) terms, which only includes the effect of exposure to risk-free interest. There are also differences in assignment of expected future cash flows from different financial instruments. For the effects listed above, the fair value of financial instruments bearing adjustable interest were calculated assuming that cash flows would be repaid upon the next change in contractual interest rate.
(3) Amounts receivable (and payable) with respect to financial derivatives, discounted using interest rates used for calculation of the fair value.
(4) Net fair value of financial instruments presented in each linkage segment is the net fair value for this segment, assuming the indicated change in all interest rates in the linkage segment. Total net fair value of financial instruments is the net fair value of all financial instruments (excluding non-monetary items), assuming the indicated change in all interest rates in all linkage segments.
For further details of assumptions used in calculation of the fair value of financial instruments, see Note 15 to the financial statements.

77
Analysis of CPI and exchange rate exposures
Below is analysis of the sensitivity of Bank Group capital to changes in major exchange rates and in the CPI(before tax effect) as of March 31, 2018, capital increase (erosion) (NIS in millions):
10% increase 5% increase Decrease of 5% Scenarios
Decrease of 10%
Historical stress
scenario(1) Maximum increase
Historical stress
scenario(1) Maximum decrease
CPI(2) 1,314.3 669.2 (697.9) (1,395.9) 212.7 (107.7)
Dollar 70.7 29.5 (24.8) (41.5) 18.1 (12.6) Pound Sterling (2.5) (1.3) 0.9 0.1 (1.0) 0.9
Yen 3.6 (0.3) 0.1 0.8 (0.2) 0.1
EUR 9.8 2.5 (2.9) (12.5) 1.6 (1.1)
Swiss Franc 0.2 0.1 (0.4) (1.1) 0.3 (0.5)
(1) Stress scenarios were calculated based on daily changes in the exchange rate and monthly changes in the CPI, in the last 10 years.
(2) Capital sensitivity to a 3% increase / decrease in the CPI is NIS 411.2 million and NIS (418.8) million, respectively.
For more information about market and interest risk, see the Detailed Risks Report on the Bank website.
Share price risk
For more information about share price risk, see the Detailed Risks Report on the Bank website.
For information about equity investments in the bank portfolio, see Note 5 to these financial statements and Notes 12 and 15.A to the 2017 financial statements.
Operating risk
Risk description and development
Operating risk is defined by the Bank of Israel as the risk of loss due to inappropriateness or failure of internal procedures, people, systems or due to external events.
The Bank has defined a framework for management of operating risks, which includes a definition of corporate governance that specifies the roles and responsibilities of the lines of defense and the importance of deploying an appropriate operating risk management culture at the Bank.
The Bank actively handles operating risk in order to support operations of the business units, to improve major business processes associated with their operations and thus, to increase business value, rather than only reduce expected loss due to operating risk.
Information security and cyber risk - Information security risk is risk arising from faults in protection of the Bank's computer systems and information stored there. Cyber risk arises from an event including an attack on computer systems by or on behalf of internal or external adversaries of the Bank.
IT risk -risk arising from failure of the Bank's IT systems as a result of deficient availability and performance of these systems, incorrect performance and lack of support by the systems for the Bank's business needs.
Legal risk -Risk of loss due to exposure to fines, lawsuits and/or punitive action due to breach of contract or disagreements. Legal risk includes risks arising from legal exposure due to Bank conduct with its various interested parties (such as: clients, suppliers and other third parties).
In the first quarter of 2018, there were no significant events in the various operating risk areas.

78
The Bank applies Proper Banking Conduct Directive 355 concerning "Management of business continuity". In the first quarter of 2018, a DRP exercise took place (disaster recovery for IT), including testing of systems that were not part of the previous exercise and elimination of gaps from previous exercises.
As part of deployment of the business continuity plan, a meeting of internal control trustees took place, including delivery of a detailed review of BCP (Business Continuity Plan) procedures and the role of internal control trustees during emergencies. Knowledge items were created and disseminated with regard to business continuity in the knowledge management system for branch employees, in support of deployment and knowledge improvement.
The Bank participated in an exercise by the IDF Civilian Command, in coordination with the Bank Security Officer, which included an exercise in branches, including evacuation to a protected shelter, exercise of security procedures and review of branch performance in evacuation and assistance to the disabled in evacuation to the shelter.
Information security and cyber security
Directive 361 with regard to Cyber Defense Management provides guidelines for proper management of cyber risks, which require expansion and adjustment of the IT risks management framework with regard to the threat space perception and the required defensive capabilities. Accordingly, the Bank has an approved strategy and comprehensive cyber defense policy and has specified the defense lines for its implementation , has appointed an Information Security and Cyber Defense Manager, reporting to the Manager, Risks Control Division -responsible, inter alia, for setting policy on information security and cyber defense at the Bank, development of a cyber defense work plan, monitoring the implementation of this work plan and review of the effectiveness of systems and processes for information security and cyber defense. The direct banking systems at the Bank include authentication processes and tools in conformity with Proper Banking Conduct Directive 367.
In the first quarter of 2018, as part of an extensive wave of fraud attempts in the banking system, multiple attempts were made to transfer funds from client accounts which were victims of a phishing attack, where their account credentials and credit card information were stolen by using a fake website. These attempts were effectively identified by the defense systems applied by the Bank to protect its client accounts. The Bank immediately notified the clients whose accounts showed suspicious login or transfer attempts and instructed these clients to cancel their credit cards. This event was reported to relevant parties at the Bank and elsewhere. No damage was incurred by the Bank nor by Bank clients.
Information technology risk
In recent years, the risks associated with IT management have increased, due to development and deployment of new technologies and evolution of new risk and threats. Other than under routine conditions, the IT management framework addresses system failures, such as: system faults and preparation for emergency situations. This is also intended to ensure that the Bank maintain business continuity during an alert or emergency. This may mitigate reputation risks and business risks which could arise under such conditions.
Legal risk
Proper Banking Conduct Directive no. 350 concerning "Operating risks" defines legal risk as including, but not being limited to exposure to fines or penalties arising from supervisory action, as well as from individual arrangements.
The Bank's Legal Division regularly analyzes the legal risk components, the risk boundaries (arising, for example, from the counter-party identity, from creation of collateral etc.) as well as specific risk attributes while reviewing its risk level and exposure with attention to the different lines of business at the Bank. For more information about an investigation by the US Department of Justice concerning Bank Group business with its US clients, see Note 10.B.4 to the financial statements. For more information about operating risk, see also the Detailed Risks Report on the Bank website.

79
Liquidity and financing risk
Risk description and development
Liquidity risk -risk resulting from uncertainty as to the availability of sources and the ability to realize assets within a specified period of time and at a reasonable price. Financing risk -risk resulting from shortage of financing sources or too high costs to raise such sources.
Liquidity risk is managed subject to the limitations of the Board of Directors and Management in an effort to minimize the losses deriving from an investment of surplus liquidity in assets that are highly liquid, but have a low yield. There were no deviations from the Board of Directors’ limitations recorded in the first quarter of 2018. For more information about liquidity risk, see also the Detailed Risks Report on the Bank website.
Financing risk is managed, as part of the liquidity risk, using Board and management restrictions on concentration of financing sources and through reduced dependence on material counter-parties.
The Bank's main financing sources are stable and diverse sources for different time horizons -retail and business deposits, long-term deposits from financial institutions and issues of debentures and notes. The Bank sees the great importance of diversification of its financing sources and acts proactively to identify sources for longer terms, including through a wide range of deposits offered by the Bank to its clients, deposits with unique attributes, which allow clients to benefit from relatively high interest over the long term with optional liquidity during the deposit term. In the first quarter of 2018, the Bank continued diversifying of its financing sources and reducing concentration risk. Concentration risk for financing sources remained low.
For more information about financing sources, see chapter "Developments in financing sources" above.
For more information about financing risk, see also the Detailed Risks Report on the Bank website.
Liquidity coverage ratio
In conformity with Proper Conduct of Banking Business Regulation 221 "Liquidity coverage ratio", the minimum regulatory requirement as from January 1, 2017 is 100%. As part of its risks management policy, the Bank’s Board of Directors specified that additional safety cushions are to be maintained, beyond the regulatory minimum ratio; hence the target liquidity coverage ratio for the Bank and the Group in 2018 would by 5% higher than the minimum required. This ratio is managed and reported for all currencies in aggregate and for NIS separately, both at Bank level and on Group basis. The ratio for the Bank solo and the consolidated ratio are calculated daily and reported as the average of daily observations over 90 days prior to the report date. This directive is in addition to liquidity risk management using internal models, as stipulated by Directive 342, as described above.
The average (consolidated) liquidity coverage ratio for the first quarter of 2018 was 125%. As noted above, in the first quarter of 2018 there were no recorded deviations from these restrictions.
For more information about liquidity risk, see also the Detailed Risks Report on the Bank website.
As of March 31, 2018, the balance of the three largest depositor groups at the Bank Group amounted to NIS 9.0 billion.
raising sources and Bank liquidity status -In the first quarter of 2018, there was an increase in the Bank’s balance of deposits from the public. The balance of deposits from the public rose from NIS 183.6 billion on December 31, 2017 to NIS 187.1 billion on March 31, 2018, an increase by 1.9%.
In the non-linked segment, total deposits from the public amounted to NIS 138.3 billion, an increase by 3.9% compared to end of 2017. In the CPI-linked sector, deposits from the public amounted to NIS 14.1 billion, a decrease by 10.4%, and in the foreign currency sector -to NIS 34.7 billion, a decrease by 0.1% compared to end of 2017.

80
Other risks
Compliance and regulatory risk
Risk description and its development
Compliance risk is the risk of imposition of legal or regulatory sanctions, material financial loss or impact to reputation, which the Bank may incur due to its failure to comply with compliance provisions.
Compliance risk includes cross-border risk, which is presented separately below.
Compliance risk remained unchanged in the first quarter of 2018 and is defined as low-medium; the Bank believes it is trending downwards.
The decrease is due, inter alia, to further addressing the risks classified as High and further increase in control and training and increased efficiency of work processes in this area, including re-organization of the Compliance Division and creation of a specialized Compliance Risk Management Department. This is in view of further increased regulatory activity reflected, inter alia, in new directives being issued frequently, which the Bank is preparing for.
For more information see the Detailed Risks Report on the Bank website.
Cross-border and AML risk
Risk description and its development
Cross-border risk is the risk of financial loss (including due to legal proceedings, fines or sanctions imposed by statutory authorities or others in Israel and in other countries) and of impact to reputation, arising from the Bank's failure to comply with statutory provisions originating in other countries -whether provisions binding on the Bank or provisions which are not binding, but failure to comply with them may cause the Bank to incur damage, or from overseas activities of Bank clients in contravention of any statutory provisions.
Cross-border risk includes, inter alia, risk of damage, including impact to reputation, due to lawsuits or other enforcement proceedings brought by authorities in other countries, with regard to foreign tax laws applicable to certain Bank clients, AML and terror financing laws, sanctions imposed by international bodies and foreign authorities or other laws. Cross-border risk also applies at the Bank's overseas affiliates; in transactions with clients who are foreign residents; in business operations conducted by Bank representatives in foreign countries; and with regard to funds of individual Israeli clients invested overseas.
Cross-border risk includes the risk arising from obligations arising from US tax laws applicable to Bank Group operations outside of the USA (the Foreign Account Tax Compliance Act -"FATCA" and Qualified Intermediary -"QI"). This risk is also due to obligations stipulated by the Common Reporting Standard (CRS) issued by the OECD.
The Bank has near-zero appetite for cross-border risk.
Cross-border risk remained unchanged in the first quarter of 2018 and is defined as low-medium. The Bank continues preparations and manages risk, inter alia, by revising procedures, introducing computer-based work processes, reorganization of the Compliance Division and creation of a specialized Cross-border Risk Management Department, delivery of training, review of files and having clients sign as required.
AML and terror financing risk is the risk of imposition of legal or regulatory sanctions, of material financial loss or of damage to reputation and image, which the Bank may incur due to non And financing terrorism-compliance with AML and terror financing provisions.
In early 2018, Proper Conduct of Banking Business Directive 411 "AML and Terror Financing Risk Management" became effective. The Bank implements this directive, which introduced significant changes to definitions, Know Your Client, setting risk levels and other changes, with emphasis on risk-based management.
The Bank has near-zero risk appetite with regard to AML risk.
AML risk remained unchanged in the first quarter of 2018, due to continued intensive training and deployment activity, along with risk-focused controls and further deployment of an IT system to replace existing systems for identification of unusual activity and for reporting. This is along with the increase in business activity and in view of further increased regulatory activity reflected, inter alia, in new directives being issued frequently, which the Bank is preparing for.
For more information see the Detailed Risks Report on the Bank website.

81
Reputation risk
Risk description and its development
The Bank has mapped reputation risk as a material risk, because past events indicate that impact to the reputation of a financial institution may result in significant loss of value. Reputation risk is a stand-alone risk, but may also arise from materialization of other risks at the Bank, such as materialization of an operating risk event. Furthermore, impact to Bank reputation may bring about the materialization of other risks, in particular liquidity risk -with growing demand by clients to withdraw deposits.
In the first quarter of 2018 there were no events which negatively impacted the Bank's reputation.
For more information see the Detailed Risks Report on the Bank website.
Strategic risk
Risk description and its development
Strategic risk is the risk, in real time or potentially in future, of impact to Bank profits, capital or reputation, due to erroneous business decisions, improper deployment of decisions or insufficient preparation for changes in the business environment. This means the risk that the Bank chose the wrong strategy or that the Bank would not be able to implement the business and strategic plan as planned. The materiality of strategic risk requires the Bank to take measures which would allow it to manage this risk and take steps for assessment and early identification of events which may preclude implementation of the strategy.
Realization of the Igud acquisition transaction would challenge the Bank, due to the operating merger of the two banks, along with continued achievement of objectives in Mizrahi Tefahot's current strategic plan.
For more information see the Detailed Risks Report on the Bank website.
For more information about environmental risk, see chapter "Risks Overview" of the 2017 Report of the Board of Directors and Management.

82
Policies and critical accounting estimates, controls and procedures
Policies and critical accounting estimates The Bank's financial statements are prepared in conformity with generally accepted accounting policies in Israel (Israeli GAAP) and in accordance with Public Reporting Directives of the Supervisor of Banks. For most topics, these directives are based on generally acceptable accounting practices by US banks. For other, less material topics, these directives are based on International Financial Reporting Standards (IFRS) and on generally accepted accounting principles in Israel (Israeli GAAP). When International Financial Reporting Standards (IFRS) allow multiple alternatives, or do not specifically refer to a certain situation, these directives prescribe specific implementation guidelines, mostly based on generally acceptable accounting practices by US banks. The significant accounting policies are detailed in Note 1 to the 2017 financial statements. The application of generally accepted accounting principles by management at the time that the financial statements are prepared occasionally involves various assumptions, assessments and estimates that affect the amounts and business results reported in the financial statements. Some of the assumptions, assessments and estimates are critical to the financial position or the results of operations reflected in the Group's financial statements, because of the materiality of the matter, complexity of calculations or the extent of the probability that matters shrouded in uncertainty will be realized. Provisions for legal claims The financial statements include appropriate provisions to cover possible damages, where, in the estimation of the Bank's management, based on the opinion of its legal counsel, a provision is required. In accordance with the directives of the Supervisor of Banks, claims have been classified according to the range of probability of realization of the risk exposure, as follows:
1) Probable risk: there is a probability of more than 70% that a loss will be sustained from the claim. For claims whose probability of realization has been classified as Probable, an appropriate provision was made in the financial statements.
2) Reasonably Possible risk: there is a probability of between 20% and 70% that a loss will be sustained from the claim. For claims whose probability of realization has been classified as Reasonably Possible, an appropriate provision is made in specific instances on the financial statements, at the discretion of Bank management and based on the opinion of legal counsel.
3) Remote risk: there is a probability of less than 20% that a loss will be sustained from the claim. For claims whose probability of realization has been classified as Remote, no provision was made in the financial statements.
Note 26.C. to the annual financial statements for disclosure of material claims (whose amount, excluding interest and expenses, is over 1% of equity attributable to shareholders of the Bank) and Note 10.B. to these financial statements provide disclosure of material changes compared to the annual report. Likewise, disclosure is given to motions for recognition as class actions, when the amount claimed in them is material, when, in the estimation of the Bank's management, based on the opinion of its legal counsel, it is not possible, on the date of preparing these financial statements, to estimate their possible outcome, and therefore, no provision was recorded for them. In accordance with the directives of the Supervisor of Banks, the Bank is permitted to determine for class actions that it is not possible to estimate the prospects for realization of the exposure to risk in the four financial statements published since the claim was filed, or in case of delay of proceedings by decision of the Court. Beyond this, only in rare cases is the Bank permitted to determine that the prospects for realizing the exposure cannot be determined. Note that the provision for legal claims and contingent liabilities depends on multiple factors and involves a high degree of uncertainty. New information to be received by the Bank in future with regard to existing exposures as of the approval date of the financial statements may materially impact the exposure amount or the provision required with respect to such exposure. For more information about an investigation by the US Department of Justice concerning Bank Group business with its US clients, see Note 10.B.4 to the financial statements. For more information about accounting policies on critical matters, see chapter "Policies and critical accounting estimates" of the 2017 Report of the Board of Directors and Management. For more information about changes to critical accounting policies and critical accounting estimates with regard to group-based provision for credit losses and with regard to sector indebtedness limitation, see chapter "Changes to critical accounting policies and to critical accounting estimates" above.

83
Controls and Procedures
In accordance with the Public Reporting Directives of the Supervisor of Banks, based on requirements stipulated in Sections 302 and 404 of the American Sarbanes Oxley Act, the Bank President & CEO and the Chief Accountant of the Bank have each separately signed a Certification attached to the financial statements on "Disclosure Controls and Procedures (hereinafter: "Disclosure Certification").
The Disclosure Certification relates to the controls and procedures that were designed to assure that the information that the Bank requires for disclosure in accordance with the Public Reporting Regulations of the Supervisor of Banks, is accumulated, processed and sent to the Bank's Executive Management in a manner that enables decisions to be reached at an appropriate time, with respect to disclosure requirements. The certification also refers to setting of internal controls over financial reporting intended to provide a reasonable degree of certainty with regard to the reliability of financial reporting and to the fact that the financial statements for external use are prepared in accordance with generally accepted accounting principles and with directives and guidelines of the Supervisor of Banks.
Evaluation of controls and procedures with regard to disclosure
Further to adjustment of controls and procedures with regard to disclosure concerning the change in structure of the financial statements, made in 2017, in the first quarter of 2018 additional adjustments were made with regard to quarterly financial statements. Bank management, together with the Bank President & CEO and the Chief Accountant of the Bank, evaluated the effectiveness of the Bank's disclosure controls and procedures as of March 31, 2018. Based on this evaluation, the Bank President & CEO and the Chief Accountant of the Bank concluded that at the end of the period ended March 31, 2018, the disclosure controls and procedures are effective for recording, processing, summarizing and reporting the information that the Bank is required to disclose in the quarterly report, in accordance with the Public Reporting Regulations of the Supervisor of Banks, on the date stipulated in these Regulations.
Changes to internal controls
In the first quarter of 2018, no change occurred in the Bank's internal controls over financial reporting that had a material effect, or can reasonably be expected to have a material effect on the Bank's internal controls over financial reporting.
Moshe Vidman
Chairman of the Board of Directors
Eldad Fresher
President & CEO
Approval date:
Ramat Gan
May 7, 2018
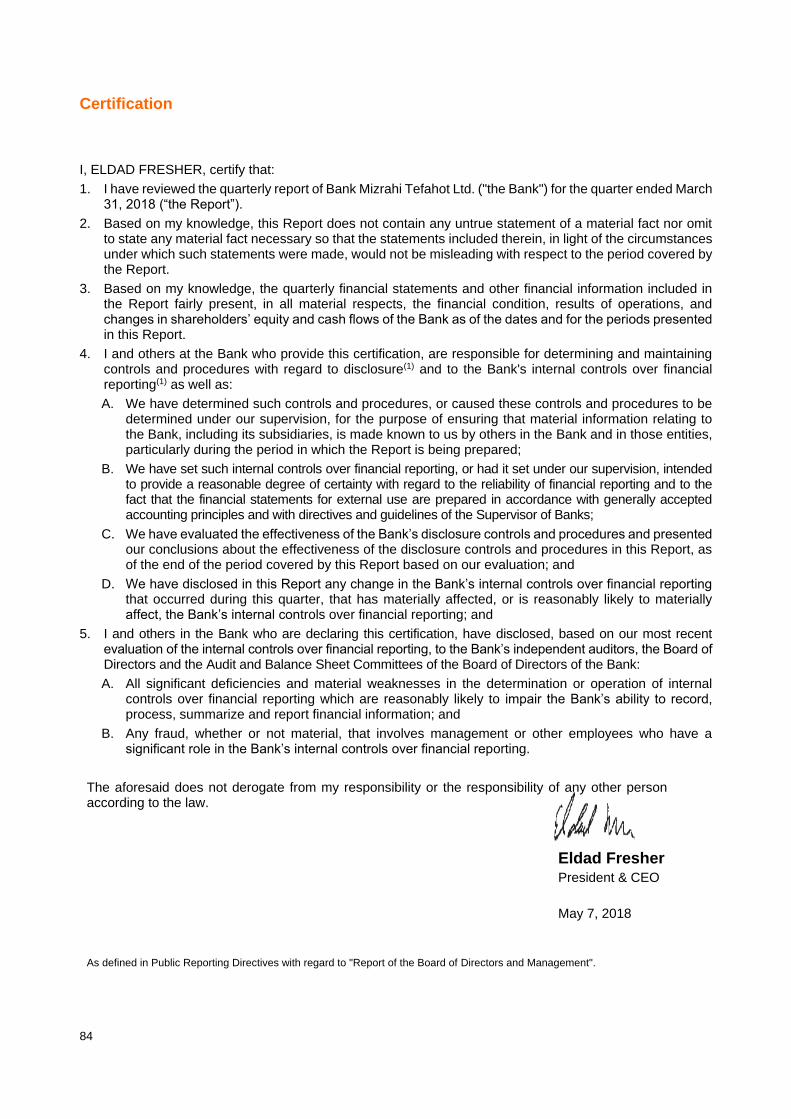
84
Certification
I, ELDAD FRESHER, certify that:
1. I have reviewed the quarterly report of Bank Mizrahi Tefahot Ltd. ("the Bank") for the quarter ended March 31, 2018 (“the Report”).
2. Based on my knowledge, this Report does not contain any untrue statement of a material fact nor omit to state any material fact necessary so that the statements included therein, in light of the circumstances under which such statements were made, would not be misleading with respect to the period covered by the Report.
3. Based on my knowledge, the quarterly financial statements and other financial information included in the Report fairly present, in all material respects, the financial condition, results of operations, and changes in shareholders’ equity and cash flows of the Bank as of the dates and for the periods presented in this Report.
4. I and others at the Bank who provide this certification, are responsible for determining and maintaining controls and procedures with regard to disclosure(1) and to the Bank's internal controls over financial reporting(1) as well as:
A. We have determined such controls and procedures, or caused these controls and procedures to be determined under our supervision, for the purpose of ensuring that material information relating to the Bank, including its subsidiaries, is made known to us by others in the Bank and in those entities, particularly during the period in which the Report is being prepared;
B. We have set such internal controls over financial reporting, or had it set under our supervision, intended to provide a reasonable degree of certainty with regard to the reliability of financial reporting and to the fact that the financial statements for external use are prepared in accordance with generally accepted accounting principles and with directives and guidelines of the Supervisor of Banks;
C. We have evaluated the effectiveness of the Bank’s disclosure controls and procedures and presented our conclusions about the effectiveness of the disclosure controls and procedures in this Report, as of the end of the period covered by this Report based on our evaluation; and
D. We have disclosed in this Report any change in the Bank’s internal controls over financial reporting that occurred during this quarter, that has materially affected, or is reasonably likely to materially affect, the Bank’s internal controls over financial reporting; and
5. I and others in the Bank who are declaring this certification, have disclosed, based on our most recent evaluation of the internal controls over financial reporting, to the Bank’s independent auditors, the Board of Directors and the Audit and Balance Sheet Committees of the Board of Directors of the Bank:
A. All significant deficiencies and material weaknesses in the determination or operation of internal controls over financial reporting which are reasonably likely to impair the Bank’s ability to record, process, summarize and report financial information; and
B. Any fraud, whether or not material, that involves management or other employees who have a significant role in the Bank’s internal controls over financial reporting.
The aforesaid does not derogate from my responsibility or the responsibility of any other person according to the law.
Eldad Fresher President & CEO
May 7, 2018
As defined in Public Reporting Directives with regard to "Report of the Board of Directors and Management".

85
Certification
I, MENAHEM AVIV, certify that:
1. I have reviewed the quarterly report of Bank Mizrahi Tefahot Ltd. ("the Bank") for the quarter ended March 31, 2018 (“the Report”).
2. Based on my knowledge, this Report does not contain any untrue statement of a material fact nor omit to state any material fact necessary so that the statements included therein, in light of the circumstances under which such statements were made, would not be misleading with respect to the period covered by the Report.
3. Based on my knowledge, the quarterly financial statements and other financial information included in the Report fairly present, in all material respects, the financial condition, results of operations, and changes in shareholders’ equity and cash flows of the Bank as of the dates and for the periods presented in this Report.
4. I and others at the Bank who provide this certification, are responsible for determining and maintaining controls and procedures with regard to disclosure(1) and to the Bank's internal controls over financial reporting(1) as well as:
A. We have determined such controls and procedures, or caused these controls and procedures to be determined under our supervision, for the purpose of ensuring that material information relating to the Bank, including its subsidiaries, is made known to us by others in the Bank and in those entities, particularly during the period in which the Report is being prepared;
B. We have set such internal controls over financial reporting, or had it set under our supervision, intended to provide a reasonable degree of certainty with regard to the reliability of financial reporting and to the fact that the financial statements for external use are prepared in accordance with generally accepted accounting principles and with directives and guidelines of the Supervisor of Banks;
C. We have evaluated the effectiveness of the Bank’s disclosure controls and procedures and presented our conclusions about the effectiveness of the disclosure controls and procedures in this Report, as of the end of the period covered by this Report based on our evaluation; and
D. We have disclosed in this Report any change in the Bank’s internal controls over financial reporting that occurred during this quarter, that has materially affected, or is reasonably likely to materially affect, the Bank’s internal controls over financial reporting; and
5. I and others in the Bank who are declaring this certification, have disclosed, based on our most recent evaluation of the internal controls over financial reporting, to the Bank’s independent auditors, the Board of Directors and the Audit and Balance Sheet Committees of the Board of Directors of the Bank:
A. All significant deficiencies and material weaknesses in the determination or operation of internal controls over financial reporting which are reasonably likely to impair the Bank’s ability to record, process, summarize and report financial information; and
B. Any fraud, whether or not material, that involves management or other employees who have a significant role in the Bank’s internal controls over financial reporting.
The aforesaid does not derogate from my responsibility or the responsibility of any other person according to the law.
Menahem Aviv Vice-president, Chief Accountant
May 7, 2018

86
Independent Auditors’ Review Report to Shareholders of Bank Mizrahi-Tefahot Limited
Introduction
We have reviewed the enclosed financial information of Bank Mizrahi Tefahot Ltd. ("the Bank"), consisting of the condensed consolidated interim balance sheet as of March 31, 2018, the condensed consolidated interim statements of profit and loss, comprehensive income, changes to shareholder equity and cash flows for the three-month periods then ended. The Board of Directors and management are responsible for preparation and presentation of financial information for this interim period, in accordance with generally accepted accounting practice in Israel (Israeli GAAP) for interim financial reporting and in accordance with directives and guidance of the Supervisor of Banks. We are responsible for expressing our conclusion as to the financial information for this interim period based on our review.
We did not review the condensed interim financial information of certain consolidated subsidiaries, whose assets included in consolidation constitute 6.33% of total consolidated assets as of March 31, 2018, and whose net interest revenues before expenses with respect to credit losses included in the consolidated statements of profit and loss constitute 9.93% of total consolidated net interest revenues before expenses with respect to credit losses for the three-month period then ended. Furthermore, we did not review the condensed interim financial information of an associated company treated according to the equity method, the investment in which amounted to NIS 19 million as of March 31, 2018. The condensed financial information for the interim period of the aforementioned companies was reviewed by other independent auditors, we have been provided with their review reports and our conclusions, in as much as it relates to the financial information with respect to those companies, is based on the review reports by those other independent auditors.
Review scope
We have conducted our review in accordance with Review Standard no. 1 of the Institute of Certified Public Accountants in Israel "Review of Financial Information for Interim Periods Conducted by the Entity's Independent Auditor" and with the review standard whose application to review of banking corporations is stipulated in accordance with directives and guidance of the Supervisor of Banks. A review of financial information for interim periods consists of discussions, mostly with persons responsible for financial and accounting issues, and of application of analytical and other review procedures. A review is significantly limited in scope as compared to an audit conducted in accordance with generally accepted audit standards in Israel, and therefore it does not enable us to achieve assurance that we have knowledge of all material matters which might have been identified in an audit. Accordingly, we do not express an audit opinion.
Conclusion
Based on our review, and on the review reports of other auditors, nothing has come to our attention that would cause us to believe that the aforementioned financial information has not been prepared, in all material aspects, in accordance with Israeli GAAP for interim financial reporting and in accordance with directives and guidance of the Supervisor of Banks.
Without qualifying our conclusion, we draw your attention to:
A. Note 8.3, section 3 and to Note Note 10.B.3.(a-d) with regard to contingent liabilities of the Bank and a subsidiary thereof, including lawsuits filed against the Bank and motions for class action status.
B. Note 10.B.4. with regard to an investigation by the US Department of Justice concerning Bank Group business with its US clients.
Brightman Almagor Zohar & Co.
Certified Public Accountants
Member of Deloitte Touche Tohmatsu Limited
Tel Aviv, May 7, 2018

87
Condensed Financial Statements
Table of Contents
Condensed consolidated statement of profit and loss 89
Condensed consolidated statement of profit and loss - Continued 90
Condensed consolidated statement of comprehensive income 90
Condensed consolidated balance sheet 91
Condensed Consolidated Statement of Changes in Shareholders' Equity 92
Condensed consolidated statement of cash flows(1) 94
Note 1 - Reporting Principles and Accounting Policies 96
Note 2 - Interest revenues and expenses 100
Note 3 - Non-interest financing revenues 101
Note 4 - Cumulative other comprehensive income (loss) 102
Note 5 - Securities 104
Note 6 - Credit risk, loans to the public and provision for credit losses 108
Note 7 - Deposits from the Public 111
Note 8 - Employees’ Rights 112
Note 9 - Capital adequacy, liquidity and leverage pursuant to directives of the Supervisor of Banks 114
Note 10 - Contingent Liabilities and Special Commitments 118
Note 11 - Derivatives and hedging activities 127
Note 12 - Operating Segments 136
Note 13 - Additional information about credit risk, loans to the public and provision for credit losses 149
Note 14 - Assets and Liabilities by Linkage Basis 166
Note 15 - Balances and estimates of fair value of financial instruments 169
Note 16 - Events after the balance sheet date 180

88

89
Condensed consolidated statement of profit and loss Reported amounts (NIS in millions)
Note
For the three
months ended
March 31,
2018
(unaudited)
For the three
months ended
March 31,
2017
(unaudited)
For the year ended
December 31,
2017
(audited)
Interest revenues 2 1,449 1,356 6,222
Interest expenses 2 368 329 1,875
Interest revenues, net 1,081 1,027 4,347
Expenses with respect to credit losses 6,13 82 49 192
Interest revenues, net after expenses with respect
to credit losses 999 978 4,155
Non-interest revenues Non-interest financing revenues (expenses) 3 90 (1) 136
Commissions 362 357 1,423
Other revenues 11 12 94
Total non-interest revenues 463 368 1,653
Operating and other expenses Payroll and associated expenses 569 (1)487 (1)2,271
Maintenance and depreciation of buildings and
equipment 189 186 742
Other expenses 154 (1)150 (1)598
Total operating and other expenses 912 823 3,611
Pre-tax profit 550 523 2,197
Provision for taxes on profit 192 192 806
After-tax profit 358 331 1,391
Share of loss of associated companies, after tax - (1) -
Net profit: Before attribution to non-controlling interests 358 330 1,391
Attributable to non-controlling interests (15) (9) (44)
Attributable to shareholders of the Bank 343 321 1,347
(1) Comparative figures for previous periods were reclassified. For more information about directives of the Supervisor of Banks with regard to improved presentation of expenses with respect to pension and other post-employment benefits, see Note 1.D.4.
The accompanying notes are an integral part of the financial statements.
Moshe Vidman
Chairman of the Board of Directors
Eldad Fresher
President & CEO
Menahem Aviv
Vice-president, Chief Accountant
Approval date: Ramat Gan, May 7, 2018

90
Condensed consolidated statement of profit and loss - Continued Reported amounts (NIS in millions)
For the three months ended
March 31, 2018 (unaudited)
For the three months ended
March 31, 2017 (unaudited)
For the year ended December
31,2017 (audited)
Diluted earnings per share(1) (in NIS) Basic earnings Net profit attributable to shareholders of the Bank 1.47 1.38 5.80
Weighted average number of ordinary shares used to calculate basic earnings 232,806,410 232,190,303 232,357,974
Diluted earnings Net profit attributable to shareholders of the Bank 1.46 1.37 5.76
Weighted average number of ordinary shares used to calculate diluted earnings 234,290,173 233,804,973 234,002,171
(1) Share of NIS 0.1 par value. See Note 1.D.1. for application of US GAAP with regard to earnings per share.
Condensed consolidated statement of comprehensive income Reported amounts (NIS in millions)
For the three months ended
March 31, 2018 (unaudited)
For the three months ended
March 31, 2017 (unaudited)
For the year ended
December 31,2017
(audited)
Net profit: Before attribution to non-controlling interests 358 330 1,391 Attributable to non-controlling interests (15) (9) (44) Net profit attributable to shareholders of the Bank 343 321 1,347
Other comprehensive income (loss) before taxes Adjustments for presentation of available-for-sale securities at fair value, net (64) 11 22 Adjustments from translation of financial statements of investments in associated companies(1) - (1) (4) Net loss from cash flow hedges (1) (1) (8) Adjustment of liabilities with respect to employees’ benefits(2) 23 21 (132)(3) Total other comprehensive income (loss), before tax (42) 30 (122)
Related tax effect 15 (11) 44 Other comprehensive income (loss) after taxes(4) Other comprehensive income (loss), before attribution to non-controlling interests (27) 19 (78) Less other comprehensive income (loss) attributed to non-controlling interests (1) - 12 Other comprehensive income (loss) attributed to shareholders of the Bank, after taxes (28) 19 (66)
Comprehensive income: Before attribution to non-controlling interests 331 349 1,313 Attributable to non-controlling interests (16) (9) (32) Comprehensive income attributable to shareholders of the Bank 315 340 1,281
(1) Adjustments from translation of financial statements of associated companies. (2) Includes adjustments with respect to actuarial estimates included in the reported period for defined-benefit pension plans and
current amortization of adjustments with respect to liabilities to profit and loss. (3) Includes: The effect of update to the assumption of salary cost and update to the remuneration increase rate on the actuarial
liability for employees’ rights at the Bank, amounting to NIS 69 million, net of taxes, as well as the effect of the streamlining plan at Bank Yahav on Bank shareholders' equity amounting to NIS 11 million. For more information see Note 22 to the 2017 financial statements.
(4) For more information see Note 4 to the financial statements - Cumulative Other Comprehensive Income (Loss).
The accompanying notes are an integral part of the financial statements.
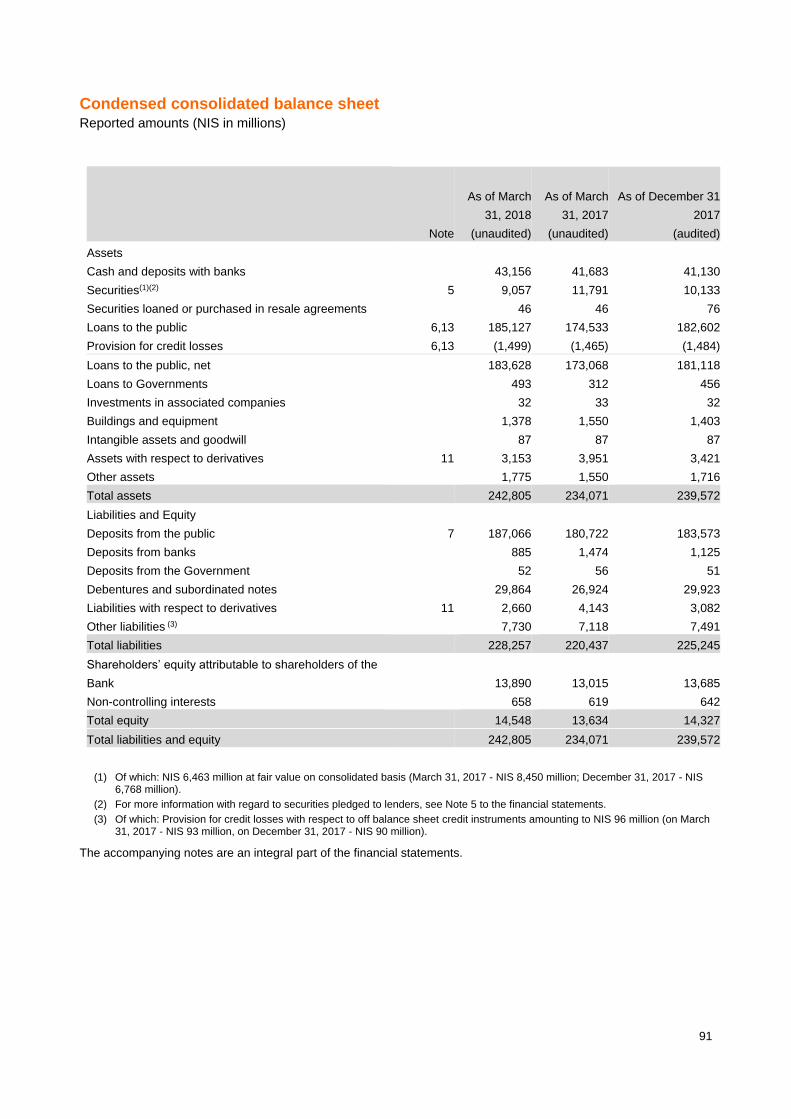
91
Condensed consolidated balance sheet Reported amounts (NIS in millions)
Note
As of March
31, 2018
(unaudited)
As of March
31, 2017
(unaudited)
As of December 31
2017
(audited)
Assets
Cash and deposits with banks 43,156 41,683 41,130
Securities(1)(2) 5 9,057 11,791 10,133
Securities loaned or purchased in resale agreements 46 46 76
Loans to the public 6,13 185,127 174,533 182,602
Provision for credit losses 6,13 (1,499) (1,465) (1,484)
Loans to the public, net 183,628 173,068 181,118
Loans to Governments 493 312 456
Investments in associated companies 32 33 32
Buildings and equipment 1,378 1,550 1,403
Intangible assets and goodwill 87 87 87
Assets with respect to derivatives 11 3,153 3,951 3,421
Other assets 1,775 1,550 1,716
Total assets 242,805 234,071 239,572
Liabilities and Equity
Deposits from the public 7 187,066 180,722 183,573
Deposits from banks 885 1,474 1,125
Deposits from the Government 52 56 51
Debentures and subordinated notes 29,864 26,924 29,923
Liabilities with respect to derivatives 11 2,660 4,143 3,082
Other liabilities (3) 7,730 7,118 7,491
Total liabilities 228,257 220,437 225,245
Shareholders’ equity attributable to shareholders of the
Bank 13,890 13,015 13,685
Non-controlling interests 658 619 642
Total equity 14,548 13,634 14,327
Total liabilities and equity 242,805 234,071 239,572
(1) Of which: NIS 6,463 million at fair value on consolidated basis (March 31, 2017 - NIS 8,450 million; December 31, 2017 - NIS 6,768 million).
(2) For more information with regard to securities pledged to lenders, see Note 5 to the financial statements. (3) Of which: Provision for credit losses with respect to off balance sheet credit instruments amounting to NIS 96 million (on March
31, 2017 - NIS 93 million, on December 31, 2017 - NIS 90 million).
The accompanying notes are an integral part of the financial statements.
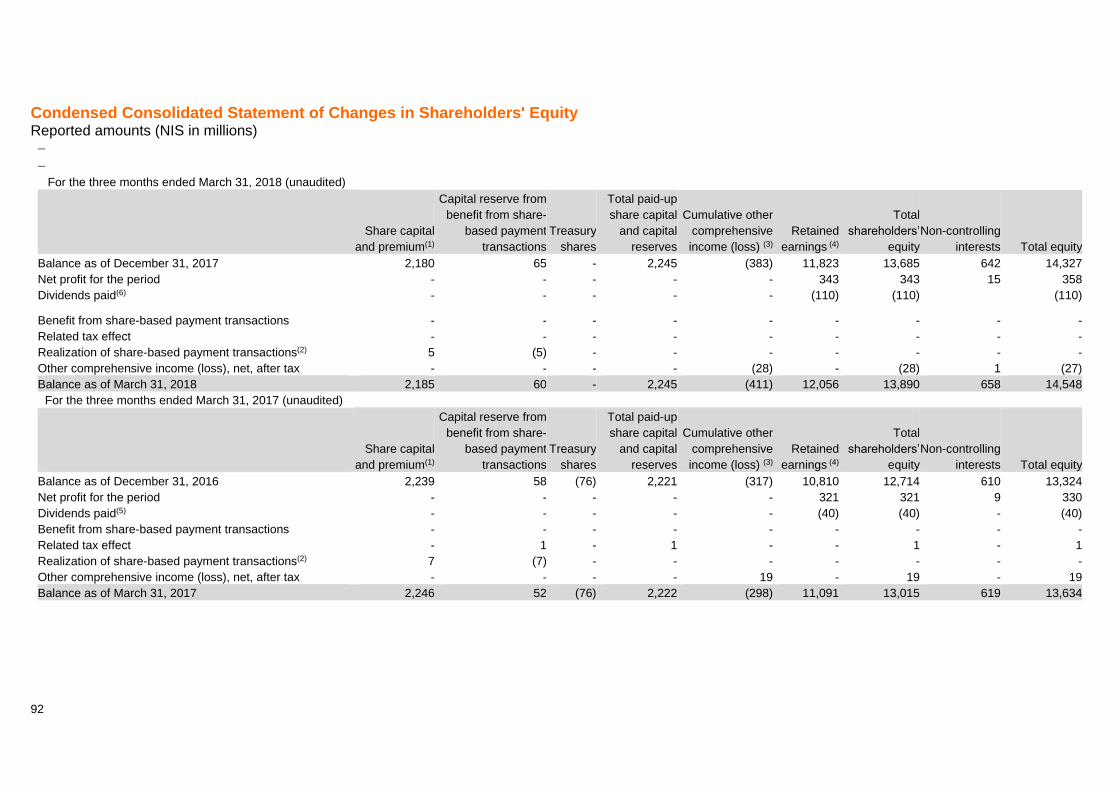
92
Condensed Consolidated Statement of Changes in Shareholders' Equity Reported amounts (NIS in millions)
−
− For the three months ended March 31, 2018 (unaudited)
Share capital
and premium(1)
Capital reserve from
benefit from share-
based payment
transactions
Treasury
shares
Total paid-up
share capital
and capital
reserves
Cumulative other
comprehensive
income (loss) (3)
Retained
earnings (4)
Total
shareholders’
equity
Non-controlling
interests Total equity
Balance as of December 31, 2017 2,180 65 - 2,245 (383) 11,823 13,685 642 14,327
Net profit for the period - - - - - 343 343 15 358
Dividends paid(6) - - - - - (110) (110) (110)
Benefit from share-based payment transactions - - - - - - - - -
Related tax effect - - - - - - - - -
Realization of share-based payment transactions(2) 5 (5) - - - - - - -
Other comprehensive income (loss), net, after tax - - - - (28) - (28) 1 (27)
Balance as of March 31, 2018 2,185 60 - 2,245 (411) 12,056 13,890 658 14,548
For the three months ended March 31, 2017 (unaudited)
Share capital
and premium(1)
Capital reserve from
benefit from share-
based payment
transactions
Treasury
shares
Total paid-up
share capital
and capital
reserves
Cumulative other
comprehensive
income (loss) (3)
Retained
earnings (4)
Total
shareholders’
equity
Non-controlling
interests Total equity
Balance as of December 31, 2016 2,239 58 (76) 2,221 (317) 10,810 12,714 610 13,324
Net profit for the period - - - - - 321 321 9 330
Dividends paid(5) - - - - - (40) (40) - (40)
Benefit from share-based payment transactions - - - - - - - - -
Related tax effect - 1 - 1 - - 1 - 1
Realization of share-based payment transactions(2) 7 (7) - - - - - - -
Other comprehensive income (loss), net, after tax - - - - 19 - 19 - 19
Balance as of March 31, 2017 2,246 52 (76) 2,222 (298) 11,091 13,015 619 13,634

93
For the year ended December 31, 2017 (audited)
Share capital
and premium(1)
Capital reserve from
benefit from share-
based payment
transactions
Treasury
shares
Total paid-up
share capital
and capital
reserves
Cumulative other
comprehensive
income (loss) (3)
Retained
earnings (4)
Total
shareholders’
equity
Non-controlling
interests Total equity
Balance as of December 31, 2016 2,239 58 (76) 2,221 (317) 10,810 12,714 610 13,324
Net profit for the period - - - - - 1,347 1,347 44 1,391
Dividends paid(5) - - - - - (334) (334) - (334)
Benefit from share-based payment transactions - 24 - 24 - - 24 - 24
Related tax effect - - - - - - - - -
Realization of share-based payment transactions(2) 17 (17) - - - - - - -
Cancellation of treasury shares(8) (76) - 76 - - - - - -
Other comprehensive income (loss), net, after tax - - - - (9)(66) - (66) (12) (78)
Balance as of December 31, 2017 2,180 65 - 2,245 (383) 11,823 13,685 642 14,327 −
(1) Share premium generated prior to March 31, 1986. (2) In the first quarter of 2018, 209,742 ordinary NIS 0.1 par value shares were issued (In the first quarter of 2017 and in all of 2017, 212,323 and 533,719 ordinary NIS 0.1 par value shares were issued, respectively) for
exercise of options pursuant to the Employee Stock Option Plan. In the first quarter of 2017 and in all of 2017, 9,137 ordinary NIS 0.1 par value shares were issued to the Bank President & CEO. (3) For details see Note 4 - Cumulative Other Comprehensive Income. (4) For more information about various limitations on dividend distributions, see Note 24 to the 2017 financial statements. (5) On April 26, 2017, June 20, 2017, September 26, 2017 and December 10, 2017, the Bank paid dividends amounting to NIS 39.8, 96.3, 120.0 and 78.3 million, respectively, in conformity with a decision by the Bank/s
Board of Directors. (6) On March 26, 2018, the Bank paid dividends amounting to NIS 109.5 million, in conformity with a decision by the Bank Board of Directors. (7) On May 7, 2018, after the balance sheet date, the Bank’s Board of Directors resolved to distribute dividends amounting to NIS 137.2 million, or 40% of earnings in the first quarter of 2018. According to accounting
rules, this amount will be deducted from retained earnings in the second quarter of 2018. (8) On September 18, 2017, the Board of Directors of the Bank decided to cancel 2.5 million shares of NIS 0.1 par value each of the Bank's issued share capital acquired by the Bank which constitute dormant shares
that do not confer any rights in the Bank. Accordingly, on September 25, 2017, the dormant shares were canceled in the Bank's records. (9) Includes: The effect of update to the assumption of salary cost and update to the remuneration increase rate on the actuarial liability for employees’ rights at the Bank, amounting to NIS 69 million, net of taxes, as well
as the effect of the streamlining plan at Bank Yahav on Bank shareholders' equity amounting to NIS 11 million. For more information see Note 22 to the 2017 financial statements.
The accompanying notes are an integral part of the financial statements.

94
Condensed consolidated statement of cash flows(1) Reported amounts (NIS in millions)
For the three months ended
March 31,
2018
(unaudited)
For the three months ended
March 31,
2017
(unaudited)
For the year ended
December 31,
2017
(audited)
Cash flows provided by current operations
Net profit 358 330 1,391
Adjustments
Share of the Bank in undistributed earnings of associated companies - 1 -
Depreciation of buildings and equipment 60 63 245
Expenses with respect to credit losses 82 49 192
Gain from sale of securities available for sale (5) (11) (52)
Realized and unrealized loss from adjustment to fair value of securities held for trading 3 3 1
Gain from sale of buildings and equipment - - (55)
Expenses arising from share-based payment transactions - - 24
Deferred taxes, net 14 (29) 9
Change in employee provisions and liabilities 7 (17) 98
Adjustments with respect to exchange rate differentials 8 64 82
Proceeds from sale of loan portfolios - (1) (4)
Accrual differences included with investment and financing operations (45) 23 32
Net change in current assets
Assets with respect to derivatives 267 (368) 155
Securities held for trade 12 143 138
Other assets, net (26) (22) (74)
Net change in current liabilities
Liabilities with respect to derivatives (422) 577 (484)
Other liabilities 245 387 388
Net cash provided by current operations 558 1,192 2,086
(1) Restated. Layout of the disclosures concerning the cash flows statement was adapted to US GAAP as specified in provisions of
Topic 230 of the Codification. For more information see Note 1.D.1.

95
Condensed consolidated statement of cash flows(1) - Continued Reported amounts (NIS in millions)
For the three months ended
March 31,
2018
(unaudited)
For the three months ended
March 31,
2017
(unaudited)
For the year ended December
31,
2017
(audited)
Cash flows provided by investment activities Net change in deposits with banks (396) 179 (403)
Net change in loans to the public (3,185) (2,431) (11,865)
Net change in loans to Governments (9) 18 (126)
Net change in securities loaned or acquired in resale agreements 30 (37) (67)
Acquisition of debentures held to maturity - (111) (111)
Proceeds from redemption of securities held to maturity 723 - -
Acquisition of securities available for sale (1,170) (2,355) (4,501)
Proceeds from sale of securities available for sale 646 516 4,671
Proceeds from redemption of securities available for sale 791 221 -
Proceeds from sale of loan portfolios 796 871 2,586
Purchase of loan portfolios (253) (218) (702)
Acquisition of buildings and equipment (35) (21) (247)
Proceeds from sale of buildings and equipment - - 328
Proceeds from realized investment in associates - - 1
Net cash provided by investment activities (2,062) (3,368) (10,436)
Cash flows provided by financing operations Net change in deposits from the public 3,493 2,470 5,321
Net change in deposits from banks (240) (63) (412)
Net change in deposits from Government 1 6 1
Issuance of debentures and subordinated notes - - 6,909
Redemption of debentures and subordinated notes (2) (57) (4,051)
Dividends paid to shareholders (110) - (334)
Net cash provided by financing operations 3,142 2,356 7,434
Increase (decrease) in cash 1,638 201 (916)
Cash balance at beginning of the period 40,497 41,495 41,495
Effect of changes in exchange rate on cash balances (8) (64) (82)
Cash balance at end of the period 42,127 41,632 40,497
Interest and taxes paid / received Interest received 1,637 1,834 6,521
Interest paid 279 269 1,717
Dividends received 6 4 4
Income taxes received - 60 64
Income taxes paid 278 151 780
Appendix A - Non-cash Transactions Acquisition of buildings and equipment - 7 25
(1) Restated. Layout of the disclosure concerning the cash flows statement was adapted to US GAAP as specified in provisions of Topic 230 of the Codification. For more information see Note 1.D.1.
96
Note 1 - Reporting Principles and Accounting Policies
A. Overview
On May 7, 2018, the Bank Board of Directors authorized publication of these condensed financial statements as of March 31, 2018. The condensed financial statements are prepared in accordance with Israeli GAAP for financial reporting of interim periods and in accordance with directives of the Supervisor of Banks, and do not include all information required in annual financial statements. These condensed financial statements should be read in conjunction with the audited financial statements as of December 31, 2017. As noted in the annual report, for most topics, the Supervisor of Banks' directives are based on generally acceptable accounting practices by US banks. For other, less material topics, these directives are based on International Financial Reporting Standards (IFRS) and on generally accepted accounting principles in Israel (Israeli GAAP). When International Financial Reporting Standards (IFRS) allow multiple alternatives, or do not specifically refer to a certain situation, these directives prescribe specific implementation guidelines, mostly based on generally acceptable accounting practices by US banks. In accordance with directives of the Supervisor of Banks, the condensed financial statements are only issued on a consolidated basis. The Group accounting policies in these condensed consolidated quarterly financial statements is consistent with the policies applied to the annual financial statements, except as noted below.
B. Reclassification on the financial statements
Data in these financial statements as of March 31, 2017 and as of December 31, 2017 includes reclassification of balances and notes in conformity with directives of the Supervisor of Banks with regard to codification update 2017-07 re improved presentation of expenses with respect to pension and other post-employment benefits. For more information see section D.4. below.
C. Use of estimates
As stated in Note 1.D.6)D, in the 2017 financial statements, the group-based provision for credit losses for 2017 was based, inter alia, on historical loss rates in various economic sectors, divided into problematic and non-problematic debt, for the 7 years ended on December 31, 2017, in conformity with Bank of Israel directives. In conformity with the revised directives, the range was increased to 8 years in 2018.
D. Initial application of accounting standards, accounting standard updates and directives of the Supervisor of Banks
As from reporting periods starting on January 1, 2018 (unless otherwise noted), the Bank applies the following new accounting standards and directives:
1. Reporting by banking corporations in Israel in conformity with US GAAP on these topics: Non-current assets held for sale and discontinued operations; fixed assets and impairment of fixed assets, investment property; earnings per share; statement of cash flows; interim reporting; and other topics.
2. Share-based payment 3. Limit on sector indebtedness 4. Improved presentation of expenses with respect to pension and other post-employment benefits 5. Recognition of revenues from contracts with clients
Below is a description of the substance of changes made to accounting policies and reporting
regulations in the condensed consolidated financial statements and description of the effect of their initial application, if any.

97
Note 1 - Reporting Principles and Accounting Policies - continued 1. Reporting by banking corporations in Israel in conformity with US GAAP on these topics:
Non-current assets held for sale and discontinued operations; fixed assets and impairment of fixed assets, investment property; earnings per share; statement of cash flows; interim reporting; and other topics.
On October 13, 2016, the Supervisor of Banks issued a circular concerning reporting by banking corporations and credit card issuers in Israel, in conformity with US GAAP. The circular revises the Public Reporting Directives and adopts generally accepted accounting standards in the US on these topics:
- US GAAP with regard to topic 205-20 of the codification "Discontinued operations". - US GAAP with regard to topic 360 of the codification "Fixed assets". - US GAAP with regard to topic 260 of the codification "Earnings per share". - US GAAP with regard to topic 230-10 of the codification "Statement of cash flows". - US GAAP with regard to topic 270 of the codification "Interim period reporting". - US GAAP with regard to topic 835-20 of the codification "Interest capitalization". - US GAAP with regard to topic 460 of the codification "Guarantees". The Bank applies the directives stipulated in the circular dated January 1, 2018. Application of the circular has no material impact on the Bank's financial statements, other than a change in presentation in the cash flow statement and of earnings per share in the profit and loss statement.
2. Share-based payment In May 2017, the US Financial Accounting Standards Board ("FASB") issued Revision 2017-09,
amending topic 718 of the codification with regard to the scope of changes to terms (hereinafter: “the Amendment”).
The revision is designed to clarify when it is required to treat changes to terms of share-based payment award as a modification.
According to the revision, modification accounting should be applied with respect to changes to the plan, unless the fair value, vesting conditions or classification of the award (as capital or liability award) are the same before and after the modification.
However, companies should continue to apply modification accounting for changes made due to:
- Laws or regulations; or - New standards with regard to: Revenue recognition, leases or credit losses.
Furthermore, disclosures are still required for significant changes to terms of a share-based payment award as well as assessment of tax implications, even if such change does not result in modification accounting being applied.
The Bank applies these changes as from January 1, 2018. Application of this update has no material impact on the Bank's financial statements.
3. Limit on sector indebtedness On July 10, 2017, the Supervisor of Banks published a memo regarding sector indebtedness limit,
including changes to Proper Banking Conduct Directives 314 and 315. The major changes to Proper Banking Conduct Directives according to this memo are as follows:
- Setting a category of sector indebtedness limit, whereby indebtedness for a specific sector may not exceed 20% of total indebtedness to the public and, in some cases, not to exceed 22%.
- The additional provision and general provision mechanism has been rescinded. - When setting the provision for credit losses, the risk with respect to credit for which no current
financial statements are available should be weighted. The Bank applies these changes as from January 1, 2018. Application of this amendment has no material impact on the Bank's financial statements.
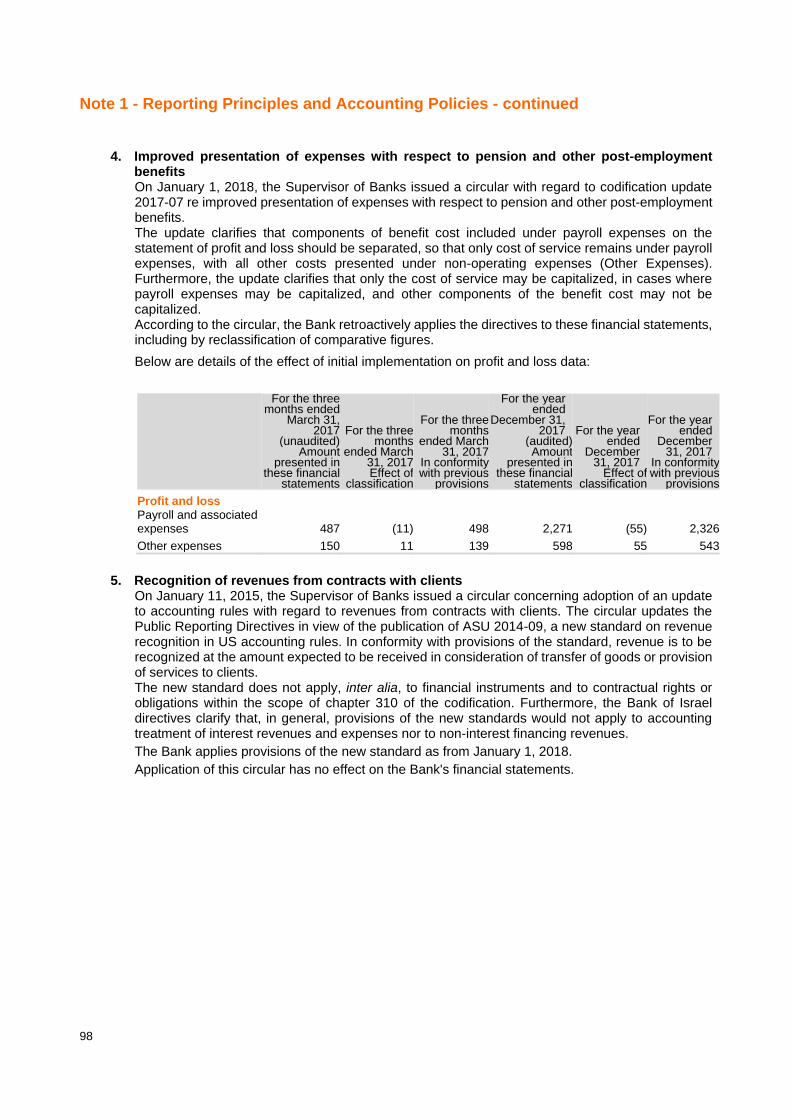
98
Note 1 - Reporting Principles and Accounting Policies - continued
4. Improved presentation of expenses with respect to pension and other post-employment
benefits On January 1, 2018, the Supervisor of Banks issued a circular with regard to codification update
2017-07 re improved presentation of expenses with respect to pension and other post-employment benefits.
The update clarifies that components of benefit cost included under payroll expenses on the statement of profit and loss should be separated, so that only cost of service remains under payroll expenses, with all other costs presented under non-operating expenses (Other Expenses). Furthermore, the update clarifies that only the cost of service may be capitalized, in cases where payroll expenses may be capitalized, and other components of the benefit cost may not be capitalized.
According to the circular, the Bank retroactively applies the directives to these financial statements, including by reclassification of comparative figures.
Below are details of the effect of initial implementation on profit and loss data:
For the three months ended
March 31, 2017
(unaudited) Amount
presented in these financial
statements
For the three months
ended March 31, 2017 Effect of
classification
For the three months
ended March 31, 2017
In conformity with previous
provisions
For the year ended
December 31, 2017
(audited) Amount
presented in these financial
statements
For the year ended
December 31, 2017
Effect of classification
For the year ended
December 31, 2017
In conformity with previous
provisions
Profit and loss Payroll and associated expenses 487 (11) 498 2,271 (55) 2,326
Other expenses 150 11 139 598 55 543
5. Recognition of revenues from contracts with clients On January 11, 2015, the Supervisor of Banks issued a circular concerning adoption of an update
to accounting rules with regard to revenues from contracts with clients. The circular updates the Public Reporting Directives in view of the publication of ASU 2014-09, a new standard on revenue recognition in US accounting rules. In conformity with provisions of the standard, revenue is to be recognized at the amount expected to be received in consideration of transfer of goods or provision of services to clients.
The new standard does not apply, inter alia, to financial instruments and to contractual rights or obligations within the scope of chapter 310 of the codification. Furthermore, the Bank of Israel directives clarify that, in general, provisions of the new standards would not apply to accounting treatment of interest revenues and expenses nor to non-interest financing revenues.
The Bank applies provisions of the new standard as from January 1, 2018.
Application of this circular has no effect on the Bank's financial statements.

99
Note 1 - Reporting Principles and Accounting Policies - continued
E. New accounting standards and new directives by the Supervisor of Banks prior to their
implementation
Standard / update topic
Issue date
Start date Issued by Standard summary
Effect on the Bank's financial statements
ASU 2017-04 Impairment of goodwill
January 2017
January 1, 2020
US Financial Accounting Standards Board ("FASB")
A two-stage test should be applied for each reporting unit, whereby impairment of goodwill is to be recognized in the amount of the difference between the fair value of the reported unit and its carrying amount, taking into account the effect of taxes on income. However, the impairment loss may not exceed the goodwill allocated to the reporting unit.
No material effect is expected
Receivables ASU 2017-08
March 2017
January 1, 2019
US Financial Accounting Standards Board ("FASB")
The amortization period of premium on debentures with optional early redemption by the issuer is to be calculated based on the earliest redemption date.
No material effect is expected
Adoption of updates to US GAAP with regard to provision for credit losses ASU 2016-13
March 2018
January 1, 2021
Supervisor of Banks
Provision for credit losses is to be calculated in conformity with expected loss over the credit term. This is in lieu of estimation of the loss incurred and yet to be identified; estimation of the provision for credit losses shall include significant use of forward-looking information, reflecting reasonable forecasts with regard to future economic events; the new rules for calculating the provision for credit losses shall apply to loans (including housing loans), debentures held to maturity and certain off-balance sheet credit exposures.
The Bank is studying the impact of adopting the standards.
Adoption of updates to US GAAP with regard to recognition and measurement of financial Instruments ASU 2016-01
March 2018
January 1, 2019
Supervisor of Banks
Negotiable shares in the available-for-sale portfolio shall be measured at fair value through profit and loss; changes to fair value of financial liabilities measured at fair value, due to instrument-specific credit risk, shall be recognized on Other Comprehensive Income rather than on the statement of profit and loss; presentation of financial instruments on the balance sheet shall be revised.
The Bank is studying the impact of adopting the standards.
Adoption of updates to US GAAP with regard to derivatives and hedging activities ASU 2017-12
March 2018
January 1, 2019
Supervisor of Banks
The rules expand the capacity of banking corporations to hedge certain risk components, thereby aligning the presentation of hedging instruments and hedged items on the financial statements; the rules simplify the application of accounting directives with regard to hedging, primarily through relief in requirements for review of the hedge effectiveness and hedge documentation; the rules update the disclosure re derivatives activities of banking corporations.
The Bank is studying the impact of adopting the standards.
Adoption of updates to US GAAP with regard to leases ASU 2016-02
March 2018
January 1, 2020
Supervisor of Banks
Banking corporations that lease assets for a term longer than 12 months shall recognize these on the balance sheet, even in case of an operating lease; for operational lease transactions, an asset shall be recorded on the balance sheet reflecting the corporation's right to use the leased asset, against a liability to make lease payments; as for capital adequacy, assets recorded under operating lease transactions shall be weighted at the same risk weighting assigned to other assets.
The Bank is studying the impact of adopting the standards.

100
Note 2 - Interest revenues and expenses Reported amounts (NIS in millions)
For the three
months ended
March 31,
2018
(unaudited)
For the three
months ended
March 31,
2017
(unaudited)
For the year
ended December
31,
2017
(audited)
A. Interest revenues(1)
From loans to the public 1,375 1,301 5,989
From loans to Governments 4 3 11
From deposits with the Bank of Israel and from cash 18 17 74
From deposits with banks 1 3 8
From debentures 51 32 140
Total interest revenues 1,449 1,356 6,222
B. Interest expenses
On deposits from the public 288 227 1,261
On deposits from governments - - 2
On deposits from banks 2 3 11
On debentures and subordinated notes 78 98 599
On other liabilities - 1 2
Total interest expenses 368 329 1,875
Total interest revenues, net 1,081 1,027 4,347
C. Details of net effect of hedging derivatives on interest
revenues 4 (4) (6)
D. Details of interest revenues on accrual basis from
debentures
Held to maturity 10 10 43
Available for sale 41 21 94
Held for trading - 1 3
Total included under interest revenues 51 32 140
(1) Includes the effective element in the hedging ratios.

101
Note 3 - Non-interest financing revenues Reported amounts (NIS in millions)
For the three
months ended
March 31,
2018
(unaudited)
For the three
months ended
March 31,
2017
(unaudited)
For the year
ended
December 31,
2017
(audited)
A. Non-interest financing revenues (expenses) with respect to
non-trading operations
1. From activity in derivatives
Non-effective element of hedging ratios(1) (2) (3) -
Net revenues (expenses) with respect to ALM derivatives(2) 294 (785) (1,089)
Total from activity in derivatives 292 (788) (1,089)
2. From investment in debentures
Gains on sale of debentures available for sale 5 10 44
Total from investment in debentures 5 10 44
3. Exchange rate differences, net (248) 799 1,196
4. Gains from investment in shares
Gains on sale of available-for-sale shares 1 1 8
Provision for impairment of available-for-sale shares (1) - -
Dividends from available-for-sale shares 6 3 4
Total from investment in shares 6 4 12
5. Net gain with respect to loans sold - 1 4
Total non-interest financing revenues with respect to non-trade
operations 55 26 167
B. Non-interest financing revenues (expenses)with respect to
trading operations(3)
Net revenues (expenses) with respect to other derivatives 38 (24) (30)
Realized losses from adjustment to fair value of debentures held for
trade, net - (2) -
Unrealized losses from adjustment to fair value of debentures held
for trade, net (3) (1) (1)
Total from trading operations(4) 35 (27) (31)
Details of non-interest financing revenues (expenses) with
respect to trading operations, by risk exposure
Interest exposure - 2 2
Foreign currency exposure 33 (28) (37)
Exposure to shares 2 1 4
Exposure to commodities and others - (2) -
Total 35 (27) (31)
(1) Excludes the effective element in the hedging ratios. (2) derivatives which constitute part of the Bank’s asset and liability management system, which were not intended as hedges. (3) Includes exchange rate differentials resulting from trading operations. (4) For interest revenues from investments in debentures held for trading, see Note 2.D.

102
Note 4 - Cumulative other comprehensive income (loss) Reported amounts (NIS in millions)
A. Changes to cumulative other comprehensive income (loss), after tax effect
Other comprehensive income (loss), before attribution to non-controlling interests
for the three months ended March 31, 2018 (unaudited)
Adjustments for
presentation of securities available for
sale at fair value
Translation adjustments(1)
Net gains from cash
flow hedges
Adjustments with respect to employee
benefits Total
Other comprehensive
income attributed to
non-controlling interests
Other comprehensive
income attributable to
shareholders of the Bank
Balance as of
December 31, 2017 (15) (2) 4 (387) (400) (17) (383)
Net change in the
period (41) - (1) 15 (27) 1 (28)
Balance as of
March 31, 2018 (56) (2) 3 (372) (427) (16) (411)
For the three months ended March 31, 2017(unaudited)
Adjustments for
presentation of securities available for
sale at fair value
Translation adjustments(1)
Net gains from cash
flow hedges
Adjustments with respect to employee
benefits Total
Other comprehensive
income attributed to
non-controlling interests
Other comprehensive
income attributable to
shareholders of the Bank
Balance as of
December 31, 2016 (29) 1 9 (303) (322) (5) (317)
Net change in the
period 7 (1) (1) 14 19 - 19
Balance as of
March 31, 2017 (22) - 8 (289) (303) (5) (298)
For the year ended December 31, 2017 (audited)
Adjustments for
presentation of securities available for
sale at fair value
Translation adjustments(1)
Net gains from cash
flow hedges
Adjustments with respect to employee
benefits Total
Other comprehensive
income attributed to
non-controlling interests
Other comprehensive
income attributable to
shareholders of the Bank
Balance as of
December 31, 2016 (29) 1 9 (303) (322) (5) (317)
Net change in the
period 14 (3) (5) (84)(2) (78) (12) (66)
Balance as of
December 31, 2017 (15) (2) 4 (387) (400) (17) (383)
(1) Foreign currency translation adjustments of associated companies whose functional currency differs from that of the Bank. (2) Includes: The effect of update to the assumption of salary cost and update to the remuneration increase rate on the actuarial
liability for employees’ rights at the Bank, amounting to NIS 69 million, net of taxes, as well as the effect of the streamlining plan at Bank Yahav on Bank shareholders' equity amounting to NIS 11 million. For more information see Note 22 to the 2017 financial statements.

103
Note 4 - Cumulative other comprehensive income (loss) - continued Reported amounts (NIS in millions)
B. Changes in items of cumulative other comprehensive income (loss) before and after tax effect
For the three
months ended
March 31,
2018
Before tax
(unaudited)
For the three
months ended
March 31,
2018
Tax effect
(unaudited)
For the three
months ended
March 31,
2018
After tax
(unaudited)
For the three
months ended
March 31,
2017
Before tax
(unaudited)
For the three
months ended
March 31,
2017
Tax effect
(unaudited)
For the three
months ended
March 31,
2017
After tax
(unaudited)
For the year ended December
31,
2017
Before tax
(audited)
For the year ended December
31,
2017
Tax effect
(audited)
For the year ended December
31,
2017
After tax
(audited)
Change in items of other
comprehensive income (loss), before
attribution to non-controlling
interests:
Adjustments for presentation of
securities available for sale at fair
value
Net unrealized gains (losses) from
adjustments to fair value (69) 25 (44) 21 (8) 13 66 (23) 43
Losses (gains) with respect to available-
for-sale securities reclassified to the
statement of profit and loss(1) 5 (2) 3 (10) 4 (6) (44) 15 (29)
Net change in the period (64) 23 (41) 11 (4) 7 22 (8) 14
Translation adjustments
Adjustments from translation of financial
statements(2) - - - (1) - (1) (4) 1 (3)
Net change in the period - - - (1) - (1) (4) 1 (3)
Cash flows hedges
Net gains (losses) with respect to cash
flows hedging - - - (1) - (1) (8) 3 (5)
Net (gains) losses with respect to cash
flow hedges reclassified to the statement
of profit and loss(3) (1) - (1) - - - - - -
Net change in the period (1) - (1) (1) - (1) (8) 3 (5)
Employee benefits
Net actuarial gain (loss) for the period 16 (6) 10 18 (6) 12 (150) 54 (4)(96)
Net losses reclassified to the statement
of profit and loss 7 (2) 5 3 (1) 2 18 (6) 12
Net change in the period 23 (8) 15 21 (7) 14 (132) 48 (84)
Total net change in the period (42) 15 (27) 30 (11) 19 (122) 44 (78)
Total net change in the period
attributable to non-controlling interests (1) - (1) - - - 18 (6) 12
Total net change in the period
attributable to shareholders of the Bank (43) 15 (28) 30 (11) 19 (104) 38 (66)
(1) Pre-tax amount included in the statement of profit and loss under "Non-interest financing revenues". For details, see Note 3.A.2. to the financial statements.
(2) Foreign currency translation adjustments of associated companies whose functional currency differs from that of the Bank. (3) Pre-tax amount included in the statement of profit and loss under "Interest revenues". For more information see Note 2.C. to
the financial statements. (4) Includes: The effect of update to the assumption of salary cost and update to the remuneration increase rate on the actuarial
liability for employees’ rights at the Bank, amounting to NIS 69 million, net of taxes, as well as the effect of the streamlining plan at Bank Yahav on Bank shareholders' equity amounting to NIS 11 million. For more information see Note 22 to the 2017 financial statements.

104
Note 5 - Securities
As of March 31, 2018 (unaudited)
Reported amounts (NIS in millions)
Carrying amount
Amortized cost (for shares -
cost)
Unrecognized gains from
adjustments to fair value
Unrecognized losses from
adjustments to fair value Fair value(1)
(1) Debentures held to maturity
of Government of Israel 2,507 2,507 64 - 2,571
Total debentures held to maturity 2,507 2,507 64 - 2,571
Carrying amount
Amortized cost (for shares -
cost)
Unrecognized gains from
adjustments to fair value
Unrecognized losses from
adjustments to fair value Fair value(1)
(2) Securities available for sale
Debentures and bonds -
Of the Government of Israel(2) 4,451 4,480 9 (38) 4,451
Of foreign governments(2)(5) 1,350 1,399 - (49) 1,350
Of foreign financial institutions 449 453 - (4) 449
Of others overseas 17 18 - (1) 17
Total debentures available for sale 6,267 6,350 9 (92) 6,267
Shares(3) 89 89 - - 89
Total securities available for sale 6,356 6,439 (4)9 (4)(92) 6,356
Carrying amount
Amortized cost (for shares -
cost)
Unrecognized gains from
adjustments to fair value
Unrecognized losses from
adjustments to fair value Fair value(1)
(3) Securities held for trade
Debentures -
of Government of Israel 194 197 - (3) 194
Total securities held for trade 194 197 - (6)(3) 194
Total securities 9,057 9,143 73 (95) 9,121
(1) Fair value data are generally based on stock exchange prices, which do not necessarily reflect the price to be obtained on the sale of a large volume of securities.
(2) Of which: Securities pledged to lenders, amounting to NIS 425 million. (3) Includes shares for which a fair value is not available, that are stated at cost, net of a provision for decline in value that is not
temporary, amounting to NIS 87 million. (4) Included in shareholders' equity in "adjustments on presentation of securities available for sale at fair value". (5) Primarily US government debentures. (6) Charged to statement of profit and loss but not yet realized.
Remarks: - For more information about operations involving investments in debentures - see Notes 2.D, 3.A.2 and 3.B to the financial
statements. For more information about investment in shares - see Note 3.A.4 to the financial statements. - The distinction between Israeli and foreign debentures was made in conformity with the country of residence of the
authority which issued the securities.
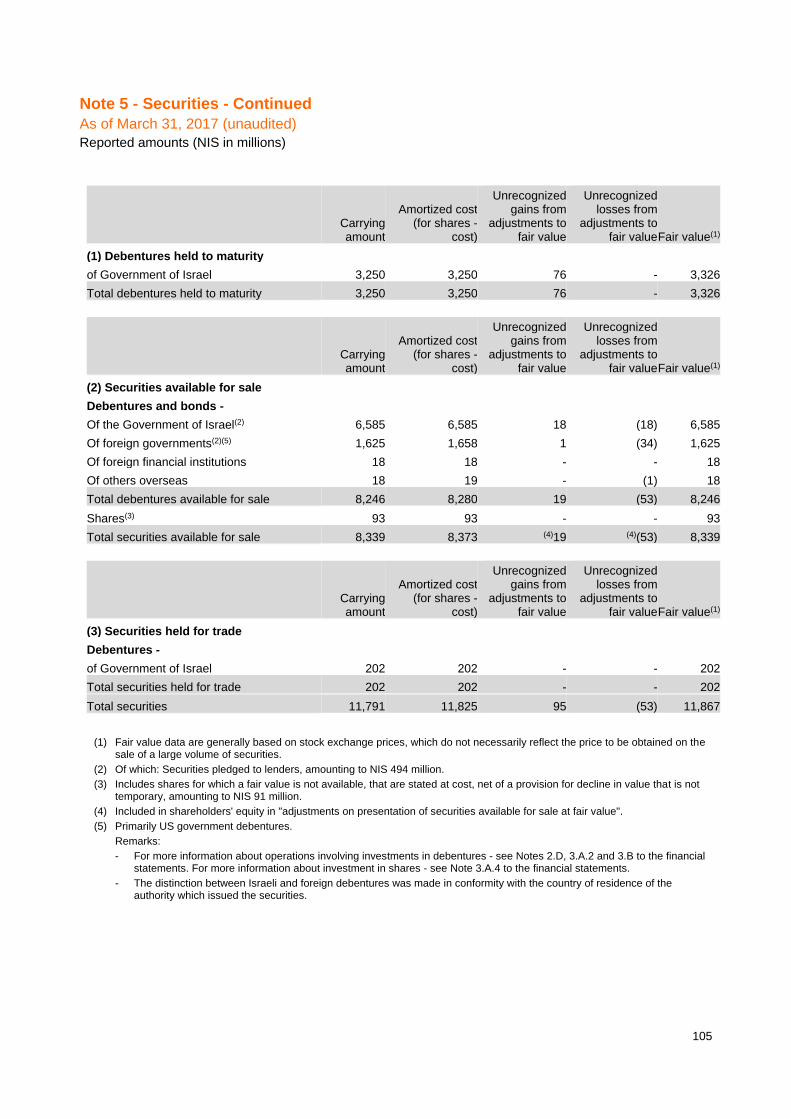
105
Note 5 - Securities - Continued
As of March 31, 2017 (unaudited)
Reported amounts (NIS in millions)
Carrying amount
Amortized cost (for shares -
cost)
Unrecognized gains from
adjustments to fair value
Unrecognized losses from
adjustments to fair value Fair value(1)
(1) Debentures held to maturity
of Government of Israel 3,250 3,250 76 - 3,326
Total debentures held to maturity 3,250 3,250 76 - 3,326
Carrying amount
Amortized cost (for shares -
cost)
Unrecognized gains from
adjustments to fair value
Unrecognized losses from
adjustments to fair value Fair value(1)
(2) Securities available for sale
Debentures and bonds -
Of the Government of Israel(2) 6,585 6,585 18 (18) 6,585
Of foreign governments(2)(5) 1,625 1,658 1 (34) 1,625
Of foreign financial institutions 18 18 - - 18
Of others overseas 18 19 - (1) 18
Total debentures available for sale 8,246 8,280 19 (53) 8,246
Shares(3) 93 93 - - 93
Total securities available for sale 8,339 8,373 (4)19 (4)(53) 8,339
Carrying amount
Amortized cost (for shares -
cost)
Unrecognized gains from
adjustments to fair value
Unrecognized losses from
adjustments to fair value Fair value(1)
(3) Securities held for trade
Debentures -
of Government of Israel 202 202 - - 202
Total securities held for trade 202 202 - - 202
Total securities 11,791 11,825 95 (53) 11,867
(1) Fair value data are generally based on stock exchange prices, which do not necessarily reflect the price to be obtained on the
sale of a large volume of securities. (2) Of which: Securities pledged to lenders, amounting to NIS 494 million. (3) Includes shares for which a fair value is not available, that are stated at cost, net of a provision for decline in value that is not
temporary, amounting to NIS 91 million. (4) Included in shareholders' equity in "adjustments on presentation of securities available for sale at fair value". (5) Primarily US government debentures.
Remarks: - For more information about operations involving investments in debentures - see Notes 2.D, 3.A.2 and 3.B to the financial
statements. For more information about investment in shares - see Note 3.A.4 to the financial statements. - The distinction between Israeli and foreign debentures was made in conformity with the country of residence of the
authority which issued the securities.

106
Note 5 - Securities - Continued
As of December 31, 2017 (audited)
Reported amounts (NIS in millions)
Carrying amount
Amortized cost (for shares -
cost)
Unrecognized gains from
adjustments to fair value
Unrecognized losses from
adjustments to fair value Fair value(1)
(1) Debentures held to maturity
of Government of Israel 3,267 3,267 75 - 3,342
Total debentures held to maturity 3,267 3,267 75 - 3,342
Carrying amount
Amortized cost (for shares -
cost)
Unrecognized gains from
adjustments to fair value
Unrecognized losses from
adjustments to fair value Fair value(1)
(2) Securities available for sale
Debentures and bonds -
Of the Government of Israel(2) 4,136 4,117 24 (5) 4,136
Of foreign governments (2)(5) 2,233 2,271 - (38) 2,233
Of foreign financial institutions 173 174 - (1) 173
Of others overseas 16 17 - (1) 16
Total debentures available for sale 6,558 6,579 24 (45) 6,558
Shares(3) 99 99 - - 99
Total securities available for sale 6,657 6,678 (4)24 (4)(45) 6,657
Carrying amount
Amortized cost (for shares -
cost)
Unrecognized gains from
adjustments to fair value
Unrecognized losses from
adjustments to fair value Fair value(1)
(3) Securities held for trade
Debentures -
of Government of Israel 209 209 - - 209
Total securities held for trade 209 209 - - 209
Total securities 10,133 10,154 99 (45) 10,208
(1) Fair value data are generally based on stock exchange prices, which do not necessarily reflect the price to be obtained on the
sale of a large volume of securities. (2) Of which: Securities pledged to lenders, amounting to NIS 424 million. (3) Includes shares for which a fair value is not available, that are stated at cost, net of a provision for decline in value that is not
temporary, amounting to NIS 98 million. (4) Included in shareholders' equity in "adjustments on presentation of securities available for sale at fair value". (5) Primarily US government debentures.
Remarks: - For more information about operations involving investments in debentures - see Notes 2.D, 3.A.2 and 3.B to the financial
statements. For more information about investment in shares - see Note 3.A.4 to the financial statements. - The distinction between Israeli and foreign debentures was made in conformity with the country of residence of the
authority which issued the securities.

107
Note 5 - Securities - Continued Reported amounts (NIS in millions)
(4) Fair value and unrealized losses, by time period and impairment rate, of securities available for sale, which include unrealized loss:
As of March 31, 2018
Less than 12 months
Fair value(1)
Less than 12 months
Unrealized losses
0%-20%
Less than 12 months
Unrealized losses
20%-40%
Less than 12 months
Total
12 months or more
Fair value(1)
12 months or more
Unrealized losses
0%-20%
12 months or more
Unrealized losses
20%-40%
12 months or more
Total
Debentures -
of Government of Israel 1,254 28 - 28 637 10 - 10
Of foreign governments 343 5 - 5 914 44 - 44
Of foreign financial institutions 172 4 - 4 - - - -
Of others overseas - - - - 10 1 - 1
Total securities available for sale 1,769 37 - 37 1,561 55 - 55
As of March 31, 2017
Less than 12 months
Fair value(1)
Less than 12 months
Unrealized losses
0%-20%
Less than 12 months
Unrealized losses
20%-40%
Less than 12 months
Total
12 months or more
Fair value(1)
12 months or more
Unrealized losses
0%-20%
12 months or more
Unrealized losses
20%-40%
12 months or more
Total
Debentures -
of Government of Israel 3,272 18 - 18 184 1 - 1
Of foreign governments 1,289 34 - 34 - - - -
Total securities available for sale 4,561 52 - 52 184 1 - 1
As of December 31, 2017
Less than 12 months
Fair value(1)
Less than 12 months
Unrealized losses
0%-20%
Less than 12 months
Unrealized losses
20%-40%
Less than 12 months
Total
12 months or more
Fair value(1)
12 months or more
Unrealized losses
0%-20%
12 months or more
Unrealized losses
20%-40%
12 months or more
Total
Debentures -
of Government of Israel 674 1 - 1 611 4 - 4
Of foreign governments 339 4 - 4 1,110 34 - 34
Of foreign financial institutions 173 1 - 1 - - - -
Of others overseas - - - - 10 1 - 1
Total securities available for sale 1,186 6 - 6 1,731 39 - 39
(1) Fair value data are generally based on stock exchange prices, which do not necessarily reflect the price to be obtained on the
sale of a large volume of securities. (2) The Bank has no securities in a position of unrecognized loss.
(5) Asset-backed and mortgage-backed securities As of March 31, 2018, March 31, 2017 and December 31, 2017, there was no balance of asset-backed or mortgage-backed securities.

108
Note 6 - Credit risk, loans to the public and provision for credit losses Reported amounts (NIS in millions)
A. Debts(1), loans to the public and balance of provision for credit losses −
As of March 31, 2018 (unaudited)
Loans to the public
Commercial
Loans to the public
Housing
Loans to the public
Individual - other
Loans to the public Total
Banks and governments Total
Recorded debt balance of debts (1) reviewed on individual basis 34,116 38 718 34,872 3,249 38,121 reviewed on group basis 10,015 121,685 18,555 150,255 - 150,255 Of which: By extent of arrears 1,386 121,685 - 123,071 - 123,071 Total debts 44,131 (2)121,723 19,273 185,127 3,249 188,376 Of which: Impaired debts under restructuring 138 - 58 196 - 196 Other impaired debts 623 38 13 674 - 674 Total impaired debts 761 38 71 870 - 870 Debts in arrears 90 days or longer 35 1,087 23 1,145 - 1,145 Other problematic debts 543 - 121 664 - 664 Total problematic debts 1,339 1,125 215 2,679 - 2,679 Provision for credit losses with respect to debts (1) reviewed on individual basis 499 4 28 531 2 533 reviewed on group basis 125 631 212 968 - 968 Of which: Provision by extent of arrears(3) 5 631 - 636 - 636 Total provision for credit losses 624 635 240 1,499 2 1,501 Of which: With respect to impaired debts 122 4 16 142 - 142
As of March 31, 2017 (unaudited)
Loans to the public
Commercial
Loans to the public
Housing
Loans to the public
Individual - other
Loans to the public Total
Banks and governments Total
Recorded debt balance of debts(1) reviewed on individual basis 29,964 36 (4)623 30,623 3,087 33,710
reviewed on group basis (4)10,245 116,304 (4)17,361 143,910 - 143,910
Of which: By extent of arrears 1,053 115,650 - 116,703 - 116,703
Total debts 40,209 (2)116,340 17,984 174,533 3,087 177,620
Of which: Impaired debts under restructuring 102 - 47 149 - 149
Other impaired debts 464 36 19 519 - 519
Total impaired debts 566 36 66 668 - 668
Debts in arrears 90 days or longer 61 900 24 985 - 985
Other problematic debts 810 - 89 899 - 899
Total problematic debts 1,437 936 179 2,552 - 2,552
Provision for credit losses with respect to debts (1) reviewed on individual basis 537 2 20 559 1 560
reviewed on group basis 108 610 188 906 - 906
Of which: Provision by extent of arrears(3) 5 610 - 615 - 615
Total provision for credit losses 645 612 208 1,465 1 1,466
Of which: With respect to impaired debts 135 2 13 150 - 150 −
(1) Loans to the public, loans to governments, deposits with banks and other debts, except for debentures and securities borrowed or acquired in conjunction with resale agreements, except for deposits with Bank of Israel.
(2) Includes general-purpose loans secured by a lien on a residential apartment, amounting to NIS 6,484 million (as of March 31, 2017 - NIS 5,844 million).
(3) Includes balance of provision in excess of that required by extent of arrears, assessed on individual basis, amounting to NIS 17 million (as of March 31, 2017 - NIS 16 million), and assessed on group basis, amounting to NIS 425 million (as of March 31, 2017 - NIS 406 million).
(4) Reclassified.
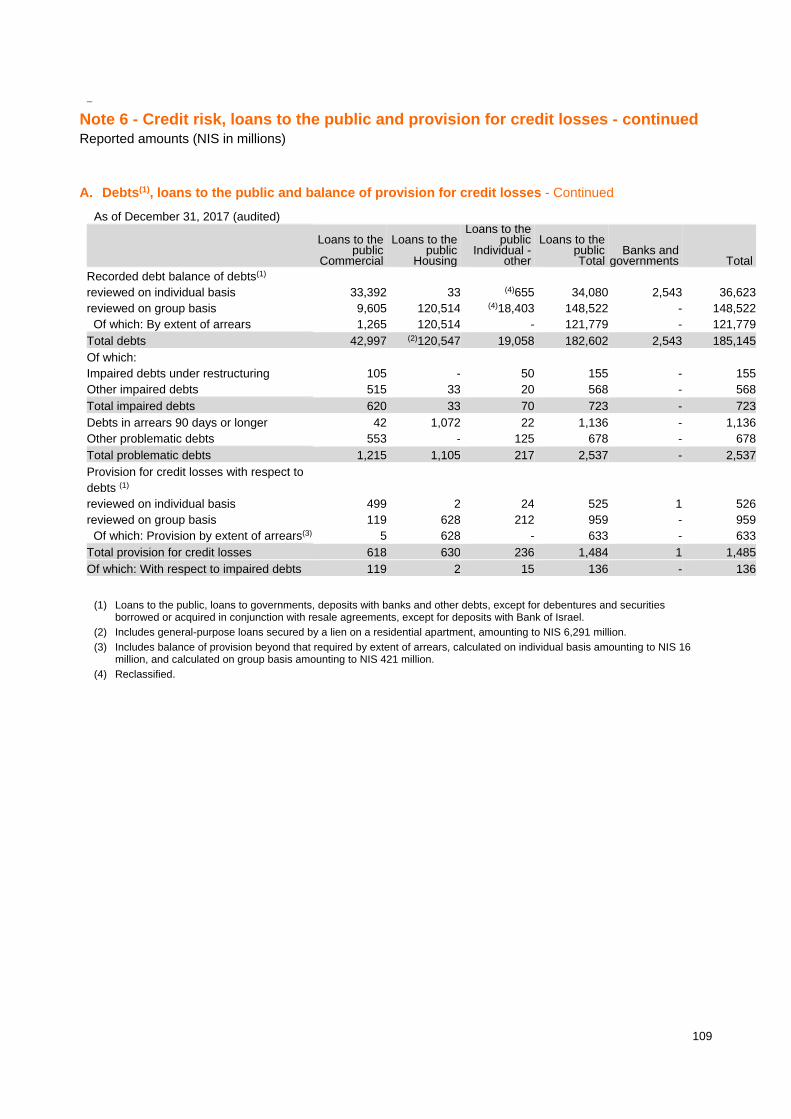
109
−
Note 6 - Credit risk, loans to the public and provision for credit losses - continued Reported amounts (NIS in millions)
A. Debts(1), loans to the public and balance of provision for credit losses - Continued
As of December 31, 2017 (audited)
Loans to the public
Commercial
Loans to the public
Housing
Loans to the public
Individual - other
Loans to the public Total
Banks and governments Total
Recorded debt balance of debts(1) reviewed on individual basis 33,392 33 (4)655 34,080 2,543 36,623
reviewed on group basis 9,605 120,514 (4)18,403 148,522 - 148,522
Of which: By extent of arrears 1,265 120,514 - 121,779 - 121,779
Total debts 42,997 (2)120,547 19,058 182,602 2,543 185,145
Of which: Impaired debts under restructuring 105 - 50 155 - 155
Other impaired debts 515 33 20 568 - 568
Total impaired debts 620 33 70 723 - 723
Debts in arrears 90 days or longer 42 1,072 22 1,136 - 1,136
Other problematic debts 553 - 125 678 - 678
Total problematic debts 1,215 1,105 217 2,537 - 2,537
Provision for credit losses with respect to
debts (1) reviewed on individual basis 499 2 24 525 1 526
reviewed on group basis 119 628 212 959 - 959
Of which: Provision by extent of arrears(3) 5 628 - 633 - 633
Total provision for credit losses 618 630 236 1,484 1 1,485
Of which: With respect to impaired debts 119 2 15 136 - 136
(1) Loans to the public, loans to governments, deposits with banks and other debts, except for debentures and securities borrowed or acquired in conjunction with resale agreements, except for deposits with Bank of Israel.
(2) Includes general-purpose loans secured by a lien on a residential apartment, amounting to NIS 6,291 million. (3) Includes balance of provision beyond that required by extent of arrears, calculated on individual basis amounting to NIS 16
million, and calculated on group basis amounting to NIS 421 million. (4) Reclassified.

110
Note 6 - Credit risk, loans to the public and provision for credit losses - continued Reported amounts (NIS in millions)
B. Change in balance of provision for credit losses
For the three months ended March 31, 2018 (unaudited) - Provision for credit losses
Loans to the public
Commercial
Loans to the public
Housing
Loans to the public
Individual - other
Loans to the public Total
Banks and governments Total
Balance of provision for credit losses at start of period 699 630 245 1,574 1 1,575
Expenses with respect to credit losses 53 6 22 81 1 82
Net accounting write-off(1) (61) (1) (35) (97) - (97)
Recovery of debts written off in previous years(1) 20 - 17 37 - 37
Net accounting write-offs (41) (1) (18) (60) - (60)
Balance of provision for credit losses at end of period 711 635 249 1,595 2 1,597
Of which: With respect to off balance sheet credit instruments 87 - 9 96 - 96
For the three months ended March 31, 2017 (unaudited)
Loans to the public
Commercial
Loans to the public
Housing
Loans to the public
Individual - other
Loans to the public Total
Banks and governments Total
Balance of provision for credit losses at start of period 724 615 208 1,547 2 1,549
Expenses with respect to credit losses 26 - 24 50 (1) 49
Net accounting write-off(1) (37) (3) (30) (70) - (70)
Recovery of debts written off in previous years(1) 17 - 14 31 - 31
Net accounting write-offs (20) (3) (16) (39) - (39)
Balance of provision for credit losses at end of period 730 612 216 1,558 1 1,559
Of which: With respect to off balance sheet credit instruments 85 - 8 93 - 93
(1) Net accounting write-offs presented in the Note primarily consists of write-offs of a technical nature, due to passage of time of clients being in arrears, in conformity with US standards applicable to the Bank in this regard. Thus, for example, the balance of provision for large impaired debt s will typically be subject to accounting write-off after two years. Debt measured on a group basis will be subject to write-off after 150 days in arrears. This means that the Bank's collection effort may sometimes take longer than the timing for write-off according to accounting rules. Consequently, relatively high balances of "accounting write-offs" and relatively high balances of "Recovery of debts written off in previous years" are presented.

111
Note 7 - Deposits from the Public Reported amounts (NIS in millions)
A. Deposit types by location and depositor type
March 31, 2018 unaudited
March 31, 2017 unaudited
December 31, 2017 (audited)
In Israel
On-call
Non interest-bearing 44,217 38,501 44,324
Interest-bearing 21,971 19,648 22,189
Total on-call 66,188 58,149 66,513
Term deposits 115,687 117,114 112,188
Total deposits in Israel(1) 181,875 175,263 178,701
Outside of Israel
On-call
Non interest-bearing 552 657 504
Interest-bearing 4 7 5
Total on-call 556 664 509
Term deposits 4,635 4,795 4,363
Total deposits overseas 5,191 5,459 4,872
Total deposits from the public 187,066 180,722 183,573
(1) Includes:
Deposits from individuals 89,193 83,711 87,456
Deposits from institutional investors 40,045 38,081(2) 38,881
Deposits from corporations and others 52,637 53,471(2) 52,364
B. Deposits from the public by size
March 31, 2018
(unaudited)
March 31, 2017
(unaudited)
December 31, 2017
(audited)
Maximum deposit
Up to 1 64,696 60,868 63,493
Over 1 to 10 42,287 39,146 41,125
Over 10 to 100 27,058 26,013 26,906
Over 100 to 500 23,823 27,311 23,911
Above 500 29,202 27,384 28,138
Total 187,066 180,722 183,573
(2) A balance amounting to NIS 700 million was reclassified from "balance of deposits from institutional investors" to "balance of deposits from other corporations".

112
Note 8 - Employees’ Rights
Description of benefits
1. Employment terms of the vast majority of Group employees and managers are subject to provisions of collective bargaining agreements. Pension liabilities to these employees, except for Bank Yahav employees, are covered by regular deposits to pension, provident and severance-pay funds, which release the Bank from severance-pay liabilities for those employees by law. For more information about various benefits to Bank employees and managers, see Note 22 to the financial statements as of December 31, 2017.
2. Remuneration policy for all Bank employees other than officers
On March 20, 2017, the Board of Directors resolved, after receiving the recommendation from the Remuneration Committee, to approve a revised remuneration policy for all Bank employees, other than officers who are subject to the revised remuneration policy for Bank officers, as noted above (hereinafter: "the revised remuneration policy for all Bank employees"). For more information see Note 22.A.5. to the 2017 financial statements.
3. For more information about an economic arbitration between the Bank and the Mizrahi Tefahot Employees’ Union, see Note 22.A.6. to the 2017 financial statements. Management believes, based on the opinion of legal counsel, that exposure with respect to this arbitration cannot be estimated.
For more information about signing of a new collective bargaining agreement with the Employees’ Union in December 2017 and implications of this agreement, see Note 22.A.6. to the 2017 financial statements.
4. Payroll agreements for employees represented by the Council of Managers and Authorized Signatories
The labor agreement with the Council of Managers is effective through 2017. Negotiations have started in order to sign a new labor agreement for the coming years.
5. Labor and payroll agreements at the Technology Division
Employment terms of employees of Mizrahi Tefahot Technology Division Ltd. (hereinafter: "the Technology Division") are arranged in the labor constitution that was signed in 1989 and in a series of agreements signed by the Technology Division Employee Council, the Labor Union and the Technology Division over the years.
Employees of the Technology Division have their pay linked to the pay for Bank employees.
In recent months, discussions are under way with the division's employee representation and the MAOF trade union as to implementation of the linkage to the collective bargaining agreement signed by the Bank and the Employees’ Union at Bank Mizrahi Tefahot in late 2017. The Bank made appropriate provisions for this matter.

113
Note 8 - Employees’ Rights - Continued
6. Net benefit cost components recognized in profit and loss with respect to defined-benefit and defined-contribution pension plans (NIS in millions)(1)
For the three months ended March 31,
2018
(unaudited)
For the three months ended March 31,
2017
(unaudited)
For the year ended December 31,
2017
(audited)
Under payroll and associated expenses
Cost of service(2) 13 10 42
Under other expenses
Cost of interest(3) 10 10 42
Expected return on plan assets(4) (1) (1) (4)
Deduction of non-allowed amounts:
Net actuarial loss(5) 8 3 18
Total under other expenses 17 12 56
Total benefit cost, net 30 22 98
Total expense with respect to defined-contribution pension 35 30 121
Total expenses recognized on profit and loss 65 52 219
7.Deposits to defined-benefit pension plans (NIS in millions)
Forecast
For(6)
2018
For the three months ended
March 31,
Actual deposits
For the three months ended
March 31,
2018
(unaudited)
For the three months ended
March 31,
Actual deposits
For the three months ended
March 31,
2017
(unaudited)
For the year ended December 31,
Actual deposits
For the year ended December 31,
2017
(audited)
Deposits 5 1.4 1.5 6.3
(1) For more information about directives of the Supervisor of Banks with regard to improved presentation of expenses with respect to pension and other post-employment benefits, see Note 1.D.4.
(2) Cost of service is the current accrual of future employees’ benefits in the period. (3) Cost of interest is the amount recognized in the period, set based on the increase in obligation with respect to expected
benefit due to passage of time. (4) Expected return is the expected return on plan assets, determined based on expected long-term rates of return on plan
assets and based on the established market value of plan assets. (5) Deduction of net gain or loss previously recognized in Cumulative Other Comprehensive Income. (6) Estimated deposits to be paid into defined-benefit pension plans through end of 2018.

114
Note 9 - Capital adequacy, liquidity and leverage pursuant to directives of the Supervisor of Banks Reported amounts (NIS in millions)
A. Capital adequacy pursuant to directives of the Supervisor of Banks
Calculated in accordance with Proper Banking Conduct Directives 201-211 "Measurement and Capital Adequacy"
March 31,
2018
(unaudited)
March 31,
2017
(unaudited)
December 31,
2017
(audited)
1. Consolidated data
A. Capital for purpose of calculating minimum capital ratio
Tier I shareholders’ equity 14,436 13,533 14,333
Tier I capital 14,436 13,533 14,333
Tier II capital 4,813 4,442 5,251
Total capital 19,249 17,975 19,584
B. Weighted risk asset balances
Credit risk 131,801 124,319 130,525
Market risks 1,699 1,266 1,605
Operating risk 8,629 8,198 8,394
Total weighted risk asset balances(1) 142,129 133,783 140,524
March 31,
2018
(unaudited)
In %
March 31,
2017
(unaudited)
In %
December
31, 2017
(audited)
In %
C. Ratio of capital to risk elements
Ratio of Tier I shareholders’ equity capital to risk elements 10.16 10.12 10.20
Ratio of Tier I capital to risk elements 10.16 10.12 10.20
Ratio of total capital to risk elements 13.54 13.44 13.94
Minimum Tier I capital ratio required by Supervisor of Banks(2) 9.86 9.87 9.86
Total minimum capital ratio required by the Supervisor of Banks(2) 13.36 13.37 13.36
2. Significant subsidiaries
Bank Yahav for Government Employees Ltd. and its subsidiaries
Ratio of Tier I shareholders’ equity capital to risk elements 9.39 9.53 9.27
Ratio of Tier I capital to risk elements 9.39 9.53 9.27
Ratio of total capital to risk elements 13.11 13.42 13.01
Minimum Tier I capital ratio required by Supervisor of Banks 9.00 9.00 9.00
Total minimum capital ratio required by the Supervisor of Banks 12.50 12.50 12.50
(1) Of the total weighted balance of risk assets, NIS 270 million was deducted due to adjustments with respect to the streamlining plan (on March 31, 2017: NIS 230 million; on December 31, 2017: NIS 298 million).
(2) The minimum capital ratio required by the Supervisor of Banks is increased by a capital requirement reflecting 1% of the outstanding balance of housing loans as of the report date.

115
Note 9 - Capital adequacy, liquidity and leverage pursuant to directives of the Supervisor of Banks - Continued Reported amounts (NIS in millions)
A. Capital adequacy pursuant to directives of the Supervisor of Banks - continued
Calculated in accordance with Proper Banking Conduct Directives 201-211 "Measurement and Capital Adequacy" - continued
March 31, 2018
(unaudited)
March 31, 2017
(unaudited)
December 31, 2017
(audited)
3. Capital components for calculation of capital ratio (on consolidated basis)
A. Tier I capital
Shareholders’ equity 14,548 13,634 14,327
Differences between shareholders’ equity and Tier I capital (260) (173) (169)
Total Tier I capital before regulatory adjustments and deductions 14,288 13,461 14,158
Regulatory adjustments and deductions:
Goodwill (87) (87) (87)
Regulatory adjustments and other deductions (13) (19) (11)
Total supervisory adjustments and deductions, before adjustments with respect to the streamlining plan - Tier I capital (100) (106) (98)
Total adjustments with respect to the streamlining program(1) 248 178 273
Total Tier I capital after regulatory adjustments and deductions 14,436 13,533 14,333
B. Tier II capital
Tier II capital: Instruments, before deductions 3,367 3,044 3,821
Tier II capital: Provisions, before deductions 1,446 1,398 1,430
Total Tier II capital, before deductions 4,813 4,442 5,251
Deductions:
Total deductions - Tier II capital - - -
Total Tier II capital 4,813 4,442 5,251
March 31, 2018
(unaudited) In %
March 31, 2017
(unaudited) In %
December 31, 2017
(audited) In %
4. Effect of transitional provisions on Tier I capital
Ratio of capital to risk elements
Ratio of Tier I equity to risk elements, before effect of transition provision of Directive 299 and before effect of adjustments with respect to the streamlining plan(2) 9.96 9.92 9.92
Effect of transition provisions, before effect of adjustments with respect to the streamlining plan - 0.06 0.06
Effect of adjustments with respect to the streamlining plan 0.20 0.14 0.22
Ratio of Tier I capital to risk elements before application of transitional provisions 10.16 10.12 10.20
(1) Of which, NIS 183 million with respect to streamlining program concerning employees’ rights and NIS 65 million with respect to streamlining program concerning real estate (on March 31, 2017: NIS 178 million with respect to streamlining program concerning employees’ rights; on December 31, 2017: NIS 202 million with respect to streamlining program concerning employees’ rights and NIS 71 million with respect to streamlining program concerning real estate).
(2) Before effect of transitional provisions concerning adoption of US GAAP with regard to employees’ rights.

116
Note 9 - Capital adequacy, liquidity and leverage pursuant to directives of the Supervisor of Banks - Continued Reported amounts (NIS in millions)
B. Liquidity coverage ratio pursuant to directives of the Supervisor of Banks
Calculated in accordance with Proper Banking Conduct Directive 221 "Liquidity coverage ratio"
March 31, 2018
(unaudited)
In %
March 31, 2017
(unaudited)
In %
December 31, 2017
(audited)
1. Consolidated data Liquidity coverage ratio(1) (3)125 118 118
Minimum liquidity coverage ratio required by the Supervisor of Banks 100 100 100
2. Bank data Liquidity coverage ratio(1) 125 118 118
Minimum liquidity coverage ratio required by the Supervisor of Banks 100 100 100
3. Significant subsidiaries Bank Yahav for Government Employees Ltd. and
its subsidiaries Liquidity coverage ratio(1) 257 353 260
Minimum liquidity coverage ratio required by the Supervisor of Banks 100 100 100
C. Leverage ratio pursuant to directives of the Supervisor of Banks
Calculated in conformity with Proper Banking Conduct Directive 218 "Leverage ratio"
March 31, 2018
(unaudited)
March 31, 2017
(unaudited)
December 31, 2017
(audited)
1. Consolidated data Tier I capital(1) 14,436 13,533 14,333
Total exposure 265,621 256,712 261,504
March 31, 2018
(unaudited)
In %
March 31, 2017
(unaudited)
In %
December 31,
2017
(audited)
Leverage ratio 5.43 5.27 5.48
Minimum leverage ratio required by the Supervisor of Banks(2) 5.00 5.00 5.00
2. Significant subsidiaries Bank Yahav for Government Employees Ltd. and
subsidiaries thereof Leverage ratio 5.15 5.04 5.14
Minimum leverage ratio required by the Supervisor of Banks(2) 4.70 4.70 4.70
(1) For effect of transition provisions and effect of adjustments with respect to the streamlining program, see sections A.3, A.4 above.
(2) Banking corporations are required to achieve the minimum leverage ratio required by the Supervisor of Banks as from January 1, 2018.
(3) The liquidity coverage ratio as of March 31, 2018 includes the effect of implementation of Bank of Israel directives to apply a reduced withdrawal rate with respect to operational deposits, as from the first quarter of 2018.

117
Note 9 - Capital adequacy, liquidity and leverage pursuant to directives of the Supervisor of Banks - Continued Reported amounts (NIS in millions)
D. The Bank applies the capital adequacy directives based on the Basel directives, as issued by the Supervisor of Banks in Proper Conduct of Banking Business Directives 201-222 and in the Q&A file.
For more information about the Supervisor of Banks' directives regarding capital adequacy, see Note 25 to the 2017 financial statements.
E. On March 15, 2018, the Supervisor of Banks issued a circular revising Proper Banking Conduct Directive 203 "Measurement and capital adequacy - Credit risk" with regard to risk weighting of loans with LTV ratio higher than 60%.
The circular stipulated that loans with LTV ratio higher than 60% would be assigned a 60% risk weighting, compared to 75% prior to this revision. The revision is designed to provide relief to young couples and second home buyers who purchase apartments with a high LTV ratio.
The revision is effective as from the circular issue date. The Bank is applying this directive.
Application of this directive reduces risk assets due to origination of housing loans with LTV ratio higher than 60%, originated as from the circular issue date.
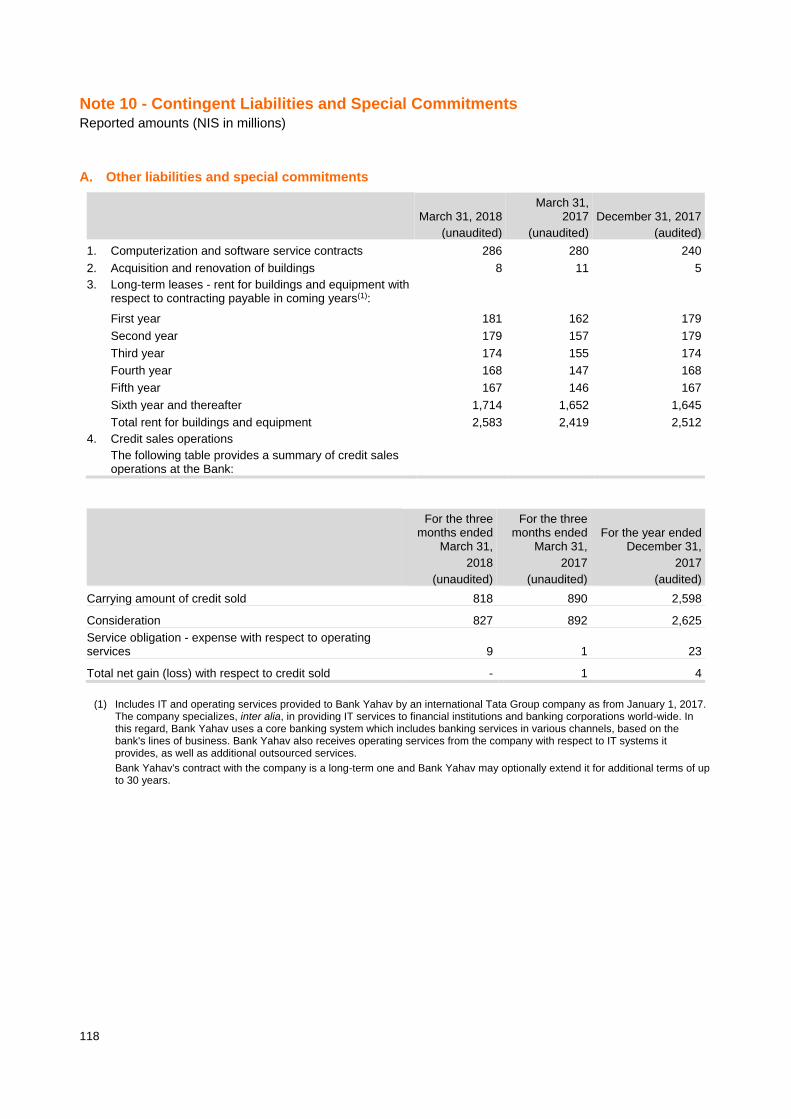
118
Note 10 - Contingent Liabilities and Special Commitments Reported amounts (NIS in millions)
A. Other liabilities and special commitments
March 31, 2018
(unaudited)
March 31, 2017
(unaudited)
December 31, 2017
(audited)
1. Computerization and software service contracts 286 280 240
2. Acquisition and renovation of buildings 8 11 5
3. Long-term leases - rent for buildings and equipment with respect to contracting payable in coming years(1):
First year 181 162 179
Second year 179 157 179
Third year 174 155 174
Fourth year 168 147 168
Fifth year 167 146 167
Sixth year and thereafter 1,714 1,652 1,645
Total rent for buildings and equipment 2,583 2,419 2,512
4. Credit sales operations
The following table provides a summary of credit sales operations at the Bank:
For the three months ended
March 31,
2018
(unaudited)
For the three months ended
March 31,
2017
(unaudited)
For the year ended December 31,
2017
(audited)
Carrying amount of credit sold 818 890 2,598
Consideration 827 892 2,625
Service obligation - expense with respect to operating services 9 1 23
Total net gain (loss) with respect to credit sold - 1 4
(1) Includes IT and operating services provided to Bank Yahav by an international Tata Group company as from January 1, 2017. The company specializes, inter alia, in providing IT services to financial institutions and banking corporations world-wide. In this regard, Bank Yahav uses a core banking system which includes banking services in various channels, based on the bank's lines of business. Bank Yahav also receives operating services from the company with respect to IT systems it provides, as well as additional outsourced services.
Bank Yahav's contract with the company is a long-term one and Bank Yahav may optionally extend it for additional terms of up to 30 years.

119
Note 10 - Contingent Liabilities and Special Commitments - continued
B. Contingent liabilities and other special commitments
1. For details of other contingent liabilities and special commitments by the Bank group, see Note 26 to the 2017 financial statements. Below is a description of material changes relative to the Note provided in the 2017 annual report.
2. Various claims are pending against the Bank and its subsidiaries, namely, claims of customers, as well as motions for recognition of various class actions. In the estimation of the management of the Bank, based on the estimation of the managements of its subsidiaries and on the opinion of their legal counsel as to the possible outcome of the pending claims and motions for approval of claims as class actions, the financial statements include appropriate provisions, where necessary, to cover possible damages.
Below are details of material claims, including motions for class action status and claims where the claim amount (excluding interest and expenses) exceeds 1% of the Bank's shareholder equity, in which developments and changes have occurred compared to the description included in the 2017 financial statements:
A) In May 2011, the Bank received a claim and motion for approval of class action status. The claim concerns two alleged claims made against the Bank - firstly, late reporting to the Court Order Execution Service of payments made to reduce debt which is subject to proceedings at the Court Order Execution Service. Secondly, failure to indicate on the reporting forms the number of the principal to be reduced by the reported credit, and the number of the interest calculation rule applied to the reported payment amount. The lawsuit and motion allege that, by late reporting to the Court Order Execution Service and by failure to provide the aforementioned indications on the reporting forms, the Bank misleads clients, causes clients not to be credited with interest in line with the date of their payment and in accordance with the correct interest rate, creates a situation in which the debt on Court Order Execution Service files is higher than the real debt, and over-charges in payments. The lawsuit and motion further allege that the Enforcement and Collection Authority and the Court Order Execution Service admit that under crediting occurs in case of late reporting and failure to provide the required indications on the reporting form.
The plaintiff claims he is unable to estimate the damage incurred by the entire class of plaintiffs, but believes (on a basis which is not clear to the Bank) that it amounts to hundreds of millions of NIS.
On January 9, 2012, the Bank filed its response to the motion, describing in detail the factual and legal defense claims made by the Bank. On May 20, 2012, the plaintiff filed their response to the Bank's response to the motion. In view of new claims made by the plaintiff in their response to the Bank's response, the Bank filed a further, more detailed response on August 15, 2012.
On October 17, 2012 and on October 29, 2012, the Court held preliminary hearings in this case.
The parties have agreed and launched a reconciliation process aimed to try and resolve their differences. The reconciliation process was concurrent with regard to other motions filed against other banks for the same cause, as well as with regard to other motions for class action status filed against the Bank and against other banks for causes related to debt management in Court Order Execution Service files.
The parties negotiated directly from August 2014 and in January 2016, due to a specific disagreement, the negotiations between the parties were terminated. They were resumed soon thereafter, in an attempt to reached an agreed arrangement.

120
Note 10 - Contingent Liabilities and Special Commitments - continued
On August 29, 2016, a Court hearing took place and the Court resolved that the parties to this lawsuit and to the lawsuit described in section B. below, should file a settlement agreement and motion for approval thereof, no later than October 30, 2016. The resolution dated November 7, 2016 allowed the parties an extension to file a settlement agreement and motion for approval thereof, no later than November 30, 2016. On January 16, 2017, a hearing concerning the settlement agreement took place. On March 28, 2017, a hearing took place with regard to the settlement agreement and in particular, concerning the issue of Court action and its scope On June 12, 2017, the parties filed the draft settlement agreement with the Court, asking for the Court's assistance in the matter of the aforementioned Court action. On June 15, 2017, another hearing on this disagreement took place.
In accordance with the Court ruling of July 4, 2017, on August 13, 2017, the parties submitted the final agreed version of the settlement agreement.
On November 7, 2017, the parties submitted to the Court the signed settlement agreement and its appendices with the application for approval thereof. On March 8, 2018, a further hearing took place, at which the Court raised questions regarding the settlement agreement in general and in particular, the issue of maintaining information confidentiality by the Enforcement and Collection Authority. On April 10, another hearing took place and was continued to May 28, 2018.
B) In December 2012, an action and a motion for recognition as a class action were filed with the Tel Aviv District Court, with regard to setting rates of arrears interest charged by the Bank in Court Order Execution Service cases filed against debtors. According to the plaintiff, the Bank charges interest significantly higher than the maximum interest rate on checking accounts. The plaintiff is unable to estimate the amount claimed.
The parties agreed to add this motion to the reconciliation process on-going with regard to other motions which also concern collection processes conducted by the Bank against clients in debt, as stated in section A. above and on January 4, 2016, a resolution was issued to refer the above claim for hearing by the same party as the above claims.
This motion, along with the motion for the lawsuit in section A. above, are in negotiations of a settlement agreement, as stated in section A. above.
C) In September 2011, a claim and motion for class action status was filed with the Central District Court
against the Bank, Bank Leumi LeIsrael Ltd. and Bank HaPoalim Ltd., for alleged unlawful charging of compounded interest, in contravention of statutes and agreements, on housing loans - including targeted loans, eligibility loans and additional loans, excluding standing loans. The total claim amount against the banks was NIS 927 million. The Bank's share of this claim amounts to NIS 364 million.
In May 2012, the Bank filed its response to this claim, claiming inter alia that it was unfounded, that the Bank acted in accordance with statutory provisions and did not charge any compounded interest in the manner in which banks in general and the Bank, in particular, acted. The position of the Supervisor of Banks, which supports the banks' position, was also filed in this case.
In July 2013, an evidentiary hearing took place and the experts on behalf of the parties were questioned. The plaintiffs filed their summation. In September 2014, the Bank filed its summation and in December 2014, the plaintiffs filed their summary responses.

121
Note 10 - Contingent Liabilities and Special Commitments - continued
On August 16, 2015 a verdict was issued, rejecting the motion for class action status.
On December 7, 2015, the parties appealed the verdict to the Supreme Court. The parties filed their summations and response summations.
On March 14, 2018, a hearing of the appeal by the Supreme Court took place, where the appellants accepted the recommendation made by the Court and agreed to withdraw their appeal. Therefore, this hearing was concluded with a verdict which rejects the appeal without awarding of expenses.
D) 1) In August 2013, a claim and motion for class action status in the amount of NIS 10.5 billion were filed with the Tel Aviv District Court against the 5 major banks, including the Bank, and against bank Presidents, including the Bank President & CEO, in person - with respect to unlawful charging of commissions by the banks with regard to foreign currency conversion and transfer, which the plaintiffs allege was made without proper disclosure. The plaintiffs also claim that a restrictive trade practice exists among the banks.
In September 2013, the defendants filed a motion with the Court, seeking dismissal of the personal claim against bank Presidents, and the individual claim against them was dismissed.
A revised motion for class action status filed on February 3, 2014 set the claim amount at NIS 11.15 billion for all banks on aggregate.
2) In March 2014, a claim and motion for class action status in the amount of NIS 2.07 billion were filed with the Tel Aviv District Court against the Bank and against Bank Otzar HaChayal, Mercantile Discount Bank, Bank Igud Le Israel and Bank Yahav, alleging unlawful commissions charged by the banks with regard to conversion and transfer of foreign currency (this claim is identical to the aforementioned one).
A motion has been filed to combine heating of this motion with the first aforementioned motion and the Court has agreed to said motion and has combined both claims.
On December 23, 2014. the Bank filed its response to each of the motions for class action status. The plaintiffs filed their response to the combined response to the two aforementioned motions, in which they attributed part of the claim amount to each of the plaintiffs; the Bank's alleged share for both these claims amounted to NIS 1.145 billion in principal.
On March 8, 2015, a pre-trial hearing of this case took place, after which the Court set deadlines for completion of the statements of claim by all parties.
On April 23, 2015, the plaintiffs filed, in conformity with the Court decision, a summary motion for approval of class action status, based on the current motions. The Bank filed its response to the summary motion on October 18, 2015.
On October 25, 2015, another pre-trial hearing took place. In this hearing, the Court combined the hearing of motions filed against the credit card companies and the Postal Bank with those filed against the banks. Evidentiary hearings took place in March 2016. The plaintiffs filed their summations in April 2016. Given the banks' motion to dismiss the plaintiffs' summation, an extension was granted for the banks to file their summations within 60 days after the decision on the motion to dismiss. On August 10, 2016, the Court accepted the motion by the banks and ordered the summation by the plaintiffs to be dismissed; on September 4, 2016, the plaintiffs filed new summations; and on January 17, 2017, the Bank filed its summation and the plaintiffs filed their response summations. On March 1, 2018, a verdict was handed down rejecting the motions and requiring the defendants to pay the expenses. On March 18, 2017, concurrently with filing of the appeal, the plaintiffs filed a motion to delay execution of the verdict (payment of expenses) and a motion seeking exemption from a bond deposit and a motion to add evidence in the appeal. The Court decision was given on the same date, granting a temporary stay of proceedings for payment of expenses; the banks should file their response to the motion by May 6, 2018.

122
Note 10 - Contingent Liabilities and Special Commitments - continued
E) In December 2015, a motion for class action status was filed against Bank Yahav, alleging that Bank Yahav charged individual clients (and small businesses) commissions whose amount and rate exceed the allowed maximum, specified in the price list for non-small businesses. This claim does not specify an estimated claim amount. The parties have negotiated a settlement agreement and on January 15, 2018, the parties filed a motion with the Court to approve the settlement agreement.
On March 28, 2018, the Court issued a verdict confirming the settlement agreement.
F) In January 2016, a claim and motion for class action status was filed with the Jerusalem District Court, amounting in total to NIS 697.5 million, against the Bank, First International Bank of Israel Ltd., Bank Otzar HaChayal Ltd., Bank Yahav for Government Employees Ltd. and Bank Igud LeIsrael Ltd. (hereinafter: "the defendants"). This claim alleges discrimination of the Arab population with regard to access to banking services, in that the defendants do not maintain branches close to Arab population and do not make their banking services accessible to this population - in alleged violation of the Prohibition of Discrimination in Products, Services and in Access to Entertainment Venues and to Public Venues Act, 2000.
The plaintiff seeks a verdict stating, in conformity with the Class Action Lawsuit Act, that the claim is to be filed on behalf of all Israeli residents who are Muslim, Christian or Druze, who suffer from discrimination in access to banking services by the defendants, due to absence of bank branches of the defendants in their town.
The plaintiffs set their claim against all defendants at NIS 697.5 million, noting that each defendant's share of the damage caused to class members is based on their market share - as is their share in compensation to class members. The Bank filed its response to the motion on August 4, 2016 and the plaintiffs filed their response there to on November 13, 2016.
A pre-trial hearing took place on December 19, 2016, at which the Court recommended that the parties reach a settlement in this case. As proposed by the Court, the parties have started negotiations. On May 10, 2017, another pre-trial hearing took place where the parties informed the Court that they had not reached understandings. On May 24, 2017, the plaintiffs filed data obtained from the Bank of Israel about the banks in 2009 and thereafter, the respondents filed their own updated data. Evidentiary hearings took place in November. The parties filed their written summations and verbal summations were heard on November 30, 2017.
On December 28, 2017, a verdict was issued rejecting the motion for approval. On February 11, 2018, this verdict was appealed to the Supreme Court. On March 21, 2018, the plaintiffs filed a motion seeking to reduce the bond amount set in this case, the Bank filed its response and a decision is still pending.
G) In December 2016, a motion for class action status was filed with the Central District Court against the Bank, Bank HaPoalim, Bank Leumi and Discount Bank, alleging charging of foreign currency-related fees not in conformity with provisions of the complete price list, as stated in Banking Regulations (Customer Service) (Fees), 2008 and in violation of Section 9 of the Banking Act (Customer Service), 1981. According to the plaintiff, the defendant banks charge minimum fees with respect to various foreign currency-related transactions, graduated according to transaction amount, allegedly in contravention of provisions of the complete price list, whereby the defendant banks must list the fee they charge for a range of transactions as "Percentage (minimum, maximum)". The plaintiff further claims that the defendant banks are in breach of the Anti-Trust Act by maintaining a restrictive arrangement.
The plaintiff notes that they do not have the final data, which are available to the defendants. However, they estimate the damage incurred to be at least NIS 500 million.

123
Note 10 - Contingent Liabilities and Special Commitments - continued
The Bank's response was filed on April 23, 2017 and the plaintiff's response was filed on May 21, 2017. On July 3, 2017, a pre-trial hearing took place after which the plaintiff was allowed to amend their motion and to file it no later than October 15, 2017. On September 3, 2017, a revised motion was filed and the Bank has filed its response to the revised motion. On December 24, 2017, a pre-trial hearing took place, after which the Court asked to receive the Bank of Israel position on the question under dispute. On February 12, 2018, the Supervisor of Banks submitted its position, whereby charging a minimum commission for gradual foreign currency transfer from overseas to overseas, provided that the basic structure of minimum and maximum commissions is maintained, does not constitute a breach of the commission rules included in the complete price list. On that date, the Court handed down its resolution, whereby the plaintiffs would inform the Court by February 26, 2018, whether they wish to pursue the case in view of the position of the Supervisor of Banks. On March 13, 2018, a hearing took place at which the plaintiffs asked to withdraw their motion for approval. Consequently, a verdict was handed down, confirming the plaintiffs' withdrawal without award of expenses.
For all claims against the Bank Group in individual amounts over NIS 2 million, excluding claims listed in section 2 above, there is additional, non-remote exposure for which no provision was made, amounting to NIS 72 million.
3. Motions for class action status and a motion for approval of a derivative claim are pending against the Bank and subsidiaries, where the amount claimed is material, as well as appeals to the High Court of Justice, as itemized below, which, in the opinion of the Bank's management, based on the opinion of the managements of its subsidiaries, and on the opinion of their legal counsel, the prospects for which cannot be estimated on the date of the financial statements, so that no provision was made for these.
A) In March 2015, a motion for approval of derivative claim was filed with the District Court in Tel Aviv ("the motion") on behalf of the Bank and its subsidiary, UMB (Switzerland) Ltd. ("Mizrahi Switzerland") against past and incumbent officers of the Bank and of Mizrahi Switzerland, at a minimum amount of NIS 95 million, for damage allegedly sustained by Mizrahi Group due to the defendants' deeds and omissions with regard to providing assistance to US clients in avoiding taxes in the USA. The plaintiff claims that defendants should reimburse the Bank for the damage they have caused to Mizrahi Group in general and to the Bank in particular.
On March 24, 2015, a Bank shareholder filed a motion in conjunction with the aforementioned proceeding, seeking to join as a party to said proceeding and to delay the hearing or, alternatively, to dismiss it out of hand, given the motion for document discovery filed by that shareholder in December 2014 with the Tel Aviv District Court against the Bank and its officers pursuant to provisions of Section 198a of the Companies Law 1999 ("the motion for discovery"). In conjunction with the motion for discovery, the plaintiff asked the Court to instruct the Bank and the other defendants to provide to the plaintiff various documents with regard to on-going proceedings in the USA, so as to allow the plaintiff to review potential filing of a motion for derivative defense (on behalf of the Bank in the USA) or filing of a motion for approval of derivative claim (against executives and employees of the Bank). The plaintiff claims in the motion for discovery that the process of the motion for discovery is a pending process which has priority over the motion for approval - which is why hearing of the motion for approval should be delayed and even dismissed out of hand.

124
Note 10 - Contingent Liabilities and Special Commitments - continued
On May 10, 2015, the Court approved, in conjunction with the motion for approval, a hearing arrangement agreed by the parties in this case, with regard to dates for filing statements of claim whereby, inter alia, at this stage the deadlines for filing the defendants' responses to the motion for approval would be suspended and soon after a decision is given, inter alia, with regard to the aforementioned motion to join and subject to it, the schedule for filing these responses would be set considering, inter alia, the progress made in proceedings with the Department of Justice in the USA.
It should be noted, with regard to the motion for discovery, that on May 3, 2015, a preliminary hearing of this motion took place wherein the Court approved the agreement reached by the parties, that the hearing of the actual motion for discovery would currently be suspended, pending completion of document discovery for filing with authorities in the USA. In December 2015, the Court resolved that the motion for approval would be dismissed, but the dismissal would be delayed that should the motion for discovery be allowed and should the plaintiff of the motion for discovery file a motion for approval 90 days after receiving the documents in a timely manner as instructed by the Court in its resolution, the motion for approval would be dismissed. Should the discovery motion be dismissed, or should a motion for approval not be filed by 90 days after receiving the documents - the motion for approval would be considered a preliminary motion to any other motion, if filed.
On April 18, 2016, the Court resolved to postpone the hearing of the motion pending conclusion of the inquiry and reporting of its outcome.
On April 12, 2017, the Court directed the Attorney General to inform the Court in 45 days' time of their intention to join the proceeding. On April 12, 2017, the Court directed the Attorney General to inform the Court of their intention to join the proceeding. On August 3, 2017, the Attorney General submitted a notice on behalf thereof, regarding their appearance in the discovery process, to which they attached their position. On September 10, 2017, the Bank and the other respondents filed their responses to the Attorney General's position.
On September 19, the Court approved a procedural arrangement reached by the parties in the case, whereby the hearing of this case will be suspended at this stage, subject to the respondents reporting to the Court and to the plaintiff as from December 31, 2017, once every 90 days, of the inquiry by the US DOJ.
On December 26, 2017, the Court ordered the parties to inform the Court, no later than April 1, 2018, where they stand on the matter and on continued hearing of the claim. In conformity with the Court resolution dated September 19, 2017, the Bank filed with the Court, on March 29, 2018, a revised notice about the inquiry; the Court ordered a follow-up update after further 90 days.
See also section 4 with regard to inquiry by the US Department of Justice concerning Bank Group business with its US clients.
B) In November 2017, a claim and motion for class action status were filed with the District Court Center-
Lod against the Bank, in the amount of NIS 437.3 million alleging charging of excess interest on housing loans, due to reduction of the loan component based on the prime lending rate which is allegedly misleading and lacking proper disclosure.
According to the plaintiffs, the Bank refrained from providing its customers with a housing loan, in which the loan component based on the prime lending rate is the maximum permitted by Bank of Israel directives (33.3%), in order to increase the amount which the Bank may provide in supplementary, much costlier loans.

125
Note 10 - Contingent Liabilities and Special Commitments - continued
The plaintiffs note that they do not deny or challenge the fact that the Bank has discretion in granting housing loans and the approved composition of the loan, but rather the manner in which the Bank exercises its discretion and its extended fiduciary, trust and disclosure duties. The Bank filed its response on March 29, 2018; a pre-trial hearing is scheduled for July 2, 2018.
C) In December 2017, a motion for approval of class action status was filed with the Jerusalem District Court against the Bank and against Bank Otzar HaChayal, Bank Leumi Le-Israel Ltd. and Bank Mercantile Discount. The motion concerns credit extended under the Small Business Fund.
The plaintiffs allege that the respondent banks, providing credit under the Small Business Fund, require borrowers to deposit part of the loan funds, which constitutes forbidden service contingent on service, while allegedly raising the effective interest rate for the loan. They further allege that this conduct by the banks constitutes a restrictive trade practice.
The plaintiff set the claim amount for the Bank at over NIS 147 million. The Bank must submit its response by June 10, 2018 and a pre-trial hearing is scheduled for June 24, 2018.
D) In December 2017, a claim and motion for approval of class action status was filed with the Central District Court amounting to NIS 124 million. The claim involves setting of interest rate in housing loans bearing adjustable interest - debentures. The plaintiffs allege that the Bank issues an approval in principle to the client, listing the debenture base as the only mechanism for interest calculation in the adjustable interest track - debentures for the term of the loan. However, the loan agreement includes another mechanism titled "Emergency Protection Mechanism" for setting the interest rate, in addition to the original mechanism, without providing proper disclosure. It is further alleged that the condition stipulated by the Bank in the agreement, with regard to triggering of the Emergency Protection Mechanism, is unfair and gives the Bank an unreasonable advantage over its clients.
The Bank must submit its response by May 1, 2018; a pre-trial hearing is scheduled for July 9, 2018. 4. Further to section 12 of Note 26 to the financial statements as of December 31, 2017 ("the Financial
Statements"), the US Department of Justice (DOJ) adressed the Bank with further requests to conduct further reviews, including with regard to further accounts, which might be relevant for the inquiry, and to produce documents with regard to the subject matters of the inquiry, relating to the Bank Group. The Bank is acting to respond and to comply with these requests.
In a letter from the month of April 2018, the DOJ informed the Bank that it would be providing the Bank with a draft agreement (D.P.A. - Deferred Prosecution Agreement).
The Bank is engaged in preliminary contacts with the US DOJ with regard to a possible outline for concluding the inquiry, regarding the type of agreement and principles thereof. However, negotiations have yet to start, including with regard to financial implications for the Bank Group, if any, of such an agreement when reached.
According to the opinion of the Bank's legal counsel, based on data in the computer-based repository which has been validated and considering arrangements made by the US DOJ with other banks with regard to inquiry concerning undisclosed accounts of US taxpayers, certain data in the repository may be relevant to Bank Group exposure, should the Bank's position relating to them not prevail.

126
Note 10 - Contingent Liabilities and Special Commitments - continued
Based on the aforementioned opinion, the provision with respect to this inquiry amounts to USD 46.1
million (NIS 161.9 million). This amount was calculated for data which may be relevant, according to opinion of the Bank's legal counsel and for components which, according to the opinion of the Bank's legal counsel, should be accounted for, as the case may be: The estimated tax amount which the US clients associated with said data ("the relevant clients") should have paid to the IRS in the USA, revenues accrued by the Bank due to banking activity of the relevant clients and the percentage of monetary assets of the relevant clients (and excluding other payment components, such as fines). As for data related to Mizrahi Switzerland business with US clients, the provision was calculated based on a theoretical assumption whereby Mizrahi Switzerland Bank is included in category 2 in the Swiss Program.
It is possible that after analysis and validation of the information and data, to be conducted in conformity with additional requests addressed to the Bank by the US DOJ, as set forth above, relevant data would be added resulting in updates to the provision amount.
Note that the Bank's legal counsel has expressed their opinion that at this stage, it is not possible to estimate the potential loss which the Bank Group may incur with respect to this inquiry, the relevant exposure amount nor the exposure range for the Bank Group. This is due, inter alia, to the fact that based on the professional experience of US legal counsel, such conclusions cannot be made prior to analysis of all data and information to be provided and because, other than preliminary discussions as noted above, negotiations with the US DOJ with regard to formulating an appropriate outline for the Bank Group have yet to start.
In view of the foregoing, it is possible that in the future the realized loss may turn out to be significantly higher than the amount of the provision recorded to date.

127
Note 11 - Derivatives and hedging activities Reported amounts (NIS in millions)
A) Activity on consolidated basis
As of March 31, 2018 (unaudited)
Interest contracts NIS - CPI
Interest contracts
Other Currency contracts
Contracts for shares
Commodities and other contracts Total
1. Stated amounts of derivatives A. Hedging derivatives(1) Forward contracts 699 - - - - 699
Other option contracts: -
Options written - 18 - - - 18
Swaps 550 789 - - - 1,339
Total 1,249 807 - - - 2,056
Includes interest rate swaps on which the Bank agreed to pay a fixed interest rate 550 789 - - - 1,339
B. ALM derivatives(1)(2) Forward contracts 4,038 - 97,696 - 45 101,779
Option contracts traded on stock exchange: -
Options written - - 8 - - 8
Options purchased - - 148 - - 148
Other option contracts: -
Options written - - 14,581 - - 14,581
Options purchased - - 12,996 - - 12,996
Swaps 2,887 30,510 7,517 - - 40,914
Total 6,925 30,510 132,946 - 45 170,426
Includes interest rate swaps on which the Bank agreed to pay a fixed interest rate 2,775 18,042 - - - 20,817
C. Other derivatives(1) Forward contracts - - 1,106 - - 1,106
Option contracts traded on stock exchange: -
Options written - - 4,485 11,481 6,178 22,144
Options purchased - - 4,485 11,481 6,178 22,144
Other option contracts: -
Options written - - - 73 - 73
Options purchased - 70 - 29 - 99
Swaps - 3 21 4,802 - 4,826
Total - 73 10,097 27,866 12,356 50,392
Includes interest rate swaps on which the Bank agreed to pay an interest rate - 3 - - - 3
(1) Except for credit derivatives and spot contracts for foreign currency swaps. (2) Derivatives which constitute part of the Bank’s asset and liability management system, which were not intended as hedges.
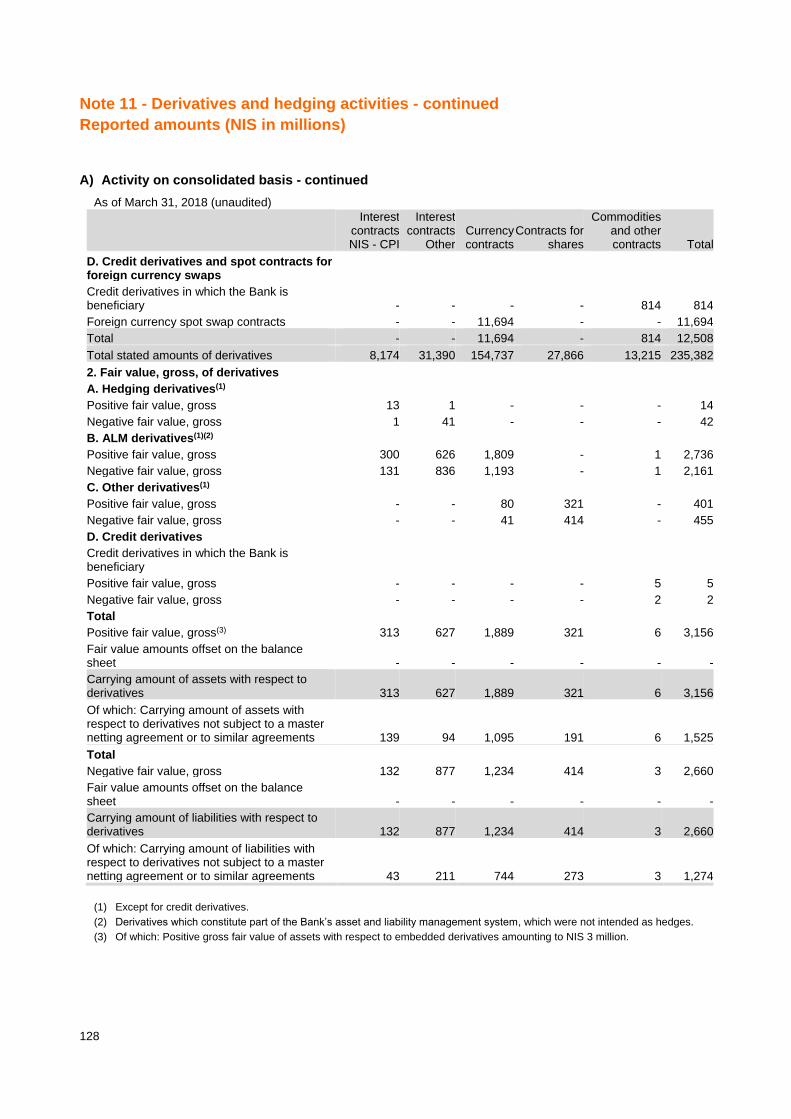
128
Note 11 - Derivatives and hedging activities - continued
Reported amounts (NIS in millions)
A) Activity on consolidated basis - continued
As of March 31, 2018 (unaudited)
Interest contracts NIS - CPI
Interest contracts
Other Currency contracts
Contracts for shares
Commodities and other contracts Total
D. Credit derivatives and spot contracts for foreign currency swaps Credit derivatives in which the Bank is beneficiary - - - - 814 814
Foreign currency spot swap contracts - - 11,694 - - 11,694
Total - - 11,694 - 814 12,508
Total stated amounts of derivatives 8,174 31,390 154,737 27,866 13,215 235,382
2. Fair value, gross, of derivatives A. Hedging derivatives(1) Positive fair value, gross 13 1 - - - 14
Negative fair value, gross 1 41 - - - 42
B. ALM derivatives(1)(2) Positive fair value, gross 300 626 1,809 - 1 2,736
Negative fair value, gross 131 836 1,193 - 1 2,161
C. Other derivatives(1) Positive fair value, gross - - 80 321 - 401
Negative fair value, gross - - 41 414 - 455
D. Credit derivatives Credit derivatives in which the Bank is beneficiary Positive fair value, gross - - - - 5 5
Negative fair value, gross - - - - 2 2
Total Positive fair value, gross(3) 313 627 1,889 321 6 3,156
Fair value amounts offset on the balance sheet - - - - - -
Carrying amount of assets with respect to derivatives 313 627 1,889 321 6 3,156
Of which: Carrying amount of assets with respect to derivatives not subject to a master netting agreement or to similar agreements 139 94 1,095 191 6 1,525
Total Negative fair value, gross 132 877 1,234 414 3 2,660
Fair value amounts offset on the balance sheet - - - - - -
Carrying amount of liabilities with respect to derivatives 132 877 1,234 414 3 2,660
Of which: Carrying amount of liabilities with respect to derivatives not subject to a master netting agreement or to similar agreements 43 211 744 273 3 1,274
(1) Except for credit derivatives. (2) Derivatives which constitute part of the Bank’s asset and liability management system, which were not intended as hedges. (3) Of which: Positive gross fair value of assets with respect to embedded derivatives amounting to NIS 3 million.

129
Note 11 - Derivatives and hedging activities - continued Reported amounts (NIS in millions)
A) Activity on consolidated basis - continued
As of March 31, 2017 (unaudited)
Interest contracts NIS - CPI
Interest contracts
Other Currency contracts
Contracts for shares
Commodities and other contracts Total
1. Stated amounts of derivatives A. Hedging derivatives(1) Forward contracts 1,632 - - - - 1,632
Other option contracts: -
Options written - 18 - - - 18
Swaps - 1,314 - - - 1,314
Total 1,632 1,332 - - - 2,964
Includes interest rate swaps on which the Bank agreed to pay a fixed interest rate - 1,314 - - - 1,314
B. ALM derivatives(1)(2) Forward contracts 6,095 200 95,638 - 31 101,964
Option contracts traded on stock exchange: -
Options written - - 350 40 - 390
Options purchased - - 346 40 - 386
Other option contracts: -
Options written - - 11,859 - - 11,859
Options purchased - - 11,002 49 - 11,051
Swaps 1,738 32,828 7,611 - - 42,177
Total 7,833 33,028 126,806 129 31 167,827
Includes interest rate swaps on which the Bank agreed to pay a fixed interest rate 1,626 19,268 - - - 20,894
C. Other derivatives(1) Forward contracts - - 1,125 - - 1,125
Option contracts traded on stock exchange: -
Options written - - 7,580 8,008 6,828 22,416
Options purchased - - 7,580 8,008 6,828 22,416
Other option contracts: -
Options written - 50 - 50 - 100
Options purchased - 123 - 41 - 164
Swaps - 4 15 8,927 - 8,946
Total - 177 16,300 25,034 13,656 55,167
Includes interest rate swaps on which the Bank agreed to pay an interest rate - 4 - - - 4
(1) Except for credit derivatives and spot contracts for foreign currency swaps. (2) Derivatives which constitute part of the Bank’s asset and liability management system, which were not intended as hedges.

130
Note 11 - Derivatives and hedging activities - continued Reported amounts (NIS in millions)
A) Activity on consolidated basis - continued
As of March 31, 2017 (unaudited)
Interest contracts NIS - CPI
Interest contracts
Other Currency contracts
Contracts for shares
Commodities and other contracts Total
D. Credit derivatives and spot contracts for foreign currency swaps Credit derivatives in which the Bank is beneficiary - - - - 902 902
Foreign currency spot swap contracts - - 7,521 - - 7,521
Total - - 7,521 - 902 8,423
Total stated amounts of derivatives 9,465 34,537 150,627 25,163 14,589 234,381
2. Fair value, gross, of derivatives A. Hedging derivatives(1) Positive fair value, gross 18 9 - - - 27
Negative fair value, gross 1 80 - - - 81
B. ALM derivatives(1)(2) Positive fair value, gross 349 931 2,101 16 1 3,398
Negative fair value, gross 190 1,206 2,193 - 1 3,590
C. Other derivatives(1) Positive fair value, gross - 1 115 411 - 527
Negative fair value, gross - - 97 374 - 471
D. Credit derivatives Credit derivatives in which the Bank is beneficiary Positive fair value, gross - - - - 4 4
Negative fair value, gross - - - - 1 1
Total Positive fair value, gross(3) 367 941 2,216 427 5 3,956
Fair value amounts offset on the balance sheet - - - - - -
Carrying amount of assets with respect to derivatives 367 941 2,216 427 5 3,956
Of which: Carrying amount of assets with respect to derivatives not subject to a master netting agreement or to similar agreements 183 170 1,016 202 4 1,575
Total Negative fair value, gross 191 1,286 2,290 374 2 4,143
Fair value amounts offset on the balance sheet - - - - - -
Carrying amount of liabilities with respect to derivatives 191 1,286 2,290 374 2 4,143
Of which: Carrying amount of liabilities with respect to derivatives not subject to a master netting agreement or to similar agreements 46 283 1,615 364 1 2,309
(1) Except for credit derivatives. (2) Derivatives which constitute part of the Bank’s asset and liability management system, which were not intended as hedges. (3) Of which: Positive gross fair value of assets with respect to embedded derivatives amounting to NIS 5 million.

131
Note 11 - Derivatives and hedging activities - continued Reported amounts (NIS in millions)
A) Activity on consolidated basis - continued
As of December 31, 2017 (audited)
Interest contracts NIS - CPI
Interest contracts
Other Currency contracts
Contracts for shares
Commodities and other contracts Total
1. Stated amounts of derivatives A. Hedging derivatives(1) Forward contracts 1,500 - - - - 1,500
Other option contracts: Options written - 17 - - - 17
Swaps - 937 - - - 937
Total 1,500 954 - - - 2,454
Includes interest rate swaps on which the Bank agreed to pay a fixed interest rate - 937 - - - 937
B. ALM derivatives(1)(2) Forward contracts 5,125 - 89,541 - 46 94,712
Option contracts traded on stock exchange: Options written - - 97 - - 97
Options purchased - - 288 - - 288
Other option contracts: Options written - - 12,328 - - 12,328
Options purchased - - 11,392 - - 11,392
Swaps 2,458 28,923 7,707 - - 39,088
Total 7,583 28,923 121,353 - 46 157,905
Includes interest rate swaps on which the Bank agreed to pay a fixed interest rate 2,346 17,768 - - - 20,114
C. Other derivatives(1) Forward contracts - - 1,050 - - 1,050
Option contracts traded on stock exchange: Options written - - 4,803 13,503 5,853 24,159
Options purchased - - 4,803 13,503 5,853 24,159
Other option contracts: Options written - - - 49 - 49
Options purchased - 69 - 41 - 110
Swaps - 3 28 5,031 - 5,062
Total - 72 10,684 32,127 11,706 54,589
Includes interest rate swaps on which the Bank agreed to pay an interest rate - 3 - - - 3
(1) Except for credit derivatives and spot contracts for foreign currency swaps. (2) Derivatives which constitute part of the Bank’s asset and liability management system, which were not intended as hedges.

132
Note 11 - Derivatives and hedging activities - continued Reported amounts (NIS in millions)
A) Activity on consolidated basis - continued
As of December 31, 2017 (audited)
Interest contracts NIS - CPI
Interest contract
s Other
Currency contracts
Contracts for shares
Commodities and other contracts Total
D. Credit derivatives and spot contracts for foreign currency swaps Credit derivatives in which the Bank is beneficiary - - - - 776 776
Foreign currency spot swap contracts - - 4,909 - - 4,909
Total - - 4,909 - 776 5,685
Total stated amounts of derivatives 9,083 29,949 136,946 32,127 12,528 220,633
2. Fair value, gross, of derivatives A. Hedging derivatives(1) Positive fair value, gross 11 7 - - - 18
Negative fair value, gross 3 58 - - - 61
B. ALM derivatives(1)(2) Positive fair value, gross 304 651 1,964 - 1 2,920
Negative fair value, gross 175 910 1,544 - 1 2,630
C. Other derivatives(1) Positive fair value, gross - - 92 392 - 484
Negative fair value, gross - - 59 330 - 389
D. Credit derivatives Credit derivatives in which the Bank is beneficiary Positive fair value, gross - - - - 5 5
Negative fair value, gross - - - - 2 2
Total Positive fair value, gross(3) 315 658 2,056 392 6 3,427
Fair value amounts offset on the balance sheet - - - - - -
Carrying amount of assets with respect to derivatives 315 658 2,056 392 6 3,427
Of which: Carrying amount of assets with respect to derivatives not subject to a master netting agreement or to similar agreements 140 79 904 227 5 1,355
Total Negative fair value, gross 178 968 1,603 330 3 3,082
Fair value amounts offset on the balance sheet - - - - - -
Carrying amount of liabilities with respect to derivatives 178 968 1,603 330 3 3,082
Of which: Carrying amount of liabilities with respect to derivatives not subject to a master netting agreement or to similar agreements 45 217 982 279 3 1,526
(1) Except for credit derivatives. (2) Derivatives which constitute part of the Bank’s asset and liability management system, which were not intended as hedges. (3) Of which: Positive gross fair value of assets with respect to embedded derivatives amounting to NIS 6 million.

133
Note 11 - Derivatives and hedging activities - continued Reported amounts (NIS in millions)
B) Credit risk on derivatives according to counter-party to the contract - Consolidated
As of March 31, 2018 (unaudited)
Stock exchanges Banks
Dealers/ Brokers
Governments and central
banks Others Total
Carrying amount of assets with respect to derivatives(1) 77 1,470 36 38 1,535 3,156
Gross amounts not offset on the balance sheet: Mitigation of credit risk with respect to financial instruments - (1,171) - - (54) (1,225)
Mitigation of credit risk with respect to cash collateral received - (271) - (16) (247) (534)
Net amount of assets with respect to derivatives 77 28 36 22 1,234 1,397
Off-balance sheet credit risk on derivatives(3) 142 717 196 - 1,303 2,358
Mitigation of off-balance sheet credit risk - (583) - - (24) (607)
Net off-balance sheet credit risk with respect to derivatives 142 134 196 - 1,279 1,751
Total credit risk on derivatives 219 162 232 22 2,513 3,148
Carrying amount of liabilities with respect to derivatives 76 1,625 37 17 905 2,660
Gross amounts not offset on the balance sheet: Financial instruments - (1,171) - - (54) (1,225)
Pledged cash collateral - (454) - - - (454)
Net amount of liabilities with respect to derivatives 76 - 37 17 851 981
As of March 31, 2017 (unaudited)
Stock exchanges Banks
Dealers/ Brokers
Governments and central
banks Others Total
Carrying amount of assets with respect to derivatives(2) 184 2,523 7 17 1,225 3,956
Gross amounts not offset on the balance sheet: Mitigation of credit risk with respect to financial instruments - (1,664) - - (45) (1,709)
Mitigation of credit risk with respect to cash collateral received - (580) - (12) - (592)
Net amount of assets with respect to derivatives 184 279 7 5 1,180 1,655
Off-balance sheet credit risk on derivatives(3) 289 1,021 209 - 1,418 2,937
Mitigation of off-balance sheet credit risk - (494) - - (125) (619)
Net off-balance sheet credit risk with respect to derivatives 289 527 209 - 1,293 2,318
Total credit risk on derivatives 473 806 216 5 2,473 3,973
Carrying amount of liabilities with respect to derivatives 180 2,104 7 - 1,852 4,143
Gross amounts not offset on the balance sheet: Financial instruments - (1,664) - - (45) (1,709)
Pledged cash collateral - (251) - - (11) (262)
Net amount of liabilities with respect to derivatives 180 189 7 - 1,796 2,172
(1) Includes positive fair value, gross, of embedded derivatives amounting to NIS 3 million.
(2) Includes positive fair value, gross, of embedded derivatives amounting to NIS 5 million.
(3) The difference, if positive, between the total amount with respect to derivatives (including with respect to derivatives with negative fair value) included under borrower indebtedness, as calculated for restrictions on indebtedness of a borrower, before mitigation of credit risk, and the carrying amount of assets with respect to derivatives of the borrower.

134
Note 11 - Derivatives and hedging activities - continued Reported amounts (NIS in millions)
B) Credit risk with respect to financial derivatives according to counter-party to the contract - Consolidated - continued
As of December 31, 2017 (audited)
Stock exchanges Banks
Dealers/ Brokers
Governments and central
banks Others Total
Carrying amount of assets with respect to derivatives(1) 86 2,014 14 57 1,256 3,427
Gross amounts not offset on the balance sheet: Mitigation of credit risk with respect to financial instruments - (1,426) - - (40) (1,466)
Mitigation of credit risk with respect to cash collateral received - (520) - (56) (303) (879)
Net amount of assets with respect to derivatives 86 68 14 1 913 1,082
Off-balance sheet credit risk on derivatives(2) 169 1,224 170 - 843 2,406
Mitigation of off-balance sheet credit risk - (468) - - (92) (560)
Net off-balance sheet credit risk with respect to derivatives 169 756 170 - 751 1,846
Total credit risk on derivatives 255 824 184 1 1,664 2,928
Carrying amount of liabilities with respect to derivatives 86 1,760 14 - 1,222 3,082
Gross amounts not offset on the balance sheet:
Financial instruments - (1,426) - - (40) (1,466)
Pledged cash collateral - (281) - - - (281)
Net amount of liabilities with respect to derivatives 86 53 14 - 1,182 1,335
(1) Includes positive fair value, gross, of embedded derivatives amounting to NIS 6 million. (2) The difference, if positive, between the total amount with respect to derivatives (including with respect to derivatives with
negative fair value) included under borrower indebtedness, as calculated for restrictions on indebtedness of a borrower, before mitigation of credit risk, and the carrying amount of assets with respect to derivatives of the borrower.
In the three-month period ended March 31, 2018, the Bank recognized credit losses with respect to
derivatives, amounting to NIS 1 million (in the three-month period ended March 31, 2017 the Bank recognized
credit losses with respect to derivatives amounting to NIS 4 million and in all of 2017, the Bank recognized
revenues from a decrease in credit losses with respect to derivatives amounting to NIS 2 million).

135
Note 11 - Derivatives and hedging activities - continued Reported amounts (NIS in millions)
C) Maturity dates - stated amounts: year-end balances - Consolidated
As of March 31, 2018 (unaudited)
Up to three months
3 months to 1 year 1-5 years
Over 5 years Total
Interest contracts: NIS - CPI 1,473 2,950 2,827 924 8,174
Other 1,695 8,515 14,428 6,752 31,390
Currency contracts 86,927 57,825 9,437 548 154,737
Contracts for shares 24,763 2,699 404 - 27,866
Commodities and other contracts 12,380 248 316 271 13,215
Total 127,238 72,237 27,412 8,495 235,382
As of March 31, 2017 (unaudited)
Up to three
months 3 months to
1 year 1-5 years Over 5 years Total
Interest contracts: NIS - CPI 599 2,274 5,695 897 9,465
Other 2,046 6,171 17,927 8,393 34,537
Currency contracts 97,900 40,650 10,332 1,745 150,627
Contracts for shares 17,828 7,240 95 - 25,163
Commodities and other contracts 13,670 225 297 397 14,589
Total 132,043 56,560 34,346 11,432 234,381
As of December 31, 2017 (audited)
Up to three
months 3 months to
1 year 1-5 years Over 5 years Total
Interest contracts: NIS - CPI 1,438 3,325 3,500 820 9,083
Other 2,263 4,764 15,261 7,661 29,949
Currency contracts 78,476 46,524 10,897 1,049 136,946
Contracts for shares 28,062 3,562 503 - 32,127
Commodities and other contracts 11,737 239 204 348 12,528
Total 121,976 58,414 30,365 9,878 220,633

136
Note 12 - Operating Segments
A. Information regarding supervisory operating segments
On November 3, 2014, the Supervisor of Banks issued an update to the Public Reporting Directives concerning supervisory operating segments. According to the directive, the Bank is required to provide, on its financial statements, disclosure with regard to supervisory operating segments in conformity with a uniform, comparable layout specified by the Supervisor of Banks; attribution to supervisory operating segments is typically determined by the turnover volume for clients.
Financial information in the Report by the Board of Directors and Management is included in conformity with definitions of supervisory operating segments.
In addition, the financial statements include - in Note 12 to the financial statements - disclosure with regard to "Operating segments in conformity with the management approach".
An operating segment in conformity with the management approach is a Bank component with operations which may derive revenues and incur expenses which meet the following criteria:
- Its operating results are regularly reviewed for the purpose of decision making about resource allocation and for performance evaluation.
- Separate financial information is available with regard to it.
In fact, there is a strong correlation between supervisory operating segments and "operating segments in conformity with the management approach" but nevertheless, there are some differences in client attribution to segments and in decision making. Therefore, at this stage, the financial statements also include reporting of operating results in conformity with "the management approach", as noted above.
Supervisory operating segments
Supervisory operating segments include operating segments for individuals and operating segments for other than individuals (including business operating segments, institutional investors and financial management of the Bank).
Individuals are defined as persons with no indebtedness to the Bank or whose indebtedness is classified as indebtedness of "individuals - housing loans and others", in conformity with definitions of credit risk classification by economic sector.
Definitions of supervisory operating segments are as follows:
Households - individuals, other than private banking clients, as noted below.
Private banking - individuals who manage a financial asset portfolio in excess of NIS 3 million.
Small and micro businesses - businesses with turnover amounting up to NIS 50 million.
Medium businesses - businesses with turnover higher than NIS 50 million and lower than NIS 250 million.
Large businesses - businesses with turnover higher than NIS 250 million
Institutional investors - Businesses which own pension funds, study funds, mutual funds, ETFs, insurance companies, stock exchange members, portfolio managers.

137
Note 12 - Operating Segments - continued
Financial management - includes trading operations, asset and liability management and non-banking investments.
Trade operations - Investment in securities held for trade, market making operations for securities, operations involving derivatives not designated as hedges and which are not part of asset and liability management for the Bank, borrowing of securities for trading, short selling of securities, underwriting services for securities.
Asset and liability management - including investment in debentures available for sale and in debentures held to maturity, hedging using derivatives, ALM hedging, deposits with banks and deposits from banks in Israel and overseas, currency hedging of investments overseas, deposits with and from Governments.
Real investments - Investment in shares available for sale and in associated companies of businesses.
Other financial management operations - management, operation, trust and custody services for banks, sale and management of loan portfolios.
The aforementioned operating segments are divided into operations in Israel and operations overseas; operations overseas are presented separately and are divided into operations of individuals and business operations only.

138
Note 12 - Operating Segments - continued Supervisory operating segments For the three months ended March 31, 2018 (unaudited) Reported amounts (NIS in millions)
Operations in Israel
Households Housing
loans
Operations in Israel
Households Others
Operations in Israel
Households Of which:
Credit cards
Operations in Israel
Households Total
Operations in Israel
Private banking
Operations in Israel
Small and micro
businesses
Operations in Israel Medium
businesses
Operations in Israel
Large businesses
Operations in Israel
Institutional investors
Operations in Israel Financial
Management Segment
Operations in Israel
Total activity
in Israel
Operations overseas
Total operations
overseas Total Interest revenues from externals 688 228 9 916 - 243 62 132 11 22 1,386 63 1,449 Interest expenses from externals - 99 - 99 30 16 12 43 66 84 350 18 368 Interest revenues, net from externals 688 129 9 817 (30) 227 50 89 (55) (62) 1,036 45 1,081 Interest revenues, net - inter-segment (331) 179 (1) (152) 46 5 8 39 86 (29) 3 (3) - Total interest revenues, net 357 308 8 665 16 232 58 128 31 (91) 1,039 42 1,081 Total non-interest financing revenues - - - - - - - - - 80 80 10 90 Total commissions and other revenues 41 131 35 172 2 89 18 27 13 46 367 6 373 Total non-interest revenues 41 131 35 172 2 89 18 27 13 126 447 16 463 Total revenues 398 439 43 837 18 321 76 155 44 35 1,486 58 1,544 Expenses with respect to credit losses 6 22 - 28 - 38 4 8 - 1 79 3 82 Operating and other expenses to externals 151 379 12 530 13 171 28 43 30 78 893 19 912 Operating and other expenses - inter-segment - 1 - 1 - (1) 1 - - (1) - - - Total operating and other expenses 151 380 12 531 13 170 29 43 30 77 893 19 912 Pre-tax profit 241 37 31 278 5 113 43 104 14 (43) 514 36 550 Provision for taxes on profit 84 13 11 97 2 39 15 36 5 (15) 179 13 192 After-tax profit 157 24 20 181 3 74 28 68 9 (28) 335 23 358 Share of banking corporation in earnings of associated companies - - - - - - - - - - - - - Net profit before attribution to non-controlling interests 157 24 20 181 3 74 28 68 9 (28) 335 23 358 Net profit attributed to non-controlling interests - (8) (1) (8) - (1) - - - (6) (15) - (15)

139
Operations in Israel
Households Housing
loans
Operations in Israel
Households Others
Operations in Israel
Households Of which:
Credit cards
Operations in Israel
Households Total
Operations in Israel
Private banking
Operations in Israel
Small and micro
businesses
Operations in Israel Medium
businesses
Operations in Israel
Large businesses
Operations in Israel
Institutional investors
Operations in Israel Financial
Management Segment
Operations in Israel
Total activity
in Israel
Operations overseas
Total operations
overseas Total Net profit attributable to shareholders of the banking corporation 157 16 19 173 3 73 28 68 9 (34) 320 23 343 Average balance of assets 121,072 20,000 3,662 141,072 97 17,293 6,229 14,523 1,334 50,561 231,109 8,816 239,925 Of which: Investments in associated companies - - - - - - - - - 32 32 - 32 Average balance of loans to the public 121,072 20,000 3,662 141,072 97 17,293 6,229 14,523 1,334 - 180,548 3,188 183,736 Balance of loans to the public at end of reported period 121,356 20,354 3,743 141,710 100 17,511 5,987 14,913 1,266 - 181,487 3,640 185,127 Balance of impaired debts 38 71 - 109 - 429 76 256 - - 870 - 870 Balance of debt in arrears 90 days or longer 1,086 23 - 1,109 - 35 - - - - 1,144 1 1,145 Average balance of liabilities - 79,233 3,662 79,233 12,009 19,587 7,288 25,581 39,563 34,186 217,447 7,996 225,443 Of which: Average balance of deposits from the public - 75,571 - 75,571 12,009 19,587 7,288 25,581 39,563 - 179,599 5,295 184,894 Balance of deposits from the public at end of reported period - 76,809 - 76,809 12,384 19,514 7,213 25,910 40,045 - 181,875 5,191 187,066 Average balance of risk assets (1) 67,327 17,424 3,168 84,751 37 16,644 7,136 20,229 2,433 6,426 137,656 3,671 141,327 Balance of risk assets at end of reported period(1) 67,731 17,646 3,221 85,377 44 16,946 7,259 19,710 2,576 6,358 138,270 3,859 142,129 Average balance of assets under management(2) 8,366 44,289 - 52,655 2,182 20,589 3,106 26,251 150,107 12,702 267,592 - 267,592
Composition of interest revenues, net: Margin from credit granting operations 345 200 7 545 - 204 Margin from activities of receiving deposits - 106 1 106 16 23 48 109 9 - 915 22 937 Other 12 2 - 14 - 5 9 17 22 - 193 2 195 Total interest revenues, net 357 308 8 665 16 232 1 2 - (91) (69) 18 (51)
(1) Risk assets - as calculated for capital adequacy (Proper Banking Conduct Directive 201). (2) Assets under management - includes clients' provident funds, study funds, mutual funds and securities.
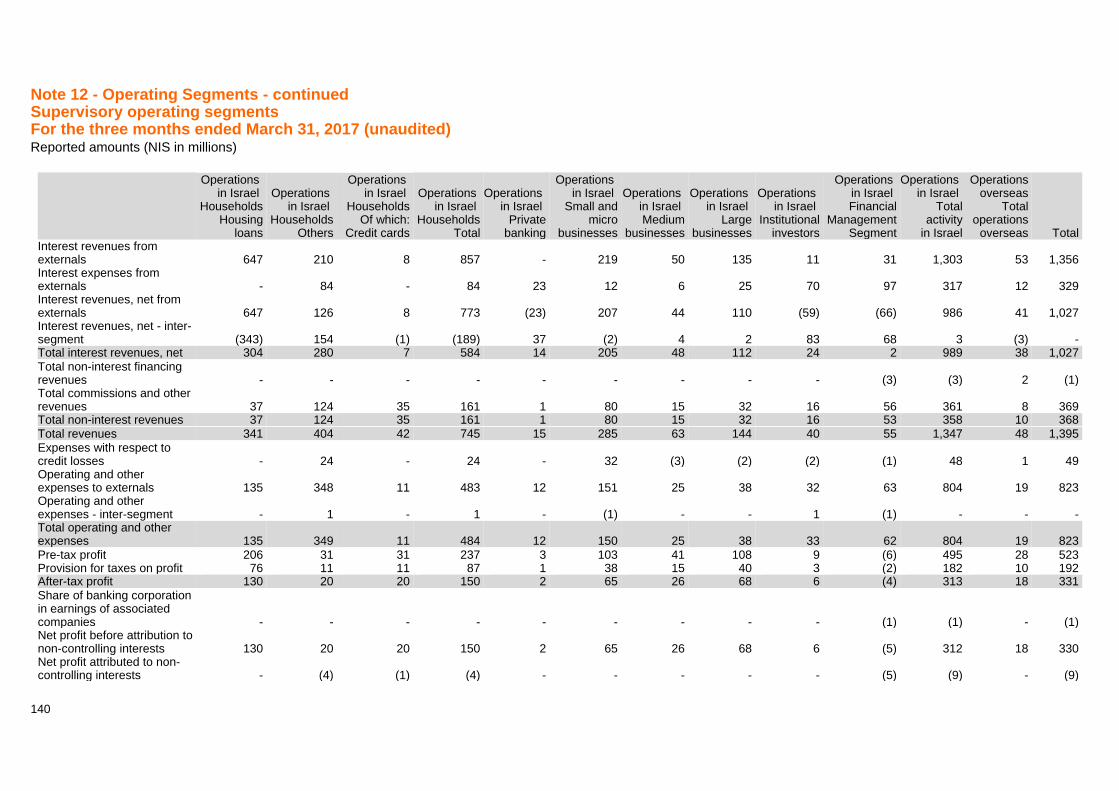
140
Note 12 - Operating Segments - continued Supervisory operating segments For the three months ended March 31, 2017 (unaudited) Reported amounts (NIS in millions)
Operations in Israel
Households Housing
loans
Operations in Israel
Households Others
Operations in Israel
Households Of which:
Credit cards
Operations in Israel
Households Total
Operations in Israel
Private banking
Operations in Israel
Small and micro
businesses
Operations in Israel Medium
businesses
Operations in Israel
Large businesses
Operations in Israel
Institutional investors
Operations in Israel Financial
Management Segment
Operations in Israel
Total activity
in Israel
Operations overseas
Total operations
overseas Total Interest revenues from externals 647 210 8 857 - 219 50 135 11 31 1,303 53 1,356 Interest expenses from externals - 84 - 84 23 12 6 25 70 97 317 12 329 Interest revenues, net from externals 647 126 8 773 (23) 207 44 110 (59) (66) 986 41 1,027 Interest revenues, net - inter-segment (343) 154 (1) (189) 37 (2) 4 2 83 68 3 (3) - Total interest revenues, net 304 280 7 584 14 205 48 112 24 2 989 38 1,027 Total non-interest financing revenues - - - - - - - - - (3) (3) 2 (1) Total commissions and other revenues 37 124 35 161 1 80 15 32 16 56 361 8 369 Total non-interest revenues 37 124 35 161 1 80 15 32 16 53 358 10 368 Total revenues 341 404 42 745 15 285 63 144 40 55 1,347 48 1,395 Expenses with respect to credit losses - 24 - 24 - 32 (3) (2) (2) (1) 48 1 49 Operating and other expenses to externals 135 348 11 483 12 151 25 38 32 63 804 19 823 Operating and other expenses - inter-segment - 1 - 1 - (1) - - 1 (1) - - - Total operating and other expenses 135 349 11 484 12 150 25 38 33 62 804 19 823 Pre-tax profit 206 31 31 237 3 103 41 108 9 (6) 495 28 523 Provision for taxes on profit 76 11 11 87 1 38 15 40 3 (2) 182 10 192 After-tax profit 130 20 20 150 2 65 26 68 6 (4) 313 18 331 Share of banking corporation in earnings of associated companies - - - - - - - - - (1) (1) - (1) Net profit before attribution to non-controlling interests 130 20 20 150 2 65 26 68 6 (5) 312 18 330 Net profit attributed to non-controlling interests - (4) (1) (4) - - - - - (5) (9) - (9)

141
Operations in Israel
Households Housing
loans
Operations in Israel
Households Others
Operations in Israel
Households Of which:
Credit cards
Operations in Israel
Households Total
Operations in Israel
Private banking
Operations in Israel
Small and micro
businesses
Operations in Israel Medium
businesses
Operations in Israel
Large businesses
Operations in Israel
Institutional investors
Operations in Israel Financial
Management Segment
Operations in Israel
Total activity
in Israel
Operations overseas
Total operations
overseas Total Net profit attributable to shareholders of the banking corporation 130 16 19 146 2 65 26 68 6 (10) 303 18 321 Average balance of assets 115,665 18,159 2,817 133,824 72 15,356 4,899 15,347 1,611 47,609 218,718 10,794 229,512 Of which: Investments in associated companies - - - - - - - - - 33 33 - 33 Average balance of loans to the public 115,665 18,159 2,817 133,824 72 15,356 4,899 15,347 1,611 - 171,109 3,080 174,189 Balance of loans to the public at end of reported period 115,996 18,793 3,330 134,789 99 15,894 4,992 14,014 1,581 - 171,369 3,164 174,533 Balance of impaired debts 37 66 - 103 - 304 64 196 - - 667 1 668 Balance of debt in arrears 90 days or longer 900 25 - 925 - 38 12 10 - - 985 - 985 Average balance of liabilities - 74,741 2,817 74,741 11,072 17,022 6,178 29,831 36,895 31,545 207,284 8,722 216,006 Of which: Average balance of deposits from the public - 71,924 - 71,924 11,072 17,022 6,178 29,831 36,895 - 172,922 5,352 178,274 Balance of deposits from the public at end of reported period - 72,500 - 72,500 11,211 17,288 5,890 30,293 38,081 - 175,263 5,459 180,722 Average balance of risk assets (1) 63,684 16,455 3,013 80,139 33 14,680 6,004 20,886 2,518 5,124 129,384 3,459 132,843 Balance of risk assets at end of reported period(1) 64,121 16,537 2,973 80,658 43 14,877 6,088 20,958 2,661 4,972 130,257 3,526 133,783 Average balance of assets under management(2) 6,706 39,408 - 46,114 2,347 15,741 4,298 25,717 146,486 11,520 252,223 - 252,223
Composition of interest revenues, net: Margin from credit granting operations 296 185 7 481 - 184 40 95 8 - 808 26 834 Margin from activities of receiving deposits - 93 - 93 14 18 6 15 15 - 161 3 164 Other 8 2 - 10 - 3 2 2 1 2 20 9 29 Total interest revenues, net 304 280 7 584 14 205 48 112 24 2 989 38 1,027
(1) Risk assets - as calculated for capital adequacy (Proper Banking Conduct Directive 201).
(2) Assets under management - includes clients' provident funds, study funds, mutual funds and securities.
(3) Reclassified .This reclassification is primarily due to Bank Yahav operations, mainly presented under the Household segment. After reclassification, Bank Yahav operations are also presented under Financial
Management.

142
Note 12 - Operating Segments - continued Supervisory operating segments For the year ended December 31, 2017 (audited) Reported amounts (NIS in millions)
−
−
Operations in Israel
Households Housing
loans
Operations in Israel
Households Others
Operations in Israel
Households Of which:
Credit cards
Operations in Israel
Households Total
Operations in Israel
Private banking
Operations in Israel
Small and micro
businesses
Operations in Israel Medium
businesses
Operations in Israel
Large businesses
Operations in Israel
Institutional investors
Operations in Israel Financial
Management Segment
Operations in Israel
Total activity
in Israel
Operations overseas
Total operations
overseas Total Interest revenues from externals 3,294 861 33 4,155 2 904 222 506 42 158 5,989 233 6,222 Interest expenses from externals - 461 - 461 124 65 26 159 340 645 1,820 55 1,875 Interest revenues, net from externals 3,294 400 33 3,694 (122) 839 196 347 (298) (487) 4,169 178 4,347 Interest revenues, net - inter-segment (1,983) 743 (5) (1,240) 181 56 10 117 410 482 16 (16) - Total interest revenues, net 1,311 1,143 28 2,454 59 895 206 464 112 (5) 4,185 162 4,347 Total non-interest financing revenues - - - - - - - (1) (1) 131 129 7 136 Total commissions and other revenues 145 502 145 647 10 335 76 134 44 (3)242 1,488 29 1,517 Total non-interest revenues 145 502 145 647 10 335 76 133 43 373 1,617 36 1,653 Total revenues 1,456 1,645 173 3,101 69 1,230 282 597 155 368 5,802 198 6,000 Expenses with respect to credit losses 24 122 - 146 1 149 7 (89) (22) (1) 191 1 192 Operating and other expenses to externals 600 1,503 45 2,103 52 662 104 168 125 326 3,540 71 3,611 Operating and other expenses - inter-segment - 3 - 3 1 (3) 2 2 - (5) - - - Total operating and other expenses 600 1,506 45 2,106 53 659 106 170 125 321 3,540 71 3,611 Pre-tax profit 832 17 128 849 15 422 169 516 52 48 2,071 126 2,197 Provision for taxes on profit 305 6 47 311 6 155 62 189 19 18 760 46 806 After-tax profit 527 11 81 538 9 267 107 327 33 30 1,311 80 1,391 Share of banking corporation in earnings of associated companies - - - - - - - - - - - - - Net profit before attribution to non-controlling interests 527 11 81 538 9 267 107 327 33 30 1,311 80 1,391 Net profit attributed to non-controlling interests - (21) (3) (21) - (1) - - - (22) (44) - (44)

143
Operations in Israel
Households Housing
loans
Operations in Israel
Households Others
Operations in Israel
Households Of which:
Credit cards
Operations in Israel
Households Total
Operations in Israel
Private banking
Operations in Israel
Small and micro
businesses
Operations in Israel Medium
businesses
Operations in Israel
Large businesses
Operations in Israel
Institutional investors
Operations in Israel Financial
Management Segment
Operations in Israel
Total activity
in Israel
Operations overseas
Total operations
overseas Total Net profit attributable to shareholders of the banking corporation 527 (10) 78 517 9 266 107 327 33 8 1,267 80 1,347 Average balance of assets 118,042 18,866 3,415 136,908 86 16,190 5,704 14,642 1,413 49,529 224,472 10,140 234,612 Of which: Investments in associated companies - - - - - - - - - 33 33 - 33 Average balance of loans to the public 118,042 18,866 3,415 136,908 86 16,190 5,704 14,642 1,413 - 174,943 3,031 177,974 Balance of loans to the public at end of reported period 120,186 20,059 3,611 140,245 121 17,045 5,854 15,011 1,175 - 179,451 3,151 182,602 Balance of impaired debts 33 70 - 103 - 396 64 160 - - 723 - 723 Balance of debt in arrears 90 days or longer 1,071 22 - 1,093 - 42 - - - - 1,135 1 1,136 Average balance of liabilities - 76,920 3,415 76,920 11,563 18,284 6,470 27,864 38,748 32,221 212,070 8,694 220,764 Of which: Average balance of deposits from the public - 73,505 - 73,505 11,563 18,284 6,470 27,864 38,748 - 176,434 5,102 181,536 Balance of deposits from the public at end of reported period - 75,008 - 75,008 12,448 18,942 7,138 26,284 38,881 - 178,701 4,872 183,573 Average balance of risk assets (1) 65,085 16,675 3,051 81,760 28 15,484 6,484 20,887 2,334 5,872 132,849 3,495 136,344 Balance of risk assets at end of reported period(1) 66,921 17,202 3,115 84,123 31 16,344 7,014 20,747 2,290 6,493 137,042 3,482 140,524 Average balance of assets under management(2) 7,080 42,450 - 49,530 2,367 18,184 3,432 26,700 147,742 12,174 260,129 - 260,129
Composition of interest revenues, net: Margin from credit granting operations 1,268 744 28 2,012 1 786 176 393 34 - 3,402 93 3,495 Margin from activities of receiving deposits - 396 - 396 58 84 25 60 76 - 699 12 711 Other 43 3 - 46 - 25 5 11 2 (5) 84 57 141 Total interest revenues, net 1,311 1,143 28 2,454 59 895 206 464 112 (5) 4,185 162 4,347
(1) Risk assets - as calculated for capital adequacy (Proper Banking Conduct Directive 201). (2) Assets under management - includes clients' provident funds, study funds, mutual funds and securities. (3) Includes capital gains under Other Revenues amounting to NIS 47 million before tax, from realization of assets in conjunction with asset reorganization and streamlining of the Bank's branch network.

144
Note 12 - Operating Segments - continued
B. Operating segments in conformity with the management approach
The Bank manages its operations in six major operating segments, which are distinguished by client characteristics and type of banking services required, as well as by the organizational unit responsible for servicing each segment. Operating segment definition is based on the Bank’s organizational structure, as described below. The operations in the six operating segments include all areas of banking operations including classic banking activity (loans and deposits), securities activity for clients and activity in derivatives, as well as custom banking services designed for needs in specific fields. Operations of the various segments are conducted via Bank branches, trading room, Business Centers, Bank HQ departments and subsidiaries in Israel and overseas.
For more information about measurement of Bank operations in conformity with the supervisory segments approach, as specified by the Supervisor of Banks, see chapter "Supervisory operating segments" above.
Below are the Bank's operating segments in conformity with the management approach:
Household segment - under responsibility of the Retail Division, This segment includes small household clients and mortgage operations. The division provides appropriate banking services and financial products to segment clients, including in the field of mortgages.
Small business segment - under responsibility of the Retail Division, which also serves small business clients, having an indebtedness level of less than NIS 6 million, sales of less than NIS 30 million and liquid asset balance of less than NIS 10 million. Banking services and financial products, including commercial banking services as required, are provided to segment clients.
Private banking - private banking is under responsibility of the Private Banking and International Operations sector of the Finance Division. Private banking sector clients are individual clients with liquid assets (primarily short-term deposits and security investments) over NIS 1 million. Clients of this segment have high financial wealth, to whom the Bank offers access to unique products and services in capital market activity, advisory service and investment management.
Commercial banking - clients of this segment are private and public companies of medium size (middle market) and medium level of indebtedness, and are served by the Business Banking Division, primarily by the Business sector, which operates via six business centers located throughout Israel. Business customers are assigned to the Business sector primarily using the following criteria: total indebtedness of NIS 6-25 million, sales of NIS 30-120 million or liquid assets of NIS 10-40 million. Segment clients operating in the real estate sector are served by the Construction and Real Estate sector of the Business Division, which specializes in provision of dedicated services to this sector.
Business banking - the Major Corporations sector in the Business Division is responsible for the Business Banking segment, which is the focal point for handling the largest business clients. Criteria by which clients are assigned to the Corporate sector include: total indebtedness over NIS 25 million, sales over NIS 120 million or liquid assets over NIS 40 million. This segment provides a range of banking and financial services to the largest companies in the economy, in an array of industries, at relatively high levels of indebtedness. Segment clients operating in the real estate sector are served by the Construction and Real Estate sector of the Business Division, which specializes in provision of dedicated services to this sector.
Financial management - operations in this segment include, inter alia, management of assets and liabilities, management of exposure to market risk, management of the nostro portfolio and liquidity management as well as trading room operations in the financial and capital markets. The segment is under responsibility of the Finance Division, except for investments in non-banking corporations, which are under the responsibility of the business division.
The major products and guidelines for attribution of balances, revenues and expenses to clients in the system to operating segments in conformity with the management approach, are similar to products and guidelines according to the supervisory operating segment approach.

145
Note 12 - Operating Segments - continued Operating segments in conformity with the management approach. For the three months ended March 31, 2018 (unaudited) Reported amounts (NIS in millions)
House-holds -
other Households - mortgages
Private banking
Small businesses
Commercial banking
Business banking
Financial manage-
ment
Total consoli-
dated
Interest revenues, net: From outside operating segments 160 629 (2) 156 45 170 (77) 1,081
Inter-segment 206 (319) 21 25 4 71 (8) -
Total interest revenues, net 366 310 19 181 49 241 (85) 1,081
Non-interest financing revenues 1 - - - - 11 78 90
Commissions and other revenues 131 39 15 74 12 49 53 373
Total revenues 498 349 34 255 61 301 46 1,544
Expenses with respect to credit losses 19 6 - 40 (3) 18 2 82
Operating and other expenses 395 144 22 144 35 86 86 912
Pre-tax profit 84 199 12 71 29 197 (42) 550
Provision for taxes on profit 29 69 4 25 10 69 (14) 192
After-tax profit 55 130 8 46 19 128 (28) 358
Share in net profits of associated companies, after tax - - - - - - - -
Net profit: Before attribution to non-controlling interests 55 130 8 46 19 128 (28) 358
Attributable to non-controlling interests (8) - - (1) - - (6) (15)
Net profit attributable to shareholders of the Bank 47 130 8 45 19 128 (34) 343
Return on equity (percentage of net profit attributed to shareholders of the banking corporation out of average equity)(1) 11.6% 8.2% 63.3% 18.1% 13.3% 16.6% - 10.3%
Average balance of loans to the public, net 24,178 115,956 1,003 12,101 5,213 23,776 - 182,227
Average balance of deposits from the public 82,857 - 8,023 18,703 6,617 59,248 9,446 184,894
Average balance of assets 25,472 116,108 1,632 12,230 5,253 27,855 51,375 239,925
Average balance of risk assets (2) 20,590 64,520 604 10,628 5,881 32,259 6,845 141,327
(1) Calculated in conformity with capital attributed to this segment based on risk elements attributed there to in conformity with provisions of Basel III.
(2) Risk weighted assets - as calculated for capital adequacy (Proper Banking Conduct Directive No. 201).

146
Note 12 - Operating Segments - continued Operating segments in conformity with the management approach. For the three months ended March 31, 2017 (unaudited) Reported amounts (NIS in millions)
House-holds - other(3)
Households - mortgages
Private banking
Small businesses
Commercial banking
Business banking
Financial manage-
ment
Total consoli-
dated
Interest revenues, net: From outside operating segments 209 593 (4) 145 39 148 (103) 1,027
Inter-segment 122 (331) 22 15 3 51 118 -
Total interest revenues, net 331 262 18 160 42 199 15 1,027
Non-interest financing revenues 1 - - - - 6 (8) (1)
Commissions and other revenues 127 36 15 70 12 57 52 369
Total revenues 459 298 33 230 54 262 59 1,395
Expenses with respect to credit losses 22 - - 32 - (4) (1) 49
Operating and other expenses 364 130 23 131 31 79 65 823
Pre-tax profit 73 168 10 67 23 187 (5) 523
Provision for taxes on profit 27 62 4 25 8 69 (3) 192
After-tax profit 46 106 6 42 15 118 (2) 331
Share in net profits of associated companies, after tax - - - - - - (1) (1)
Net profit: Before attribution to non-controlling interests 46 106 6 42 15 118 (3) 330
Attributable to non-controlling interests (4) - - - - - (5) (9)
Net profit attributable to shareholders of the Bank 42 106 6 42 15 118 (8) 321
Return on equity (percentage of net profit attributed to shareholders of the banking corporation out of average equity)(1) 10.8% 7.0% 37.3% 18.7% 12.4% 15.7% - 10.4%
Average balance of loans to the public, net 22,371 110,936 865 11,111 4,543 23,013 - 172,839
Average balance of deposits from the public 77,855 - 7,967 17,274 6,195 58,913 10,070 178,274
Average balance of assets 23,129 111,211 1,546 11,247 4,595 28,850 48,934 229,512
Average balance of risk assets(2) 19,298 61,114 719 9,479 4,993 31,447 5,793 132,843
(1) Calculated in conformity with capital attributed to this segment based on risk elements attributed there to in conformity with provisions of Basel III.
(2) Risk weighted assets - as calculated for capital adequacy (Proper Banking Conduct Directive No. 201). (3) Reclassified .This reclassification is primarily due to Bank Yahav operations, mainly presented under the Household segment.
After reclassification, Bank Yahav operations are also presented under Financial Management.
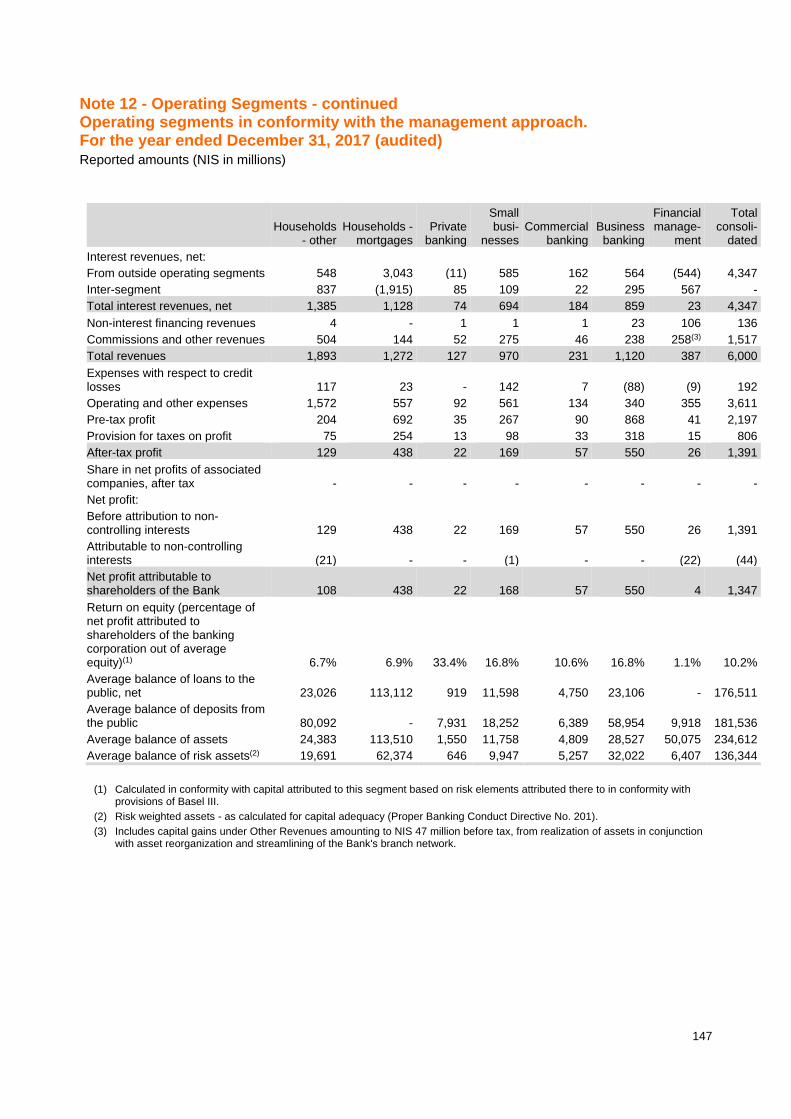
147
Note 12 - Operating Segments - continued Operating segments in conformity with the management approach. For the year ended December 31, 2017 (audited) Reported amounts (NIS in millions)
Households - other
Households - mortgages
Private banking
Small busi-
nesses Commercial
banking Business banking
Financial manage-
ment
Total consoli-
dated
Interest revenues, net: From outside operating segments 548 3,043 (11) 585 162 564 (544) 4,347
Inter-segment 837 (1,915) 85 109 22 295 567 -
Total interest revenues, net 1,385 1,128 74 694 184 859 23 4,347
Non-interest financing revenues 4 - 1 1 1 23 106 136
Commissions and other revenues 504 144 52 275 46 238 258(3) 1,517
Total revenues 1,893 1,272 127 970 231 1,120 387 6,000
Expenses with respect to credit losses 117 23 - 142 7 (88) (9) 192
Operating and other expenses 1,572 557 92 561 134 340 355 3,611
Pre-tax profit 204 692 35 267 90 868 41 2,197
Provision for taxes on profit 75 254 13 98 33 318 15 806
After-tax profit 129 438 22 169 57 550 26 1,391
Share in net profits of associated companies, after tax - - - - - - - -
Net profit: Before attribution to non-controlling interests 129 438 22 169 57 550 26 1,391
Attributable to non-controlling interests (21) - - (1) - - (22) (44)
Net profit attributable to shareholders of the Bank 108 438 22 168 57 550 4 1,347
Return on equity (percentage of net profit attributed to shareholders of the banking corporation out of average equity)(1) 6.7% 6.9% 33.4% 16.8% 10.6% 16.8% 1.1% 10.2%
Average balance of loans to the public, net 23,026 113,112 919 11,598 4,750 23,106 - 176,511
Average balance of deposits from the public 80,092 - 7,931 18,252 6,389 58,954 9,918 181,536
Average balance of assets 24,383 113,510 1,550 11,758 4,809 28,527 50,075 234,612
Average balance of risk assets(2) 19,691 62,374 646 9,947 5,257 32,022 6,407 136,344
(1) Calculated in conformity with capital attributed to this segment based on risk elements attributed there to in conformity with provisions of Basel III.
(2) Risk weighted assets - as calculated for capital adequacy (Proper Banking Conduct Directive No. 201). (3) Includes capital gains under Other Revenues amounting to NIS 47 million before tax, from realization of assets in conjunction
with asset reorganization and streamlining of the Bank's branch network.

148
Note 12 - Operating Segments - continued
C. Effect of attribution of expenses related to the US DOJ inquiry on operating segments
Had the expenses related to the US DOJ inquiry been attributed to the private banking segment and to overseas operations (rather than to the financial management segment, as attributed by the Bank), according to the supervisory approach, the results of the private banking segment for the first quarter of 2018 would have amounted to a loss of NIS 2 million. Results of the private banking segment for the first quarter of 2017 would have amounted to a loss of NIS 7 million.
Results of the private banking segment according to the supervisory approach for 2017 would have amounted to a loss of NIS 11 million.
Results of the financial management segment according to the supervisory approach for the first quarter of 2018 would have amounted to a loss of NIS 29 million. Results of the financial management segment for the first quarter of 2017 would have amounted to a loss of NIS 1 million.
Results of the financial management segment according to the supervisory approach for 2017 would have amounted to income of NIS 28 million.
Results of overseas operations according to the supervisory approach would have been unchanged in the first quarter of 2018 and 2017 and for all of 2017.
According to the management approach, results of the private banking segment for the first quarter of 2018 would have amounted to a profit of NIS 3 million. Results of the private banking segment for the first quarter of 2017 would have amounted to a loss of NIS 3 million.
Results of the private banking segment according to the management approach for 2017 would have amounted to income amounting to NIS 2 million.
Results of the financial management segment according to the management approach for the first quarter of 2018 would have amounted to a loss of NIS 29 million. Results of the financial management segment for the first quarter of 2017 would have amounted to a profit of NIS 1 million.
Results of the financial management segment according to the management approach for 2017 would have amounted to income amounting to NIS 24 million.

149
Note 13 - Additional information about credit risk, loans to the public and provision for credit losses
Reported amounts (NIS in millions)
A. Off balance sheet debts(1) and credit instruments
1. Change in balance of provision for credit losses
For the three months ended March 31, 2018 (unaudited) - Provision for credit losses
Loans to the public
Commercial
Loans to the public
Housing
Loans to the public
Individual - other
Loans to the public
Total Banks and
governments Total
Balance of provision for credit losses at start of period 699 630 245 1,574 1 1,575
Expenses with respect to credit losses 53 6 22 81 1 82
Net accounting write-off(2) (61) (1) (35) (97) - (97)
Recovery of debts written off in previous years(2) 20 - 17 37 - 37
Net accounting write-offs (41) (1) (18) (60) - (60)
Balance of provision for credit losses at end of period 711 635 249 1,595 2 1,597
Of which: With respect to off balance sheet credit instruments 87 - 9 96 - 96
For the three months ended March 31, 2017 (unaudited) - Provision for credit losses
Loans to the public
Commercial
Loans to the public
Housing
Loans to the public
Individual - other
Loans to the public
Total Banks and
governments Total
Balance of provision for credit losses at start of period 724 615 208 1,547 2 1,549
Expenses with respect to credit losses 26 - 24 50 (1) 49
Net accounting write-off(2) (37) (3) (30) (70) - (70)
Recovery of debts written off in previous years(2) 17 - 14 31 - 31
Net accounting write-offs (20) (3) (16) (39) - (39)
Balance of provision for credit losses at end of period 730 612 216 1,558 1 1,559
Of which: With respect to off balance sheet credit instruments 85 - 8 93 - 93
(1) Loans to the public, loans to governments, deposits with banks and other debts, except for debentures and securities borrowed or acquired in conjunction with resale agreements, except for deposits with Bank of Israel.
(2) Net accounting write-offs presented in the Note primarily consists of write-offs of a technical nature, due to passage of time of clients being in arrears, in conformity with US standards applicable to the Bank in this regard. Thus, for example, the balance of provision for large impaired debt s will typically be subject to accounting write-off after two years. Debt measured on a group basis will be subject to write-off after 150 days in arrears. This means that the Bank's collection effort may sometimes take longer than the timing for write-off according to accounting rules. Consequently, relatively high balances of "accounting write-offs" and relatively high balances of "Recovery of debts written off in previous years" are presented.

150
Note 13 - Additional information about credit risk, loans to the public and provision for credit losses - continued
Reported amounts (NIS in millions)
A. Off balance sheet debts(1) and credit instruments 2. Additional information about calculation of the provision for credit losses with respect to debts, and debts for which the provision has been calculated:
As of March 31, 2018 (unaudited)
Loans to the public
Commercial
Loans to the public
Housing
Loans to the public
Individual - other
Loans to the public
Total Banks and
governments Total Recorded debt balance of debts(1) reviewed on individual basis 34,116 38 718 34,872 3,249 38,121 reviewed on group basis 10,015 121,685 18,555 150,255 - 150,255 Of which: the provision for credit losses is assessed by extent of arrears 1,386 121,685 - 123,071 - 123,071 Total debts 44,131 (2)121,723 19,273 185,127 3,249 188,376
Provision for credit losses with respect to debts(1) reviewed on individual basis 499 4 28 531 2 533 reviewed on group basis 125 631 212 968 - 968 Of which: Loans for which a provision for credit losses is assessed by extent of arrears(3) 5 631 - 636 - 636 Total provision for credit losses 624 635 240 1,499 2 1,501
As of March 31, 2017 (unaudited)
Loans to the public
Commercial
Loans to the public
Housing
Loans to the public
Individual - other
Loans to the public
Total Banks and
governments Total Recorded debt balance of debts(1) reviewed on individual basis 29,964 36 (4)623 30,623 3,087 33,710 reviewed on group basis (4)10,245 116,304 (4)17,361 143,910 - 143,910 Of which: the provision for credit losses is assessed by extent of arrears 1,053 115,650 - 116,703 - 116,703
Total debts 40,209 (2)116,340 17,984 174,533 3,087 177,620
Provision for credit losses with respect to debts(1) reviewed on individual basis 537 2 20 559 1 560 reviewed on group basis 108 610 188 906 - 906 Of which: Loans for which a provision for credit losses is assessed by extent of arrears(3) 5 610 - 615 - 615
Total provision for credit losses 645 612 208 1,465 1 1,466
As of December 31, 2017 (audited)
Loans to the public
Commercial
Loans to the public
Housing
Loans to the public
Individual - other
Loans to the public
Total Banks and
governments Total
Recorded debt balance of debts(1) reviewed on individual basis 33,392 33 (4)655 34,080 2,543 36,623
reviewed on group basis 9,605 120,514 (4)18,403 148,522 - 148,522 Of which: the provision for credit losses is assessed by extent of arrears 1,265 120,514 - 121,779 - 121,779
Total debts 42,997 (2)120,547 19,058 182,602 2,543 185,145
Provision for credit losses with respect to debts(1) reviewed on individual basis 499 2 24 525 1 526
reviewed on group basis 119 628 212 959 - 959 Of which: Loans for which a provision for credit losses is assessed by extent of arrears(3) 5 628 - 633 - 633
Total provision for credit losses 618 630 236 1,484 1 1,485
(1) Loans to the public, loans to governments, deposits with banks and other debts, except for debentures and securities borrowed or acquired in conjunction with resale agreements, except for deposits with Bank of Israel.
(2) Includes general-purpose loans secured by a lien on a residential apartment, amounting to NIS 6,484 million (as of March 31, 2017: NIS 5,844 million and as of December 31, 2017: NIS 6,291 million).
(3) Includes balance of provision in excess of that required by extent of arrears, assessed on individual basis, amounting to NIS 17 million (as of March 31, 2017: NIS 16 million, as of December 31, 2017: NIS 16 million), and assessed on group basis, amounting to NIS 425 million (as of March 31, 2017: NIS 406 million, as of December 31, 2017: NIS 421 million).
(4) Reclassified.

151
Note 13 - Additional information about credit risk, loans to the public and provision for credit losses - continued
Reported amounts (NIS in millions)
B. Debts(1)
1.A. Credit quality and arrears
As of March 31, 2018 (unaudited)
Non
problematic
Problematic(2)
Non impaired
Problematic(2)
Impaired(3) Total
Non impaired
debts -
additional
information
In arrears 90
days or longer(4)
Non impaired
debts -
additional
information
In arrears 30 to
89 days(5)
Borrower activity in Israel Public - commercial Construction and real estate - construction(8) 12,545 60 163 12,768 7 18
Construction and real estate - real estate operations 2,298 4 17 2,319 - 4
Financial services 3,385 161 14 3,560 - 10
Commercial - other 21,062 353 564 21,979 28 88
Total commercial 39,290 578 758 40,626 35 120
Private individuals - housing loans 120,232 (7)1,086 38 121,356 (7)1,086 (6)393
Private individuals - other 18,798 144 71 19,013 23 79
Total public - activity in Israel 178,320 1,808 867 180,995 1,144 592
Banks in Israel 233 - - 233 - -
Government of Israel - - - - - -
Total activity in Israel 178,553 1,808 867 181,228 1,144 592
Borrower activity overseas Public - commercial Construction and real estate 1,943 - - 1,943 - -
Commercial - other 1,559 - 3 1,562 - -
Total commercial 3,502 - 3 3,505 - -
Private individuals 626 1 - 627 1 -
Total public - activity overseas 4,128 1 3 4,132 1 -
Overseas banks 2,523 - - 2,523 - -
Overseas governments 493 - - 493 - -
Total activity overseas 7,144 1 3 7,148 1 -
Total public 182,448 1,809 870 185,127 1,145 592
Total banks 2,756 - - 2,756 - -
Total governments 493 - - 493 - -
Total 185,697 1,809 870 188,376 1,145 592
(1) Loans to the public, loans to governments, deposits with banks and other debts, except for debentures and securities borrowed or acquired in conjunction with resale agreements, except for deposits with Bank of Israel.
(2) Credit risk which is impaired, inferior or under special supervision, including with respect to housing loans for which a provision was made by extent of arrears, and housing loans for which no provision was made by extent of arrears and which are in arrears of 90 days or longer.
(3) Generally, impaired debts do not accrue interest revenues. For information about certain impaired debts restructured using problematic debt restructuring, see Note 13.B.2.c. to the financial statements.
(4) Classified as problematic non-impaired debts. Accruing interest revenues. (5) Accruing interest revenues. Debts in arrears 30 to 89 days amounting to NIS 65 million were classified as problematic non-
impaired debts. (6) In conformity with Public Reporting Directives, excludes the balance of housing loans in arrears up to 2 months. (7) Includes balance of housing loans amounting to NIS 98 million provided for by extent of arrears of borrower, for which an
agreement has been signed for repayment of arrears by the borrower, where a change was made to the repayment schedule for the outstanding loan balance not yet due.
(8) Includes debts amounting to NIS 1,683 million, extended to certain purchase groups which are in the process of construction.

152
Note 13 - Additional information about credit risk, loans to the public and provision for credit losses - continued
Reported amounts (NIS in millions)
B. Debts(1)
1.A. Credit quality and arrears - continued
As of March 31, 2017 (unaudited)
Non
problematic
Problematic(2)
Non impaired
Problematic(2)
Impaired(3) Total
Non impaired
debts -
additional
information
In arrears 90
days or longer(4)
Non impaired
debts -
additional
information
In arrears 30 to
89 days(5)
Borrower activity in Israel Public - commercial Construction and real estate - construction(8) 10,402 43 92 10,537 13 23
Construction and real estate - real estate operations 1,921 7 70 1,998 - 6
Financial services (9)3,118 309 17 (9)3,444 - 3
Commercial - other 20,276 512 383 21,171 48 96
Total commercial 35,717 871 562 37,150 61 128
Private individuals - housing loans 115,060 (7)900 36 115,996 (7)900 (6)373
Private individuals - other (9)17,543 113 66 (9)17,722 24 97
Total public - activity in Israel 168,320 1,884 664 170,868 985 598
Banks in Israel 262 - - 262 - -
Government of Israel 1 - - 1 - -
Total activity in Israel 168,583 1,884 664 171,131 985 598
Borrower activity overseas Public - commercial Construction and real estate 1,583 - 1 1,584 - -
Commercial - other 1,472 - 3 1,475 - 1
Total commercial 3,055 - 4 3,059 - 1
Private individuals 606 - - 606 - -
Total public - activity overseas 3,661 - 4 3,665 - 1
Overseas banks 2,513 - - 2,513 - -
Overseas governments 311 - - 311 - -
Total activity overseas 6,485 - 4 6,489 - 1
Total public 171,981 1,884 668 174,533 985 599
Total banks 2,775 - - 2,775 - -
Total governments 312 - - 312 - -
Total 175,068 1,884 668 177,620 985 599
(1) Loans to the public, loans to governments, deposits with banks and other debts, except for debentures and securities borrowed or acquired in conjunction with resale agreements, except for deposits with Bank of Israel.
(2) Credit risk which is impaired, inferior or under special supervision, including with respect to housing loans for which a provision was made by extent of arrears, and housing loans for which no provision was made by extent of arrears and which are in arrears of 90 days or longer.
(3) Generally, impaired debts do not accrue interest revenues. For information about certain impaired debt restructured using problematic debt restructuring, see Note 13.B.2.c. to the financial statements.
(4) Classified as problematic non-impaired debts. Accruing interest revenues.
(5) Accruing interest revenues. Debts in arrears 30 to 89 days amounting to NIS 38 million were classified as problematic non-impaired debts.
(6) In conformity with Public Reporting Directives, excludes the balance of housing loans in arrears up to 2 months.
(7) Includes balance of housing loans amounting to NIS 126 million provided for by extent of arrears of borrower, for which an agreement has been signed for repayment of arrears by the borrower, where a change was made to the repayment schedule for the outstanding loan balance not yet due.
(8) Includes debts amounting to NIS 1,374 million, extended to certain purchase groups which are in the process of construction.
(9) Reclassified.

153
Note 13 - Additional information about credit risk, loans to the public and provision for credit losses - continued
Reported amounts (NIS in millions)
B. Debts(1)
1.A. Credit quality and arrears - continued
As of December 31, 2017 (audited)
Non
problematic Problematic(2) Non impaired
Problematic(2) Impaired(3) Total
Non impaired debts -
additional information
In arrears 90 days or
longer(4)
Non impaired debts -
additional information
In arrears 30 to 89 days(5)
Borrower activity in Israel Public - commercial Construction and real estate - construction(8) 12,310 72 145 12,527 8 36
Construction and real estate - real estate operations 2,245 5 15 2,265 1 13
Financial services 3,191 187 15 3,393 - 2
Commercial - other 20,676 331 442 21,449 33 89
Total commercial 38,422 595 617 39,634 42 140
Private individuals - housing loans 119,085 (7)1,071 33 120,189 (7)1,071 (6)390
Private individuals - other 18,595 147 70 18,812 22 73
Total public - activity in Israel 176,102 1,813 720 178,635 1,135 603
Banks in Israel 213 - - 213 - -
Government of Israel 1 - - 1 - -
Total activity in Israel 176,316 1,813 720 178,849 1,135 603
Borrower activity overseas Public - commercial Construction and real estate 1,849 - - 1,849 - -
Commercial - other 1,511 - 3 1,514 - -
Total commercial 3,360 - 3 3,363 - -
Private individuals 603 1 - 604 1 -
Total public - activity overseas 3,963 1 3 3,967 1 -
Overseas banks 1,874 - - 1,874 - -
Overseas governments 455 - - 455 - -
Total activity overseas 6,292 1 3 6,296 1 -
Total public 180,065 1,814 723 182,602 1,136 603
Total banks 2,087 - - 2,087 - -
Total governments 456 - - 456 - -
Total 182,608 1,814 723 185,145 1,136 603
(1) Loans to the public, loans to governments, deposits with banks and other debts, except for debentures and securities borrowed or acquired in conjunction with resale agreements, except for deposits with Bank of Israel.
(2) Credit risk which is impaired, inferior or under special supervision, including with respect to housing loans for which a provision was made by extent of arrears, and housing loans for which no provision was made by extent of arrears and which are in arrears of 90 days or longer.
(3) Generally, impaired debts do not accrue interest revenues. For information about certain impaired debt restructured using problematic debt restructuring, see Note 13.B.2.c. to the financial statements.
(4) Classified as problematic non-impaired debts. Accruing interest revenues.
(5) Accruing interest revenues. Debts in arrears 30 to 89 days amounting to NIS 63 million were classified as problematic non-impaired debts.
(6) In conformity with Public Reporting Directives, excludes the balance of housing loans in arrears up to 2 months.
(7) Includes balance of housing loans amounting to NIS 102 million provided for by extent of arrears of borrower, for which an agreement has been signed for repayment of arrears by the borrower, where a change was made to the repayment schedule for the outstanding loan balance not yet due.
(8) Includes debts amounting to NIS 1,571 million, extended to certain purchase groups which are in the process of construction.

154
Note 13 - Additional information about credit risk, loans to the public and provision for credit losses - continued
Reported amounts (NIS in millions)
1. B. Credit quality
The state of debts arrears is monitored daily and automatically, providing one of the key indications of credit quality. The state of arrears, and consequently classification of the debt, are based, inter alia, on the actual number of days in arrears for each debt.
Non-performing debts
Debt measured on individual basis is classified as non-performing (not accruing interest revenues) after 90 days in arrears. Debt previously restructured as problematic debt and which is again in arrears with regard to the new terms thereof - is also classified as non-performing. Debt measured on group basis is classified as non-performing (inferior) after 150 days in arrears. At that time, accounting write-off of the debt is also carried out.
Inferior debts
Debt in the individual track is classified as inferior debt accruing revenues after 60 days in arrears. Debt in the group track is classified as inferior after 90 days in arrears.
Housing loans
The state of arrears for housing loans is monitored by the extent of arrears for the loan, except for loans with no monthly or quarterly payment.
Credit risk attributes, including specific risk for housing loans, are included on the Report of the Board of Directors and Management under "Risks Overview".
Below is the recorded debt balance by credit quality and by credit segment of the Bank:
As of March 31, 2018 (unaudited) - Credit segment
Debt quality Commercial Housing Individuals Governments Banks Total
Debts in good standing 42,792 120,598 19,058 493 2,756 185,697
Problematic non-impaired debts(1) 578 1,087 144 - - 1,809
Impaired debts 761 38 71 - - 870
Total 44,131 121,723 19,273 493 2,756 188,376
As of March 31, 2017 (unaudited) - Credit segment
Debt quality Commercial Housing Individuals Governments Banks Total
Debts in good standing (2)38,772 115,404 (2)17,805 312 2,775 175,068
Problematic non-impaired debts(1) 871 900 113 - - 1,884
Impaired debts 566 36 66 - - 668
Total 40,209 116,340 17,984 312 2,775 177,620
As of December 31, 2017 (audited) - Credit segment
Debt quality Commercial Housing Individuals Governments Banks Total
Debts in good standing 41,782 119,442 18,841 456 2,087 182,608
Problematic non-impaired debts(1) 595 1,072 147 - - 1,814
Impaired debts 620 33 70 - - 723
Total 42,997 120,547 19,058 456 2,087 185,145
(1) Balance sheet credit risk which is inferior or under special supervision, including with respect to housing loans for which a provision was made by extent of arrears, and housing loans for which no provision was made by extent of arrears and which are in arrears of 90 days or longer.
(2) Reclassified.

155
Note 13 - Additional information about credit risk, loans to the public and provision for credit losses - continued
Reported amounts (NIS in millions)
B. Debts(1)
2. Additional information about impaired debts
A. Impaired debts and individual provision
As of March 31, 2018 (unaudited)
Balance of impaired debts
for which an individual
provision has been made(2)(3)
Balance of individual provision
Balance of impaired debts
for which no individual
provision has been made(2)
Total balance of impaired
debts(2)
Contractual principal
balance of impaired
debts
Borrower activity in Israel Public - commercial Construction and real estate - construction 67 20 96 163 234
Construction and real estate - real estate operations 9 2 8 17 49
Financial services 6 5 8 14 24
Commercial - other 318 95 246 564 657
Total commercial 400 122 358 758 964
Private individuals - housing loans 24 4 14 38 38
Private individuals - other 26 16 45 71 90
Total public - activity in Israel 450 142 417 867 1,092
Banks in Israel - - - - -
Government of Israel - - - - -
Total activity in Israel 450 142 417 867 1,092
Borrower activity overseas Public - commercial Construction and real estate - - - - 4
Commercial - other 3 - - 3 4
Total commercial 3 - - 3 8
Private individuals - - - - 3
Total public - activity overseas 3 - - 3 11
Overseas banks - - - - -
Overseas governments - - - - -
Total activity overseas 3 - - 3 11
Total public 453 142 417 870 1,103
Total banks - - - - -
Total governments - - - - -
Total 453 142 417 870 1,103
Of which: Measured at present value of cash flows 440 142 320 760 Debts under problematic debts restructuring 125 21 71 196
(1) Loans to the public, loans to governments, deposits with banks and other debts, except for debentures and securities borrowed or acquired in conjunction with resale agreements, except for deposits with Bank of Israel.
(2) Recorded debt balance. (3) Debt balance net of accounting write-off, if made.

156
Note 13 - Additional information about credit risk, loans to the public and provision for credit losses - continued
Reported amounts (NIS in millions)
B. Debts(1)
2. Additional information about impaired debts
A. Impaired debts and individual provision - continued
As of March 31, 2017 (unaudited)
Balance of impaired debts
for which an individual
provision has been made(2)(3)
Balance of individual provision
Balance of impaired debts
for which no individual
provision has been made(2)
Total balance of
impaired debts(2)
Contractual principal
balance of impaired
debts
Borrower activity in Israel Public - commercial Construction and real estate - construction 61 14 31 92 176
Construction and real estate - real estate operations 52 - 18 70 237
Financial services 9 6 8 17 35
Commercial - other 271 115 112 383 474
Total commercial 393 135 169 562 922
Private individuals - housing loans 16 2 20 36 36
Private individuals - other 21 13 45 66 69
Total public - activity in Israel 430 150 234 664 1,027
Banks in Israel - - - - -
Government of Israel - - - - -
Total activity in Israel 430 150 234 664 1,027
Borrower activity overseas Public - commercial Construction and real estate 1 - - 1 1
Commercial - other 3 - - 3 3
Total commercial 4 - - 4 4
Private individuals - - - - -
Total public - activity overseas 4 - - 4 4
Overseas banks - - - - -
Overseas governments - - - - -
Total activity overseas 4 - - 4 4
Total public 434 150 234 668 1,031
Total banks - - - - -
Total governments - - - - -
Total 434 150 234 668 1,031
Of which: Measured at present value of cash flows 401 150 188 589 Debts under problematic debts restructuring 121 10 28 149
(1) Loans to the public, loans to governments, deposits with banks and other debts, except for debentures and securities borrowed or acquired in conjunction with resale agreements, except for deposits with Bank of Israel.
(2) Recorded debt balance. (3) Debt balance net of accounting write-off, if made.

157
Note 13 - Additional information about credit risk, loans to the public and provision for credit losses - continued
Reported amounts (NIS in millions)
B. Debts(1)
2. Additional information about impaired debts
A. Impaired debts and individual provision - continued
As of December 31, 2017 (audited)
Balance of impaired debts
for which an individual
provision has been made(2)(3)
Balance of individual provision
Balance of impaired debts
for which no individual
provision has been made(2)
Total balance of
impaired debts(2)
Contractual principal
balance of impaired
debts
Borrower activity in Israel Public - commercial Construction and real estate - construction 73 19 72 145 223
Construction and real estate - real estate operations 9 1 6 15 47
Financial services 6 5 9 15 26
Commercial - other 297 94 145 442 481
Total commercial 385 119 232 617 777
Private individuals - housing loans 15 2 18 33 33
Private individuals - other 24 15 46 70 83
Total public - activity in Israel 424 136 296 720 893
Banks in Israel - - - - -
Government of Israel - - - - -
Total activity in Israel 424 136 296 720 893
Borrower activity overseas Public - commercial Construction and real estate - - - - 3
Commercial - other 3 - - 3 3
Total commercial 3 - - 3 6
Private individuals - - - - 3
Total public - activity overseas 3 - - 3 9
Overseas banks - - - - -
Overseas governments - - - - -
Total activity overseas 3 - - 3 9
Total public 427 136 296 723 902
Total banks - - - - -
Total governments - - - - -
Total 427 136 296 723 902
Of which: Measured at present value of cash flows 418 136 227 645 Debts under problematic debts restructuring 69 17 86 155
(1) Loans to the public, loans to governments, deposits with banks and other debts, except for debentures and securities borrowed or acquired in conjunction with resale agreements, except for deposits with Bank of Israel.
(2) Recorded debt balance. (3) Debt balance net of accounting write-off, if made.

158
Note 13 - Additional information about credit risk, loans to the public and provision for credit losses - continued
Reported amounts (NIS in millions)
B. Debts(1)
2. Additional information about impaired debts
B. Average balance and interest revenues(4)
For the three months ended
As of March 31, 2018
(unaudited)
Average balance of
impaired debts(2)
For the three months ended
As of March 31, 2018
(unaudited)
Interest revenues
recorded(3)
For the three months ended
As of March 31, 2018
(unaudited)
Of which: Recorded on
cash basis
For the three months ended
As of March 31, 2017
(unaudited)
Average balance of
impaired debts(2)
For the three months ended
As of March 31, 2017
(unaudited)
Interest revenues
recorded(3)
For the three months ended
As of March 31, 2017
(unaudited)
Of which: Recorded on
cash basis
Borrower activity in Israel
Public - commercial Construction and real estate - construction 154 1 1 99 - -
Construction and real estate - real estate operations 16 - - 74 - -
Financial services 15 - - 17 - -
Commercial - other 503 1 1 382 2 2
Total commercial 688 2 2 572 2 2
Private individuals - housing loans 36 - - 32 - -
Private individuals - other 71 1 1 68 1 1
Total public - activity in Israel 795 3 3 672 3 3
Banks in Israel - - - - - -
Government of Israel - - - - - -
Total activity in Israel 795 3 3 672 3 3
Borrower activity overseas
Public - commercial
Construction and real estate - - - 1 - -
Commercial - other 3 - - 3 - -
Total commercial 3 - - 4 - -
Private individuals - - - - - -
Total public - activity overseas 3 - - 4 - -
Overseas banks - - - - - -
Overseas governments - - - - - -
Total activity overseas 3 - - 4 - -
Total public 798 3 3 676 3 3
Total banks - - - - - -
Total governments - - - - - -
Total(4) 798 3 3 676 3 3
(1) Loans to the public, loans to governments, deposits with banks and other debts, except for debentures and securities borrowed or acquired in conjunction with resale agreements, except for deposits with Bank of Israel.
(2) Average recorded debt balance of impaired debts during reported period. (3) Interest revenues recorded in the reported period with respect to average balance of debts in arrears, in the period in which the
debts were classified as impaired. (4) Had the impaired debt s accrued interest at the original terms, the Bank would have recognized interest revenues amounting to
NIS 18 million (as of March 31, 2017 - NIS 16 million).

159
Note 13 - Additional information about credit risk, loans to the public and provision for credit losses - continued
Reported amounts (NIS in millions)
B. Debts(1)
2. Additional information about impaired debts
C. Problematic debts under restructuring
As of March 31, 2018 (unaudited) - Recorded debt balance
Not accruing interest
revenues
Accruing interest
revenues(2) in arrears
90 days or longer
Accruing interest
revenues(2), in arrears
30-89 days
Accruing interest
revenues(2) not in arrears Total(3)
Borrower activity in Israel Public - commercial Construction and real estate - construction 34 - - - 34
Construction and real estate - real estate operations 2 - - - 2
Financial services 3 - - - 3
Commercial - other 96 - - 3 99
Total commercial 135 - - 3 138
Private individuals - housing loans - - - - -
Private individuals - other 34 - 1 23 58
Total public - activity in Israel 169 - 1 26 196
Banks in Israel - - - - -
Government of Israel - - - - -
Total activity in Israel 169 - 1 26 196
Borrower activity overseas Public - commercial Construction and real estate - - - - -
Commercial - other - - - - -
Total commercial - - - - -
Private individuals - - - - -
Total public - activity overseas - - - - -
Overseas banks - - - - -
Overseas governments - - - - -
Total activity overseas - - - - -
Total public 169 - 1 26 196
Total banks - - - - -
Total governments - - - - -
Total 169 - 1 26 196
(1) Loans to the public, loans to governments, deposits with banks and other debts, except for debentures and securities borrowed or acquired in conjunction with resale agreements, except for deposits with Bank of Israel.
(2) Accruing interest revenues.
(3) Included under impaired debts.
As of March 31, 2018, the Bank had no commitments to provide additional credit to debtors subject to problematic debt restructuring, for which credit terms have been revised.

160
Note 13 - Additional information about credit risk, loans to the public and provision for credit losses - continued
Reported amounts (NIS in millions)
B. Debts(1)
2. Additional information about impaired debts
C. Problematic debts under restructuring - continued
As of March 31, 2017 (unaudited) - Recorded debt balance
Not accruing interest
revenues
Accruing interest
revenues(2) in arrears
90 days or longer
Accruing interest
revenues(2), in arrears
30-89 days
Accruing interest
revenues(2) not in arrears Total(3)
Borrower activity in Israel
Public - commercial
Construction and real estate - construction 13 - - - 13
Construction and real estate - real estate operations 48 - 1 - 49
Financial services 3 - - - 3
Commercial - other 31 - - 6 37
Total commercial 95 - 1 6 102
Private individuals - housing loans - - - - -
Private individuals - other 23 - 1 23 47
Total public - activity in Israel 118 - 2 29 149
Banks in Israel - - - - -
Government of Israel - - - - -
Total activity in Israel 118 - 2 29 149
Borrower activity overseas
Public - commercial
Construction and real estate - - - - -
Commercial - other - - - - -
Total commercial - - - - -
Private individuals - - - - -
Total public - activity overseas - - - - -
Overseas banks - - - - -
Overseas governments - - - - -
Total activity overseas - - - - -
Total public 118 - 2 29 149
Total banks - - - - -
Total governments - - - - -
Total 118 - 2 29 149
(1) Loans to the public, loans to governments, deposits with banks and other debts, except for debentures and securities borrowed or acquired in conjunction with resale agreements, except for deposits with Bank of Israel.
(2) Accruing interest revenues. (3) Included under impaired debts.

161
Note 13 - Additional information about credit risk, loans to the public and provision for credit losses - continued
Reported amounts (NIS in millions)
B. Debts(1)
2. Additional information about impaired debts
C. Problematic debts under restructuring - continued
As of December 31, 2017 (audited) - Recorded debt balance
Not accruing interest
revenues
Accruing interest
revenues(2) in arrears
90 days or longer
Accruing interest
revenues(2), in arrears
30-89 days
Accruing interest
revenues(2) not in arrears Total(3)
Borrower activity in Israel Public - commercial Construction and real estate - construction 15 - - - 15
Construction and real estate - real estate operations 2 - - - 2
Financial services 3 - - - 3
Commercial - other 81 - - 4 85
Total commercial 101 - - 4 105
Private individuals - housing loans - - - - -
Private individuals - other 28 - 1 21 50
Total public - activity in Israel 129 - 1 25 155
Banks in Israel - - - - -
Government of Israel - - - - -
Total activity in Israel 129 - 1 25 155
Borrower activity overseas Public - commercial Construction and real estate - - - - -
Commercial - other - - - - -
Total commercial - - - - -
Private individuals - - - - -
Total public - activity overseas - - - - -
Overseas banks - - - - -
Overseas governments - - - - -
Total activity overseas - - - - -
Total public 129 - 1 25 155
Total banks - - - - -
Total governments - - - - -
Total 129 - 1 25 155
(1) Loans to the public, loans to governments, deposits with banks and other debts, except for debentures and securities borrowed or acquired in conjunction with resale agreements, except for deposits with Bank of Israel.
(2) Accruing interest revenues. (3) Included under impaired debts.

162
Note 13 - Additional information about credit risk, loans to the public and provision for credit losses - continued
Reported amounts (NIS in millions)
B. Debts(1)
2. Additional information about impaired debts
C. Problematic debts under restructuring - continued
Restructurings made(2) For the three months ended
As of March 31, 2018
(unaudited)
Number of contracts
As of March 31, 2018
(unaudited)
Recorded debt balance
before restructuring
As of March 31, 2018
(unaudited)
Recorded debt balance
after restructuring
As of March 31, 2017
(unaudited)
Number of contracts
As of March 31, 2017
(unaudited)
Recorded debt balance
before restructuring
As of March 31, 2017
(unaudited)
Recorded debt balance
after restructuring
Borrower activity in Israel Public - commercial Construction and real estate - construction 14 21 21 9 1 1
Construction and real estate - real estate operations 5 1 1 2 - -
Financial services 1 - - 1 - -
Commercial - other 85 25 25 42 4 4
Total commercial 105 47 47 54 5 5
Private individuals - housing loans - - - - - -
Private individuals - other 269 17 16 199 9 9
Total public - activity in Israel 374 64 63 253 14 14
Banks in Israel - - - - - -
Government of Israel - - - - - -
Total activity in Israel 374 64 63 253 14 14
Borrower activity overseas Public - commercial Construction and real estate - - - - - -
Commercial - other - - - - - -
Total commercial - - - - - -
Private individuals - - - - - -
Total public - activity overseas - - - - - -
Overseas banks - - - - - -
Overseas governments - - - - - -
Total activity overseas - - - - - -
Total public 374 64 63 253 14 14
Total banks - - - - - -
Total governments - - - - - -
Total 374 64 63 253 14 14
(1) Loans to the public, loans to governments, deposits with banks and other debts, except for debentures and securities borrowed or acquired in conjunction with resale agreements, except for deposits with Bank of Israel.
(2) Included under impaired debts.

163
Note 13 - Additional information about credit risk, loans to the public and provision for credit losses - continued
Reported amounts (NIS in millions)
B. Debts(1)
2. Additional information about impaired debts
C. Problematic debts under restructuring - continued
Restructurings made which are in default(2) For the three months ended - Recorded debt balance
As of March 31, 2018 (unaudited)
Number of contracts
As of March 31, 2018 (unaudited)
Recorded debt balance
As of March 31, 2017 (unaudited)
Number of contracts
As of March 31, 2017 (unaudited)
Recorded debt balance
Borrower activity in Israel Public - commercial Construction and real estate - construction 2 - 5 -
Construction and real estate - real estate operations 2 - - -
Financial services 1 - - -
Commercial - other 20 4 8 -
Total commercial 25 4 13 -
Private individuals - housing loans - - - -
Private individuals - other 39 1 36 1
Total public - activity in Israel 64 5 49 1
Banks in Israel - - - -
Government of Israel - - - -
Total activity in Israel 64 5 49 1
Borrower activity overseas Public - commercial Construction and real estate - - - -
Commercial - other - - - -
Total commercial - - - -
Private individuals - - - -
Total public - activity overseas - - - -
Overseas banks - - - -
Overseas governments - - - -
Total activity overseas - - - -
Total public 64 5 49 1
Total banks - - - -
Total governments - - - -
Total 64 5 49 1
(1) Loans to the public, loans to governments, deposits with banks and other debts, except for debentures and securities borrowed or acquired in conjunction with resale agreements, except for deposits with Bank of Israel.
(2) Debts which became, in the reported period, debts in arrears of 30 days or longer, which were restructured under problematic debt restructuring in the 12 months prior to the date on which they became debts in arrears

164
Note 13 - Additional information about credit risk, loans to the public and provision for credit losses - continued
Reported amounts (NIS in millions)
B. Debts(1)
3. Additional information about housing loans
Below is the composition of balances by loan-to-value ratio (LTV)(1), repayment type and interest type:
As of March 31, 2018 (unaudited)
Housing loan balance
Housing loan balance
Total Of which:
Bullet / balloon Of which:
Variable interest
Off-balance sheet credit risk
Total
Senior lien: LTV ratio Up to 60% 78,874 2,944 50,880 3,668
Over 60% 42,600 524 27,835 1,602
Junior lien or no lien 249 2 184 4,715
Total 121,723 3,470 78,899 9,985
As of March 31, 2017 (unaudited)
Housing loan balance
Housing loan balance
Total Of which:
Bullet / balloon Of which:
Variable interest
Off-balance sheet credit risk
Total
Senior lien: LTV ratio Up to 60% 73,612 2,644 47,454 3,772
Over 60% 42,512 464 28,059 1,455
Junior lien or no lien 216 3 159 1,247
Total 116,340 3,111 75,672 6,474
As of December 31, 2017 (audited)
Housing loan balance
Housing loan balance
Total Of which:
Bullet / balloon Of which:
Variable interest
Off-balance sheet credit risk
Total
Senior lien: LTV ratio Up to 60% 77,785 2,905 50,100 3,702
Over 60% 42,511 516 27,835 1,459
Junior lien or no lien 251 2 185 1,554
Total 120,547 3,423 78,120 6,715
(1) Ratio of approved facility upon extending the facility to the property value, as approved by the Bank upon extending the facility

165
Note 13 - Additional information about credit risk, loans to the public and provision for credit losses - continued
Reported amounts (NIS in millions)
C. Information about purchase and sale of debts
For the three
months ended
March 31, 2018
(unaudited)
Commercial
For the three
months ended
March 31, 2018
(unaudited)
Housing
For the three
months ended
March 31, 2018
(unaudited)
Other
For the three
months ended
March 31, 2018
(unaudited)
Total
For the three
months ended
March 31, 2017
(unaudited)
Commercial
For the three
months ended
March 31, 2017
(unaudited)
Housing
For the three
months ended
March 31, 2017
(unaudited)
Other
For the three
months ended
March 31, 2017
(unaudited)
Total
For the year ended
December 31, 2017 (audited)
Commercial
For the year ended
December 31, 2017 (audited)
Housing
For the year ended
December 31, 2017 (audited)
Other
For the year ended
December 31, 2017 (audited)
Total
Loans acquired 114 - 139 253 90 - 128 218 109 - 593 702
Loans sold 86 732 - 818 160 730 - 890 290 2,308 - 2,598
D. Off-balance sheet financial instruments
Contractual balances or their denominated amounts at end of quarter
March 31,
2018
Balance(1)
(unaudited)
March 31,
2017
Balance(1)
(unaudited)
December 31,
2017
Balance(1)
(audited)
March 31,
2018
Provision for credit losses
(unaudited)
March 31,
2017
Provision for credit losses
(unaudited)
December 31,
2017
Provision for credit losses
(audited)
Transactions in which the balance represents a credit risk:
- Unutilized debitory account and other credit facilities in accounts available on demand 16,527 17,922 15,045 21 20 20
- Guarantees to home buyers(3) 11,211 12,318 10,795 7 8 6
- Irrevocable commitments for loans approved but not yet granted (4)16,207 11,501 12,044 12 14 12
- Unutilized revolving credit card facilities 6,914 7,579 6,801 4 4 4
- Commitments to issue guarantees(3) 5,928 6,499 5,981 4 4 4
- Other guarantees and liabilities(2)(3) 6,216 5,153 5,677 26 23 23
- Loan guarantees(3) 2,336 2,048 2,283 21 19 20
- Documentary credit 257 389 201 1 1 1
(1) Contractual balances or their stated amounts at the end of the period, before effect of provision for credit losses. (2) Includes the Bank's liabilities for its share in the risks fund of the MAOF Clearinghouse of NIS 34 million. (as of March 31, 2017
and December 31, 2017 - NIS 59 million and NIS 38 million, respectively). For more information see Note 26.C.2. and Note 27.B. to Financial Statements as of December 31, 2017. (3) The Bank provides guarantees to improve the credit and transaction capacity of its clients. The term to maturity of guarantees to home buyers is typically up to three years. With respect to these guarantees and to commitment to issue such guarantees, the Bank has acquired a credit exposure
insurance policy. The insurance policy covers 80% of the guarantees and is effective as from December 31, 2016. The term to maturity of other guarantees, performance guarantees and credit backing guarantees is typically up to one year. (4) Includes the effect of extension of the lock period for approval in principle of housing loans, from 12 days to 24 days, in
conformity with the revision of Proper Conduct of Banking Business Regulation 451 "Procedures for extending housing loans".
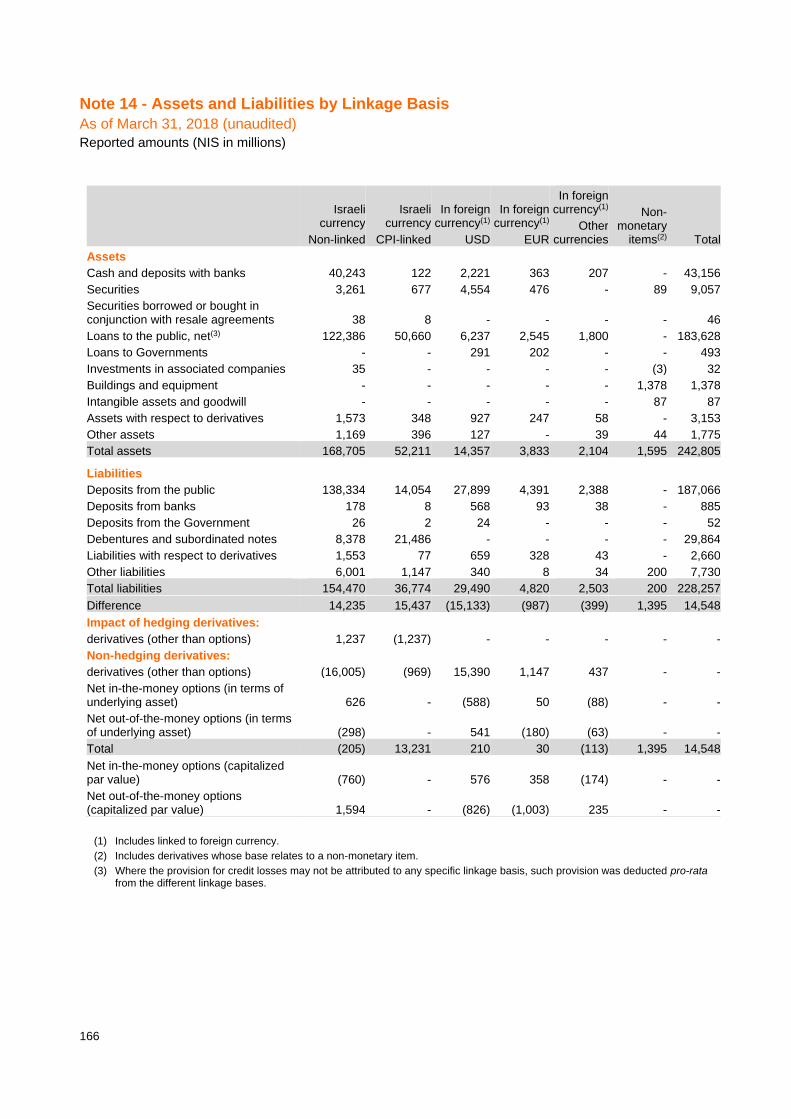
166
Note 14 - Assets and Liabilities by Linkage Basis
As of March 31, 2018 (unaudited)
Reported amounts (NIS in millions)
Israeli currency
Non-linked
Israeli currency
CPI-linked
In foreign currency(1)
USD
In foreign currency(1)
EUR
In foreign currency(1)
Other currencies
Non-monetary
items(2) Total
Assets Cash and deposits with banks 40,243 122 2,221 363 207 - 43,156
Securities 3,261 677 4,554 476 - 89 9,057
Securities borrowed or bought in conjunction with resale agreements 38 8 - - - - 46
Loans to the public, net(3) 122,386 50,660 6,237 2,545 1,800 - 183,628
Loans to Governments - - 291 202 - - 493
Investments in associated companies 35 - - - - (3) 32
Buildings and equipment - - - - - 1,378 1,378
Intangible assets and goodwill - - - - - 87 87
Assets with respect to derivatives 1,573 348 927 247 58 - 3,153
Other assets 1,169 396 127 - 39 44 1,775
Total assets 168,705 52,211 14,357 3,833 2,104 1,595 242,805
Liabilities Deposits from the public 138,334 14,054 27,899 4,391 2,388 - 187,066
Deposits from banks 178 8 568 93 38 - 885
Deposits from the Government 26 2 24 - - - 52
Debentures and subordinated notes 8,378 21,486 - - - - 29,864
Liabilities with respect to derivatives 1,553 77 659 328 43 - 2,660
Other liabilities 6,001 1,147 340 8 34 200 7,730
Total liabilities 154,470 36,774 29,490 4,820 2,503 200 228,257
Difference 14,235 15,437 (15,133) (987) (399) 1,395 14,548
Impact of hedging derivatives: derivatives (other than options) 1,237 (1,237) - - - - -
Non-hedging derivatives: derivatives (other than options) (16,005) (969) 15,390 1,147 437 - -
Net in-the-money options (in terms of underlying asset) 626 - (588) 50 (88) - -
Net out-of-the-money options (in terms of underlying asset) (298) - 541 (180) (63) - -
Total (205) 13,231 210 30 (113) 1,395 14,548
Net in-the-money options (capitalized par value) (760) - 576 358 (174) - -
Net out-of-the-money options (capitalized par value) 1,594 - (826) (1,003) 235 - -
(1) Includes linked to foreign currency. (2) Includes derivatives whose base relates to a non-monetary item. (3) Where the provision for credit losses may not be attributed to any specific linkage basis, such provision was deducted pro-rata
from the different linkage bases.

167
Note 14 - Assets and Liabilities by Linkage Basis - Continued
As of March 31, 2017 (unaudited)
Reported amounts (NIS in millions)
Israeli currency
Non-linked
Israeli currency
CPI-linked
In foreign currency(1)
USD
In foreign currency(1
)
EUR
In foreign currency(1)
Other currencies
Non-monetary
items(2) Total
Assets Cash and deposits with banks 38,681 121 2,450 182 249 - 41,683
Securities 5,993 773 4,417 515 - 93 11,791
Securities borrowed or bought in conjunction with resale agreements 40 6 - - - - 46
Loans to the public, net(3) 113,615 49,387 6,614 1,802 1,650 - 173,068
Loans to Governments - - 132 180 - - 312
Investments in associated companies 35 - - - - (2) 33
Buildings and equipment - - - - - 1,550 1,550
Intangible assets and goodwill - - - - - 87 87
Assets with respect to derivatives 3,083 348 389 93 38 - 3,951
Other assets 1,003 405 66 15 16 45 1,550
Total assets 162,450 51,040 14,068 2,787 1,953 1,773 234,071
Liabilities Deposits from the public 127,550 17,538 28,208 4,897 2,529 - 180,722
Deposits from banks 251 17 1,118 63 25 - 1,474
Deposits from the Government 26 3 27 - - - 56
Debentures and subordinated notes 5,690 21,234 - - - - 26,924
Liabilities with respect to derivatives 3,328 159 487 140 29 - 4,143
Other liabilities 5,633 1,013 254 11 40 167 7,118
Total liabilities 142,478 39,964 30,094 5,111 2,623 167 220,437
Difference 19,972 11,076 (16,026) (2,324) (670) 1,606 13,634
Impact of hedging derivatives: derivatives (other than options) 1,612 (1,612) - - - - -
Non-hedging derivatives: derivatives (other than options) (16,581) (2,436) 16,284 2,149 584 - -
Net in-the-money options (in terms of underlying asset) 22 - (247) 265 (40) - -
Net out-of-the-money options (in terms of underlying asset) (36) - 123 (94) 7 - -
Total 4,989 7,028 134 (4) (119) 1,606 13,634
Net in-the-money options (capitalized par value) (471) - (304) 802 (27) - -
Net out-of-the-money options (capitalized par value) 1,130 - (655) (442) (33) - -
Reported amounts (NIS in millions)
(1) Includes linked to foreign currency. (2) Includes derivatives whose base relates to a non-monetary item. (3) Where the provision for credit losses may not be attributed to any specific linkage basis, such provision was deducted pro-rata
from the different linkage bases.

168
Note 14 - Assets and Liabilities by Linkage Basis - Continued
As of December 31, 2017 (audited)
Reported amounts (NIS in millions)
Israeli currency
Non-linked
Israeli currency
CPI-linked
In foreign currency(1)
USD
In foreign currency(1)
EUR
In foreign currency(1)
Other currencies
Non-monetary
items(2) Total
Assets
Cash and deposits with banks 38,800 122 1,689 299 220 - 41,130
Securities 3,859 753 4,993 429 - 99 10,133
Securities borrowed or bought in conjunction with resale agreements 68 8 - - - - 76
Loans to the public, net(3) 120,730 50,293 6,220 2,240 1,635 - 181,118
Loans to Governments - - 257 199 - - 456
Investments in associated companies 28 7 - - - (3) 32
Buildings and equipment - - - - - 1,403 1,403
Intangible assets and goodwill - - - - - 87 87
Assets with respect to derivatives 2,551 402 268 145 55 - 3,421
Other assets 1,167 423 50 - 33 43 1,716
Total assets 167,203 52,008 13,477 3,312 1,943 1,629 239,572
Liabilities
Deposits from the public 133,194 15,681 27,805 4,556 2,337 - 183,573
Deposits from banks 291 10 754 70 - - 1,125
Deposits from the Government 25 2 24 - - - 51
Debentures and subordinated notes 8,321 21,602 - - - - 29,923
Liabilities with respect to derivatives 2,315 130 420 179 38 - 3,082
Other liabilities 5,841 1,165 253 11 38 183 7,491
Total liabilities 149,987 38,590 29,256 4,816 2,413 183 225,245
Difference 17,216 13,418 (15,779) (1,504) (470) 1,446 14,327
Impact of hedging derivatives:
derivatives (other than options) 1,489 (1,489) - - - - -
Non-hedging derivatives:
derivatives (other than options) (15,974) (2,133) 16,069 1,513 525 - -
Net in-the-money options (in terms of underlying asset) 427 - (278) (65) (84) - -
Net out-of-the-money options (in terms of underlying asset) (106) - 133 7 (34) - -
Total 3,052 9,796 145 (49) (63) 1,446 14,327
Net in-the-money options (capitalized par value) (32) - (232) 281 (17) - -
Net out-of-the-money options (capitalized par value) 356 - 110 (604) 138 - -
(1) Includes linked to foreign currency. (2) Includes derivatives whose base relates to a non-monetary item. (3) Where the provision for credit losses may not be attributed to any specific linkage basis, such provision was deducted pro-rata
from the different linkage bases.

169
Note 15 - Balances and estimates of fair value of financial instruments
Reported amounts (NIS in millions)
1) Information on the fair value of financial instruments is presented below:
A. Fair value balances
As of March 31, 2018 (unaudited)
Book balance
Fair value
Level 1(1)
Fair value
Level 2(1)
Fair value
Level 3(1)
Fair value
Total
Financial assets Cash and deposits with banks 43,156 7,517 34,465 1,174 43,156
Securities(3) 9,057 5,519 3,515 87 9,121
Securities loaned or purchased in resale agreements 46 46 - - 46
Loans to the public, net 183,628 502 9,996 (5)173,124 183,622
Loans to Governments 493 - - 493 493
Investments in associated companies 35 - - 35 35
Assets with respect to derivatives 3,153 171 1,837 (2)1,145 3,153
Other financial assets 665 11 - 654 665
Total financial assets 240,233 13,766 49,813 176,712 240,291
Financial liabilities Deposits from the public 187,066 502 50,631 138,029 189,162
Deposits from banks 885 - 517 368 885
Deposits from the Government 52 - - 54 54
Debentures and subordinated notes 29,864 29,293 - 1,662 30,955
Liabilities with respect to derivatives 2,660 170 1,688 (2)802 2,660
Other financial liabilities 6,039 481 4,133 1,425 6,039
Total financial liabilities (4)226,566 30,446 56,969 142,340 229,755
(1) Level 1 - Fair value measurement using quoted prices on an active market. Level 2 - Fair value measurements using other significant observed data.
Level 3 - Fair value measurements using significant non-observed data.
(2) Fair value measurement is primarily based on use of observed data (market interest rate curves), except for credit quality of counter parties.
(3) For more information about the carrying amount and fair value of securities, see Note 5 to the financial statements.
(4) Includes assets and liabilities amounting to NIS 61,011 million and NIS 52,981 million, respectively, whose carrying amount equals their fair value (instruments presented at fair value on the balance sheet). For more information on instruments measured at fair value on recurring basis and on non-recurring basis, see B.-D. below.
(5) Of which embedded derivatives in loans to the public, net amounting to NIS 3 million.

170
Note 15 - Balances and estimates of fair value of financial instruments - continued
Reported amounts (NIS in millions)
A. Fair value balances - continued
As of March 31, 2017 (unaudited)
Book balance
Fair value
Level 1(1)
Fair value
Level 2(1)
Fair value
Level 3(1)
Fair value
Total
Financial assets Cash and deposits with banks 41,683 6,838 33,610 1,258 41,706
Securities(3) 11,791 8,517 3,259 91 11,867
Securities loaned or purchased in resale agreements 46 46 - - 46
Loans to the public, net 173,068 400 10,323 (5)161,778 172,501
Loans to Governments 312 - - 304 304
Investments in associated companies 35 - - 35 35
Assets with respect to derivatives 3,951 274 2,646 (2)1,031 3,951
Other financial assets 470 121 - 349 470
Total financial assets 231,356 16,196 49,838 164,846 230,880
Financial liabilities Deposits from the public 180,722 400 44,668 137,633 182,701
Deposits from banks 1,474 - 363 1,176 1,539
Deposits from the Government 56 - - 61 61
Debentures and subordinated notes 26,924 26,069 - 1,582 27,651
Liabilities with respect to derivatives 4,143 260 2,446 (2)1,437 4,143
Other financial liabilities 5,339 508 3,995 836 5,339
Total financial liabilities (4)218,658 27,237 51,472 142,725 221,434
(1) Level 1 - Fair value measurement using quoted prices on an active market. Level 2 - Fair value measurements using other significant observed data.
Level 3 - Fair value measurements using significant non-observed data.
(2) Fair value measurement is primarily based on use of observed data (market interest rate curves), except for credit quality of counter parties.
(3) For more information about the carrying amount and fair value of securities, see Note 5 to the financial statements.
(4) Includes assets and liabilities amounting to NIS 61,862 million and NIS 49,072 million, respectively, whose carrying amount equals their fair value (instruments presented at fair value on the balance sheet). For more information on instruments measured at fair value on recurring basis and on non-recurring basis, see B.-D. below.
(5) Of which embedded derivatives in loans to the public, net amounting to NIS 5 million.

171
Note 15 - Balances and estimates of fair value of financial instruments - continued
Reported amounts (NIS in millions)
A. Fair value balances - continued
As of December 31, 2017 (audited)
Book balance
Fair value
Level 1(1)
Fair value
Level 2(1)
Fair value
Level 3(1)
Fair value
Total
Financial assets Cash and deposits with banks 41,130 4,043 36,048 1,021 41,112
Securities(3) 10,133 6,950 3,160 98 10,208
Securities loaned or purchased in resale agreements 76 76 - - 76
Loans to the public, net 181,118 395 10,300 (5)170,276 180,971
Loans to Governments 456 - - 456 456
Investments in associated companies 33 - - 36 36
Assets with respect to derivatives 3,421 193 2,329 (2)899 3,421
Other financial assets 562 57 - 505 562
Total financial assets 236,929 11,714 51,837 173,291 236,842
Financial liabilities Deposits from the public 183,573 395 51,213 134,120 185,728
Deposits from banks 1,125 - 372 754 1,126
Deposits from the Government 51 - - 54 54
Debentures and subordinated notes 29,923 29,411 - 1,478 30,889
Liabilities with respect to derivatives 3,082 193 1,984 (2)905 3,082
Other financial liabilities 5,606 517 3,935 1,154 5,606
Total financial liabilities (4)223,360 30,516 57,504 138,465 226,485
(1) Level 1 - Fair value measurement using quoted prices on an active market. Level 2 - Fair value measurements using other significant observed data.
Level 3 - Fair value measurements using significant non-observed data.
(2) Fair value measurement is primarily based on use of observed data (market interest rate curves), except for credit quality of counter parties.
(3) For more information about the carrying amount and fair value of securities, see Note 5 to the financial statements.
(4) Includes assets and liabilities amounting to NIS 60,751 million and NIS 53,863 million, respectively, whose carrying amount equals their fair value (instruments presented at fair value on the balance sheet). For more information on instruments measured at fair value on recurring basis and on non-recurring basis, see B.-D. below.
(5) Of which embedded derivatives in loans to the public, net amounting to NIS 6 million.

172
Note 15 - Balances and estimates of fair value of financial instruments - continued
Reported amounts (NIS in millions)
B. Items measured at fair value:
1. On recurring basis
As of March 31, 2018 (unaudited)
Prices quoted on active market (level 1)
Other significant observed data (level 2)
Non-observed significant data (level 3)
Total fair value
Assets Securities available for sale Debentures: of Government of Israel 1,402 3,049 - 4,451
Of foreign governments 1,350 - - 1,350
Of banks and financial institutions overseas - 449 - 449
Of others overseas - 17 - 17
Shares 2 - - 2
Securities held for trading: Debentures of the Government of Israel 194 - - 194
Of banks and financial institutions overseas - - - -
Securities loaned or purchased in resale agreements 46 - - 46
Credit with respect to loans to clients 502 - - 502
Assets with respect to derivatives(1) Interest contracts: NIS / CPI - 151 162 313
Other - 608 19 627
Currency contracts 39 1,018 832 1,889
Contracts for shares 132 60 126 318
Commodities and other contracts - - 6 6
Other financial assets 11 - - 11
Other - - 3 3
Total assets 3,678 5,352 1,148 10,178
Liabilities Deposits with respect to borrowing from clients 502 - - 502
Liabilities with respect to derivatives(1) Interest contracts: NIS / CPI - 87 45 132
Other - 840 37 877
Currency contracts 38 642 554 1,234
Contracts for shares 132 119 163 414
Commodities and other contracts - - 3 3
Other financial liabilities 481 - - 481
Total liabilities 1,153 1,688 802 3,643
(1) Fair value measurement of derivatives classified under Level 3 is primarily based on use of observed data (market interest rate curves), except for credit quality of counter parties.

173
Note 15 - Balances and estimates of fair value of financial instruments - continued
Reported amounts (NIS in millions) B. Items measured at fair value - continued
1. On recurring basis
As of March 31, 2017 (unaudited)
Prices quoted on active market (level 1)
Other significant observed data (level 2)
Non-observed significant data (level 3)
Total fair value
Assets Securities available for sale Debentures: of Government of Israel 3,362 3,223 - 6,585
Of foreign governments 1,625 - - 1,625
Of banks and financial institutions in Israel - - - -
Of banks and financial institutions overseas - 18 - 18
Of others overseas - 18 - 18
Shares 2 - - 2
Securities held for trading: -
Debentures of the Government of Israel 202 - - 202
Of banks and financial institutions overseas -
Securities loaned or purchased in resale agreements 46 - - 46
Credit with respect to loans to clients 400 - - 400
Assets with respect to derivatives(1) -
Interest contracts: -
NIS / CPI - 253 114 367
Other - 916 25 941
Currency contracts 96 1,474 646 2,216
Contracts for shares 178 3 241 422
Commodities and other contracts - - 5 5
Other financial assets - - - -
Other - - 5 5
Total assets 5,911 5,905 1,036 12,852
Liabilities Deposits with respect to borrowing from clients 400 - - 400
Securities loaned or sold in conjunction with resale agreements - - - -
Liabilities with respect to derivatives(1) Interest contracts: NIS / CPI - 110 81 191
Other - 1,236 50 1,286
Currency contracts 98 1,100 1,092 2,290
Contracts for shares 162 - 212 374
Commodities and other contracts - - 2 2
Other financial liabilities 508 - - 508
Other - - - -
Total liabilities 1,168 2,446 1,437 5,051
(1) Fair value measurement of derivatives classified under Level 3 is primarily based on use of observed data (market interest rate curves), except for credit quality of counter parties.

174
Note 15 - Balances and estimates of fair value of financial instruments - continued
Reported amounts (NIS in millions) B. Items measured at fair value - continued
1. On recurring basis
As of December 31, 2017 (unaudited)
Prices quoted on active market
(level 1)
Other significant observed data
(level 2)
Non-observed significant data
(level 3) Total fair
value
Assets Securities available for sale Debentures: of Government of Israel 1,165 2,971 - 4,136
Of foreign governments 2,233 - - 2,233
Of banks and financial institutions overseas - 173 - 173
Of others overseas - 16 - 16
Shares 1 - - 1
Securities held for trading: -
Debentures of the Government of Israel 209 - - 209
Securities loaned or purchased in resale agreements 76 - - 76
Credit with respect to loans to clients 395 - - 395
Assets with respect to derivatives(1) Interest contracts: NIS / CPI - 169 146 315
Other - 637 21 658
Currency contracts 52 1,401 603 2,056
Contracts for shares 141 122 123 386
Commodities and other contracts - - 6 6
Other - - 6 6
Total assets 4,272 5,489 905 10,666
Liabilities Deposits with respect to borrowing from clients 395 - - 395
Liabilities with respect to derivatives(1) Interest contracts: NIS / CPI - 93 85 178
Other - 933 35 968
Currency contracts 53 881 669 1,603
Contracts for shares 140 77 113 330
Commodities and other contracts - - 3 3
Other financial liabilities 517 - - 517
Other - - - -
Total liabilities 1,105 1,984 905 3,994
(1) Fair value measurement of derivatives classified under Level 3 is primarily based on use of observed data (market interest rate curves), except for credit quality of counter parties.

175
Note 15 - Balances and estimates of fair value of financial instruments - continued
Reported amounts (NIS in millions) B. Items measured at fair value - continued
2. On non-recurring basis
As of March 31,
2018 (unaudited)
Fair value
Level 1(1)
As of March 31,
2018 (unaudited)
Fair value
Level 2(1)
As of March 31,
2018 (unaudited)
Fair value
Level 3(1)
As of March 31,
2018 (unaudited)
Fair value
Total
For the three months ended March 31, 2018 (unaudited)
(Losses)
Impaired credit whose collection is contingent on collateral - - 112 112 (2)
As of March 31,
2017 (unaudited)
Fair value
Level 1(1)
As of March 31,
2017 (unaudited)
Fair value
Level 2(1)
As of March 31,
2017 (unaudited)
Fair value
Level 3(1)
As of March 31,
2017 (unaudited)
Fair value
Total
For the three months ended March 31, 2017 (unaudited)
Gains
Impaired credit whose collection is contingent on collateral - - 79 79 -
As of December
31, 2017 (audited)
Fair value
Level 1(1)
As of December
31, 2017 (audited)
Fair value
Level 2(1)
As of December
31, 2017 (audited)
Fair value
Level 3(1)
As of December
31, 2017 (audited)
Fair value
Total
For the year ended December 31, 2017 (audited)
Gains
Impaired credit whose collection is contingent on collateral - - 78 78 76
(1) Level 1 - Fair value measurement using quoted prices on an active market. Level 2 - Fair value measurements using other significant observed data.

176
Note 15 - Balances and estimates of fair value of financial instruments - continued
Reported amounts (NIS in millions)
C. Change in items measured at fair value on recurrent basis, included in level 3:
For the three months ended March 31, 2018 (unaudited)
Fair value as of December
31, 2017 (audited)
Realized / unrealized
gains (losses)
included, net(1)
In statement of profit and
loss
Realized / unrealized
gains (losses)
included, net(1)
In statement of other
comprehen-sive income
under Equity Acquisi-
tions Sales Disposi-
tions Transfer
to level 3
Fair value as of March 31,
2018 (unaudited)
Unrealized gains (losses) with
respect to instruments held as of March 31,
2018 (unaudited)
Assets
Assets with respect to derivatives(3)(2)
Interest contracts:
NIS / CPI 146 3 - 1 - (6) 18 162 85
Other 21 (2) - - - - - 19 78
Currency contracts 603 50 - 501 - (322) - 832 422
Contracts for shares 123 18 - 28 - (43) - 126 -
Commodities and other contracts 6 - - - - - - 6 -
Other 6 - - - - (3) - 3 -
Total assets 905 69 - 530 - (374) 18 1,148 585
Liabilities
Liabilities with respect to derivatives(3)(2)
Interest contracts:
NIS / CPI 85 (2) - - - (42) 4 45 13
Other 35 2 - - - - - 37 63
Currency contracts 669 (8) - 163 - (270) - 554 447
Contracts for shares 113 71 - 3 - (24) - 163 -
Commodities and other contracts 3 - - - - - - 3 -
Total liabilities 905 63 - 166 - (336) 4 802 523
(1) Realized gains (losses) included in the statement of profit and loss under "Non-interest financing revenues". Unrealized gains and losses included in equity under Adjustments for Presentation of Available-for-Sale Securities at Fair Value under Other Comprehensive Income.
(2) Fair value measurement is primarily based on use of observed data (market interest rate curves), except for credit quality of counter parties.
(3) Included in statement of profit and loss under "Non-interest financing revenues".

177
Note 15 - Balances and estimates of fair value of financial instruments - continued
Reported amounts (NIS in millions)
C. Change in items measured at fair value on recurrent basis, included in level 3 - Continued:
For the three months ended March 31, 2017 (unaudited)
Fair value as of December
31, 2016 (audited)
Realized / unrealized
gains (losses) included, net(1)
In statement of profit and
loss
Realized / unrealized
gains (losses) included, net(1)
In statement of other
comprehensive income
under Equity Acquisi-
tions Sales Disposi-
tions Transfer
to level 3
Fair value as of March 31,
2017 (unaudited)
Unrealized gains (losses) with
respect to instruments held as of March 31,
2017 (unaudited)
Assets
Assets with respect to derivatives(3)(2)
Interest contracts:
NIS / CPI 205 (56) - 1 - (42) 6 114 93
Other 517 (486) - - - (6) - 25 138
Currency contracts 660 74 - 342 - (430) - 646 483
Contracts for shares 328 (52) - 27 - (62) - 241 -
Commodities and other contracts 7 - - - - (2) - 5 -
Other 8 - - - - (3) - 5 -
Total assets 1,725 (520) - 370 - (545) 6 1,036 714
Liabilities
Liabilities with respect to derivatives(3)(2)
Interest contracts:
NIS / CPI 64 (31) - 1 - - 47 81 (51)
Other 669 (609) - - - (10) - 50 240
Currency contracts 790 282 - 335 - (315) - 1,092 970
Contracts for shares 311 (57) - 19 - (61) - 212 -
Commodities and other contracts 4 - - - - (2) - 2 1
Total liabilities 1,838 (415) - 355 - (388) 47 1,437 1,160
(1) Realized gains (losses) included in the statement of profit and loss under "Non-interest financing revenues". Unrealized gains and losses included in equity under Adjustments for Presentation of Available-for-Sale Securities at Fair Value under Other Comprehensive Income.
(2) Fair value measurement is primarily based on use of observed data (market interest rate curves), except for credit quality of counter parties.
(3) Included in statement of profit and loss under "Non-interest financing revenues".

178
Note 15 - Balances and estimates of fair value of financial instruments - continued
Reported amounts (NIS in millions)
C. Change in items measured at fair value on recurrent basis, included in level 3 - Continued:
For the year ended December 31, 2017 (audited)
Fair value as of December
31, 2016 (audited)
Realized / unrealized
gains (losses) included, net(1)
In statement of profit and loss
Realized / unrealized
gains (losses) included, net(1)
In statement of other
comprehensive income under
Equity Acquisi-
tions Sales Disposi-
tions Transfer
to level 3
Fair value as of
December 31, 2017 (audited)
Unrealized gains (losses) with respect
to instruments held as of December 31,
2017 (audited)
Assets
Assets with respect to derivatives(3)(2)
Interest contracts:
NIS / CPI 205 (69) - 2 - (87) 95 146 126
Other 517 (489) - 2 - (9) - 21 134
Currency contracts 660 344 - 1,079 - (1,480) - 603 474
Contracts for shares 328 (98) - 95 - (202) - 123 -
Commodities and other contracts 7 2 - - - (3) - 6 1
Other 8 - - 3 - (5) - 6 -
Total assets 1,725 (310) - 1,181 - (1,786) 95 905 735
Liabilities
Liabilities with respect to derivatives(3)(2)
Interest contracts:
NIS / CPI 64 (30) - 2 - (20) 69 85 13
Other 669 (618) - 1 - (17) - 35 198
Currency contracts 790 390 - 1,179 - (1,690) - 669 649
Contracts for shares 311 (64) - 63 - (197) - 113 -
Commodities and other contracts 4 5 - - - (6) - 3 1
Total liabilities 1,838 (317) - 1,245 - (1,930) 69 905 861
(1) Realized gains (losses) included in the statement of profit and loss under "Non-interest financing revenues". Unrealized gains and losses included in equity under Adjustments for Presentation of Available-for-Sale Securities at Fair Value under Other Comprehensive Income.
(2) Fair value measurement is primarily based on use of observed data (market interest rate curves), except for credit quality of counter parties.
(3) Included in statement of profit and loss under "Non-interest financing revenues".

179
Note 15 - Balances and estimates of fair value of financial instruments - continued
Reported amounts (NIS in millions)
D. Additional information about non-observed significant data and valuation techniques used in fair value measurement of items classified at Level 3:
Fair value as of March 31, 2018
(unaudited) Valuation technique Non-observed data Range
Weighted average
Assets with respect to derivatives:
Interest contracts - NIS CPI 103 Cash flows discounting
Inflationary expectations 0.85%- 0.57% 0.69%
Contracts for shares 137 Options pricing
model Standard deviation
per share 42.65% - 19.55% 31.87%
Other 908 Cash flows discounting
Counter-party credit quality 3.10% - 0.30% 1.38%
Liabilities with respect to derivatives:
Interest contracts - NIS CPI 38 Cash flows discounting
Inflationary expectations 0.85%- 0.57% 0.64%
Other 764 Cash flows discounting
Counter-party credit quality 3.10% - 0.30% 1.89%
Fair value as of March 31, 2017
(unaudited) Valuation technique Non-observed data Range
Weighted average
Assets with respect to derivatives:
Interest contracts - NIS CPI 58 Cash flows discounting
Inflationary expectations 0.02% - (0.02%) (0.01%)
Contracts for shares 5 Options pricing
model Standard deviation
per share 165.11% - 165.11% 165.11%
Other 973 Cash flows discounting
Counter-party credit quality 3.10% - 0.30% 1.72%
Liabilities with respect to derivatives:
Interest contracts - NIS CPI 59 Cash flows discounting
Inflationary expectations 0.02% - (0.02%) (0.01%)
Other 1,378 Cash flows discounting
Counter-party credit quality 3.10% - 0.30% 1.92%
Fair value as of December 31, 2017 (audited)
Valuation technique Non-observed data Range
Weighted average
Assets with respect to derivatives:
Interest contracts - NIS CPI 104 Cash flows discounting
Inflationary expectations 0.43% - 0.41% 0.41%
Contracts for shares - Options pricing
model Standard deviation
per share 44.53% - 29.56% 38.96%
Other 801 Cash flows discounting
Counter-party credit quality 3.10% - 0.30% 1.38%
Liabilities with respect to derivatives:
Interest contracts - NIS CPI 80 Cash flows discounting
Inflationary expectations 0.43% - 0.41% 0.41%
Other 825 Cash flows discounting
Counter-party credit quality 3.10% - 0.30% 1.89%

180
Note 15 - Balances and estimates of fair value of financial instruments - continued
Reported amounts (NIS in millions)
E. Transfers between Levels 1 and 2 of the fair value hierarchy
There were no transfers from Level 2 and Level 3 to Level 1 during the reported period.
F. Election of fair value option
Due to election of the fair value option, the Bank treats investments in certain debentures at fair value, charging the changes to profit and loss and classifies them under the portfolio held for trading - even though they had not been purchased for this purpose.
Election of the fair value option was made under the following circumstances:
1. Reduce volatility in profit and loss resulting from changes between the original measurement basis of financial instruments designated at the fair value option, and the measurement basis of derivative financial instruments used to manage risks with respect to such investments.
2. Complexity of implementing hedge accounting.
3. More accurate economic presentation of assets managed on fair value basis.
As of March 31, 2018, December 31, 2017 and March 31, 2017, the Bank did not select the fair value option.
Note 16 - Events after the balance sheet date
On May 7, 2018, after the balance sheet date, the Bank’s Board of Directors resolved to distribute dividends amounting to NIS 137.2 million, or 40% of earnings in the first quarter of 2018.
The dividends are 589.1% of issued share capital, i.e. NIS 0.5891 per NIS 0.1 par value share. The effective date for dividends payment is May 22, 2018 and the payment date is June 5, 2018. The final dividends per share is subject to changes due to realized convertible securities of the Bank. According to accounting rules, this amount will be deducted from retained earnings in the first quarter of 2018.

181
Corporate governance, other information about the Bank and its management
Table of Contents
CORPORATE GOVERNANCE 182
Board of Directors and management 182
Internal Auditor 182
Transactions with controlling shareholders and related parties 182
Controlling shareholders 182
Human Resources 182
Legislation and Supervisory Regulation of Bank Group Operations 183
Bank's credit rating 187
Operating segments 187

182
Corporate governance
Board of Directors and management
Board of Directors
During the first quarter of 2018, the Bank’s Board of Directors held 5 plenary meetings. During this period there were also 17 meetings of Board committees and one Board member workshop.
Members of Bank management and senior officers
In the first quarter of 2018 there were no changes to members of Bank management and senior officers.
Internal Auditor
Details of internal audit within the Group, including the professional standards applied by internal audit, the annual and multi-annual work plan and considerations in its determination, extent of employment of the Internal Auditor and his team and the manner in which reports are submitted with regard to findings of the Internal Auditor have been included in chapter "Corporate Governance, Audit, Other Information about the Bank and Management thereof" of the 2017 annual report. No material changes occurred in these details during the reported period.
Transactions with controlling shareholders and related parties
Transactions with affiliated persons were executed in the ordinary course of business, at market terms and under terms similar to those of transactions effected with unrelated entities.
Controlling shareholders
Below are developments compared to the 2017 financial statements:
Ofer Group
On March 18, 2018, the Bank received notice from Ofer Investments Ltd. and from Ofer Bros. Holdings (1989) Ltd. with regard to an agreement in principles of a separation outline, due to provisions of the Competition Enhancement and Concentration Reduction Act, 2013.
The outline principles are designed to separate control of the significant financial entity (the Bank) from control of the significant non-banking entity (Meliseron Ltd. / Ofer Investments Ltd.) among shareholders in Ofer Group ("the outline"). Note that this outline is not a binding agreement and is merely designed to serve as a basis for preparation of a detailed agreement.
For more information about agreed principles for the separation outline at Ofer Group, with due consideration to provisions of the Competition Enhancement and Concentration Reduction Act, 2013, see the Immediate Report by the Bank dated March 18, 2018 (reference: 2018-01-020733).
Human Resources
Developments in labor relations
For more information about an economic arbitration between the Bank and the Mizrahi Tefahot Employees’ Union, see Note 22.A.6. to the 2017 financial statements. Management believes, based on the opinion of legal counsel, that exposure with respect to this arbitration cannot be estimated.

183
Legislation and Supervisory Regulation of Bank Group Operations
Laws and regulations
European Union Markets in Financial Instruments Directive (MIFID 2)
European regulation applicable to European countries, became effective on January 3, 2018. The objective of this regulation is to create uniform directives in Europe, so as to increase trading transparency, market efficiency and investor protection in the European market. This regulation is not directly applicable to the Bank in Israel, but given the Bank's global operations and many interfaces with the European market, the Bank has been requested to arrange its contractual relations with European counterparts.
Credit Data Act, 2016
On April 12, 2016, the Credit Data Act was published and would become effective on October 12, 2018, unless postponed (but not later than April 12, 2020). The act reforms the market for credit data service. When this act would become effective, the Credit Data Service Act, 2002 would be rescinded. This act is relevant for the Bank, both due to the Bank being an "information source", required to provide credit data for Bank clients to a central information repository at the Bank of Israel and due to the Bank being a "credit data user", authorized to receive credit data from the credit bureaus. In conformity with the Act, an information repository is being created at the Bank of Israel. A credit bureau would receive information from this repository and a credit provider may request from the credit bureau a credit report, credit indication (definitive recommendation on whether to extend credit) and monitoring (monitoring of changes to the borrower's standing over the loan term). In order to obtain information, the credit provider must obtain explicit consent from the borrower (to obtain an indication, it is sufficient to inform the borrower). A client may ask the Bank of Israel to exclude their credit data from the repository or not to provide such data for compiling a credit report. Over the preparation period for application of the Act (from publishing of the Act through its effective start date), the Bank provides information about clients to the repository being created, as instructed from time to time by the Bank of Israel. Application of the Act is not expected to have any material impact on the Bank's financial statements.
Financial Services Supervision Act (Regulated Financial Services), 2016
The Act became effective on June 1, 2017. The Act is designed to govern the non-banking credit market, to generate fair, transparent competition in this area, which had been gray and exposed in part – and to allow consumers to have confidence in non-banking credit providers. According to the Act, as from June 1, 2017 it is not permitted to engage in Israel in "extending credit" (which is very widely defined) without a valid license, contingent on minimum capital, verification of good standing and supervision by the Supervisor of Capital Market, Insurance and Savings. As from June 1, 2018, it would not be permitted to engage in Israel in "provision of service in financial assets" without an appropriate license. Financial entities subject to licensing by other legislation are, naturally, exempt. The Bank may refuse account management to anyone required by law to hold a license who would fail to present such license. Currently, Bank clients that provide discounting and lending services are subject to licensing pursuant to the new Act and the Bank has contacted the relevant clients, requiring them to present their license or, alternatively, to certify that they do not extend credit. On February 1, 2018, Amendment 4 to the Act became effective, stipulating that operation of a "credit brokerage system" constitutes a "financial service". Therefore, as from the effective start date of this Amendment, it would no longer be possible to engage in operation of a credit brokerage system in Israel without an appropriate license. The Amendment stipulates, inter alia, that the license holder must manage lender and borrower funds transferred to the license holder in a separate trust account in favor of the lenders, with one of the entities listed in the Act, including with a banking corporation. The Bank is studying the Amendment and is preparing for its implementation. Application of this Act has no impact on the Bank's financial statements.

184
Restructuring of the Stock Exchange
On April 6, 2017, the Securities Law (Amendment No. 63), 2017 was officially published, concerning restructuring of the Stock Exchange. The Law puts in place the legal infrastructure for separation of ownership of the Tel Aviv Stock Exchange and the rights of Stock Exchange members to use its services, while removing the existing requirement for the Stock Exchange to distribute its earnings. It also stipulates restrictions on holding of shares of the Stock Exchange, requiring Stock Exchange members and banking corporations other than Stock Exchange members to sell any means of control they hold in excess of 5%. The Law further stipulates arrangements for allocation of share capital of the Stock Exchange among members thereof and sale of holdings in excess of 5%. In conformity with the Act, on June 29, 2017 the Stock Exchange filed a request to convene a General Meeting of Stock Exchange members, in order to approve an arrangement on changes to the Stock Exchange structure in conformity with Section 350 of the Companies Law (hereinafter: "the Arrangement"). In the proposed Arrangement, bylaws of the clearinghouses were amended so that clearinghouse members would not take part in its management and objections were made to the proposed text. The Court approved the motion to convene a General Meeting and ordered that should agreement be reached on the change to wording of a proposed resolution on amendment of the clearinghouse Bylaws, no further Court hearing would be required. Consequently, provisions with regard to amendment of clearinghouse Bylaws were revised to include claim and audit proceedings and have been approved by the Stock Exchange Audit Committee and Board of Directives (hereinafter: “the Amendment”). On August 10, the Arrangement was approved, as amended, by the General Meeting of Stock Exchange members; on August 16, a motion was filed with the Tel Aviv District Court for approval of the Agreement pursuant to Section 350 of the Corporate Act. On September 7, 2017, the Court approved the arrangement for changing the stock exchange structure. On September 18, 2017, the Bank received a letter from the Tel Aviv Stock Exchange, containing a notice of share allotment to the Bank and registration of the Bank in the Stock Exchange's register of shareholders. On December 28, 2017, the Tel Aviv Stock Exchange Ltd. ("Stock Exchange Company") contacted the Bank, which holds 6,640,416 shares or 6.640417% of the Stock Exchange Company’s share capital, as shareholder of the Stock Exchange, seeking proposals to acquire the shares held by the Bank. This solicitation was addressed to Stock Exchange members, whereby shareholders wishing to sell their shares in the Stock Exchange Company ("Offering Shareholder") are requested to issue an offer to the Stock Exchange Company for sale and transfer of Stock Exchange Company shares held thereby, at such terms and conditions as stated in the solicitation. According to the solicitation, the price for shares offered for sale was set at NIS five hundred (500) million divided by the total number of allotted shares of the Stock Exchange Company, multiplied by the number of shares offered for sale by the Offering Shareholder. On January 18, 2018, the Bank accepted the Stock Exchange’s offer to sell part (1.7%) of the Stock Exchange shares held by the Bank, such that after the sale, the Bank would hold 4,900,000 shares, or 4.9% of the share capital of the Stock Exchange Company. The expected consideration for these shares amounts to NIS 8.7 million. On April 16, 2018. the Bank was informed by the stock exchange member that the Bank's aforementioned proposed sale of shares has been accepted. According to this notice, the shares would be sold and transferred to one or to multiple buyers ("the Buyer"). The consideration payable to the Bank would be higher than indicated in the offer but, in conformity with provisions of the Securities Act on this matter, the difference between the consideration paid and the price indicated in the offer would be transferred to the stock exchange member. Closing of the transaction is contingent on obtaining regulatory approvals and closing is scheduled for June 19, 2018 ("the Effective Date"). Should the approvals not be obtained or the closing not take place by the Effective Date, the transaction would be terminated unless otherwise agreed by the Buyer, the Stock Exchange and the Bank.

185
The Non-banking Loans Arrangement Law (Amendment 5), 2017
On August 6, 2017, the Law, known as the "Fair Credit Law", was published. The law applies to credit extended to individuals from banking corporations, settlement providers, insurers and management companies. The Law provides a uniform maximum interest rate for all lending entities and applies to: - Loans in NIS: The Bank of Israel interest rate plus 15%. - Loans in foreign currency: One-year LIBOR interest rate plus 15%. - Arrears interest: Maximum interest rate multiplied by 1.2. In the third year after implementation of the Law, the Finance Minister will examine the average interest rate for credit extended by banks and will be authorized to reduce the maximum borrowing cost. The following were excluded from the scope of the uniform maximum interest rate: - Short-term loans (up to 3 months) – capped at a maximum of 5% over the maximum interest rate. - Transactions involving discounting a note for business (non-personal) use. - Loans subject to an interest rate decree, pursuant to the Interest Law (such as arrears interest for
housing loans or CPI-linked loans). The provisions of the Law would apply only to new loans. The effective start date of the Law is November 6, 2018. The Bank is preparing to implement the Act. Application of the Act is not expected to have any material impact on the Bank's financial statements.
Reduction of Cash Usage Act, 2018
On March 18, 2018, the Reduction of Cash Usage Act, 2018 was made public. The Act is designed to reduce the use of cash in transactions – by both payer and payee. The Act also governs payment by check. The Act stipulates certain restrictions on the use of cash and checks. The Act will become effective on January 1, 2019, except for certain sections effective as from July 1, 2019. Pursuant to the Act, the Supervisor of Banks may impose monetary sanctions on banking corporations that pay a check in breach of any of the restrictions applicable to such check pursuant to Addendum II. The Supervision of Banks may start imposing sanctions as from July 1, 2019. The Bank is preparing to implement the Act.
Insolvency and Financial Rehabilitation Act, 2018
The Insolvency and Financial Rehabilitation Act, 2018 (hereinafter: "the Act") was officially published on March 15, 2018. The Act shall be effective 18 months after publication. The Act provides a codification of insolvency laws and comprehensively encompasses all insolvency laws for individuals and corporations, eliminating the old ordinances and arrangements provided for in the Companies Law. The Act has three major goals:
- Financial rehabilitation of the debtor. Regard credit default and insolvency as a financial mishap, rather than a moral flaw.
- Increase in debt percentage to be repaid to creditors. - Increase certainty and stability of the Law, through shorter proceedings and reduced
bureaucratic burden. The Act stipulates changes to various matters, such as: Threshold for launch of insolvency proceedings, duration of insolvency proceedings, linkage and interest, floating lien, mutual debt offsetting, the position of a financing provider for operations of a company under stay of proceedings, liability of Board members and managers and negotiations of debt re-structuring. The Bank believes that the Act would affect the extension of credit and the repayment rate upon default. The Bank is preparing to implement provisions of the Act.
186
Supervisor of Banks
Circulars and Public Reporting Regulations Debt collection proceedings
On February 1, 2017, the Bank of Israel issued Proper Banking Conduct Directive 450 "Debt collection proceedings", designed to govern the actions to be taken in order to increase fairness and transparency in debt collection from clients who fail to repay their loan on time and when handling debt collection prior to and during any legal proceedings. The effective start date of this directive is one year after its issue date. The Bank applies the directive as from February 1, 2018.
Prohibition of money laundering
On January 1, 2018, Proper Banking Conduct Directive 411 "AML and Terror Financing Risk Management" became effective, which integrates supervisory circulars and letters on this matter issued since the most recent extensive revision of this directive. The directive was expanded and compiled as a risks management directive, including identification, assessment and operative mitigation steps. The key amendments to the directive include: Explanation of the risk-based approach, clarification of definitions, expanded description of the roles of corporate governance functions, details of items on which the bank is to rely when preparing the risk assessment and details of the information database to be gathered by the bank from internal and external sources in order to formulate the risk assessment. The Bank is applying this directive.
Reduced cross commission in deferred and immediate charge transactions using credit cards
On February 25, 2018, the Bank of Israel issued an outline designed to reduce the cross commission in
deferred charge transactions using charge cards by 30%, from 0.7% of transaction amount today, to 0.5%
in January 2023. This change will take place in 5 stages: First in January 2019 (0.6%); second in January
2020 (0.575%); third in January 2021 (0.55%); fourth in January 2022 (0.525%); and final in January 2023.
The Bank of Israel also decided to reduce the cross commission for immediate charge transactions using
credit cards, from 0.3% to 0.25% in January 2023. This change will take place in 2 stages: First in January
2021 (0.275%) and second in January 2023.
Application of the reduced commission is not expected to have any material impact on the Bank's
financial statements.
Capital measurement and adequacy
On March 15, 2018, the Supervisor of Banks issued a circular revising Proper Banking Conduct Directive
203 "Measurement and capital adequacy – Credit risk" with regard to risk weighting of loans with LTV ratio
higher than 60%.
The circular stipulated that loans with LTV ratio higher than 60% would be assigned a 60% risk weighting,
compared to 75% prior to this revision.
The revision is designed to provide relief to young couples and second home buyers who purchase
apartments with a high LTV ratio.
The revision is effective as from the circular issue date. The Bank is applying this directive.
Application of this directive reduces risk assets due to origination of housing loans with LTV ratio higher
than 60%, originated as from the circular issue date.
Banking corporation operations with clients who are regulated financial service providers and offering coordinators
On April 15, 2018, the Bank of Israel issued a circular designed to specify guidelines to allow banking corporations to provide service and manage risk associated with their operations with regulated financial entities (entities supervised by the Capital Market Authority, in conformity with the Supervision Act). This is further to the Financial Services Supervision Act (Regulated Financial Services), 2016 which is designed to provide for comprehensive and coherent regulation, in as much as possible, of the entire financial services market and entities operating in this market. In conformity with the circular, the Bank must specify policy and procedures for opening and management of accounts for regulated financial entities so as to reflect, inter alia, a risk-based approach. The Bank is preparing to implement the circular. Application of this circular has no effect on the Bank's financial statements.

187
Management of cyber risk in the supply chain
In April 2018, the Bank of Israel issued Proper Conduct of Banking Business Directive 363 "Management
of cyber risk in the supply chain", designed to clarify the bank's responsibility for maintaining secure work
procedures with material external suppliers and the bank's obligations to appropriately manage cyber risk
in operations of such suppliers in their premises, in bank premises and in bank – supplier interfaces. Key
provisions of the directive shall become effective 6 months after its publication. The Bank is preparing to implement this directive. Application of this circular has no effect on the Bank's financial statements.
Bank's credit rating On January 21, 2018, S&P GLOBAL RATINGS MAALOT LTD (hereinafter: "Ma'alot") confirmed the Bank's issuer rating of ilAAA with a Stable rating outlook. The rating of subordinated notes issued by Tefahot Issuance is one rank below the issuer rating, i.e. rated ilAA+. These subordinated notes qualify as Tier II capital under transitional provisions of Basel III. The Bank's subordinated capital notes, which qualify as Tier II equity in conformity with transitional provisions of Basel III, are rated ilA+. The contingent subordinated notes with contractual loss-absorption provisions (CoCo), which qualify as Tier II equity in conformity with provisions of Basel III, are rated ilAA- with Stable rating outlook. On September 10, 2017, Midroog Ltd. (created in partnership with Moody's International, which owns a 51% equity stake) (hereinafter: "Midroog") issued an initial rating of the Bank. Long-term deposits and senior debt of the Bank wererated Aaa.il / Stable outlook. Subordinated notes (Lower Tier II capital) were rated Aa1.il / Stable outlook and subordinated capital notes (Upper Tier II capital) were rated Aa2.il / Stable outlook. contingent subordinated notes with contractual loss-absorption provisions (CoCo), which qualify as Tier II equity in conformity with provisions of Basel III, are rated ilAa3 with Stable rating outlook. On June 30, 2015, Moody's rating agency confirmed the Bank's long-term deposit rating at A2 and raised the outlook from Negative to Stable.
Operating segments For more information about supervisory operating segments, see chapter "Corporate Governance, Audit, Other Information about the Bank and Management " of the 2017 financial statements.

188
Addendums to condensed quarterly financial statements
Addendum I - Interest Revenue and Expense Rates – of the Bank and its Subsidiaries(1)
Reported amounts (NIS in millions)
A. Average balances and interest rates – assets
For the three months ended
March 31, 2018
Average balance(2)
For the three months ended
March 31, 2018
Interest revenues
For the three months ended
March 31, 2018
Revenue rate In %
For the three months ended
March 31, 2017
Average balance(2)
For the three months ended
March 31, 2017
Interest revenues
For the three months ended
March 31, 2017
Revenue rate In %
Interest-bearing assets Loans to the public (3) In Israel 176,984 (7)1,331 3.04 167,894 (7)1,265 3.05 Outside of Israel 3,189 44 5.63 3,079 36 4.76 Total 180,173 1,375 3.09 170,973 1,301 3.08
Loans to the Government In Israel 202 1 1.99 186 1 2.17 Outside of Israel 256 3 4.77 133 2 6.15 Total 458 4 3.54 319 3 3.82
Deposits with banks In Israel 756 1 0.53 869 2 0.92 Outside of Israel 288 – – 342 1 1.17 Total 1,044 1 0.38 1,211 3 0.99
Deposits with central banks In Israel 38,095 7 0.07 33,842 8 0.09 Outside of Israel 2,869 11 1.54 4,466 9 0.81 Total 40,964 18 0.18 38,308 17 0.18
Securities loaned or purchased in resale agreements In Israel 82 – – 76 – – Outside of Israel – – – – – – Total 82 – – 76 – –
Debentures held to maturity and available for sale(4) In Israel 7,924 46 2.34 9,440 27 1.15 Outside of Israel 886 5 2.28 1,080 4 1.49 Total 8,810 51 2.34 10,520 31 1.18
Debentures held for trading(5) In Israel 111 – – 246 1 1.64 Outside of Israel – – – – – – Total 111 – – 246 1 1.64
Total interest-bearing assets 231,642 1,449 2.53 221,653 1,356 2.47
Receivables for credit card operations 3,367 2,997 Other non-interest bearing assets(6) 4,720 4,862 Total assets 239,729 229,512 Total interest-bearing assets attributable to operations outside of Israel 7,488 63 3.41 9,100 52 2.31
See remarks below.

189
Interest Revenues and Expenses Rates – of the Bank and its Subsidiaries(1) – continued
Reported amounts (NIS in millions)
A. Average balances and interest rates – liabilities and equity
For the three months ended
March 31, 2018
Average balance(2)
For the three months ended
March 31, 2018
Interest revenues
For the three months ended
March 31, 2018
Revenue rate In %
For the three months ended
March 31, 2017
Average balance(2)
For the three months ended
March 31, 2017
Interest revenues
For the three months ended
March 31, 2017
Revenue rate In %
Interest-bearing liabilities Deposits from the public In Israel On-call 21,855 3 0.05 19,187 (2) (0.04) Term deposits 113,116 269 0.95 113,858 219 0.77 Outside of Israel On-call 528 – – 676 – – Term deposits 4,768 16 1.35 4,677 10 0.86 Total 140,267 288 0.82 138,398 227 0.66
Deposits from the Government In Israel 51 – – 49 – – Outside of Israel – – – – – – Total 51 – – 49 – –
Deposits from banks In Israel 1,290 2 0.62 1,543 3 0.78 Outside of Israel 1 – – 6 – – Total 1,291 2 0.62 1,549 3 0.78
Securities loaned or sold in conjunction with repurchase agreements In Israel – – – – – – Outside of Israel – – – – – – Total – – – – – –
Debentures and subordinated notes In Israel 30,113 78 1.04 26,970 98 1.46 Outside of Israel – – – – – – Total 30,113 78 1.04 26,970 98 1.46
Other liabilities In Israel 98 – – 121 1 3.35 Outside of Israel – – – – – – Total 98 – – 121 1 3.35
Total interest-bearing liabilities 171,820 368 0.86 167,087 329 0.79
Non-interest bearing deposits from the public 44,431 39,876 Payables for credit card transactions 3,367 2,997 Other non-interest bearing liabilities(8) 5,629 6,046 Total liabilities 225,247 216,006 Total equity resources 14,482 13,506 Total liabilities and equity resources 239,729 229,512 Interest margin 1.67 1.68
Net return(9) on interest-bearing assets In Israel 224,154 1,034 1.86 212,553 985 1.87 Outside of Israel 7,488 47 2.53 9,100 42 1.86 Total 231,642 1,081 1.88 221,653 1,027 1.87
Total interest-bearing liabilities attributable to operations outside of Israel 5,297 16 1.21 5,359 10 0.75
See remarks below.

190
Interest Revenues and Expenses Rates – of the Bank and its Subsidiaries(1) – continued
Reported amounts (NIS in millions)
B. Average balances and interest rates – additional information about interest-bearing assets and liabilities attributed to operations in Israel
For the three months ended
March 31, 2018 Average
balance(2)
For the three months ended
March 31, 2018 Interest
revenues
For the three months ended
March 31, 2018 Revenue rate
In %
For the three months ended
March 31, 2017 Average
balance(2)
For the three months ended
March 31, 2017 Interest
revenues
For the three months ended
March 31, 2017 Revenue rate
In %
Israeli currency – non-linked Total interest-bearing assets 160,097 1,065 2.69 150,790 982 2.63
Total interest-bearing liabilities 114,174 (220) (0.77) 104,723 (159) (0.61)
Interest margin 1.92 2.02
Israeli currency – linked to
the CPI Total interest-bearing assets 51,780 218 1.69 49,792 241 1.95
Total interest-bearing liabilities 36,367 (64) (0.71) 38,605 (120) (1.25)
Interest margin 0.98 0.70
Foreign currency (including
Israeli currency linked to
foreign currency) Total interest-bearing assets 12,277 103 3.40 11,971 81 2.73
Total interest-bearing liabilities 15,982 (68) (1.71) 18,400 (40) (0.87)
Interest margin 1.69 1.86
Total – operations in Israel Total interest-bearing assets 224,154 1,386 2.50 212,553 1,304 2.48
Total interest-bearing liabilities 166,523 (352) (0.85) 161,728 (319) (0.79)
Interest margin 1.65 1.69
See remarks below.

191
Interest Revenues and Expenses Rates – of the Bank and its Subsidiaries(1) – continued
Reported amounts (NIS in millions)
C. Analysis of change in interest revenues and expenses
For the three months ended March 31, 2018 – compared to the three months ended March 31, 2017
Increase (decrease) due to change(10)
Quantity Price Net change
Interest-bearing assets Loans to the public In Israel 68 (2) 66
Outside of Israel 2 6 8
Total 70 4 74
Other interest-bearing assets In Israel 3 13 16
Outside of Israel (8) 11 3
Total (5) 24 19
Total interest revenues 65 28 93
Interest-bearing liabilities Deposits from the public In Israel 4 51 55
Outside of Israel – 6 6
Total 4 57 61
Other interest-bearing liabilities In Israel 7 (29) (22)
Outside of Israel – – –
Total 7 (29) (22)
Total interest expenses 11 28 39
(1) Information in these tables is after effect of hedging financial derivatives. (2) Based on balances at start of the months (in Israeli currency, non-linked segment – based on daily balances). (3) Before deduction of average balance sheet balance of provisions for credit losses. Includes impaired debt not accruing
interest revenues. (4) From the average balance of debentures available for sale, for the three-month periods ended March 31, 2018 and March
31, 2017, we deducted (added) the average balance of unrealized gains (losses) from adjustment to fair value of debentures available for sale, included in equity under Other Comprehensive Income, under "Adjustments with respect to presentation of securities available for sale at fair value", amounting to NIS (53) million and NIS (39) million, respectively.
(5) From the average balance of debentures held for trading, for the three-month periods ended March 31, 2018 and March 31, 2017, we deducted (added) the average balance of unrealized gains (losses) from adjustment to fair value of debentures held for trading, amounting to NIS (1) million and NIS (1) million.
(6) Includes derivatives, other non-interest bearing assets, net of provision for credit losses. (7) Commissions amounting to NIS 63 million and NIS 60 million included under interest revenues for the three-month periods
ended March 31, 2018 and March 31, 2017, respectively. (8) Includes derivatives. (9) Net return – net interest revenues divided into total interest-bearing assets. (10) The change attributed to change in quantity was calculated by multiplying the new price by the change in quantity. The
change attributed to change in price was calculated by multiplying the old quantity by the change in price.

192
Glossary and index of terms included on the financial statements
Below is a summary of terms included on the financial statements:
1. Terms with regard to risks management at the Bank and to capital adequacy
• B Basel – Basel II / Basel III – Framework for assessment of capital adequacy and risk management, issued by the Basel Committee on Bank Supervision.
• C CVA - Credit Valuation Adjustment – CVA is the component of the fair value of a derivative, which accounts for the credit risk of the counter-party to the transaction. CVA risk is the risk of loss due to mark-to-market with respect to expected counter-party risk for OTC derivatives. This means – loss due to impairment of fair value of derivatives, due to an increase in counter-party credit risk (such as: lower rating).
• Counter-party credit risk – The risk that the other party to a transaction would be in default before final settlement of cash flows in the transaction.
• E EVE – Economic Value of Equity – The economic value approach to analysis and estimation of the effect of changes in interest rates on the fair value of assets, liabilities and off-balance sheet positions of the Bank.
• I ICAAP – Internal Capital Adequacy Assessment Process by the Bank. This process includes, inter alia, setting capital targets, capital planning processes and review of capital status under various stress scenarios. This process is part of Pillar 2 of the Basel II directive.
• L Loan To Value Ratio (LTV) – The ratio between the approved facility when extended and the asset value.
• M Minimum capital ratio – This ratio reflects the minimum supervisory capital requirements which the Bank is required to maintain in conformity with Proper Banking Conduct Directive 201.
• R Risks document – A document which concisely presents the Bank's risk profile, in order to allow the Board of Directors to monitor action taken by management and to ensure that such action is in line with the risk appetite and with the risks management framework approved by the Board of Directors. The Risks Document is compiled and presented to the Board of Directors quarterly.
• Risk assets – These consist of credit risk, operating risk and market risk, calculated using the standard approach as stated in Proper Banking Conduct Directives 201-211.
• P Pillar 2 – The second pillar of the Basel II project, refers to the Supervisory Review Process. This part consists of the following basic principles:
• The Bank shall conduct the ICAAP process, as defined above.
• The Supervisor shall conduct a process to assess the ICAAP process conducted by the Bank, to review the Bank's capacity to monitor and achieve supervisory capital ratios.
• The Bank is expected to operate above the specified minimum capital ratios.
• S Standard approach – An approach used to calculate the required capital with respect to credit risk, market risk or operating risk. Calculation of capital allocation is based on a formula, which is based on supervisory assessment components which have been specified by the Supervisor of Banks.
• Supervisory capital (total capital) – Supervisory capital consists of two tiers: Tier I capital, which includes Tier I shareholders’ equity and additional Tier I capital. Tier II equity: As defined in Proper Banking Conduct Directive 202 "Measurement and capital adequacy – supervisory capital".
• Subordinated notes – Notes whose rights are subordinated to claims by other Bank creditors, except for other obligations of the same type.
• Stress tests – A title for various methods used to assess the financial standing of a banking corporation under a n extreme scenario.
• V VAR – A model used to estimate overall exposure to diverse market risk factors. The VaR (Value at Risk) obtained by the model is a statistical estimate of the maximum expected loss for the Bank due to materialization of market risks factors in a given time period at a pre-determined statistical confidence level.
193
2. Terms with regard to banking and finance
• A Average effective duration – The average term to maturity of debentures. Measured in years, by weighting principal and interest payments for the debenture over its term to final maturity. The average effective duration of a debenture reflects the financial instrument's sensitivity to changes in interest rates. Average effective duration is calculated as the ratio between the weighted average debenture payouts to its price.
Active market – A market where transactions involving an asset or liability take place regularly and in sufficient volume, so as to regularly provide information about pricing of assets and liabilities.
• D Debentures – Securities which are obligations by the issuer to pay to the debenture holder the principal issued plus interest, on specified dates or upon realization of a specified condition.
• Debt whose collection is contingent on collateral – Impaired debt whose repayment is expected through realization of collateral provided to secure such debt.
• Debt under restructuring – Problematic debt under restructuring is defined as debt for which, for economic or legal reasons related to financial difficulties of the debtor, the Bank has made a concession by way of modification to terms and conditions of the debt, designed to make it easier for the debtor to make cash payments in the near term (reduction or postponement of cash payments due from the debtor), or by way of receiving other assets as debt repayment (in whole or in part).
• Debt under special supervision – Debt under special supervision is debt with potential weaknesses, which require special attention by Bank management. Should these weaknesses not be addressed, the likelihood of debt repayment may deteriorate.
• Derivatives – A financial instrument or contract whose value changes in response to changes in the price of the underlying asset (a financial instrument, physical asset, index, credit rating or other underlying asset), requires a small or minimal initial investment, compared to other contract types, and is expected to be settled on a future date.
• F Financial instrument – A contract that creates a financial asset for one entity and a financial liability or capital instrument for another entity.
• I Inferior debt – Inferior debt is debt insufficiently secured by collateral or by debtor repayment capacity, and for which the Bank may incur a loss if faults are not corrected, including debt over NIS 700 thousand which is 60-89 days in arrears.
• Impaired debt – Debt is classified as impaired when its principal or interest is in arrears over 90 days, unless the debt is well secured and is in collection proceedings. Further, any debt whose terms and conditions have been changed in conjunction with restructuring of problematic debt would be classified as impaired debt, unless prior to and following such restructuring, a provision for credit losses by extent of arrears was made with respect to the debt pursuant to the appendix to Proper Banking Conduct Directive 314 on problematic debt in housing loans.
• Indebtedness – On- and off-balance sheet credit, as defined in Proper Banking Conduct Directive 313.
• O Off-balance sheet credit – Contracting for providing credit and guarantees (excluding derivatives).
• OTC – Over the Counter – Transaction involving financial instruments which is conducted over the counter and not on a stock exchange.
• P Problematic debt – Debt classified under one of the following negative classifications: special supervision, inferior or impaired.
• R Recorded debt balance – The debt balance, including recognized accrued interest, premium or discount yet to be amortized, net deferred commissions or net deferred costs charged to the debt balance and yet to amortized, net of the debt amount subject to accounting write-off.
• S Syndication – A loan extended jointly by a group of lenders.

194
3. Terms with regard to regulatory directives
• E EMIR - European Market Infrastructure Regulation – EU regulations adopted in order to increase stability, transparency and efficiency of derivative markets.
• F FATCA - Foreign Accounts Tax Compliance Act – The US Foreign Accounts Tax Compliance Act stipulates mandatory reporting to the US tax authority (IRS) of accounts held by US persons with foreign financial institutions (outside the USA).
• L LCR – Liquidity Coverage Ratio is defines as the ratio of High Quality Liquid Assets and net cash outflow for the next 30 days, under a stress scenario. This ratio is a benchmark for the Bank's capacity to fulfill its liquidity needs for the coming month.
195
Index Accounting policies, 82
Capital, 3, 4, 6, 7, 10, 20, 26, 27, 29, 42, 43, 44, 47, 77, 80
Commissions, 193
Compliance and regulatory risk, 9, 45, 80
Cost-income ratio, 19
Credit risk, 3, 4, 9, 19, 22, 28, 43, 46, 48, 50, 51, 52, 53, 54, 55, 56, 57, 61, 62, 63, 108, 109, 110, 133, 134
149, 150, 151, 152, 153,154, 155, 156, 157, 158, 159, 160, 161, 162, 163, 164, 165, 192
Cross-border and AML risk, 9, 45, 80
Deposits from the public, 3, 7, 25, 41, 79, 111
Derivatives, 22, 39, 62, 74, 127, 128, 129, 130, 131, 132, 133, 134, 135, 137, 144, 180, 193
Dividends, 15, 29, 30, 47, 180
Earnings per share, 96, 97
Economic sectors, 32, 54, 55, 56, 57, 62, 136
Fair value, 4, 19, 20, 76, 107, 169, 170, 171, 172, 173, 174, 175, 176, 177, 178, 179, 180
Financing, 19, 29, 47, 52, 65, 79, 98, 101, 186
Financing risk, 79
Housing loans, 32, 50, 66, 136, 154, 164, 193
Interest expenses, 188, 189, 190, 191
Interest revenues, 154
Interest risk, 9, 45, 67
Legal Proceedings, 11, 80, 186
Leverage ratio, 29
Liquidity coverage ratio, 79, 116
Liquidity risk, 9, 45, 79
Loans to the public, 21, 62, 108, 109, 110, 149, 150, 151, 152, 153, 154, 155, 156, 157, 158, 159, 160, 161
162, 163, 164, 165
Market risk, 192
Operating risk, 9, 77, 81, 192
Operating segments, 3, 17, 18, 22, 25, 30, 31, 36, 40, 136, 137, 138, 140, 142, 144, 145, 146, 147, 148, 187
Provision for credit losses, 3, 4, 22, 48, 49, 51, 108, 109, 110, 193
Reputation risk, 9, 45, 81
Return on equity, 6, 10, 16
Risk assets, 3, 28
Securities, 5, 9, 20, 25, 29, 30, 39, 41, 54, 104, 105, 106, 107, 137, 180, 184
Share-based payment, 97
Strategic risk, 45, 81
Subordinated notes, 10, 187