Embed Size (px)
Citation preview

MLM for Experimental DataPSYC 575
September 15, 2020 (updated: 30 October 2020)

Experimental Designs
• Within-subjects/mixed designs• Random assignment at level 1
• Between-subjects• Cluster-randomized trial
• Treatment at level 2
• Multisite trial• Treatment at level 1
• See example in chapter 11 of Snijders and Bosker (2012)

Learning Objectives
• Identify the correct levels with experimental studies
• Describe designs with crossed random levels
• Assign variables to appropriate levels• And tell which variables can have random slopes at which levels
• Compute a version of effect size (d) for experimental data
Changes in Driving Scenes
• Example 1 from Hoffman & Rovine (2007)• Originally from Hoffman & Atchley (2001)
• Flicker paradigm: https://coglab.cengage.com/labs/change_detection.shtml

Filo gèn' / CC BY-SA (with changes) (https://creativecommons.org/licenses/by-sa/4.0)


Filo gèn' / CC BY-SA (with changes) (https://creativecommons.org/licenses/by-sa/4.0)

Changes in Driving Scenes
• 153 persons • Younger (n = 96), Mage = 19.7 years (SD = 2.3);
• Older (n = 57), Mage = 75.7 years (SD = 5.4)
• 51 scenes/items• Meaningfulness (0-5): meaningfulness to driving of the change
• Salience (0-5): how visually conspicuous the change was within the scene
• Original plan: 2 (age group) × 2 (meaning) × 2 (salience) split-plot ANOVA

Data
• While RM-ANOVA uses the wide format, MLM requires the long format• Each unique response is in its own row
• See RStudio

Issues With ANOVA
• Unbalanced data/Missing responses• NA when change not detected within 60s
• ANOVA uses listwise deletion: individual record is discarded when an individual has 1+ missing response

Issues of ANOVA
• ANOVA may require discretization of meaning and salience
• E.g., 0-2 for low salience, 3-5 for high salience• May hurt statistical power

What is the Data Structure?
• Each response represents a person answering an item
• Responses nested within persons?
• Responses nested within items?

Crossed Levels

Crossed Levels
• Cross-classified model

Crossed Levels at Level 2
Person(Level 2a)
Item(Level 2b)
Repeated Measure
Level 2
Level 1

Pre-Processing
• Log transformation of response time

Unconditional Model
• Repeated Measure (Within-cell) level (Lv 1)• lg_rti(j, k) = β0(j, k) + eijk
• Between-cell (Person × Item) level• β0(j, k) = γ00 + u0j + v0k
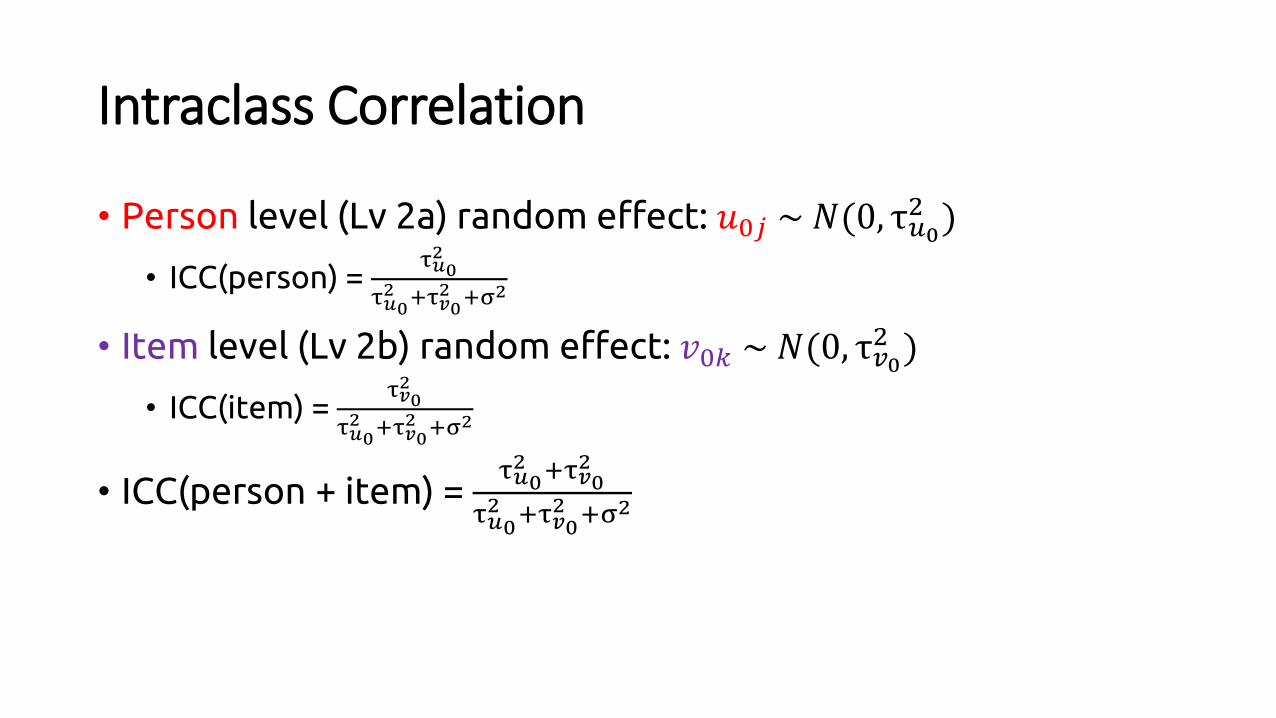
Intraclass Correlation
• Person level (Lv 2a) random effect: 𝑢0𝑗 ~ 𝑁(0, τ𝑢02 )
• ICC(person) = τ𝑢02
τ𝑢02 +τ𝑣0
2 +σ2
• Item level (Lv 2b) random effect: 𝑣0𝑘 ~ 𝑁(0, τ𝑣02 )
• ICC(item) = τ𝑣02
τ𝑢02 +τ𝑣0
2 +σ2
• ICC(person + item) = τ𝑢02 +τ𝑣0
2
τ𝑢02 +τ𝑣0
2 +σ2

Intraclass Correlation
## Formula: lg_rt ~ (1 | id) + (1 | Item)
## Random effects:
## Groups Name Variance Std.Dev.
## id (Intercept) 0.1803 0.4246
## Item (Intercept) 0.1259 0.3549
## Residual 0.3899 0.6244
## Number of obs: 7646, groups: id, 153; Item, 51
• ICC(person) = 0.26
• ICC(item) = 0.18
• ICC(person + item) = 0.44

Varying Slopes With Crossed Levels

Rule for Random Slopes
• A predictor can have random slopes at a level above or at a crossed level

Varying Slopes Across Persons
• Repeated Measure level (Lv 1)• lg_rti(j, k) = β0(j, k) + eijk
• Between-cell (Person × Item) level• β0(j, k) = γ00 + β1j meaningk + u0j + v0k
• Person level (Lv 2a)• β1j = γ10 + u1j
Any predictors at the repeated measure level or at the item level can have random slopes across persons

Varying Slopes Across Items
• Repeated Measure level (Lv 1)• lg_rti(j, k) = β0(j, k) + eijk
• Between-cell (Person × Item) level• β0(j, k) = γ00 + β4k oldagej + u0j + v0k
• Item level (Lv 2b)• β4k = γ40 + v4k
Any predictors at the repeated measure level or at the person level can have random slopes across items

Hypothesized Model
• Repeated Measure level (Lv 1)• lg_rti(j, k) = β0(j, k) + eijk
• Between-cell (Person × Item) level• β0(j, k) = γ00 + β1j meaningk + β2j saliencek + β3j meaningk × saliencek
+ β4k oldagej + u0j + v0k
• Person level (Lv 2a) random slopes• β1j = γ10 + γ11 oldagej + u1j
• β2j = γ20 + γ21 oldagej + u2j
• β3j = γ30 + γ31 oldagej + u3j

Hypothesized Model
• Item level (Lv 2b) random slopes• β4k = γ40 + v4k

Hypothesized Model
• lg_rti(j, k) = γ00+ γ10 meaningk + γ20 saliencek+ γ30 meaningk × saliencek+ γ40 oldagej+ γ11 meaningk × oldagej+ γ21 saliencek × oldagej+ γ31 meaningk × saliencek × oldagej+ u0j + u1j × meaningk + u2j × saliencek+ u3j × meaningk × saliencek+ v0k + v4k × oldagej+ eijk
Grand intercept
Item-level main and interaction effects
Person-level main effect
Person × item
cross-level interaction
Person-level random intercepts and slopes
Item-level random intercepts and slopes
Within-cell deviation

Notes
• Because of counterbalancing• Person-level variables have no
item-level variance
• Item-level variables have no person-level variance
• Therefore, no need for cluster-mean centering
Formula: c_sal ~ (1 | id)
Data: driving_dat
REML criterion at convergence: 23545.51
Random effects:
Groups Name Std.Dev.
id (Intercept) 0.000
Residual 1.094

Notes
• To more easily interpret the interactions, we want to grand-mean center meaning and salience• They were centered to 3.0 in the data

Notes
• By testing random slopes one by one, the final model includes• Random slopes of c_sal (across persons)
• Random slopes of oldage (across items)
• All two-way and three-way interactions were found not significant

Three-Way Interaction Plot

Effect Size

Effect Size (d)
• d = Treatment effect / [some estimate of population SD]
• Still an active area of research; no consensus how to standardize
• In my opinion, we should think about what is the natural standard deviation in the population without intervention
• One option: τ𝑢02 + σ2 from the unconditional model1
• For salience (from 0 to 5), 𝑑 =(−0.13)×5
0.18+0.39= −0.87
• See R code
[1]: See more discussion in Judd et al. (2017, doi: 10.1146/annurev-psych-122414-033702)

Effect Size (d)
• For cluster-randomized trials (random assignment at school level), see Lai (2020)1
[1]: https://doi.org/10.1080/00273171.2020.1746902

Alternative Models
• See R code for log-normal model that directly models the distribution of response time