Embed Size (px)
Citation preview

S1
SUPPORTING INFORMATION
Comparison of non-precious metal cathode materials for methane
production by electromethanogenesis
Michael Siegert1, Matthew D. Yates1, Douglas F. Call1,2, Xiuping Zhu1, Alfred Spormann3, Bruce E. Logan1*
1Department of Civil and Environmental Engineering, The Pennsylvania State University, University Park, PA, USA
2Syracuse University, Department of Civil and Environmental Engineering, Syracuse, NY, USA 3Department of Civil and Environmental Engineering and Department of Chemical Engineering,
Stanford University, Stanford, CA, USA *Corresponding author: Bruce E. Logan, 231Q Sackett Bldg, Department of Civil and
Environmental Engineering, The Pennsylvania State University, University Park, PA 16802, Email: [email protected]; Phone: +1 814-863-7908, Fax: +1 814-863-7304
S2
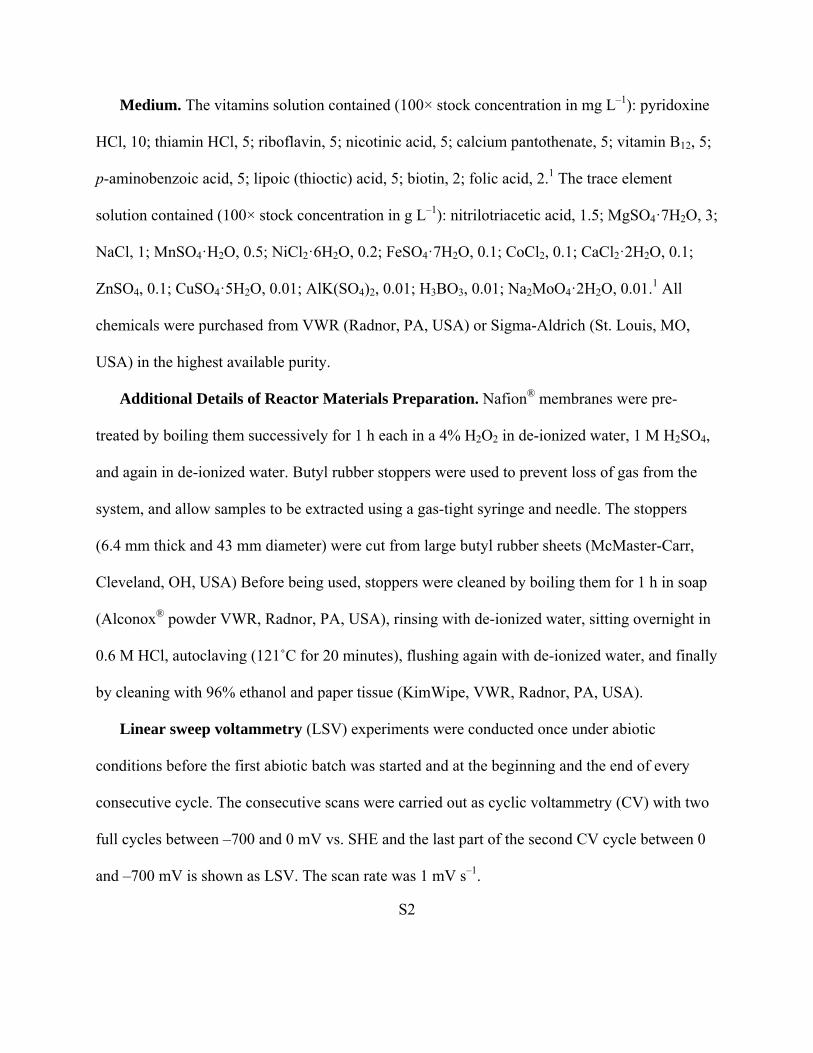
Medium. The vitamins solution contained (100× stock concentration in mg L–1): pyridoxine
HCl, 10; thiamin HCl, 5; riboflavin, 5; nicotinic acid, 5; calcium pantothenate, 5; vitamin B12, 5;
p-aminobenzoic acid, 5; lipoic (thioctic) acid, 5; biotin, 2; folic acid, 2.1 The trace element
solution contained (100× stock concentration in g L–1): nitrilotriacetic acid, 1.5; MgSO4·7H2O, 3;
NaCl, 1; MnSO4·H2O, 0.5; NiCl2·6H2O, 0.2; FeSO4·7H2O, 0.1; CoCl2, 0.1; CaCl2·2H2O, 0.1;
ZnSO4, 0.1; CuSO4·5H2O, 0.01; AlK(SO4)2, 0.01; H3BO3, 0.01; Na2MoO4·2H2O, 0.01.1 All
chemicals were purchased from VWR (Radnor, PA, USA) or Sigma-Aldrich (St. Louis, MO,
USA) in the highest available purity.
Additional Details of Reactor Materials Preparation. Nafion® membranes were pre-
treated by boiling them successively for 1 h each in a 4% H2O2 in de-ionized water, 1 M H2SO4,
and again in de-ionized water. Butyl rubber stoppers were used to prevent loss of gas from the
system, and allow samples to be extracted using a gas-tight syringe and needle. The stoppers
(6.4 mm thick and 43 mm diameter) were cut from large butyl rubber sheets (McMaster-Carr,
Cleveland, OH, USA) Before being used, stoppers were cleaned by boiling them for 1 h in soap
(Alconox® powder VWR, Radnor, PA, USA), rinsing with de-ionized water, sitting overnight in
0.6 M HCl, autoclaving (121˚C for 20 minutes), flushing again with de-ionized water, and finally
by cleaning with 96% ethanol and paper tissue (KimWipe, VWR, Radnor, PA, USA).
Linear sweep voltammetry (LSV) experiments were conducted once under abiotic
conditions before the first abiotic batch was started and at the beginning and the end of every
consecutive cycle. The consecutive scans were carried out as cyclic voltammetry (CV) with two
full cycles between –700 and 0 mV vs. SHE and the last part of the second CV cycle between 0
and –700 mV is shown as LSV. The scan rate was 1 mV s–1.
S3
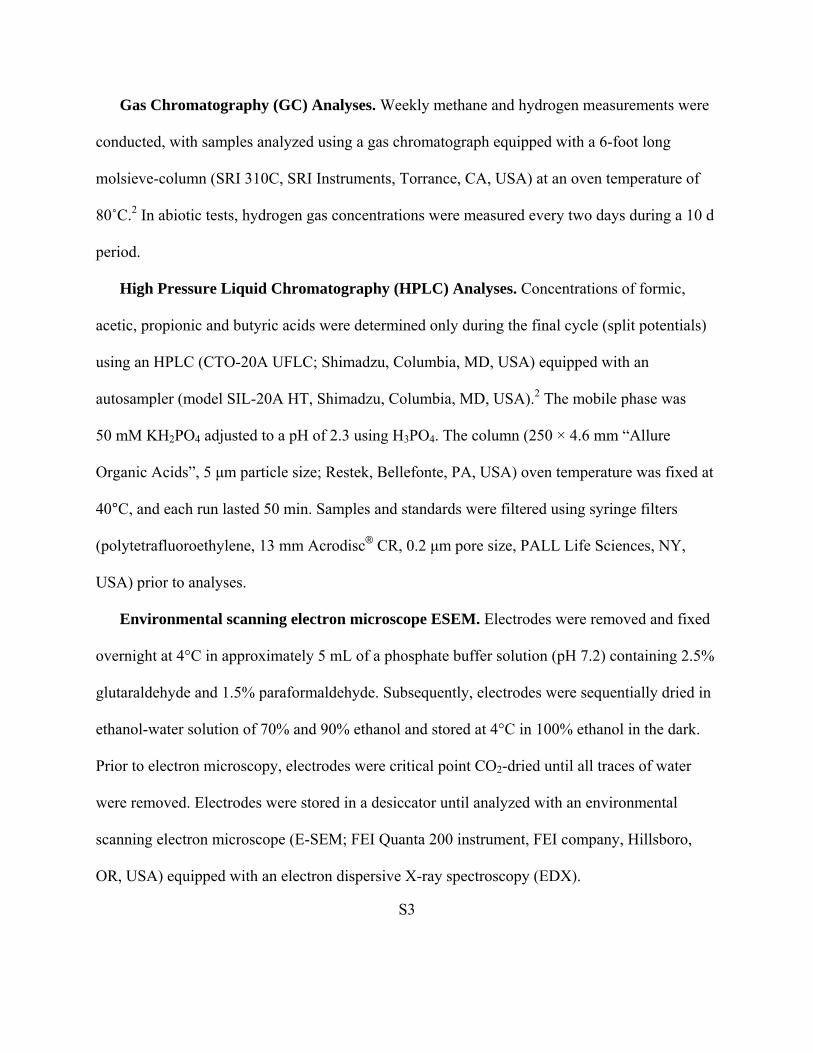
Gas Chromatography (GC) Analyses. Weekly methane and hydrogen measurements were
conducted, with samples analyzed using a gas chromatograph equipped with a 6-foot long
molsieve-column (SRI 310C, SRI Instruments, Torrance, CA, USA) at an oven temperature of
80˚C.2 In abiotic tests, hydrogen gas concentrations were measured every two days during a 10 d
period.
High Pressure Liquid Chromatography (HPLC) Analyses. Concentrations of formic,
acetic, propionic and butyric acids were determined only during the final cycle (split potentials)
using an HPLC (CTO-20A UFLC; Shimadzu, Columbia, MD, USA) equipped with an
autosampler (model SIL-20A HT, Shimadzu, Columbia, MD, USA).2 The mobile phase was
50 mM KH2PO4 adjusted to a pH of 2.3 using H3PO4. The column (250 × 4.6 mm “Allure
Organic Acids”, 5 μm particle size; Restek, Bellefonte, PA, USA) oven temperature was fixed at
40°C, and each run lasted 50 min. Samples and standards were filtered using syringe filters
(polytetrafluoroethylene, 13 mm Acrodisc® CR, 0.2 μm pore size, PALL Life Sciences, NY,
USA) prior to analyses.
Environmental scanning electron microscope ESEM. Electrodes were removed and fixed
overnight at 4°C in approximately 5 mL of a phosphate buffer solution (pH 7.2) containing 2.5%
glutaraldehyde and 1.5% paraformaldehyde. Subsequently, electrodes were sequentially dried in
ethanol-water solution of 70% and 90% ethanol and stored at 4°C in 100% ethanol in the dark.
Prior to electron microscopy, electrodes were critical point CO2-dried until all traces of water
were removed. Electrodes were stored in a desiccator until analyzed with an environmental
scanning electron microscope (E-SEM; FEI Quanta 200 instrument, FEI company, Hillsboro,
OR, USA) equipped with an electron dispersive X-ray spectroscopy (EDX).

S4
References
(1) Wolin, E. A.; Wolfe, R. S.; Wolin, M. J., Viologen dye inhibition of methane formation by Methanobacillus omelianskii. J. Bacteriol. 1964, 87, (5), 993-998. (2) Pisciotta, J. M.; Zaybak, Z.; Call, D. F.; Nam, J.-Y.; Logan, B. E., Enrichment of microbial electrolysis cell biocathodes from sediment microbial fuel cell bioanodes. Appl. Environ. Microbiol. 2012, 78, (15), 5212-5219. (3) Thauer, R. K.; Kaster, A.-K.; Seedorf, H.; Buckel, W.; Hedderich, R., Methanogenic archaea: ecologically relevant differences in energy conservation. Nat. Rev. Microbiol. 2008, 6, (8), 579-591. (4) Lide, D. R., CRC handbook of chemistry and physics. 89 ed.; CRC Press, Inc.: Boca Raton, 2008.

S5
Table S 1: Batch cycle times in days. Batch cycle 6 was the potential split cycle. Asterisks (*) denote actual batch cycles 7 because of oxygen intrusion into 1 reactor with an iron sulfide cathode and 2 reactors with graphite electrodes. Plus (+) indicates graphite reactors that ran over 116 days during cycle 2. All results displayed in the article were shifted accordingly, i.e. failed cycles (cycle 2 of iron sulfide and graphite and cycle 6 of steel) are never shown because no methane was produced. The reference electrodes failed during cycle 6 of one steel reactor and the entire cycle was repeated.
Material Batch Cycle Times in days inoculation batch 2 batch 3 batch 4 batch 5 batch6 Platinum 24 16 32 22 27 25 Steel 24 57 34 32 28 21* Nickel 23 60 34 32 40 27 Ferrihydrite 24 71 27 40 34 34 Magnetite 24 57 34 32 28 33 Iron sulfide 24 49 43 32 40 34*
MoS2 24 63 34 40 34 34 C-brush 24 46 22 41 33 20 C-black 24 63 27 32 34 41 Graphite 24 48+ 33 34 28 27*

S6
Table S 2: Potential intermediate reactions which can cause methanogenic cathode corrosion and their respective energy requirements
ΔG° (standard conditions) and ΔGMMC° (approximated standard conditions in MMC reactors) a.
reaction reaction ∆G°
[kJ mol-1] ∆GMMC°
[kJ mol-1]a normalized to
1 2 C0 + 3 H2O CH4 + HCO3- + H+ 17 -47 per mol carbon
2 C0 + 3 H2O HCO3- + H+ + 2 H2 42 -22 per mol hydrogen
3 C0 + 2 H2 CH4 -25 -34 per mol hydrogen
2 + 3 2 C0 + 3 H2O CH4 + HCO3- + H+ 17 -56 per mol hydrogen (2)
4 2 C0 + 2 H2O H3C-COOH 84 -132 per mol acetate
5 H3C-COOH + H2O CH4 + HCO3- + H+ -50 -99 per mol acetate
4 + 5 2 C0 + 3 H2O CH4 + HCO3- + H+ 34 -231 per mol acetate (1)
7 C0 + 2 H2O HCOOH + H2 113 16 per mole formate
8 4 HCOOH + H2O CH4 + 3 HCO3- + 3 H+ -62 -76 per mole formate
7 + 8 4 C0 + 9 H2O CH4 + 3 HCO3- + 3 H+ + 4 H2 51 -43 per mol hydrogen (4)
10 6 C0 + 3 H2 C6H6 125 124 per mol benzene
11 4 C6H6 + 27 H2O 15 CH4 + 9 HCO3- + 9 H+ -123 -412 per mol benzene
10 + 11 8 C0 + 4 H2 + 9 H2O 5 CH4 + 3 HCO3- + 3 H+ 0 -96 per mol hydrogen (4)
Hydrogen (or e- + H+) is needed to make methanogenesis from elemental carbon (C0, graphite) thermodynamically feasible (reaction 3). However, the near infinite abundance of water (1/[H+]under MMC reactor conditions makes all reactions involving water and protons thermodynamically feasible.
aReaction condition ΔGMMC°: [methane] = 98 Pa (GC detection limit), [hydrogen] = 10 Pa (limit for cytochrome methanogenesis),3 [formate] = 1 mM, [acetate] = 1 mM, [bicarbonate] = 30 mM, [H+] = 0.1 μM at pH 7, [H2O] = 1/[H+] all other concentrations 1 M

S7
Table S 3: Correlation factors R2 of methane production rates over poised potentials. The poised
potentials were -550 mV and -650 mV during cycle 6 and -600 mV during cycle 5.
Material R2
Pt -0.93
Steel -0.96
Ni -0.75
ferrihydrite -0.83
magnetite -0.94
FeS -0.19
MoS2 -0.86
C-brush -0.95
C-black -0.59
graphite -0.83
S8
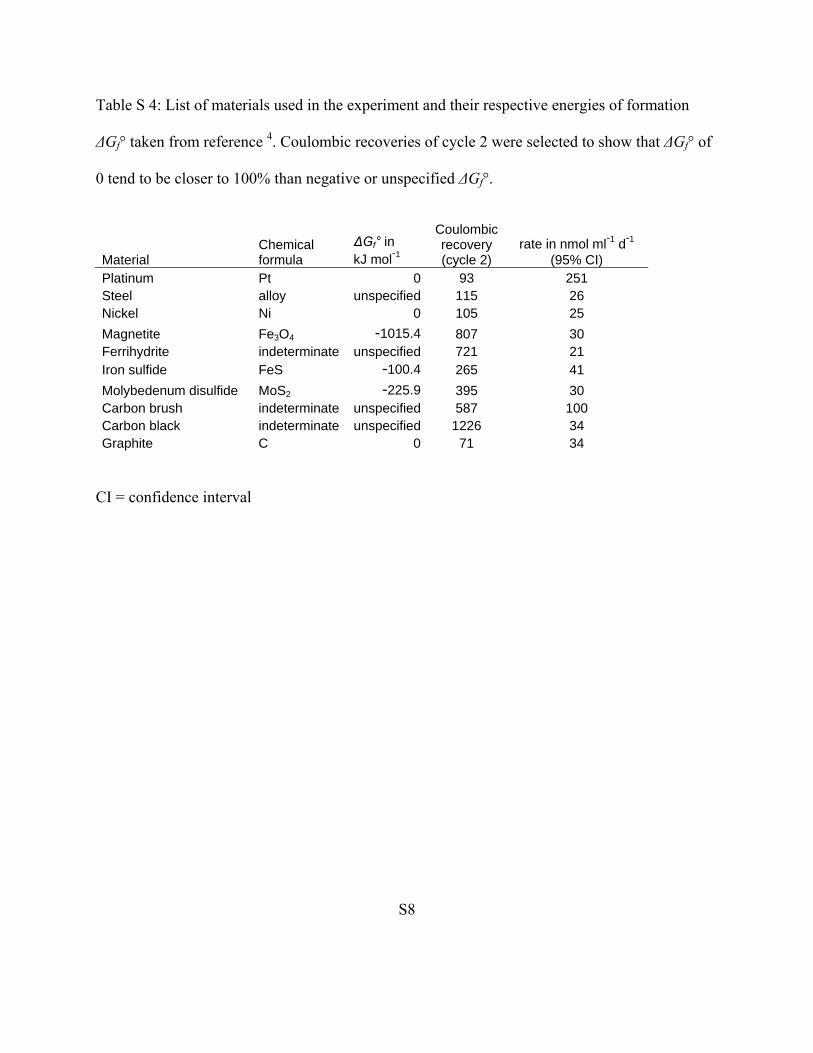
Table S 4: List of materials used in the experiment and their respective energies of formation
ΔGf° taken from reference 4. Coulombic recoveries of cycle 2 were selected to show that ΔGf° of
0 tend to be closer to 100% than negative or unspecified ΔGf°.
Material Chemical formula
∆Gf° in kJ mol-1
Coulombic recovery (cycle 2)
rate in nmol ml-1 d-1 (95% CI)
Platinum Pt 0 93 251 Steel alloy unspecified 115 26 Nickel Ni 0 105 25
Magnetite Fe3O4 -1015.4 807 30 Ferrihydrite indeterminate unspecified 721 21 Iron sulfide FeS -100.4 265 41
Molybedenum disulfide MoS2 -225.9 395 30 Carbon brush indeterminate unspecified 587 100 Carbon black indeterminate unspecified 1226 34 Graphite C 0 71 34
CI = confidence interval

S9
0 25
200
100
0
Inoculation cycle
Pt
steel
Ni
ferrihydrite
magnetite
100
50
00 25 500 25
Cycle 2 Cycle 3
0 25 0 25 50
Cycle 4 Cycle 5 Cycle 6
Cycle time in daysCycle time in daysCycle time in days
100
50
0
FeS
MoS2
C-brush
C-black
graphite
0 25
CH
4 p
rod
uce
d in
µm
ol
CH
4 p
rod
uce
d in
µm
ol
Figure S 1: Methanogenesis in open circuit controls. Note that cycle 2 lasted longer than depicted but no methanogenesis was observed in any of the reactors until the cycle ended.
S10
Carbon brush
Platinum
0
I in
mA
-0.5
-1.0
-1.5
-2.0
-2.5
nabiotic
= 3nabiotic
= 3
Abiotic (+/- errorn)
Inoculation cycleLast cycle
Carbon black Graphite
0
I in
mA
-0.5
-1.0
-1.5
-2.0
-2.5
nabiotic
= 3nabiotic
= 5
MagnetiteFerrihydrite
0
I in
mA
-0.5
-1.0
-1.5
-2.0
-2.5
nabiotic
= 4 nabiotic
= 3
Iron sulfide MoS2
nabiotic
= 3 nabiotic
= 4
-0.6-0.7
0
I in
mA
-0.5
-1.0
-1.5
-2.0
-2.5-0.5 -0.4 -0.3 -0.2 -0.1
E vs. SHE in V
-0.6-0.7 -0.5 -0.4 -0.3 -0.2 -0.1
E vs. SHE in V
NickelSteel0
I in
mA
-0.5
-1.0
-1.5
-2.0
-2.5n
abiotic= 3 n
abiotic= 3
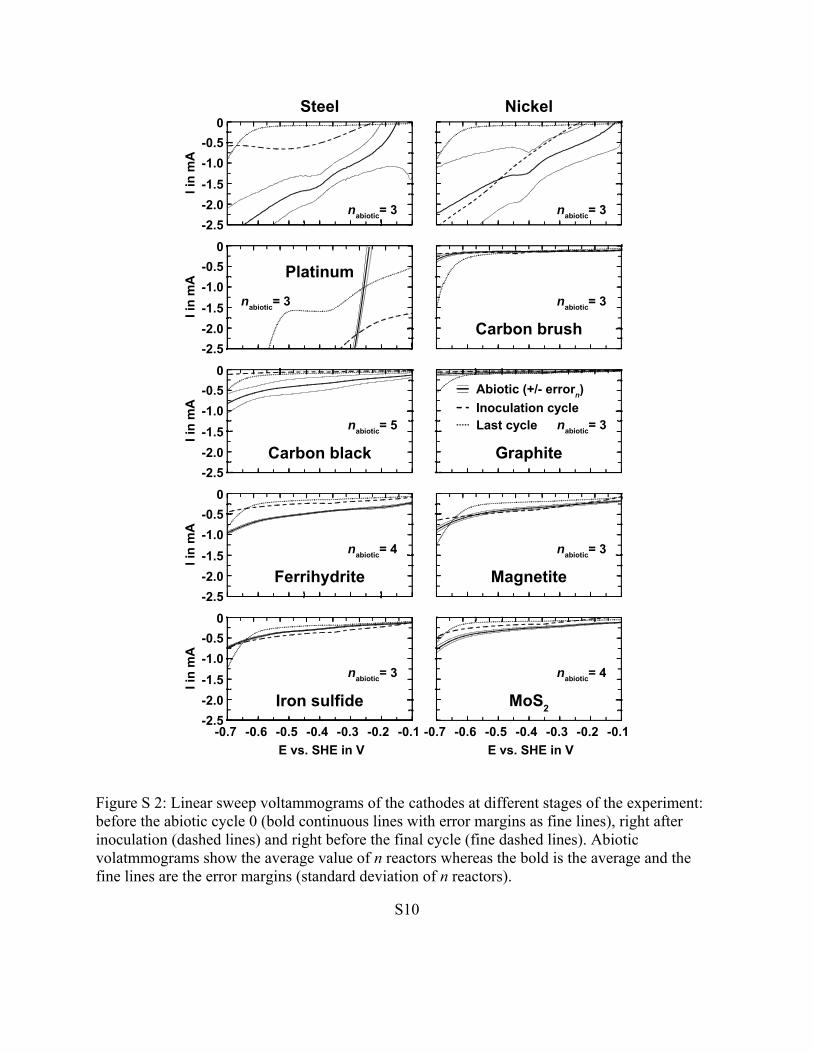
Figure S 2: Linear sweep voltammograms of the cathodes at different stages of the experiment: before the abiotic cycle 0 (bold continuous lines with error margins as fine lines), right after inoculation (dashed lines) and right before the final cycle (fine dashed lines). Abiotic volatmmograms show the average value of n reactors whereas the bold is the average and the fine lines are the error margins (standard deviation of n reactors).

S11
1 2 3 4 5 6 7 8 9 keV
CA
A-EDX B-EDX
B
C-EDX
0.5 keV1.0 1.5 2.0 2.5 1 2 3 4 5 6 7 8 9 keV
C
FeNaZn S
OCr
SiP Cr
Cr
Fe
FeNi
Ni
NiZn Zn
C
F MoMo
Mo&S
Mo
S
CCa
O
F
Ni
Zn
Al
P
S
Ca NiZnCu CuZnMo
10 μm 5 μm 10 μm
Figure S 3: ESEM micrographs taken of particles found on different carbon black electrodes and their respective EDX scans: A, steel particle, B, MoS2 particle; note that the molybdenum and the sulfur EDX bands overlap, C, carbon black-only with a presumably precipitated particle. All particles were overgrown by microbes indicating that they were present before colonization.

S12
C
ou
lom
bic
rec
ove
ry in
%
1000
100
1
10
10000
Pt
stee
l
Ni
ferr
ihyd
rite
mag
net
ite
FeS
Mo
S2
C-b
rush
C-b
lack
gra
ph
ite
Cycles 2-5Cycles 3-5
Figure S 4: Coulombic recoveries for duplicate reactors over several cycles illustrating the decrease of the errors. Mean values are shown for cycles 2-5 in dark blue and for cycles 3-5 in light green. Errors are standard deviations of the mean.

S13
¼H2
CH4
1000
100
1
10
Gas
pro
du
ced
nm
ol
cm–
3 d
–1
Pt
stee
l
Ni
ferr
ihyd
rite
mag
net
ite
FeS
Mo
S2
C-b
rush
C-b
lack
gra
ph
ite
Figure S 5: Gas production rates for hydrogen (mean) and methane (confidence intervals). The difference to the figure in the main text is that here, 95% confidence intervals over all cycles and duplicate reactors were calculated for methanogenesis. Shown are the mean values with their corresponding standard deviations within these confidence intervals.