Embed Size (px)
Citation preview

(NAAC Accredited University with Grade 'B')
MMU JOURNAL OF MANAGEMENT & TECHNOLOGY
A Bi-Annual Refereed Journal
January-June 2016
Vol.2 - Issue 1

MMU JOURNAL OF MANAGEMENT & TECHNOLOGY
A Bi-Annual Refereed Journal
January-June 2016 Vol.2 - Issue 1
Management
Technology
Ÿ EMPLOYEE VULNERABILITY TO STRESS IN ITeS-BPO COMPANIES OF INDIA: HOW TO MEASURE, MANAGE
AND CONTROL IT?
Dr. Rupali Arora, Associate Professor, Chandigarh University, Punjab, India.
Ÿ TO STUDY THE IMPACT OF BRAND ALLIANCES ON BRAND EQUITY: FOOD PANDA
Dr. Ruchi Jain, Amity School of Business, Amity University, Uttar Pradesh, India.
Ÿ WOMEN ENTREPRENEURSHIP IN INDIA: EMERGING ISSUES,CHALLENGES AND PROSPECTS
Dr. Rimpi Walia , Director, Patel Institute of Management & Technology, Rajpura, Punjab, India
Ms. Meenakshi Gupta Assistant Professor, E-Max Group of Institution, Badhouli, Ambala, Haryana, India
Ÿ IMPACT OF E-MARKETING STRATEGIES ON BUYING BEHAVIOR WITH SPECIAL REFERENCE TO APPAREL
INDUSTRY: A LITERATURE REVIEW
Ms. Pallavi Dua, Assistant Professor, G.L. Bajaj Institute of Management and Research, Greater Noida, India
Ÿ ARE SMALL CAP STOCKS VALUE CREATOR FOR INVESTORS? - AN EMPIRICAL STUDY
Mr. Jitin Gambhir , Assistant Professor (Finance), Galgotia University, India
Ms. Uma Luthra , Assistant Professor (Finance), Galgotia University, India
Ÿ SOME STUDIES ON DRILLING OF CHROME ALLOY STEEL
Dr. Harpreet Singh, Associate Professor and Dean, School of Mechanical, Materials and Energy Engineering, Indian
Institute of Technology, Ropar, Rupnagar, India,
Dr. Ravinder Singh Joshi, Associate Professor, Mechanical Engineering Department, MM University Sadopur, Ambala,
India.
Dr. Manoj Kumar Singla, Professor, Mechanical Engineering Department, CGC-CEC Landran, Mohali, India
Ÿ RESEARCH METHODOLOGY FOR PERFORMANCE MODEL FOR VARIOUS OPERATING SYSTEMS OF A
THERMAL POWER PLANT
Mr. Subhash Malik, Ph.D. Scholar, Department of Mechanical Engineering, NIT, Kurukshetra, Haryana, India.
Dr. P.C.Tewari, Professor, Department of Mechanical Engineering, NIT, Kurukshetra, Haryana, India
Ÿ LEAN SIX SIGMA: A SYSTEMATIC APPROACH FOR WASTE MANAGEMENT
Mr. Harsimran Singh Sodhi, Research Scholar, IKG-PTU Jalandhar , Punjab, India
Dr. Bikram Jit Singh, Professor (Mechanical Engg), MMU Sadupur, Ambala, India
Dr. Doordarshi Singh, Assoc Prof (Mechanical Engineering) , BBSBEC Fatehgarh Sahib, Punjab, India

MMU JOURNAL OF
MANAGEMENT & TECHNOLOGYA Bi-Annual Refereed Journal
January-June 2016 Vol.2 - Issue 1
ISSN: 2455-4456 (Online)
Maharishi Markandeshwar UniversitySadopur - Ambala (Haryana)
Phone: +91-171-2009201/02/03e-mail: [email protected]
www.mmambala.org

CHIEF PATRON
Shri Tarsem GargHon’ble Chancellor, MMU,Sadopur Ambala
PATRON
Prof.(Dr.) Harish SharmaHon’ble Vice Chancellor, MMU,Sadopur Ambala
EDITORIAL ADVISORY BOARD
Dr. Sucheta Upadhaya, Kurukshetra University, Kurukshetra
Dr. Kanwaljit Singh, Punjabi University, Patiala
Dr. Nilesh Kumar, Senior Scientist, CSIR-CSIO, Chandigarh
Dr. Rajesh Khanna, DAV University,Jalandhar
Dr. Dinesh Khanduja, NIT, Kurukshetra
Ms. Smita B. Patel, DMCE, Airoli, Maharashtra
Dr. Sehajpal Singh, GNDEC, Ludhiana
Dr. M. Syamala Devi, Panjab University, Chandigarh
Dr. Neeraj Nehra, Thapar University, Patiala
Dr. Vinay Kumar Gupta, UCOE, Punjabi University, Patiala
Mr. Pankaj Nagpal, Senior Manager, HCL Infotech Ltd., Noida
Dr. G.S. Batra, SMS, Punjabi University, Patiala
Mr. Mohit Gambhir, CEO,PYVERSE Technologies LLC,USA
Ms. Seema Jagtap, YRTCE, Kajrat, Mumbai, Maharashtra
Dr. H. S. Bains, PTU, Jalandhar
Dr. Manjeet Singh, Punjabi University Patiala
Dr. Karminder Ghuman, Thapar University, Derbassi Campus
Dr. Suresh Chadha, UBS, Panjab University, Chandigarh
EDITORIAL BOARD
Ÿ Dr. Manpreet Singh, Editor-in-Chief, Professor & Principal, Maharishi Markandeshwar University, Sadopur, Ambala.
Ÿ Dr. Sonika Chaudhary, Editor, Professor & HOD, Department Of Management Studies, Maharishi Markandeshwar
University, Sadopur, Ambala.
Ÿ Prof. Aradhna Jindal, Associate Editor, Principal MM School of Architecture, Maharishi Markandeshwar University,
Sadopur, Ambala
Ÿ Dr. Deepali Gupta, Associate Editor, Professor & HOD, Department Of Computer Science And Engineering, Maharishi
Markandeshwar University, Sadopur, Ambala
Ÿ Dr. Manoj Kumar, Associate Editor, Professor & HOD, Department of Applied Science, Maharishi Markandeshwar
University, Sadopur, Ambala
Dr. Ravi Kiran, Thapar University Patiala
Dr. Sandeep Garg, IIT Roorkee
Dr. Baldev Setia, NIT, Kurukshetra
Dr. Mukesh Kumar, TITs, Bhiwani
Dr. Amit Garg, DCRUST, Murthal
Dr. D. K. Gupta, Kurukshetra University, Kurukshetra
Dr. Rahul Rishi, MDU, Rohtak
Dr. Sandeep Sharma, GNDU, Amritsar
Dr. V.K. Katiyar, M M University, Mullana
Dr. Vanita Aggarwal, M M University, Solan
Dr. Dhirendra Singhal, DCRUST, Murthal
Dr. T. S. Sidhu, SBSCET, Ferozpur
Dr. Buta Singh Sidhu, PTU, Jalandhar
Dr. Mandeep kaur, GNDU, Amritsar
Dr. Lakhwinder Singh, GNDU, Amritsar
Dr. Satinder Kumar, Punjabi University Patiala
Dr. Manoj Kumar Sharma, Panjab University, Chandigarh
Dr. Gurcharan Singh, Punjabi University Patiala

Ÿ EMPLOYEE VULNERABILITY TO STRESS IN ITES-BPO COMPANIES OF INDIA: HOW TO
MEASURE, MANAGE AND CONTROL IT?
Dr. Rupali Arora, Associate Professor, Chandigarh University, Punjab, India.
Ÿ TO STUDY THE IMPACT OF BRAND ALLIANCES ON BRAND EQUITY: FOOD PANDA
Dr. Ruchi Jain, Amity School of Business, Amity University, Uttar Pradesh, India.
Ÿ WOMEN ENTREPRENEURSHIPIN INDIA: EMERGINGISSUES,CHALLENGES AND PROSPECTS
Dr. Rimpi Walia , Director, Patel Institute of Management & Technology, Rajpura, Punjab, India
Ms. Meenakshi Gupta Assistant Professor, E-Max Group of Institution, Badhouli, Ambala, Haryana, India
Ÿ A RESEARCH PAPER ON IMPACT OF E-MARKETING STRATEGIES ON BUYING BEHAVIOR
WITH SPECIAL REFERENCE TO APPAREL INDUSTRY: A LITERATURE REVIEW
Ms. Pallavi Dua, Assistant Professor, G.L. Bajaj Institute of Management and Research, Greater
Noida, India
Ÿ ARE SMALL CAP STOCKS VALUE CREATOR FOR INVESTORS? - AN EMPIRICAL STUDY
Mr. Jitin Gambhir , Assistant Professor (Finance), Galgotia University, India
Ms. Uma Luthra , Assistant Professor (Finance), Galgotia University, India
Ÿ SOME STUDIES ON DRILLING OF CHROME ALLOY STEEL
Dr. Harpreet Singh, Associate Professor and Dean, School of Mechanical, Materials and Energy
Engineering, Indian Institute of Technology, Ropar, Rupnagar, India,
Dr. Ravinder Singh Joshi, Associate Professor, Mechanical Engineering Department, MM University
Sadopur, Ambala, India.
Dr. Manoj Kumar Singla, Professor, Mechanical Engineering Department, CGC-CEC Landran, Mohali,
India
Ÿ RESEARCH METHODOLOGY FOR PERFORMANCE MODEL FOR VARIOUS OPERATING
SYSTEMS OF A THERMAL POWER PLANT
Mr. Subhash Malik, Ph.D. Scholar, Department of Mechanical Engineering, NIT, Kurukshetra, Haryana, India.
Dr. P.C.Tewari, Professor, Department of Mechanical Engineering, NIT, Kurukshetra, Haryana, India
Ÿ LEAN SIX SIGMA: A SYSTEMATIC APPROACH FOR WASTE MANAGEMENT
Mr. Harsimran Singh Sodhi, Research Scholar, IKG-PTU Jalandhar , Punjab, India
Dr. Bikram Jit Singh, Professor (Mechanical Engg), MMU Sadupur, Ambala, India
Dr. Doordarshi Singh, Assoc Prof (Mechanical Engineering) , BBSBEC Fatehgarh Sahib, Punjab, India
1 - 6
7 - 16
17 - 21
22 - 25
26 - 36
37 - 40
41 - 44
45 - 50
CONTENTS PAGE NO.

Employee Vulnerability to Stress in ITeS-BPO Companies of IndiaHow to Measure, Manage and Control It?
1Dr. Rupali Arora
Associate Professor, Chandigarh University, Punjab, India.1
Abstract: Workplace stress is natural and sometime inventible. It is the existing response of human under difficult environment. In fact, adequate amount of stress keeps a person motivated towards his work. However, high level of stress may cause completely opposite situations for a person. A good leader is who can identify the reason of stress in his employee and can eliminate the reason simultaneously. This research focuses on the level of stress among the employees of ITeS-BPO companies and its connection with the number of organizations worked earlier by a respondent. ITeS-BPO companies located at Delhi and NCR (National Capital Region) was the population for selecting the sample units. The target population of employees of ITeS-BPO include call-floor executives and operational managers at all levels but excluded back-end support staff from departments like HR and administration ITeS-BPO companies. This paper will help the manager to improve the management to minimize the stress in his organization or workplace. Since the competitive environment, technological advancement, HR Practices, economic development, social development are taking place every day the stress level of employees are increasing respectively. As a result, the employees are faced with the problems like pressure, strain, anxiety, tension, trauma which ultimately leads to decrease in productivity. Key Words: Job Stress, Burnout, Employee’s vulnerability, Information and Communication Technology, Call-floor executives, Stress-Tolerance potential.
I. INTRODUCTIONThe Business Process Outsourcing (BPO) sector is one of the fastest growing industries and in recent year has seen a steep growth in global market. India’s BPO industry is known for its huge workforce and giant turnovers. The rising rate of business culture in India has given rise to the corporate advancement in the country. BPO industry has gradually taken its important place in Indian economy because of its recent success in Indian market and it has also considerably changed the lives of the young workforce. In India 70% of young people is part of BPO industry. Due to which the young people are able to achieve their life goals at very young age. Since this industry strictly follows the policy of highly monitored work environment to achieve the ambitious industrial goals, as a result of this many also suffers from the high level of stress in this industry. This strict environment causes employee “burnout” over a period of time. Doing the same task again and again like answering phone calls more than 100 times a shift has resulted in employee attrition and employee absenteeism in young workforce. There are occasions when employee might also experience physical and emotional difficulties in the organization and causing the employee to suffer from panic attacks, depression and other psychological problem including insomnia and eating disorders.BPO sector in India has been quite promising in recent years and proving to be India’s most successful Industry with a growth rate of 45 percent since it first started. BPO industry is one of the rapidly growing industries with a strong momentum. BPO sector has created millions of jobs. Due to availability of skilled workforce and resources at very affordable price many BPO companies have chosen India their place for BPO operations. There is another side of the BPO which is not visible easily unless examined carefully and has caused the young workforce to lose out in BPO industry.BPO organizations are commonly known as call centers. Most BPO organizations follow the international timings (US and UK) and work usually during late hours. Therefore most of the BPO companies work in night shift starting form 6:00 pm to 2:00 am and ending after 8-9 hours of shift. Sometime there are much odd timings known as “graveyard shift” which start from 4 a.m. working in such timings have adverse effect on the health of the Indian youth.
Market Size of IT Industry in India
Figure 1: Market Size of IT Industry in India (Source: http://www.ibef.org)
The BPO and the technology sector (including hardware) in India is estimated to have generated around the US$ 146 billion in revenue during the FY 15 from the US$ 118 billion in FY14 with a growth rate of 23.72 per cent.Ÿ The contribution of IT sector to the Indian GDP has rose
significantly from 1.2 per cent in FY98 to 9.5 per cent in FY15.
The reason for this rapid growth is the rapid development in the e-commerce business and deep penetration of internet in the Indian market. The significant development in IT sector has attracted a lot of investment from other countries.
1.

II. LITERATURE REVIEW
Stress is unavoidable in workplace. Stress however cannot be completely taken for negative. In fact, Hicks & Caroline (2007) said that the stress is a mental reflex towards the various aspects of environment a person lives or works in. They further mentioned that the stress can also act as a motivator. But high stress level can cause serious problems and can bring down the productivity. It is mostly seen that stress can significantly depreciate the physical and emotional health of the victim.The word stress is derived from the Latin word “stringere” which means “to be drawn tight”. The term stress has been comprehensively defined by Selye (1956) as “an adoptive response to the external situation that results in physical, psychological, and/or behavioural deviation for organisational participants”. It is the body’s reaction to a change that requires a physical, mental or emotional adjustment or response. Stress is a subjective feeling or tension experienced in the physical, mental and / or emotional realms as a response to environmental events that are perceived as threatening. Kyriacou (1978), on the other hand, defines stress as “a response syndrome of negative effect that develops when there are prolonged and increased pressures that cannot be controlled by the coping strategies that the individual has.”Teber’s Cyclopedia Medical Dictionary defines stress as “The result produced when a structure, system or organism is acted upon by forces that disrupt equilibrium or produce strain.”Thus job stress can be defined as the harmful physical and emotional responses that occur when the requirements of the job don’t match with capabilities, resources or needs of the employee. Stress becomes distress when an individual begin to sense a loss of feelings of security and adequacy. Burnout is a severe stage of distress wherein a person is emotionally exhausted, lacks work motivation, and has no energy or enthusiasm for the job. Burnout is primarily due to a lack of personal fulfilment in the job or a lack of positive feedback about performance. Addressing or managing stress within an organization is a process that deserves planning and commitment on the part of the management team and is not something that will happen overnight. The theoretical, conceptual, and literature input makes clear that without satisfied and supportive employees, an organization cannot realize improvements in operations, customer service, or any other profit generating initiative. Jick and Mitz (1985) conducted a very well cited review of the empirical evidence of sex differences in stress. Nineteen studies were reviewed and in these studies women tended to report higher levels of psychological distress than men. The authors suggest that men and women are likely to be exposed to different stressors, and that gender moderates the relationship between stressors, the appraisal of stressor and coping and the relationship between coping and strain. Savery and Wingham(1991) in a study of directors of child care centres, reported that intrinsic motivators such as ‘interesting and challenging work’ and ‘feeling of achievement’ were important to their satisfaction in comparison with the ‘salary’. Bharati T., Nagarathnamma B., Viswanatha Reddy S. (1991) have investigated the conceptualization and measurement of occupational stress and the relationship with & effect on job satisfaction. The total sample consisted of 90 clerical cadre employees of three different business and service organizations. The obtained data were analyzed using t-test, chi-square test, coefficient of correlation and Duncan’s Range test. Occupational stress was found to be negatively correlated to job satisfaction- the greater the stress the lower the satisfaction. Hence it was concluded that occupational stress among employees negatively affects the level of job satisfaction. Upinder Dhar and Birwa Arora July (2001) made their investigation into the nature of relationship between convergent – divergent thinking, job satisfaction, experience and job stress. The job stress is a result of several factors. Change in life styles and breaking down of traditional value systems, work being increased; work deadlines and high level of competitiveness within and among organizations are among a few causes. Overall, the findings of the study provided considerable support for the conceptualization of relationship between job stress and employee satisfactionMehra Payal (2004) conducted a research with the primary objective to determine stress levels across age, profession, and type of job, and duration of work. Two questionnaires were devised to collect data in a scientific manner. Among the various findings of the study, the paper led to the very important perspective that profession and type of job definitely impact upon the work stress that an individual suffers from. Stress is not age specific it can occur to any individual irrespective of age. At the end the author also suggested five steps which will help an individual to reduce his/her stress level in specific and to the organisation in general. Vanitha V. et al (2006) made a study to analyze the organizational commitment and stress among the IT (Information Technology) professionals. Differences between male and female IT professionals were also examined in this regard. Results, based on the study of various variables, revealed that organizational commitment and stress among IT professionals is high and that gender and experience of the professionals do not influence these factors.Khalid A. (2012) found that there is a simple and straightforward relationship between stress and job performance in an organization. It is essential for the members of organization to show their support towards the employee for him to improve his performance. A supportive leader and team member can significantly improve the performance of an employee in difficult situation.P.S. Swaminathan & Rajkumar S (2013) conducted a study that focused on the level of stress faced by the employees which involved people of different age group, profession, varieties of work, duration or working hours and environment they work in. Stress is still a topic which is not often discussed by the people. This study indicates the appropriate level at which an employee can perform at his full potential. The study brings out three conditions responsible for work related stress.1) Role Overload 2) Role Self-distance 3) Role Stagnation.
2.

III. NEED AND OBJECTIVES OF THE STUDY
Addressing or managing stress within an organization is a process that deserves planning and commitment on the part of the management team and is not something that will happen overnight. Many companies make an effort to address specific elements related to this issue, but very few actually analyze every component to ensure a comprehensive approach for managing this aspect. Stress has become a common phenomenon of our daily work life. It is one of the most important factors influencing individual efficacy and satisfaction in modern day occupational settings. This paper focuses on the impact of number of organizations worked earlier in managing employee vulnerability to stress among the employees of the ITeS-BPO Companies. In order to find out the reliability of the scale used for measuring the response Cronbach’s Alpha has been calculated. The reliability estimate (Cronbach’s Alpha) is 0.951, which is considered quite satisfactory.
IV. RESEARCH METHODOLOGY
“The Truth is that outsourcing is no longer a choice but an absolute strategic necessity”, says chief of an ITES-BPO Company-Azim Premji. A study done by NASSCOM (National Association of Software and Service Companies)-McKinsey study ‘Indian IT Strategy Summit’ reveals that year -by- year the size of BPO industry in India is increasing because of the high business potential from the ITeS-BPO Companies. The growing figure of the number of people employed is indicative of the growth trends w.r.t to employment being provided by ITeS-BPO companies.
The literature review has indicated that a key business priority for organizations across the entire knowledge sector world-wide today, is to attract and retain talent to address exponential opportunities for growth that are coming their way. In the Information Technology Enabled Services-Business Process Outsourcing Industry, this is further accentuated by a combination of factors that include the type of work and work timings, a demand –supply gap in employable talent and their consequent mobility coupled with stringent performance criterion and specific characteristics/needs of the employable workforce. So even as an employing company focuses on meeting customer and stake-holder objectives and being globally ‘best in class’, it needs to also redouble its focus to understand the special needs /objectives of its knowledge employees so as to control their stress levels or to reduce the employees vulnerability to stress and initiate action that address core issues.
V. HYPOTHESIS
H0: The extent of vulnerability faced by employees due to stress does not vary across groups categorized on the basis of number of organizations worked earlier.
VI. RESEARCH DESIGN
The present study is undertaken to study the Employee vulnerability due to stress from ITES-BPO Companies and finding out the relationship of the same w.r.t to gender and age of the respondent. In order to study this, the descriptive research design of investigation coupled with techniques of various statistical techniques like ANOVA, and t –test was used. Seventeen items were used to measure the major effects of the work pressures in terms of behavioural and a health outcome for employees in ITES-BPO Companies. A 5-point Likert scale (where Never= 1 and Almost Always= 5) was used to measures the vulnerability caused to employees of an ITES-BPO company. The Cronbach’s Alpha (α) of these 17 statements was 0.951.The raw data was then exported to statistical package for social sciences (SPSS) Data Editor 16.0 for further analysis. In order to analyze the data accrued from this research, descriptive analysis, ANOVA, and t-test was used.
VII. SCOPE OF THE STUDY
ITeS-BPO companies located at Delhi and NCR (National Capital Region) was the population for selecting the sample units. Hence the survey was limited to Delhi and NCR. The target population of employees of ITeS-BPO include call-floor executives and operational managers at all levels but excluded back-end support staff from departments like HR and administration. ITeS-BPO companies of each size (i.e. small, medium and large) were considered for this survey.Number of organizations worked earlier wise analysis of dimensions of vulnerability caused to employees due to stress while working in an ITeS-BPO company is showed in Table 1.
3.

Vulnerability to various
dimensions due to stress
Got tired very easily
Have become short
tempered.
Smoke, drink or eat more
than you should.
Feel mentally exhausted
Have been bothered by
shortness of breath
Lack sound sleep at night
Are unable to respond
despite having clear answer
Productivity has reduced.
Feel restless during your
daily routine.
Find that you are becoming
forgetful or indecisive
Suffer from unexplained
aches and gastric related
problems.
Want to be left alone.
Have developed any
particular physical or health
problem
Feel exhausted at the end
of the day.
Feel lonely
Find yourself dreaming
during your work.
Find yourself becoming
bored.
None One TwoThree or
moreF-value P-value
2.71
2.54
1.85
2.40
2.22
2.58
2.32
2.18
2.52
2.28
2.37
2.63
2.28
2.47
2.31
2.07
2.39
2.61
2.32
2.03
2.35
1.98
2.09
2.17
1.85
2.40
2.05
2.22
2.19
2.02
2.42
2.42
1.97
1.98
2.77
2.75
2.58
2.53
2.34
2.48
2.48
2.29
2.49
2.40
2.27
2.58
2.28
2.71
2.65
2.56
2.47
2.65
2.65
2.50
2.46
1.92
2.27
2.12
2.15
2.46
2.31
2.32
2.24
2.28
2.44
1.88
2.44
2.28
.396
2.760
7.014
.470
2.096
3.384
1.602
2.597
.197
1.642
.320
3.111
1.090
1.186
4.157
5.104
3.302
.756
.042
.000
.703
.100
.018
.188
.052
.898
.179
.811
.026
.353
.315
.006
.002
.020
Note :(I) All figures, except F-values and P-values are mean values, df= 3/424
Table 1: Number of Organizations Worked earlier-wise comparison of Dimensions of Vulnerability to Stress
4.

As observed from the analysis given in Table 1, that irrespective of the number of organizations an individual has left earlier or has worked earlier with, the dimension of ‘getting tired easily’ has been accorded the highest mean score in each of the four groups. The mean value of 2.71 for the group of respondents who have left no job, 2.61 for the group who has left one job, 2.77 for respondents who have left two jobs, and mean score of 2.65 for the group of respondents who have left three and more organizations reflect that employees of each of the four groups experience moderate level of stress.The Table shows that for the respondents who have left no organization earlier the lowest mean value of 1.85 is found on the dimension ‘smoking, drinking or eating more than one should’. The group who has left one job earlier, the lowest mean value 1.85 is obtained on the dimension ‘productivity has reduced’. Respondents in the category who have worked with two organizations earlier have accorded the lowest mean value (2.27) to the dimension of ‘suffer from unexplained aches and gastric related problems’. For the last group of respondents that is the employees who have worked with three or more organizations earlier, the dimension of ‘feeling lonely’ has the lowest mean score (1.88).ANOVA test has been conducted to find out whether there exists any significant difference in the mean values of each of the dimensions of vulnerability caused to employees due to stress across the four ‘number of organizations worked earlier-wise’ groups of employees working in ITeS-BPO companies. The variance analysis presented in Table through ANOVA test shows that there is significant difference in mean scores of dimensions viz.’ have become short tempered’, ‘smoke, drink or eat more than one should’, ‘productivity has reduced’, ‘want to be left alone’, ‘feel lonely’, ‘ find yourself dreaming during your work’, ‘find yourself becoming bored’, and ‘lack sound sleep’. The f-values of each of these dimensions is significant at 5 percent level, df=3/424. In case of each of remaining dimensions viz. ‘got tired easily’, ‘feel mentally exhausted’, ‘have been bothered by shortness of breath’, ‘unable to respond despite having clear answer’, ‘feel restless during daily routine’, ‘becoming forgetful or indecisive’, ‘suffer from unexplained aches and gastric related problems’, ‘have developed any particular physical or health problem’, ‘feel exhausted at the end of the day’, F-value turns insignificant at 5 percent level. Thus, no significant difference has been found in mean score of four employee groups on each of these dimensions i.e. the employee shows an equal level of vulnerability caused to them due to stress on each of these dimensions.
VIII. CONCLUSION
The results of number of organizations worked earlier-wise analysis of dimensions of vulnerability to stress shows that there is significant difference in the mean scores of dimensions viz. ‘have become short tempered’, ‘smoke, drink or eat more than one should’, ‘productivity has reduced’, ‘want to be left alone’, ‘feel lonely’, ‘find yourself dreaming during your work’, and ‘find yourself becoming bored’. Out of these dimensions employees in the group having worked earlier with two organizations have got the highest mean score. Thus, this group is quite vulnerable to stress. However, the employees show an equal level of vulnerability to stress on each of the remaining dimensions. Companies should explore in detail the causes due to which employees get tired very easily and thus become vulnerable to stress. Appropriate measures should be taken that may include time management, physical exercises, yoga, and meditation. Also, an organization through establishment of health clubs, creating a supportive organizational climate, and by providing comfortable working conditions can help employees in coping with this dimension.Number of organizations worked earlier-wise analysis has exhibited that employee who have worked with ‘Two’ organizations earlier are more vulnerable to stress than the employees in the other three groups. Hence, ITeS-BPO companies should focus coping measures on this group in order to lessen their feeling of loneliness, boredom, day dreaming, and short temperament etc. A workplace stress has serious consequences in term of emotional and physical health and it usually happens when there is compromise between job and expectation, capabilities, resources, work environment, technological environment, technological advancement, HR practices and social development taking place day by day. When an employee is asked to work for the longer duration, and ask to work on multiple tasks, the employee might get mental and physical fatigue from high stress which ultimately can be the reason for many stress related problems like strain, anxiety, pressure and tension. This becomes the reason for low productivity and lack of interest at the work. In such cases the BPO companies should take responsible steps to minimize the stress level among its employee. It can be done by adapting stress reducing technique like muscle relaxation, bio feedback, meditation, cognitive restructuring, time management, employee assistance programme and wellness programme.
REFERENCES
[1] Alinoor, Rehman (1994), “Job Satisfaction of Garment Industries Supervisor of Bangladesh”, Management Development, Vol. 29, No. 1, pp53-59.
[2] Anu Singh Lather and Shilpa Jain (2005), “Motivation and Job Satisfaction: A Study of Associates of Public and Private Sector”, Delhi Business Review, Vol.6, No.1, pp77-84.
5.

[3] Anupama D Raina (2006), “Management of Call Center-Boredom, Employee Attrition and Retention”, The ICFAI Journal of Organizational Behaviour, Vol. 12, pp 34-39.
[4] Anju Mehta, Achilles Armenakis, Nikhil Mehta and FeruzanIrani (2006), “Challenges and Opportunities of Business Process Outsourcing in India”, Journal of Labour Research, Vol. xxvii, No.3, pp323-337.
[5] Apte, Uday and Mason, Richard, (1995), “Global Disintegrate of Information-Intensive Services”, Management Science, Vol.41, No.7, pp1250-1263.
[6] Afsheen Khalid (2012), “Role of Supportive Leadership as a Moderator between Job Stress and Job Performance”, Information Management and Business Review Vol. 4, No. 9, pp. 487-495.
[7] Bhide, S., Vani, B.P and Rajeev, M (2005), “Outsourcing Business Processes to Offshore Location: the Indian Experience”, Paper presented at the 30th Annual Conference of the Federation of Asian Economic Association, Manila.
[8] “BPO Industry must Overcome Challenges” (September 8, 2003), The Hindu Business Line.[9] Callaghan G., Thompson P. (2001), “Edwards Revisited: Technical Control and Call centers”, Economic and Industrial
Democracy, Vol. 22, Issue 1, pp13-37.[10] Cooper, L. C. & Payne, R., (2008) “Causes, Coping and Consequences of Stress at Work”, New York: Wiley.[11] Crandall, R. &Perrewe, L. P., (2005) “Occupational Stress: A Handbook”, New York: Taylor & Francis.[12] D.G. Prasuna (2003), “BPO: Sustaining the Competitive Advantage”, Chartered Financial Analyst, p.1.[13] Deepak Shikarpur, (2004), “BPO Digest”, Ameya Inspiring Books, Pune.[14] Dr. Zafrul Allam, (2007), “Stress among Call Center Executives: An Empirical Study”, HRD News letter, Vol.22, Issue
10, p 281. [15] Fried, M. R., (2008)’ “Stress Management for Success in the Workplace” London, Oxford University Press.[16] Government of India, Ministry of Commerce and industry (URL://http://commin.nic.in).[17] House, R.J (1971), “A Path goal Theory of Leader Effectiveness”, Administrative Science Quarterly, Vol. 16, pp321-338. [18] Hicks, T. & Caroline, M., (2007), “A Guide to Managing Workplace Stress”, California: Universal Publishers.[19] Hulin C.L. and Smith P.C, (1964), “Sex Differences in Job Satisfaction”, Journal of Applied Psychology, Vol.48, pp88-92.[20] India’s Software Edge, (2nd December 2003), The Economic Times, New Delhi.[21] Indian IT Industry: NASSCOM Analysis Report (2007), (URL:http:/www.nasscom.in)[22] Indian ITeS-BPO Industry: NASSCOM Analysis Report (2006-07), (URL:http:/www.nasscom.in).[23] Jick TD, Mitz LF. Sex Differences in work stress (1985), Academy of Management review, Vol.10: pp408-420.[24] Krohne, W. H., (1993), “Vigilance and Cognitive Avoidance as Concepts in Coping Research”, Seattle, WA: Hogrefe &
Huber.[25] Long, B. C. (2006)’ “Aerobic Conditioning and Stress Inoculation: A Comparison of Stress Management
Interventions”, Cognitive Therapy and Research, Vol.8, pp517-542.[26] Mehra Payal, (2004), “Study on stress Levels in Organisations and Impact on Employee Behaviour”, IJTD Journal,
Vol.xxxiv, No.1, pp.91-101.[27] Nelson DL, Quick J.C. (1985), “Professional Women: Are distress and disease inevitable?” Academy of management
review, Vol.10 pp: 206-218.[28] Nolan, M. (2009), “Top Ten Sources of Workplace Stress and How to Fight Them”, Retrieved from (Accessed on 11th
October, 2013).[29] Patel M K (1998), “A Study of Organizational Health and Organizational Commitment among Industrial Employees”
Journal of the Indian Academy of Applied Psychology, Vol. 24, No. 1, pp63-79.[30] Singh, Hira and D.H. Pastonfee (1991), “Job Involment, Sense of Participation and Job Satisfaction-A Study in
Banking Industry”, Indian Journal of Industrial Relations, Vol. 9, No. 2, pp263-379.[31] Srivastava A.K. and A. Krishna (1993), “Employees Job Involvement and Monetary Benefit in Public and Private
Sector Organizations-A Comparative Study”, Indian Journal of Industrial Relations, Vol. 28, pp78-80.[32] Swaminath P.S, Rajkumar S. (2013), “Stress levels in Organizations and their Impact on Employees’ Behaviour”,
BVIMR Management Edge, Vol. 6, No. 1 PP 79-88.[33] Savery L.K. and Wingham D. (1991), “Coping with the Career Plateau: Motivators for Directors for Child Care
Centers”, Leadership and OrganizationDevelopment Journal: Vol.12, pp20-23.[34] Urska Treven, Sonja Treven and Simona Sarotar Zizek, (2011), “Effective approaches to managing stress of
employees”, Review of Management Innovation & Creativity, Volume 4, Issue 10, pp. 46-57. [35] Vineet, V. S., (2011), “Stress: coping Mechanisms in the Workplace”, Retrieved from <
http://voices.yahoo.com/stress-coping-mechanisms-workplace-8686963.html > (Accessed on 10th October, 2013).[36] Vanitha V., Vasanthi M., Kamalanabhan and Sivasabramanian T.A. (2006), “A Study on Organizational Commitment
and Stress among Information Technology Professionals”, The ICFAI Journal of Organizational Behaviour Vol. 2(4).[37] Weiss, T. W., (2012), “Workplace Stress: Symptoms and Solution”, Retrieved From. (Accessed on 10th October, 2013).
6.

To Study the Impact of Brand Alliances on Brand Equity: Food Panda1
Dr. Ruchi Jain1Amity School of Business, Amity University, Uttar Pradesh, India.
Abstract: Purpose – The purpose of this paper is to analyze the result of brand alliances where the brand tries to acquire other unknown and smaller brand to increase the market share and customer database in terms of brand, trust company’s brand equity and customer’s acceptance. Methodology – suggested methodology was reviewing the activities and acquisitions by food panda, and its impact on brand image.Findings – Food panda has become one of the leading companies in the online food delivery business in south east continent and also planning is the Google of food industry in few years. Limitations – The Company has only acquired the well established companies in the particular segment to brand itself but when they stop getting funds, they will face a big problem in establishing themselves in a new market. Keywords: Brand Alliances, Brand Equity, Customer Behaviour, Strategic Alliances
I. INTRODUCTION
Building brand is very important these days. It is because consumer recalling the brand shows how much consumer is aware about the brand. The brand has to do a lot of marketing through sponsorships, paper ads, bill boards, and so on. The building brands has become important for consumers because whenever any consumers’ been asked to name any companies in any specific industry they only list on those brands which they use in their day to day life. The sequence which they mention the brands is their priority. The brand’s expanding operations can be measured in terms of their revenues. The brands equity can be a very important factor in brand alliances.
Brand equity
Brand equity is a premium value that any firm generates from their offerings under a name. Companies have to develop brand equity so that their audience can easily recognize and can trust the company and their offerings to satisfy their needs. Marketing campaigns and sponsorships helps a lot to develop the brand equity of any firm. There are three components of the brand equity.
1. Consumer perception2. Effects3. Value
Consumer perception is very important for the company to know and to develop in benefit of the company. Now the consumer perception built on the basis of their interaction of the company and their knowledge with the company. Food panda has tried to delight the consumer at first by offering discounted food rates available at their door step. And there is also a timer set by the food panda which is like a count down after which your food will be at the door step. The experience of the consumer may be positive or negative depending upon which food panda’s brand equity has been developed over time. When the consumer has experienced the offering of the food panda, they may have positive or negative mindset for the company depending on their first interaction with the company. If the experience is positive, the company will get both tangible and intangible benefits from the customer. Tangible can be the monetary value that will help the company to generate revenue and earn some decent profits, an intangible value in term of goodwill and positive word of mouth marketing for the company. In both the case the company gets benefits and develops their brand equity. If the consumer has bad experience with the offerings of the food panda, they will suffer in both ways i.e. tangible and intangible ways. In tangible way, the consumer will never order from food panda in future which will decline the profits of the company in long term. If we see the intangible part then the targeted audience of the food panda will spread the negative word of mouth and this will also in turn in negative brand equity. Now depending upon these experiences that the customer has built the brand’s value. The positive experience will create the positive value for the company and vice versa is also true. Measuring brand equity of food panda can be done through the experts from both academic and profit companies expert. Many industrial experts have made their own brand equity methods to calculate their brand equity. There is difference in how the companies calculate their brand equity but they apply common concept which says that the knowledge about the brand in the mind of customers becomes the main principle of calculating brand equity.
7.

Methods to calculate brand equity:-1. Quantitative 2. Qualitative 3. Comparative
Qualitative Research- It refers to a technique which is relatively unstructured approach where the range of possible consumer’s responses is allowed. The various methods are
a) Free association – The task is to find the number of possible brand associations in this case it is food panda. The service attribute can become food panda’s strength or unique composition by which any consumer associate the brand.
b) Projective techniques – It is a tool that helps the consumers to reveal its true feeling or opinion about the food panda when they cannot express it properly. Example can be Rorschach test.
Quantitative Research – It is usually the scale type questions where numerical representation helps the company to get its data exactly. It includes brand awareness and brand image.
a) Brand awareness – It is like a game where memory has been tested to see how much can the consumer are aware about the brands. Like name 5 bottle companies. Brand recall and brand recognition is the part of the brand awareness. Any word, image or anything given to the consumers, did they relate those things with the brand or not?
b) Brand image – It refers to a real identity of what consumer think about any brand. It is directly related to the brand equity.
c) Brand relationships – It can only be done with the help of brand resonance(Keller brand equity model) based on some dimensions i.e.1. Behavioral loyalty 2. Attitudinal attachment 3. Sense of community4. Active engagement
Comparative Methods – It is a study that is been conducted to know more about consumer behavior and attitudes towards the food panda. Approaches are brand based and market based.
a) Brand based – Customer may understand the food panda’s marketing activity along with its competitors. All the competitors are doing their own call to actions and making strategies to attract new customers. It is important to know how customers evaluate brands. These approaches help to understand consumer brand preferences.
b) Marketing based – It is used to find out the consumer responses with respect to change in marketing campaign.
Brand alliances Brand alliances refer to the mutual agreements between companies where there work together to achieve the common goal. The alliance may be for the short term according to the terms and conditions of the alliances. The companies are using resources of both the companies in common goal or brand development and growth. In brand alliances, it helps the companies help to improve their product quality and services which is mostly unobservable by the consumers but effective in retaining the consumers. Though most of the strategic alliances these days are proven to be benefitted and had a competitive edge in the industry.Brand alliances are getting popular nowadays because of the rage of start-up started in India and the government has equally supported this companies. A brand alliance usually means that the one brand works with other brand maybe in the form of tie-ups or strategic alliances. It is used to overcome the difficulties of either brand or to expand the market segment or product line depending on the capabilities of the firm (food panda). Nowadays brands like food panda have become one of the most valuable assets in online food industry which can be merged or through acquisition can convince even larger set of the customer. Both the brands work for the mutual benefit and improving the brand name in the form of brand awareness, brand image, brand recognition and so on in the eye of their targeted customers. The research paper will study the end results that the food panda has achieved by acquisition and how what could be the future strategies? It also helps to identify that:-
1. It can improve the brand image of the firm and add new products to its portfolio.2. The brand is upgrading or degrading. 3. Improves the attitudes of both the partner brand.
Since after the alliances, the brand has different aspects in terms of characteristics, and beliefs about the brand. Food panda has acquired just Eat, tasty khana in India. Delivery.com and Koziness in Hong Kong, EatOye in Pakistan, Food Runner in Malaysia and Singapore, City Delivery in Philippines, Food by Phone in Thailand. All this acquisitions helped the company to tap the market and to get an additional edge in the competition.
About company Food panda, an online food ordering business is one of the most successful businesses today. The company has global presence in over 40 countries. In India the company has tie-ups with over 4000 restaurants. In metropolitan cities like Delhi,
8.

Mumbai, Hyderabad, Bangalore the company mostly targets to the students who has always craving for the food. With more exciting offers, the company tries to motivate its audience for orders. The company has more tie-ups than its competitors. An individual can also support the company by asking them to list their favorite restaurants if not listed. Like this way also the company is expanding its penetration level in Indian market. The company is also asking for consumer support to serve well by asking their favorite restaurants in case they are not listed in their data base. The company offers fresh offers every month which has resulted in presence in 16 countries within the year of their operation has started. Food panda has partnered with some of the big brands which have given them a great lead. Big brands like
1. Dominos2. Pizza Hut3. Subway4. Nirula’s 5. Basin Robin, etc.
And the list goes on. The partnering with these brands help to target all the branches of this brand situated at various places. They has smarty move the market from ordering food through phone or asking the restaurant for the take always to ordering food through the smart phone. A very common question every company ask itself i.e. where do they stand in the next 5 years of time? Currently food panda wants to be the Google of online food ordering and this is the reason they are expanding their presence globally. With this objective in mind, the company is taking the entire necessary step for building its brand. The social media campaign has also been quite a helpful in building the brand. Building brand as well as generating lead is not that simple. If we talk about recent tie-ups, food panda has join hands with Indian Railway Catering and Tourism (IRCTC), where the customers can order their favorite food. The customers need to order two hours prior to the travel. While food on track which earlier used to serve on trains has decided to serve the metro cities and has a lot of tie-ups with itself. They are as follows:-
1. KFC2. Dominos3. Street foods4. Wimpy5. TFS6. Jan Aahar7. Ratna Café8. Mio Amore9. Alibaba10. Hello Curry
The starting of this year the company has faced a lot of troubles and the company started to search a buyer for very less price of approx. 10-15 million. The Indian operations of the company was not going good and started talking with its competitors to sell themselves. Both the zomato as well as swiggy has refused to buy the company and now the company has decided to rise and touch the sky and now the food panda has again gained its re owned position and giving tough competition to its competitors.
Addressing or managing stress within an organization is a process that deserves planning and commitment on the part of the management team and is not something that will happen overnight. Many companies make an effort to address specific elements related to this issue, but very few actually analyze every component to ensure a comprehensive approach for managing this aspect. Stress has become a common phenomenon of our daily work life. It is one of the most important factors influencing individual efficacy and satisfaction in modern day occupational settings. This paper focuses on the impact of number of organizations worked earlier in managing employee vulnerability to stress among the employees of the ITeS-BPO Companies. In order to find out the reliability of the scale used for measuring the response Cronbach’s Alpha has been calculated. The reliability estimate (Cronbach’s Alpha) is 0.951, which is considered quite satisfactory.Addressing or managing stress within an organization is a process that deserves planning and commitment on the part of the management team and is not something that will happen overnight. Many companies make an effort to address specific elements related to this issue, but very few actually analyze every component to ensure a comprehensive approach for managing this aspect. Stress has become a common phenomenon of our daily work life. It is one of the most important factors influencing individual efficacy and satisfaction in modern day occupational settings. This paper focuses on the impact of number of organizations worked earlier in managing employee vulnerability to stress among the employees of the ITeS-BPO Companies. In order to find out the reliability of the scale used for measuring the response Cronbach’s Alpha has been calculated. The reliability estimate (Cronbach’s Alpha) is 0.951, which is considered quite satisfactory.
9.
II. OBJECTIVES OF THE STUDY
1. To study the growth of brand through brand alliances.2. To study the increase in brand equity.3. To analyze the consequences of brand alliances
III. LITERATURE REVIEWBuilding brand through brand alliances: combining warranty information with a brand allyXiang Fang, Bashar S. Gammoh, Kevin E. VossThis research paper talks about the signals that can be viewed as the different levels of information which has different implications for both parties in terms of their transactions basically the companies tries to enhance their market reach and it can be done through brand alliances. The research methodology which was incorporated was hypothesis where 174 students participated for the experiments and the results was that both the brands warranties and alliances were important. Using a brand ally without any information, warranty or both can help to increase the consumer’s perceived quality of the unknown brand. Major drawback of this paper was that the study was conducted only across one product category in case of multiple product categories this is not useful. Brand alliances Neil Barger, Paul Hemingway, Mike underwood, Jami Velker and Emily WintersInitially it was started for short term as a tool to promote both the company’s products and services but today used as a strategy for growth and development. There are many examples of successful brand alliances but reasons of failure are utilizing of resources, proper integration, common goals, Policies issues, and many more. Careful planning before alliances helps to achieved desired goal. Also customer’s attitudes towards brand alliances should be evaluated and the comfort level with both the brand should be known which helps to develop value to customers after alliances. Alliances brands: building corporate brands through strategic alliances?Hong \-Wei He and John M T. BalmerThe case were all about the alliances in airlines industry which provides them economies of scale, access to landing slots and also a way to attract foreign clients. It has been found that many benefits are associated with the corporate brands. It helps in increasing customer attractiveness, visual recognition, product support, investor confidence and so on. Exploratory research has been used in this case and both primary and secondary research has been used. Interview of various senior managers of Airlines Company was used as primary source of data. Several issues were discussed i.e. vision, brand delivery, and brand status. Along with this, some managerial issues and research issues were also discussed. Alliances between traditional and modern airlines company can benefits both but there are many challenges to face. Industrial reviewThe technology is rising at a very fast pace, and with the changing technology, people mindset as well as the way they make decisions for anything has also changed a lot. Nowadays people have various options to order the favorite food that anyone wants to have with all the convenience and cash back offers. All the online food companies like food panda, zomato, swiggy, and others are influencing the way people order their daily meals even their snacks. With the rise in the penetration of internet, the above image clearly shows that rising internet penetration has increased so much in India in past few years and expected to go 314 million users in 2017. This has given a clear opportunity that the online food industry has a great sign of earning good profits once the customers are convinced with them and start relying on them. The market has huge potential especially in tier 1 and tier 2 cities where the demand and the awareness about all this are quite high as compared to the other tier cities. Some cities like Delhi, Noida, Chandigarh, Pune and many more has start adopted the way of ordering food online which delivers the food at the doorstep with various offers. Along with this the people also have different food cuisine preference where north region people has more towards Italian food and pizza’s where as people living in the south has the preference of fast food like Chinese dishes. Big companies keep track of all this while making big decisions and they try to make their customer database big and try to take a competitive edge to fight as well as to survive in all the given situations. All the companies like food panda, zomato and others has claimed that they are not competing with the big MNC’s like KFC, Dominos, etc. instead they includes their menus as well. Investors are also realizing the growing opportunities in food and this is the reason the total money investors has put in food related start-ups are around $2.8 billion. The Global chief brand officer has stated that –“The millennial generation has a wider range of choices than any generation before them”. This has given rise to another opportunity where a new type of food start-ups and even online food delivery start-ups has been raising so much. In India, tasty khana is focusing on providing tasty food from customers’ favorite restaurants at their seat in the train by giving small details to them and when the desired station comes, the person will be standing outside the train with your order. After the election, the start-up campaign by prime minister has motivated so much that many food based start-ups has been started to fulfil the needs of Indian market some with small scale and others with big or medium scale. The following data would give a small brief about the food industry start-ups with the approximately figures of amount the company has raised till date.
11.

Sr. no.
1.
2.
3.
4.
5.
6.
7.
8.
9.
10.
11.
12.
13.
Company Name
Yumist
FRSH
Holachef
Spoonjoy
iTiffin
Tiny owl
Faaso’s
Food Panda
Eatlo
Tasty khana
Just eat
Delivery chef
Bite club
Amount Raised till date (in $)
1 million
618 K
320 K
Not revealed
1 million
20 million
20 million
147.3 million
No funding
5 million
89.1 million
Not revealed
500 K
Table 1: Food Industry Start-up amount raised
Grinnell (1993), “Research is a structured inquiry that utilizes acceptable Scientific Methodology to solve problems and creates new knowledge that is generally applicable”.Kerlinger (1986), “Scientific Research is a Systematic, Controlled Empirical and Critical Investigation of Propositions about the Presumed Relationships about various Phenomena”Research MethodologyResearch methodology is a way to systematically solve the research problem. It may be understood as a science of studying how research is done scientifically. So, the research methodology not only talks about the research methods but also considers the logic behind the method used in the context of the research study.Research DesignExploratory research is used in this study because it the research is entirely theoretical and the data which was collected is secondary and it will also ensure the minimization of bias and maximization of reliability of data collected. From the study only, the type of data to be collected and the procedure to be used for this purpose were decided.Limitations of The StudyAs the study is based on secondary data, the inherent limitation of the secondary data would have affected the study. The figures of various events which were presented on the report with their data are likely to be a least several months out of date, and so might not give a proper indication of the company’s current position. This study need to be interpreted carefully. They can provide clues to the company’s performance. But on their own, they cannot show whether performance is good or bad. Sources of Data collection:Secondary data:
1. Case studies2. Information collected from internet.
ScopeThe study has got a wide & fast scope. The food industry has huge scope due to rising penetration of internet on mobile phones and the customers are started trusting food companies and started ordering online due to its attached benefits.
II. RESEARCH METHODOLOGY
(Source: I am Wire research, 2015)
12.

Food panda acquisitionsFood panda has acquired several brands which was doing extremely well in that particular segment and has increased the consumer database, improved services as well as profits to a great extent.List of companies’ food panda has acquired along with the country in which they were operating independently.
III. DATA ANALYSIS AND INTERPRETATION
Sr. no.
1.
2.
3.
4.
5.
6.
7.
8.
Company
Just Eat
Tasty khana
Room Service
Room Service
City Delivery
EatOye
Koziness
Food By Phone
Country
India
India
Malaysia
Singapore
Philippines
Pakistan
Hong Kong
Thailand
Table 2: List of Companies Operating Independently
Just EatThe company was started in 2001 by John Hughes and David Buttress, headquartered in London, United Kingdom. The company’s model was just to provide a platform for the customers to search for their local restaurants to place orders and to deliver at home or you have the options for pick-up. The company came to India on 26th July, 2006 and started its operations in Bangalore and acquired 60% stake of hungry zone. Just eat India has started its operations in the name of hungry Bangalore. Just Eat + Food PandaAfter acquiring the just eat the food panda has become one of the most prominent player in the online food delivery business. After acquiring just eat, now food panda has reach to almost 200 cities of India and has tie-ups more than 12000 restaurants with more than 2.7 billion citizen country. Currently, the company has wide range of food menus available and has covered large share of the market.Tasty KhanaThe company was launched in 2007 and has raised $5million. According to the company website, the company has a list of more than 9000+ restaurants tie-ups on its platform. The company is serving its services in the several cities.Tasty khana is an awesome start-up that only targets the passengers travelling on train. The company has identified the problem and started serving the food that any passenger desire and deliver it to the PNR details given by the customer. The model is very simple. The payment can be done earlier or cash on delivery is also accepted. Food panda + Tasty KhanaThe brand tasty khana will work as an independent brand after the acquisition. Together, both the brands will cover around 173 cities. By this acquisition, food panda will have to focus on a new segment i.e. railway passengers through tasty khana. Currently in India a lot of competition is arising in each segment and so is the case with railways. Yumdoot, travelkhana, and many more has sole objective to satisfy their customers on railway.Room service (Singapore and Malaysia)The company Room service deliveries Singapore is one of the leading food technology platform in entire South East Asia. The company was founded in 2003 started its operations in Malaysia and expanded its operations to Singapore, Thailand, as well as Indonesia. The company has more than 25 different varieties of cuisines and has partnership with over 50 big and reputable restaurants and cafes. Along with the food and snacks, company has started to deliver hampers too. The company had only focused on maintaining its high standards and condition of food that reached to their customers. Food Panda + Room ServiceIn Malaysia, food panda offers 33 different types of cuisines which also includes vegetarian foods.In Singapore, food panda provides 44 different varieties of cuisine. With this acquisition, food panda has well established in Singapore and Malaysia.
13.

City DeliveryThe company was launched in 2010 providing a platform to order food online, like every other online food start-up, the model of this start-up is same as other and they had tie-ups with 350 restaurants approximately. The unique selling preposition of this start-up is that they have collaborated with weekend markets that provides different offerings and also with the caterers and home based small businesses. When the company saw rapid growth, they started to expand their businesses in to packed food and non-food items. The non-food item includes medicines, flowers, and daily usable items.Then due to rising popularity and profit the city delivery came in to business of repairs where the company executive took the electronics from their customers, repair it and return it. Then the company started couriers business. Food Panda + City Delivery When food panda entered in Philippines, they observed that all food delivery company is believed to have a strong mall culture and the e-commerce has just started. The 30 million Facebook signups in the country indicated that the future can be very bright just have to grab the opportunity. Food panda has acquired city delivery to capture the market. Food Panda is offering 55 different varieties of cuisines. Eat OyeIt is an online food ordering tech start-up which started by Rai Umair and Nauman Sikandar. It allows customers have option to book food online and book table online. It has headquartered in Karachi. The company is delivery its services to 13 cities and has over 1000 restaurants listed in their link. From the year it had begun its operations 2013, now they are delivering 2000 meals per day. The company saw growth rate of 682% in their order in 2014 and started to deliver 30,000 meals per month. Food panda + eat oyeFood panda acquired eat Oye 3th Feb 2015 with undisclosed amount of money. As per the founders of Eat Oye, they got money to invest in their new and unique start-up which they are working and will soon be starting. After the acquisition, food panda currently has listed 750 restaurants of its own. The goals are to established food panda and eat oye as a big brand serving the demands of 200 million Pakistan. KozinessThe company was founded in Dec 2011.The Company koziness is an online food delivery company that allows users to order food from their favourite restaurant in Hong Kong. The company came into existence in 2014, headquartered in Sheung Wan. The services offerings ranging from individuals to office corporate. The company provides various kinds of cuisines. Koziness was acquired by two of its biggest competitors. All the three company is now going to operate independently but will share their drivers and work in the benefit of all the three companies.Food panda + kozinessThe company had acquired 4 food delivery companies which are already well-established in Pakistan. All the companies are operating individually as well as jointly under food panda. Food panda global is expanding very fast pace and serving 47 cuisines in Pakistan and doing actually well. Food by phoneThe company was established in 1998 by Marc Hagelauer and Rungrudee Suwannake as a simple concept of delivering restaurant food to locals. It has it’s headquarter in Klong Toey. The foreigner who comes to Thailand considers being the laziest people and the traffic is the worst in the world. So the concept of food by phone came into existence. They have tie-ups to almost 100 big to small restaurants. The company is also into providing or delivering small items like cigarettes, DVDs, beers, flowers, ice-creams, fruits, cooking oils, and many more.Food panda + phone by phoneSoon food panda and food by phone started working together and listed greater number of restaurants and started providing better services by providing different sales channels and improving services. Improving services in the terms of fully trained executives who have fluency in English language so that highest quality of services can be provided to the customers.
Food panda, a food delivery company backed by rocket internet has become one of the leading global companies in food delivering industry. Food panda played a nice game. Each country has a market leader and their prospects are good in the near future. All the acquisitions in Asia were discussed very briefly and the company had made a master plan. By acquiring just eat, tasty khana, room service, city delivery, eatoye, koziness and food by phone, the company has grabbed the biggest piece of industry and has become a leading global BRAND in food delivery business.’The objective of the report has been fulfilled which can be shown below:-
1. Food panda has acquired 8 big companies in 8 different countries who were about to become the market leader and has huge customer database. This acquisition has made food panda a big brand. Though the acquired firms are operating as an independent entity but still they work with food panda together to achieve the goal of food panda.
2. Brand equity of the company has risen so high, they had taken care of the consumer perception in each country they are operating like what are the needs of the people of local areas and fulfilling it. Also providing various delighting offers to delight the consumers occasionally.
IV. CONCLUSION
14.

3. The consequences of all these alliances has made food panda a biggest brand in world food industry and the company is focusing in each market so closely that different needs of different market has been fulfilled and consumers had started relying on the company and get the value for their hard earned money.
The company food panda has already thought how to make a big brand , with all their acquisition, they has stated promoting themselves in all those countries and has become a big brand. So big any local brand cannot think of competing food panda. The company is also growing at very fast pace. In 4 year, food panda has presence in over 39 countries and doing extremely well. So finally, food panda has succeeded in building brand through brand alliances.
V. RECOMMENDATIONS
Like in Thailand, city delivery one of the subsidiary of food panda started expanding their operations. They started to delivery groceries, day-to-day items and vegetables to the door steps. This idea became a hit and the subsidiary added a medical service also in late night facility. This segment has huge scope for the food panda in India as well as in all other countries where the company exists. Also the company can do a strategic alliance with Ola cabs in India to deliver items and get the profit divided among the two big companies. And the option for expanding to other product segment and market segment is always open for the company.
REFERENCES[1] Food panda acquires just eat India in exchange for minority holding (https://yourstory.com/2015/02/foodpanda-
acquires-just-eat-india/), date of revival 22th Sept. 2016.[2] Tastykhana to merge into food panda five months after acquisition (http://www.medianama.com/2015/03/223-
tastykhana-to-merge-into-foodpanda-five-months-after-acquisition/), date of retrieval 22th Sept, 2016.[3] Online food delivery - a booming industry by IANS (http://food.ndtv.com/opinions/online-food-delivery-a-booming-
industry-694794), date of retrieval 23 Sept 2016.[4] What’s the future of food industry by steve denning (http://www.forbes.com/sites/stevedenning/2014/09/10/whats-
the-future-of-the-food-industry/#3d6b49271fde), date of retrieval 23 Sept. 2016.[5] Rise of online food ordering start-ups by Bhavna Singh (http://www.iamwire.com/2015/03/rise-online-food-ordering-
startups-india-opportunities-challenges-innovations/113052), date of retrieval 24 sept 2016.[6] IRCTC ties up with Food panda (http://economictimes.indiatimes.com/industry/transportation/railways/irctc-ties-up-
with-foodpanda/articleshow/49912223.cms), date of retrieval 24th Sept 2016[7] Food panda finds no takers by Digbijay Mishra (http://economictimes.indiatimes.com/small-biz/startups/Foodpanda-
finds-no-takers-even-at-10-million-price-tag/articleshow/50753226.cms), date of retrieval 24 Sept 2016.[8] yumist raises $2M to expand its operations by Harshith (https://yourstory.com/2015/12/yumist-funding-unilazer/),
date of retrieval 25 Sept 2016[9] IIT grads who quit jobs to start own ventures (http://economictimes.indiatimes.com/slideshows/biz-
entrepreneurship/iit-grads-who-quit-jobs-to-start-own-food-ventures/frsh/slideshow/39282472.cms), date of retrieval 26 Sept
[10] We are a fine dine restaurant in cloud by Sushil Reddy (https://yourstory.com/2015/03/saurabh-saxena-holachef-com/), date of retrieval 26 Sept.
[11] Spoon joy just added a spoon full of joy (https://www.hungryforever.com/spoonjoy-just-added-spoon-full-joy-office/), date of retrieval 27 Sept.
[12] Healthy Tiffin service becomes a hot segment (https://yourstory.com/2015/03/itiffin-tiffin-service/), date of retrieval 27 Sept.
[13] India based food delivery start-up (https://techcrunch.com/2016/05/22/india-based-food-delivery-startup-tinyowl-reportedly-shuts-down-in-all-cities-except-mumbai/), date of retrieval 27 Sept.
[14] Food delivery start-up eatlo closes its operations (http://techcircle.vccircle.com/2015/12/23/food-delivery-startup-eatlo-closes-operations/), date of retrieval 28 Sept.
[15] Our story (http://www.just-eat.com/our-story/), date of retrieval 28 Sept, 2016.[16] Bite club: this Gurgaon-based food services start-up wants to shut down home kitchens
(http://economictimes.indiatimes.com/small-biz/startups/bite-club-this-gurgaon-based-food-services-startup-wants-to-shut-down-home-kitchens/articleshow/50053954.cms), date of retrieval 28 Sept 2016.
[17] Purpose of research (http://study.com/academy/lesson/purposes-of-research-exploratory-descriptive-explanatory.html), date of retrieval 28 Sept 2016.
[18] Food panda acquire food delivery portal tasty khana (http://www.business-standard.com/article/companies /foodpanda-acquires-food-delivery-portal-tastykhana-114111800308_1.html), date of retrieval 29 sept 2016.
[19] Food panda acquire competitors in 17 Asian markets (https://www.foodpanda.com/2015/02/06/foodpanda-acquires-competitors-in-7-asian-markets/), date of retrieval 29 Sept 2016.
[20] Food panda Malaysia (https://www.foodpanda.my/), date of retrieval 29 Sept 2016.
15.

[21] Food panda continues Asian expansion brings online food delivery (https://www.techinasia.com/profit-dont-worry-5-uslisted-chinese-tech-companies-havent), date of retrieval 29 Sept 2016.
[22] Food panda opens its online doors in Philippines (https://vulcanpost.com/11542/foodpanda-philippines-food-delivery-online/), date of revival 29 sept 2016.
[23] Food panda takes over eat oye by web desk (http://tribune.com.pk/story/834003/food-panda-takes-over-eat-oye/), date of retrieval 30th Sept 2013.
[24] Eatoye is acquired by food panda global by eat oye editor (https://eatoye.pk/blog/eatoye-is-acquired-by-foodpanda-global), date of retrieval 30th Sept 2016.
[25] Koziness company profile (https://www.owler.com/iaApp/1486946/koziness-company-profile), date of retrieval 1st October, 2016.
[26] Koziness, the smartest way to enjoy cuisine anywhere (http://entrepreneurhk.org/koziness-concepts-an-online-food-ordering-and-delivery-platform-acquires-its-hong-kong-competitors/), date of revival 1st October 2016.
[27] Food panda takes over delievry.com's Hong Kong business (http://techstory.in/foodpanda-takes-delivery-coms-18032016/), date of retrieval 1st October.
[28] Food by phone (https://www.foodbyphone.com/), date of retrieval 2th October.[29] Food by phone profile (https://www.crunchbase.com/organization/food-by-phone#/entity), date of retrieval 2th
October.[30] Food by phone in Bangkok, Thailand home delivery from more than 100 restaurants (http://tastythailand.com/food-by-
phone-in-bangkok-thailand-home-delivery-from-more-than-100-restaurants/), date of retrieval 2th October 2016.
16.

II. OBJECTIVES OF THE STUDY
The study was planned with the following objectives:• To evaluate the factors responsible for encouraging women to become entrepreneur.• To critically examine the problems faced by women entrepreneurs.• To study the policies, programmes and the involvement of institutions and support agencies in promoting
women's entrepreneurship.
Women Entrepreneurship in India: Emerging Issues, Challenges and Prospects
1 2Dr. Rimpi Walia , Ms. Meenakshi Gupta1Director, Patel Institute of Management & Technology Rajpura, Punjab, India
2Assistant Professor, E-Max Group of Institution Badhouli, Ambala, Haryana, India
Abstract: Women entrepreneurship is gaining momentum in India in the wake of economic liberalization, globalization and privatization. The Indian women have to work tough and required to set out an extensive path to achieve equal rights and position as Indian society has male dominated sociological set up. Regardless of all the social hurdles, Indian women stand elevated from the rest of the masses and are respected for their attainment in their respective fields. The policy and institutional framework for developing entrepreneurial skills, providing vocational education and training has widened the horizon for economic empowerment of women.The primary objective of this paper is to find out the position of women entrepreneurs in India. The paper endeavors to study the concept of women entrepreneurs comprising of rationale behind women entrepreneurs. It will also study the causes for slow advancement of women entrepreneurs in India & provide suggestions for the growth of women entrepreneurs along with schemes for promotion & development of women. Today women are educated, well-informed and pioneering part of the society. They have the capability to renovate economies into prosperous enterprises. On the basis of this analysis, so mere commendations will be given to promote the spirit of women entrepreneurship and providing the platform for the women to turn out to be successful entrepreneur.Keywords: Women Entrepreneurs, Challenges, Entrepreneurial Skills, Schemes
I. INRODUCTION
An entrepreneur is a person who has an idea, determination, ability and courage to take extreme risk to do whatever it takes to turn that idea into reality. He not only brings it to market, but makes it a viable product or service that people require. Entrepreneurship is the process of initiating a business. The entrepreneur develops a business model, acquires the human and other required resources and is fully responsible for its success or failure. An entrepreneur must be able to develop business plans to meet objectives. He must have excellent marketing skills& ability to establish and maintain positive relationships with customers, clients, employees, financial lenders, investors and other related parties. He must also be capable to develop a vision for the company and to inspire employees. Entrepreneurship refers to the keenness to take risks and develop, systematize and manage a business venture in a competitive market which is constantly developing. Entrepreneurs are initiators, innovators and leaders.In today’s scenario, women entrepreneurs are an important part for the growth of society and economy as well. The educated women do not want to limit their lives inside the house. They deserve equal respect and chances of growth from the society. The Indian women have to work tough and required to set out an extensive path to achieve equal rights and position as Indian society has male dominated sociological set up. Indian women stand prominent from the rest of the masses and are respected for their attainment in their respective fields. Women Entrepreneurs maybe defined as the woman or group of women who initiate, organize and co-operate a business enterprise. Government of India has defined women entrepreneurs as an enterprise owned and controlled by a woman. They are also facing the impact of globalization and making an influence not only on domestic but also on international sphere. It is a general belief in many cultures that the role of women is to build and maintain the homely affairs. In the modern era, the status of women in India has been changing due to growing industrialization, globalization, privatization and social legislation. With the spread of education and awareness, women have shifted from households to higher level of professional activities. It has made them economically independent as well as confident. Earlier Entrepreneurship was a male-dominated phenomenon, but now the circumstances have changed and brought women as promising entrepreneurs. In almost all the developed countries in the world women are moving ahead at par with the men in all the fields.
17.

V. FACTORS RESPONSIBLE FOR ENCOURAGING WOMEN TO BECOME ENTREPRENEUR
• Economic independence- Today the women desire to be economically independent as well as to contribute financially towards her family. So, they look for avenues for earnings and own business is the best option.
• Uses of idle funds- In case of families with good financial resources, the women members sometimes start some venture for time pass or as hobby, which is later on converted into a successful business.
• Employment opportunities –As, it is comparatively difficult for female to move to distant places for the purpose of job, so entrepreneurship is the best option as work life balance can be maintained.
• Social recognition- In today’s scenario, female have attitude for being self dependent as well as for having some social recognition. Entrepreneurship is one of the best options to show their capabilities and utilize their skills.
• Family background- In the families having business background and attitude of providing equal opportunities for girls, the chances of women entrepreneurship enhance. The contributing factors are favorable family environment and prospects available.
• Women prefer to work from their own residence–As females have to go for multi tasking i.e. manage family and office. It becomes convenient for them, if they are doing own business. The business place can be home itself or some activities can be managed from home and rest from office.
• Difficulty in getting suitable jobs-Due to non availability of suitable jobs, one can opt for entrepreneurship. Some women may not have temperament for job and for others; there may not be suitability due to location of job, job profile, job shift etc.
• Difficulty in mobility- It becomes cumbersome for females to move to distant places for the purpose of job. Either they need to shift to that place or commute daily. Both of them are difficult and affect the whole family. Therefore, own business at the home town is the other best opportunity.
• Change in thinking attitude of males in family- With the passage of time, the attitude of male members in the family is changing. They have become more cooperative, understanding and family oriented. It has helped the women to groom and prove themselves in every field including entrepreneurship.
• Confident and educated- Now a day, due to positive family environment, equality, awareness about avenues, good academic and technical education and skills, the women have developed self-confidence. Now they are ahead in all the fields and making their names in all types of the enterprises.
III. REVIEW OF LITERATURE
• Anjali Singh, (2014) studied the concept of women entrepreneur and discussed the trends and issues in the development of various fields. It also suggested the ways of eliminating and reducing hurdles of the women entrepreneurship development through study of SWOT Analysis in Indian Context and to survive in the globalised world.
• Dr.Vijayakumar, A. and Jayachitra, S. (2013) are of the view that entrepreneurship is presently the most discussed and encored concept all over the world to overcome economic challenges. Women being the vital gender of the overall population have great capacity and potential to be the contributor in the overall economic development of any nation.
• Shikha Mahajan (2013) observed that the elimination of obstructions for women entrepreneurship require a major change in traditional attitudes and mindsets of people in society rather than being limited to only creation of opportunities for women. Hence, it is imperative to design programmes that will address to attitudinal changes, training, supportive services. The basic requirement in development of women entrepreneurship is to make aware the women regarding her existence, the unique identity and her contribution towards the economic growth and development of country.
• Saskia Vossenberg (2013) discussed that the efforts of public and private institutions to promote or develop women’s entrepreneurship in developing countries will undoubtedly continue to benefit individual women entrepreneurs. But, as long as the gender bias in the context in which entrepreneurship is embedded is left intact, our efforts may remain in vain and without any significant macro economic and social impact. With all the money in the world, combined with an accumulation of ‘good intentions’ and‘ great ambitions’ perhaps not much will change as long as those that enjoy the powers and privileges of the gender biased context will either step aside, make room or engage in this endeavor for social change.
• Meenu Goyal, Jai Parkash (2011) observed that today we are in a better position wherein women participation in the field of entrepreneurship is increasing at a considerable rate. Efforts are being taken at the economy as brought promise of equality of opportunity in all spheres to the Indian women and laws guaranteed equal rights of participation in political process and equal opportunities and rights in education and employment were enacted.
IV. RESEARCH METHODOLOGY OF THE STUDY
The study is based on secondary data which is collected from the published reports of RBI, NABARD, Census Surveys, SSI Reports, books, newspapers, journals, websites, etc.
18.

VI. PROBLEMS FACED BY WOMEN ENTREPRENEURS
Women entrepreneurs are facing a lot of challenges from very start i.e. setting up of enterprise and then running their enterprise. Their main problems are as under-• Availability of funds-Availability of funds is one of the most common problems faced by women entrepreneurs as normally
they have not any property in their own name and they require their husband's counter signature on many documents. Although now the situation is changing as legally women have right in their parental property.
• Lack of technical skills –Women may lack the technical skills as well as work experience required to support the setting up and development of productive businesses. The reason behind it is traditional thinking of family about girl education and choice of subject of study.
• Household Commitments --Women are required to execute their traditional role as homemakers and manage the whole family. So they have comparatively less time to devote for business.
• Family culture-Many times the family culture may not allow pursuing the business. The old age traditions may restrain a woman from venturing in to her own business.
• Problem regarding Credit- Sometimes traditional sources of finance are not willing to lend to women entrepreneurs especially if they do not have any collateral security, especially in case of females with lower family income.
• Self confidence-lack of self confidence among women entrepreneurs also hampers the initiative to set up a new business. They do not have congenial environment in family too in many cases, which further plays negative role.
• Problems related to Marketing -Women entrepreneurs are also facing the problems in marketing their products or services. The reason behind it is that this area is primarily male dominated. So for marketing the products, women entrepreneurs have to depend upon middlemen which reduce the profit margin. The Women entrepreneurs also find problems in exploring the market and make their products popular.
VII. GOVERNMENT SCHEMES AND PROGRAMMES FOR WOMEN’S ENTREPRENEURSHIP DEVELOPMENT
In India, the government always tries to develop and train people, especially the females, to start an enterprise. The MSME development organizations, various State Small Industries Development Corporations, national banks and NGOs are organizing entrepreneurship development programmes to cater to the needs of potential women entrepreneurs, who may not have adequate educational background and skills. • There are several other schemes of the government at central and state level, which provide backing for setting up
enterprises for women so that they can be more economically independent.• The momentous schemes have been established in the states of Kerala, Tamil Nadu, Goa and Haryana for the
development of women entrepreneurs. Those women-specific schemes are: • Scheme for Women Entrepreneurs to set up Industrial Units: Kerala, • Mahila Coir Yojana: Kerala, • Entrepreneurship Development Programme for Women: Tamil Nadu, • Women's Training-cum Production Centers and Stipend: Haryana, • Swayamsidha (Indira Mahila Yojna): Haryana and Incentives to Women Entrepreneurs Scheme, 2003: Goa.
Associations and Agencies providing important contributions at State and national levels to promote women entrepreneurs: • Federation of Indian Women Entrepreneurs (FIWE) - It is the result of resolution passed in 4th International Conference
of Women Entrepreneurs held at Hyderabad. It was founded in 1993. FIWE cooperate with various women’s associations in the country to facilitate members’ involvement in a range of activities.
• Small Industries Development Bank of India (SIDBI) – It is an institution established at the national level to provide facilities for small-scale industries. As a part of developing small industries by women entrepreneurs, SIDBI has introduced specific schemes for women.
• Khadi and Village Industries Commission (KVIC) – It is established under the Khadi and Village Industries Commission Act, 1956. It is a statutory organization engaged in promotion and development of khadi and village industries. It provides employment opportunities in rural areas and for women entrepreneurs.
• Micro, Small and Medium Enterprises Development Organization (MSME-DO) – It is the apex body for assisting the Government to formulate, coordinate, implement and monitor policies and programmes for MSMEs. It provides a complete range of common facilities, technology support services, marketing assistance and entrepreneurial development support to all including women entrepreneurs.
• National Bank for Agriculture and Rural Development (NABARD) – NABARD is an autonomous financial institution. It provides liberal credit to rural women entrepreneurs.
• International Centre for Entrepreneurship and Career Development (ICECD) – ICECD is a registered trust .It is involved in training women entrepreneurs for MSME development over the last 25 years. It is operating internationally and has supported women entrepreneurs in over 55 countries.
19.

IX. CONCLUSION
The women are an important aspect of the total population of the society. They have great competence and prospective and can contribute in the overall development of any country. After independence, a lot of steps have been taken for equality of prospects in all fields to the Indian women and several laws have been incorporated which assure equal opportunities and rights in education and employment. Today, women are aspiring to start business and contribute to the nation’s growth. Their contribution has also been acknowledged and steps have been taken to promote women entrepreneurship. Today in our country, there are large number of small and medium women entrepreneurs on one hand and comparatively less number of renowned women entrepreneurs like Chanda Kocchar, Executive Director, ICICI Bank, Kiran Mazumdar Shaw, Chairman & Managing director, Biocon Ltd., Indra NooyiCFO, Pepsico, Naina Lal Kidwai, Group General Manager & Country Head – HSBC, India, Ekta Kapoor, Creative Director, Balaji Telefilms Ltd, Jyoti Naik, President, Lijjat Papad. Ranjana Kumar, Chairman, NABARD etc. Although women are putting their best efforts in all the fields, yet they must be provided proper training, resources and motivation to become successful entrepreneurs so as to face changing scenario and challenging national and international markets.
REFERNCES[1] Anjali Singh: Role of Women Entrepreneurs in India: A SWOT Analysis: Volume 4, Number 2 (2014), pp. 231-238
International Journal of Management and International Business Studies.[2] Shah Hina: 2013, creating an enabling environment for women’s Entrepreneurship in India, ESCAP.[3] Bhardwaj G.N. et al (2012) : Women Entrepreneurship in India: Opportunities and Challenges, C H Institute of
management and communication vol. 2 http:// www.chimc.in/ volume zz2.1 [4] Global Entrepreneurship Monitor (2012) GEM 2011 Global Report. Published online, http://www.gemconsortium.org[5] Saidapur, S. et. al, ‘Women candle entrepreneurs in Gulbarga district–A micro analysis’,Spectrum: A Journal of Multid
isciplinary Research’,vol.4,2012, pp.7-17.[6] Rao,K.,(2004),Women Entrepreneur in Lower Middle Class Families and their Problems, Research Paper Presented
at National seminar on Women Entrepreneurship–A Need for Training and Curriculum Development held by Development of Home Science Extension and Communication, Faculty of Home Science, M.S. University, Vadodara.
[7] Gordon E. & Natarajan K.: (2007) Entrepreneurship Development–Himalaya Publication House, Second Revised edition.
[8] Hattangadi Dr. Vidya: (2007)Entrepreneurship–Need of the hour, Himalaya Publication House, First edition. Schemes and Programmes of Ministry of Small Scale Industries and Ministry of Agro &Rural Industries, Government of India Kalyani Publishers.
Addressing or managing stress within an organization is a process that deserves planning and commitment on the part of the management team and is not something that will happen overnight. Many companies make an effort to address specific elements related to this issue, but very few actually analyze every component to ensure a comprehensive approach for managing this aspect. Stress has become a common phenomenon of our daily work life. It is one of the most important factors influencing individual efficacy and satisfaction in modern day occupational settings. This paper focuses on the impact of number of organizations worked earlier in managing employee vulnerability to stress among the employees of the ITeS-BPO Companies. In order to find out the reliability of the scale used for measuring the response Cronbach’s Alpha has been calculated. The reliability estimate (Cronbach’s Alpha) is 0.951, which is considered quite satisfactory.
VIII. LIFE OF AN ENTREPRENEUR: MS. BHARTI VOHRA
Mrs. Bharti Vohra is a teacher turned into an entrepreneur. She began her career as a teacher in 1985. After her marriage, her husband Mr. Kuldeep Vohra encouraged her to join his business as he required a supporting hand to expand his venture. To help her husband, she joined the business in 1990. She started managing the enterprise ‘Vohra Auto Agency’ at Ambala Cantt with her husband. They started the enterprise with an initial investment of Rs.5 lakh & now the ‘Vohra Auto Agency’ has the turnover of Rs. 1.5 crore. In the initial years, the enterprise manufactured the scooter plastic parts & all other auto parts and sold it to the local market. After few years, they started to supply the socket parts to ‘Jamuna Auto Industry’ who are the main suppliers to ‘TATA’. In the year 2000, the enterprise started manufacturing of engineering plastic goods & they supplied these goods to ‘Groz Engineering Tools Pvt. Ltd.’ which is one of the biggest companies of India in engineering goods. In 2002, they started manufacturing scientific goods & sold it to ‘Electronic Instrumentation’. Electronic Instrumentation is one of the India’s largest scientific goods manufacturer & having offices in more than 80 countries in the world. With years of growth of Vohra Auto Agency, another enterprise ‘Vohra Plastic Industry’ has been started in 2006. After 2006, she is managing the ‘Vohra Auto Agency’ individually. She has faced a lot of difficulty in managing the enterprise alone & the biggest problem is to manage the employees alone. Sometimes, the quality of products is not up to the mark. As we all know, times teach us everything and the same is with Mrs. Bharti Vohra. She herself came out from the problems with her experience & the support of her husband. In 2008, the enterprise started the supply of laboratory equipments to Glassco Laboratory Equipment pvt. ltd. She is now successfully running her business.
20.

[9] Srinivasan N.P. & Gupta C.B.: 2005 Entrepreneurial Development-Sultan Chand & Sons, Sixth edition.[10] Sood S.K. & Arora Renu: 2005 Entrepreneurship and Small Business, Kalyani Publishers, Third edition[11] Kumar, A. (2004),"Financing Pattern of Enterprises Owned by Women Entrepreneurs", The Indian Journal of
Commerce, Vol. 57, No. 2.[12] Dhameja S.K. (2002), Women Entrepreneurs: Opportunities, Performance and Problems, Deep Publisher (P) Ltd.,
New Delhi.[13] Starcher,D.C,‘Women entrepreneurs: Catalysts for transformation’,1996, Retrieved July 6,2001:
http://www.ebbf.org/woman.htm[14] Vishwanathan, R, ‘Opportunities and challengesforwomeninbusinesses,2001[15] Dynamics of entrepreneurial development and management – By Vasant Desai. Himalaya Publishing House.[16] Entrepreneurship Development –By S.S Khanka. S. Chand & Company Limited.
21.

Impact of E-Marketing Strategies on Buying Behavior with Special Reference to Apparel Industry: A Literature Review
Ms. Pallavi Dua1
1
Assistant Professor, G.L. Bajaj Institute of Management and Research, Greater Noida, India
Abstract: For business owners today, the shape of marketing has gone a huge transformation. To compete in this dynamic environment marketers have to employ e-marketing strategies in their marketing campaigns. An online presence is essential to reach the target market in today’s internet age. Online fashion especially online apparel segment has emerged as the fastest growing segment in India’s booming e-commerce market. With the growth in e-commerce apparel sales in India, apparel retailers are employing the services of e-marketing tools to establish their online presence. These days’ apparel marketers are using internet to come up with new ways of marketing with their customers through different ways like social media marketing, banners or website. Among all the sectors, the apparel sector is heavily focusing on the adoption of e-marketing tools to boost their business growth. The industry is finding better and innovative ways to make best possible use of the technology and internet to fulfill customer’s needs in an effective manner. To enhance the consumers experience with apparels online various digital tools are being used nowadays. The current study aims at understanding the impact of E-marketing strategies on the buying behaviour of apparel purchasers as now apparel marketers are making use of internet technologies to come up with new ways of marketing apparels online. The present study also aims at examining the factors affecting the buying behaviour of online consumers through an exploratory approach.Keywords: E-marketing, Apparels, E-commerce, Marketers.
I. INTRODUCTION
Khan and Mahapatra (2009) remarked that technology has an essential role in improving the quality of services provided by the business firms .E-commerce is the main corner stone of businesses today. Online marketers can influence the decision making process of the online customers by providing the proper online experience, the web experience, a mix of online functionality, information, emotions, cues, stimuli and products/services. The prime medium of effectively delivering the web experience is the corporate website, the intermediating platform between the firm and its online customers”. (Constantindies, 2002).There is a huge internet base of about 354 million internet users in India as of June 2015. The number of online shoppers in India will be growing at a very fast pace from 40 million to 100 million by 2016 and 250 million by 2020. By 2018 India will exhibit 500 million internet users and 280 million smart phone users that could be the key drivers for e-commerce portals.
E-Marketing and the Apparel SectorAmong all the sectors, the apparel sector is heavily focusing on the adoption of e-marketing tools to boost their business growth. The industry is finding better and innovative ways to make best possible use of the technology and internet to fulfill customer’s needs in an effective manner. To enhance the consumers experience with apparels online various digital tools are being used nowadays. E-Marketing of apparels is an activity that takes into consideration latest designs in clothing, communicate the information regarding the same to the target market through e-marketing tools so as to create awareness as well as convert prospects into actual buyers.
Online Apparel Market in IndiaAs per a survey carried out by (Baggout.com 2014)(a social commerce and cashback website) amongst its users to elucidate the latest trends in e-commerce sales and industry, clothes and footwear were the most popular categories in fashion. Apparel is one of the three most sold product category in Indian E-commerce industry. The total sales of Apparel and accessories in India were Rs. 3354 crore ($559 million) in 2014. This figure is expected to reach Rs.16,800 crore ( $2.8 billion) by 2016. Online fashion in India is expected to generate $100 billion online retail revenue out of which $35 billion will account from fashion e-commerce. Also as per a survey of industry body (ASSOCHAM 2014), the e-commerce industry in India is likely to be worth 38 US$ billion by 2016 which is approximately a 67% rise over 23 US$ billion revenues for 2015. In 2015 the apparel segment exhibited the highest growth rate of almost 69.5 percent over last year.
II. OBJECTIVES OF THE STUDY
1. To study the impact of E-marketing strategies on the buying behavior of Indian Apparel consumers.2. To analyze the factors affecting the online shopping of apparel buyers.
22.

III. METHODOLOGY OF THE STUDY
In this study an exploratory approach has been adopted to elucidate and give deep insights into understanding and finding out the impact of E-marketing strategies in Apparel industry through literature review of some papers on E-marketing strategies. The study is basically conceptual in nature.
IV. LITERATURE REVIEW
• Goldsmith, E.R. & Goldsmith, E.B. (2002) examined the distinguishing characteristics of the online and offline consumers. The findings of the study revealed that online buyers had the same perception as non-buyers in their belief in how cheap buying online is The results revealed a systematic pattern of psychological and behavioural factors that boost online purchase. They suggested that future research should examine online apparel buying behaviour from other demographic, socio-economic and national group of consumers.
• Cass and Fenech (2003) focussed on examining how internet users adopt web for retail usage. They used a technology acceptance model as a framework to explore acceptance of this technology for retail usage. To measure the attitude of consumers towards web retailing the impact of several parameters such as opinion leadership, buying impulsiveness , internet self-efficacy ,perceived web security, satisfaction with websites, web shopping compatibility were evaluated. The results indicated that the various antecedents as mentioned above being used in the study differentially affect the beliefs of internet users (perceived usefulness of the web and perceived ease of use for retail purchasers).
• Goldsmith & Flynn (2004)examined some selective demographic and psychological features of consumers that lead them to buy clothing online .The findings of the study revealed that consumers perceive fashion involvement, internet innovativeness, experience of catalogue shopping as more important attribute of online buying rather than fashion innovativeness. Increased shopping by the consumers on the internet was better predicted by their inclination towards home shopping rather than interest in the product category.
• Shergill & Chen (2005) examined the key factors that influence the buying behaviour of consumers which will in turn provide e-marketers with a framework for designing their e-business strategies. The study also investigated four types of online New Zealand buyers – trial, occasional, frequent and regular online buyers and the way they perceive websites differently. The findings of the study revealed that website design, website reliability, website security and website customer service are the four dominant factors which influence consumer perceptions of online purchasing.
• Malmarugan, D.(2008)discussed the parameters of service quality that affect the customer satisfaction level in online shopping of apparels and developed a prediction model for measuring consumers intention to purchase online. Easiness in placing orders through websites, ease of priced comparison, ability to search and select variety of alternatives were several attractive attributes of online shopping. The consumers are highly concerned about security and privacy issues in online shopping.
• Dawson & Kim (2009) conducted an exploratory research to identify the role of retail websites in promoting impulse buying on the part of consumers. They found in their study that external cues relating to promotions and ideas category were the major indicators of impulsive shopping. Such cues as sales promotion, free gifts with purchases, free shipping or delivery of products and idea cues such as new features, styles, designs and top picks were also found to be effective.
• Berter,E. & Blomqvist, C. (2010)conducted a qualitative research to investigate how consumer sales promotion can be used on retail clothing companies websites to increase sales. The findings of the study revealed that loyalty programs and discounts are the most effective sales promotion tools in Europe. Other sales promotion tools such as samples, advertising specialties, cross promotion were not much significant.
• Fatema, K. & Stephen, T. (2012) attempted to address the S-O-R paradigm and its application to the online environment. The study revealed that risk perception and trust are the two most important variables that influence the consumers’ intention to purchase online. The study revealed that risk perception and trust are the two most important variables that influence the consumers’ intention to purchase online.
• Nasir,et.al (2012)examined the behaviour of Pakistan women towards apparel purchases i.e. which source of marketing word of mouth communication or social networking sites are more powerful in influencing their purchase decisions. The findings of the study revealed that friends and family opinion i.e. word of mouth and referral plays a big role in creating brand awareness among Pakistani women.
• Rakesh,S. & Khare, A.(2012) analyzed the impact of deal proneness on Indian consumers online buying behaviour. The study also attempted to identify the influence of promotions and discounts in attracting consumers towards online shopping websites. The findings of the study revealed that online buyer’s preference to shop is influenced by price sensitivity, discounts.
• Vinerean, et.al (2013) examined how several parameters related to social networking sites have a positive impact on the consumer perception of online advertisements. The research revealed four new types of social media consumers- engagers, Expressors & Informers, Networkers & watchers and listeners to observe different patterns which could be targeted to improve the effectiveness of online marketing activities.
23.

V. FINDINGS & CONCLUSION
• Yong, L., Hongxiu, Li, Feng, Hu. (2013) examined whether there is impact of website cues such as product availability, website ease of use, visual appeal etc. on online purchase or not. The findings of the study revealed that perceived website ease of use, visual appeal and product availability are significant online cues for fostering impulse purchase online. The results also showed that to promote impulse purchase, online retailers should create a friendly and easy to navigate site.
• Jenyo, G. K. & Soyoye, K. M. (2015)analyzed the impact of online marketing on the purchase decisions of consumers and the extent to which the functionality of the internet infrastructure and internet security issues influence the Nigerian consumers decision making process. The findings of the study revealed that there is a significant relationship between online marketing and consumer purchase decisions. The unique internet characteristics such as easy access to information, functionality of the websites, sites usability, and interactivity have huge impact in modifying the behaviour of the consumers.
A lot of research has been conducted to evaluate the impact of E-marketing tools on the buying behavior of consumers. This research study has been undertaken to study the effect of online marketing strategies on e-buying of apparels. The findings of the study revealed that online shopping is enjoyful and quicker process and convenient for the consumers. Consumer’s positive attitude towards online shopping, behavioural factors, psychological factors, demographic factors, risk perception, trust, online shopping experience ,internet self-efficacy, functionality aspects such as functionality of the websites, functionality of the internet infrastructure were some major factors that boost online purchase of apparels. Friends and family opinion i.e. word of mouth referral also plays a big role in creating brand awareness. Several website cues such as website ease of use, easy access to navigate the information, website security, visual appeal and external cues relating to promotions and ideas category were some major boosters of online shopping. Apart from this cues such as new features, designs, free gifts with purchases, top picks were also found to be effective. Amongst the online consumer sales promotion startegies being used on retail clothing companies’ websites, loyalty programs and discounts were found to be most effective. The research also revealed four new types of social media consumers namely- Engagers, Expressors & Informers, Networkers & Watchers and listeners to observe different patterns of their behavior and their related outcomes towards online shopping.
REFERENCES[1] Abraham, S. (2013) “ Online apparel retailers are trying out new services to stay ahead in a crowded segment”.
Fashioning Success http://www.businesstoday.in/moneytoday/smart-spending/online-retailers-reinventing-to-stay-ahead-of-competition/story/
[2] Amit, G. & Brahma, K.P.(2015),“Textile and Apparel Compendium 2015”, www.technopak.com[3] Bagchi, S.(2015), “ Online Apparel fuels India’s E-commerce growth”. http://www.cxotoday.com/story/online-
apparel-fuels-indias-e-commerce-growth/[4] Berter, E. & Blomqvist, C.(2010), “ Online Consumer Sales Promotion in retail clothing companies”, Bachelor thesis in
Marketing at University of Halmstad , pp. 1-39.[5] Cass, A.O. & Fenech, T. (2003), “Web retailing adoption: Exploring the nature of internet users web retailing
behaviour” , Journal of Retailing and Consumer Services, Vol.10,pp. 81-94.[6] Constantindies, E. (2002), “The 4S Web- Marketing mix model e-commerce research and applications”, Elsevier
Science, Vol.1, No.1, pp. 57-76.[7] Constantindies,E. (2004) , “ Influencing the online Consumer’s Behaviour: The web experience” Journal of Internet
Research, Vol. 14, No. 2, pp. 111-126.[8] Dawson, Sandy, Kim, Minjeong.(2009), “ Cues on Apparel websites that trigger impulse purchases” ,Journal of
Fashion Marketing and management”, pp. 1-9.[9] E-Commerce Industry will cross $38 billion mark by 2016; Indian e-commerce market set to grow by 67% in 2016.
ASSOCHAM India (2016) http://www.assocham.org/newsdetail.php[10] Goldsmith, R.E. & Goldsmith, E.B. (2002), “Buying apparel over the internet”, Journal of Product and Brand
Management, Vol. 11, No.2, pp. 89-102.[11] Goldsmith, R.E. & Flynn, L.R., (2004), “Psychological and Behavioural Drivers of online clothing purchase”, Journal
of Fashion Marketing and Management, Vol.8, No. 1, pp. 84-95.[12] India’s fashion e-retail market to touch $35 bn. by 2020: Google (2015).[13] http://www.livemint.com/Industry/N9i3R5ExZpSBIhtuS0CCQJ/Indias-[14] fashion-eretail-market-to-touch-35-bn-by-2020-Goo.html[15] Jenyo , G.K. & Soyoye , K. M., (2015) “ Online Marketing and Consumer Purchase Behaviour : A Study of Nigerian
Firms” , British Journal of Marketing Studies , Vol.3, No.7, pp. 1-14.[16] Kawaf , F. &Tagg ,S., (2012) , “ Online Shopping Environments in Fashion Shopping” , The Marketing Review , : An
SOR Based Review , pp. 1-33.
24.

[17] Khan, M. S. &Mahapatra, S.S. , (2009) “ Service quality Evaluation in Internet Banking : An Empirical Study in India” , International Journal of Indian Culture and Business Management , Vol.2, No. 1, pp. 106.
[18] Koufaris, M. (2002), “Applying the technology acceptance model and flow theory to online consumer behavior”, Information Systems Research, Vol. 13 (2), pp. 205-223.
[19] Kramer, M. (2012), “The unraveling of apparel: online shopping behaviour”, Reinvention: A Journal of Undergraduate Research, Volume 5, Issue 1, pp. 1-12.
[20] Liu, Y. & Li, H. & Hu F. (2013), “Website Attributes in urging online impulse purchase: An Empirical investigation on consumer perceptions”, Decision Support Systems, Vol. 55, pp.829-837.
[21] Malmaraugan, D. (2008), “Strategic Model for predicting customer intention to purchase apparel online” Journal of Innovative Marketing, Vol. 4, No.1, pp. 29-36.
[22] Nasir ,S. &Vel, P. &Mateen ,H., (2012) “ Social Media and buying behaviour of women in Pakistan towards the purchase of textile garments”, Business Management Dynamics , Vol. 2 , No. 2 , pp. 61-69.
[23] Online Shopping trends in Indian Apparel market (2014) http://trak.in/tags/business/2014/04/15/online-shopping-trends-india-fashion/
[24] Rakesh S. & Khare, A.(2012) ,“ Impact of promotions and value consciousness in online shopping in India” , Journal of Database Marketing and Customer Strategy Management , Vol. 19, pp. 311-320.
[25] Shergill, G.S. & Chen,Zhaobin.,(2005), “Web- Based shopping Consumer’s Attitudes towards online shopping in New Zealand”, Journal of Electronic Commerce Research, Vol.6, No.2, pp.79-94.
[26] Singh,S. (2015), “Future of online apparel market in India”. http://indianonlineseller.com/2015/01/future-of-online apparel-market-in-india/
[27] Vinerean, S. & Cetina, I. & Dumitrescu, L. & Tichindelean, M., (2013),“The Effects of social media marketing on online consumer Behaviour” International Journal of Business and Management , Vol. 8 , No. 14, pp. 66-79
25.
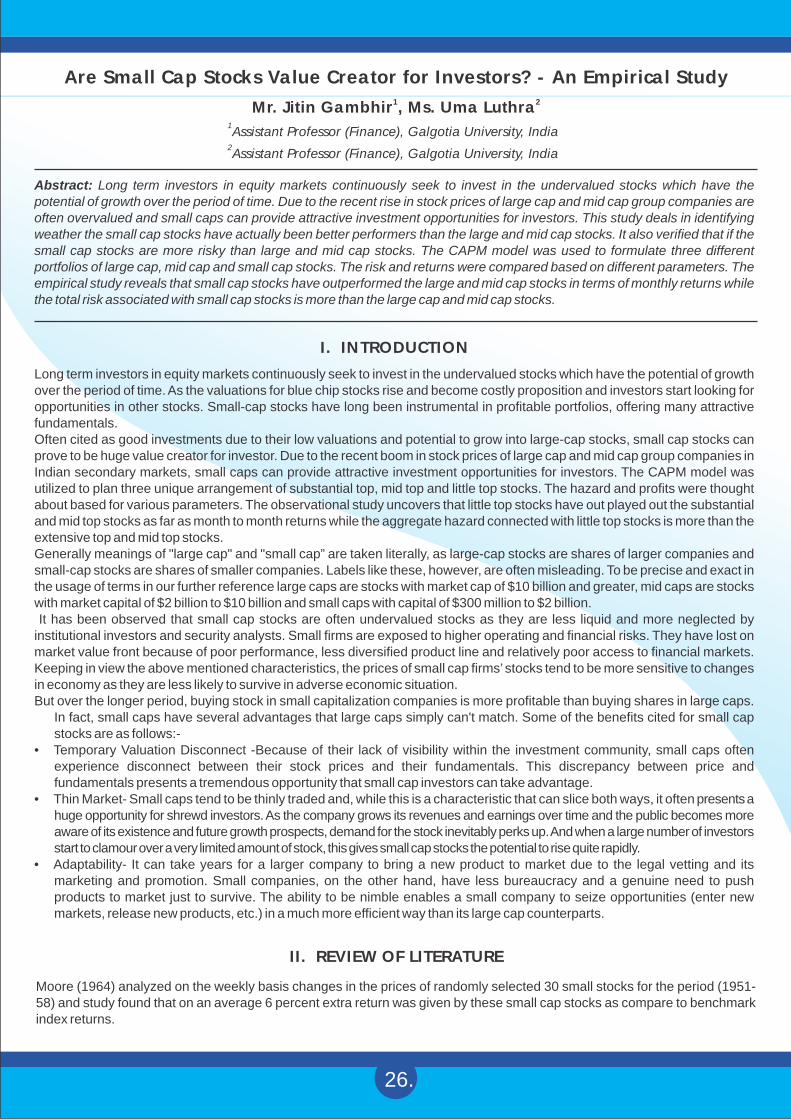
II. REVIEW OF LITERATURE
Moore (1964) analyzed on the weekly basis changes in the prices of randomly selected 30 small stocks for the period (1951-58) and study found that on an average 6 percent extra return was given by these small cap stocks as compare to benchmark index returns.
Are Small Cap Stocks Value Creator for Investors? - An Empirical Study1 2
Mr. Jitin Gambhir , Ms. Uma Luthra1Assistant Professor (Finance), Galgotia University, India
2Assistant Professor (Finance), Galgotia University, India
Abstract: Long term investors in equity markets continuously seek to invest in the undervalued stocks which have the potential of growth over the period of time. Due to the recent rise in stock prices of large cap and mid cap group companies are often overvalued and small caps can provide attractive investment opportunities for investors. This study deals in identifying weather the small cap stocks have actually been better performers than the large and mid cap stocks. It also verified that if the small cap stocks are more risky than large and mid cap stocks. The CAPM model was used to formulate three different portfolios of large cap, mid cap and small cap stocks. The risk and returns were compared based on different parameters. The empirical study reveals that small cap stocks have outperformed the large and mid cap stocks in terms of monthly returns while the total risk associated with small cap stocks is more than the large cap and mid cap stocks.
I. INTRODUCTION
Long term investors in equity markets continuously seek to invest in the undervalued stocks which have the potential of growth over the period of time. As the valuations for blue chip stocks rise and become costly proposition and investors start looking for opportunities in other stocks. Small-cap stocks have long been instrumental in profitable portfolios, offering many attractive fundamentals.Often cited as good investments due to their low valuations and potential to grow into large-cap stocks, small cap stocks can prove to be huge value creator for investor. Due to the recent boom in stock prices of large cap and mid cap group companies in Indian secondary markets, small caps can provide attractive investment opportunities for investors. The CAPM model was utilized to plan three unique arrangement of substantial top, mid top and little top stocks. The hazard and profits were thought about based for various parameters. The observational study uncovers that little top stocks have out played out the substantial and mid top stocks as far as month to month returns while the aggregate hazard connected with little top stocks is more than the extensive top and mid top stocks. Generally meanings of "large cap" and "small cap” are taken literally, as large-cap stocks are shares of larger companies and small-cap stocks are shares of smaller companies. Labels like these, however, are often misleading. To be precise and exact in the usage of terms in our further reference large caps are stocks with market cap of $10 billion and greater, mid caps are stocks with market capital of $2 billion to $10 billion and small caps with capital of $300 million to $2 billion. It has been observed that small cap stocks are often undervalued stocks as they are less liquid and more neglected by institutional investors and security analysts. Small firms are exposed to higher operating and financial risks. They have lost on market value front because of poor performance, less diversified product line and relatively poor access to financial markets. Keeping in view the above mentioned characteristics, the prices of small cap firms’ stocks tend to be more sensitive to changes in economy as they are less likely to survive in adverse economic situation. But over the longer period, buying stock in small capitalization companies is more profitable than buying shares in large caps.
In fact, small caps have several advantages that large caps simply can't match. Some of the benefits cited for small cap stocks are as follows:-
• Temporary Valuation Disconnect -Because of their lack of visibility within the investment community, small caps often experience disconnect between their stock prices and their fundamentals. This discrepancy between price and fundamentals presents a tremendous opportunity that small cap investors can take advantage.
• Thin Market- Small caps tend to be thinly traded and, while this is a characteristic that can slice both ways, it often presents a huge opportunity for shrewd investors. As the company grows its revenues and earnings over time and the public becomes more aware of its existence and future growth prospects, demand for the stock inevitably perks up. And when a large number of investors start to clamour over a very limited amount of stock, this gives small cap stocks the potential to rise quite rapidly.
• Adaptability- It can take years for a larger company to bring a new product to market due to the legal vetting and its marketing and promotion. Small companies, on the other hand, have less bureaucracy and a genuine need to push products to market just to survive. The ability to be nimble enables a small company to seize opportunities (enter new markets, release new products, etc.) in a much more efficient way than its large cap counterparts.
26.

IV. OBJECTIVES OF THE STUDY
The objectives of the study are as follows:1) To determine the returns given to equity shareholders by small cap stocks with respect to large cap stocks.2) To examine the returns of the small cap stocks with respect to mid cap stocks.3) Examine the risk associated with small cap stocks as compared to Large cap and small cap stocks.4) To examine the dependence of small caps on the prevailing market and economic trends.
V. FORMULATION OF HYPOTHESIS
A scientific research calls for examination of null hypothesis against alternative hypothesis. In the present study following hypothesis are tested. (1) H0: There is no significant difference in return from small cap securities and large cap securities
H1: There is significant difference in return from small cap securities and large cap securities (2) H0: There is no significance difference between the risk of small cap stocks and large cap stocks.
H1: There is significance difference between the risk of small cap stocks and large cap stocks.(3) H0: β = 0 that is β is not significant different from zero
H1: β ≠ 0 that is β is significant. different from zero
(4) H0 α = 0 that is α is not significant different from zero
H1 α ≠ 0 that is α is significant different from zero
(5) H0 The correlation Coefficient between portfolio beta (market risk) and portfolio expected return is not significant.H1 The correlation Coefficient between portfolio beta (market risk) and portfolio expected return is significant.
Alexander (1961) used filter techniques based solely on price change to see whether an abnormal return could be earned by using such rules. During the period of study he found out that about 5 to 50 percent extra return can be earned by investing in small cap stocks.Fama and Blume (1966) observed and concluded that there appears to be both positive and negative movements in prices for small caps. The order of movement is small.J. L. Sharma (1983) worked on stock price movements in less developed countries, with presumably less developed markets. Due to the narrowness or lack of breadth of capital markets the prices of stocks is often disproportionate to their actual potential. The study suggests that price changes of stocks listed in Bombay Stock Exchange reflecting a less developed country conform to general behavior of stock price changes observable in other leading stock markets of the world.Amanulla and Kamaiah (1998) with the help of monthly data of 53 stocks conclude that by and large Indian markets gives extra returns for small cap stocks. Nalini Prava Tripathy (2004) evaluated the Performance of Tax Planning Schemes in India using six different performance measures. The study revealed that majority of the schemes had not outperformed the market and also a proper balance between selectivity and diversification was not maintained by the fund managers. Malik N.S and Suresh Kumar Mittal (2007) analysed the performance of 74 equity funds from 1986 to 2006 using the S&P CNX Nifty as market benchmark and two risk-adjusted performance measures (Sharpe and Treynor’s Index). The study indicated that the actively managed funds outperformed the market benchmark mostly over a longer period of time (generally five years). In private sector category (26), 21.92 percent funds had outperformed and in public sector funds (48), only 15.38 percent funds had outperformed the benchmark. Sowmya Guha Deb, Ashok Banerjee and B.B. Chakrabarti (2007) analysed 96 schemes and made an attempt to find the stock selection and market timing abilities of the Indian Mutual fund managers using unconditional as well as conditional approaches. The results revealed that Indian mutual fund managers lacked market timing skill but they exhibited stock selection ability. Madhumita Chakraborthy, P.K. Jain and Vinay Kallianpur (2009) conducted the performance evaluation of some select growth funds in terms of their returns and risk-adjusted approaches taking treasury bills as risk free asset and using BSE- 100 as benchmark index. The study revealed that the performance of funds was satisfactory and the fund managers possessed indefinable performing capabilities. Bapna, Yogesh Mehta and Vishal Sood (2010) compared the performance of public and private sponsored nineteen ELSS mutual funds by using the Sharpe ratio and using S&P CNX Nifty as a market benchmark for six years (2003- 2008). The study indicated that the private sponsored funds were able to outperform public sponsored funds
III. SCOPE OF THE STUDYThis study investigates the value creating opportunities offered by small cap stocks. In this research we will try to determine the performance of small cap stocks with respect large cap and mid cap stocks in Indian market to determine if small cap stocks in India have been value creators for investors. This research will help the investors to choose the small cap stocks in their portfolios depending on their risk perception and required returns for that type of risk. This study will help to determine if really investing in small stocks create value. The risk premium associated with small cap stocks.This study analyses the share price returns involved in the investment. It involves the analysis of securities from point of view of their price, returns and risks. The analysis of risk and return related to securities will help in understanding the behavior of security prices, market and decision making for investment.
27.

Alpha (") is a constant intercept indicating a minimum level of return that is expected from security, if market remains flat
(neither going up nor coming down). A positive alpha is the extra return awarded to the investor for taking a risk, instead of accepting the market return. ALPHA is calculated in this way:
Where: is mean return of security, is mean return of benchmark portfolio.
To measure the statically reliability of these hypothesis t-test has been applied and the calculated value is tested for 95% level of significance. if the value of t lies in the critical region (-t to + t ) we reject the null hypothesis and accept that the statically 0.025 0.025
significant while in other case the null hypothesis can be accepted and it can be admitted that estimates are statistically not
Total risk of security is the sum of total market risk and total non market risk. Symbolically, it can be written as:
Where: is variance of stock I representing, is total market risk, is non market risk.
" = R - $ x
R
x
2 2 2s =b is +ei xt it
2
i
2s i
2b is xt
2
i
2e it
VI. METHODOLOGY
This research study measures the difference in risk and return among large caps, mid caps and small caps over the period of January 2009 to December 2015. For this purpose, monthly opening and closing prices on monthly basis of 90 stocks from BSE belonging to all the sectors of economy, and three different groups of stock are selected from large cap, mid cap and small cap stocks respectively in equal proportion of 30 each. Each of these groups has been divided into five portfolios using equal weights. BSE SENSEX has been taken as a benchmark portfolio. The data is collected from PROWESS, a database maintained by CMIE ltd. The monthly returns for different companies (in percentage) are determined as
R = i
Where: R is monthly return of a company,i
P is closing price of company for the month,1
P is opening price of company for the month.0
The expected returns for a stock are determined using the CAPM model as follows:
Where: is expected return,
is return from benchmark index, is error of residuals.
Beta ($) is the measure of a fund's or stock's risk in relation to the market. It can be estimated by regressing the monthly
security return to the return of the benchmark portfolio. It is calculated as:
To measure the statically reliability of these hypothesis t-test has been applied and the calculated value is tested for 95% level of significance. if the value of t lies in the critical region (-t to + t ) we reject the null hypothesis and accept that the statically 0.025 0.025
significant while in other case the null hypothesis can be accepted and it can be admitted that estimates are statistically not significant.
(P - P )1 0
P0
100*
E(R)=a+$(x )+ei t
Ri
Xt
e
$=i
RnE x -E xE R
2 2nE x - (E x )
To measure the statically reliability of these hypothesis t-test has been applied and the calculated value is tested for 95% level of significance. if the value of t lies in the critical region (-t0.025 to + t0.025) we reject the null hypothesis and accept that the statically significant while in other case the null hypothesis can be accepted and it can be admitted that estimates are statistically not significant.
28.

The portfolio return and risk can be calculating by merely taking the weighted average of risk and return of individual securities. Here, it is assumed that equal weights have been given to each security in the portfolio. We can write it as follows:
Where, R = portfolio return and w = weight given to each security in the portfolio for our purpose we have taken w=1.p i
The weighted average of the portfolio beta can be written as:
Where w=1
Similarly we can calculated the weighted average of portfolio alpha
R is a statistical measure that represents the percentage of a fund or security's movements that can be explained by 2
movements in a benchmark index. It explains the risk adjusted returns of security. For the purpose of the study the expected return of securities and portfolio are calculated by assuming that market will give 2% monthly return in future
VII. LIMITATIONS
The limitations involved in this study areŸ The period of study was from 1st January 2009 to 31st December 2015 which is not enough to significantly analyze the
performance of stock market.Ÿ For each group only sample of 30 companies was studied.Ÿ The time available for study was limited
N
E(R )=åw (a +b c)R i i ii-1
å=
=N
i
iip w1
bb
29.

Mid CAP Stocks
Rolta India Ltd.
India Cements Ltd.
Jindal Saw Ltd.
Nagarjuna Fertis & Chem Ltd.
Moser Baer India Ltd.
Arvind Mills Ltd.
L I C Housing Finance Ltd.
Titan Industries Ltd.
C M C Ltd.
Aurobindo Pharma Ltd.
Great Eastern Shipping Co. Ltd.
Tata Tea Ltd.
Bharat Bijlee Ltd.
Voltas Ltd.
Reliance Industrial Infra LTD
Crisil Ltd.
I F C I Ltd.
Madras Cements Ltd.
Bajaj Hindusthan Ltd.
Essar Shipping Ltd.
Punjab Tractors Ltd.
Balrampur Chini Mills Ltd.
Torrent Pharmaceuticals Ltd.
Kirloskar Brothers Ltd.
Mean
0.003
-0.27
0.23
0.008
-0.31
-0.36
-0.10
0.56
0.20
-0.08
-0.15
0.08
0.16
0.71
-0.08
0.14
-0.73
0.12
0.66
0.22
-0.11
-0.18
0.68
0.25
st.dev
4.19
3.60
3.75
4.78
3.81
3.17
3.60
4.56
3.91
2.96
2.83
2.35
4.66
3.36
3.48
3.41
4.94
3.01
3.71
4.14
2.47
3.37
4.51
3.57
Α
-0.37
-0.56
-0.02
-0.23
-0.54
-0.59
-0.33
0.33
-0.015
-0.28
-0.33
-0.07
0.00
0.55
-0.23
-0.00
-0.87
-0.01
0.54
0.10
-0.23
-0.29
0.58
0.15
α t
-1.07
-1.75
-0.07
-0.49
-1.50
-2.03
-0.97
0.75
-0.04
0.28
-1.23
-0.36
0.00
1.67
-0.66
-0.00
-1.72
-0.03
1.45
0.25
-0.97
-0.86
1.25
0.42
β
1.63
1.19
1.13
1.03
0.99
0.99
0.98
0.98
0.92
0.84
0.75
0.69
0.68
0.67
0.64
0.61
0.58
0.57
0.52
0.51
0.51
0.48
0.45
0.42
β t
7.06
0.21
5.00
3.36
4.16
5.20
4.43
3.36
3.71
4.80
4.27
4.80
2.20
3.11
2.84
2.76
1.76
2.94
2.11
1.84
3.19
2.17
1.49
1.78
R2
0.34
0.25
0.21
0.10
0.15
0.22
0.17
0.10
0.12
0.19
0.16
0.19
0.04
0.09
0.07
0.07
0.03
0.08
0.04
0.18
0.09
0.04
0.02
0.03
2.88
1.82
2.24
1.83
1.44
1.39
1.64
2.31
1.83
1.39
1.17
1.30
1.36
1.91
1.06
1.23
0.29
1.14
1.59
1.13
0.78
0.68
1.48
1.01
expected return
Table 1
30.

Mid CAP Stocks
United Breweries (Holdings) Ltd.
Marico Ltd.
Pidilite Industries Ltd.
Honeywell Automation India Ltd.
Britannia Industries Ltd.
3M India Ltd.
Mean
0.67
-0.14
0.05
0.68
0.45
0.20
st.dev
4.48
2.69
2.84
3.09
2.20
3.00
Α
0.57
-0.22
-0.02
0.61
0.38
0.18
α t
1.24
-0.79
-0.07
1.93
1.69
0.57
β
0.40
0.32
0.30
0.30
0.30
0.12
β t
1.32
1.77
1.60
1.46
2.06
0.59
R2
0.01
0.03
0.02
0.02
0.04
0.004
1.38
0.42
0.59
1.22
0.98
0.42
expected return
Small Cap Stocks
Aftek Ltd.
Kemrock Industries & Export .
Ansal Housing & Construction
G I C Housing Finance Ltd.
J B Chemicals & Pharm Ltd.
B O C India Ltd.
Premier Ltd.
Sakthi Sugars Ltd.
Kennametal India Ltd.
Indo Rama Synthetics ltd.
Bajaj Auto Finance Ltd.
Sagar Cements Ltd.
Insilco Ltd.
Ion Exchange (India) Ltd.
Kirloskar Pneumatic Co. Ltd.
Automotive Axles Ltd.
mean
-0.12
0.34
0.97
0.63
0.15
0.33
1.70
-0.04
0.06
-0.14
1.07
1.16
-0.44
0.27
0.85
0.77
st.dev
5.38
9.63
.88
4.89
2.88
3.91
6.35
5.65
4.38
5.31
4.14
4.68
3.81
4.67
4.45
3.33
α
-0.498
0.042
0.675
0.346
-0.075
0.117
1.605
-0.143
-0.026
-0.243
0.984
1.07
-0.535
0.188
0.772
0.69
α t
-0.995
0.043
0.757
0.736
-0.294
0.452
2.44
-0.224
-0.058
-0.443
2.31
2.218
-1.365
0.39
1.683
2.018
β
1.594
1.319
1.309
1.228
0.997
0.693
0.425
0.412
0.406
0.405
0.388
0.387
0.378
0.363
0.356
0.352
β t
4.862
2.055
2.241
3.978
5.964
2.704
0.987
1.076
1.373
1.126
1.389
1.224
1.372
1.148
1.182
1.568
R2
0.201
0.043
0.051
0.144
0.275
0.072
0.01
0.012
0.02
0.013
0.02
0.016
0.023
0.014
0.014
0.025
st. error
4.84
9.47
8.62
4.55
2.46
3.78
6.35
5.64
4.36
5.31
4.12
4.67
3.79
4.66
4.44
3.31
2.69
2.68
3.293
2.802
1.919
1.503
2.455
0.681
0.786
0.567
1.76
1.844
0.221
0.914
1.484
1.394
expected return
Table 2
Table 3
31.

Small Cap Stocks
Ingersoll-Rand (India) Ltd.
Hitachi Home & Life Sol Ltd.
Gujarat Ambuja Exports Ltd.
Indian Acrylics Ltd.
N R B Bearings Ltd.
Polyplex Corporation Ltd.
Kamat Hotels (India) Ltd.
Grindwell Norton Ltd.
Natco Pharma Ltd.
Paramount Commniaions Ltd.
Rain Commodities Ltd.
mean
-0.29
0.79
1.40
1.04
1.02
-0.01
1.41
0.54
0.65
-0.02
0.42
st.dev
3.27
5.40
4.49
8.73
4.43
3.46
4.96
2.9
4.40
5.95
4.16
α
-0.377
0.722
1.342
0.985
0.97
-0.069
1.362
0.488
0.607
-0.053
0.422
α t
-1.121
1.292
2.892
1.089
2.114
-0.192
2.648
1.628
1.329
-0.086
0.977
β
0.349
0.294
0.281
0.256
0.253
0.247
0.246
0.23
0.217
0.101
0.003
β t
1.583
0.803
0.924
0.432
0.843
1.051
0.730
1.173
0.726
0.250
0.012
R2
0.026
0.007
0.009
0.002
0.007
0.012
0.006
0.014
0.075
0.026
0
st. error
3.25
5.41
4.49
8.76
4.44
3.46
4.98
2.9
4.41
5.98
4.18
0.321
1.31
1.904
1.497
1.476
0.425
1.854
0.948
1.041
0.149
0.428
expected return
Large cap Stocks
Portfolio 1
Portfolio 2
Portfolio 3
Portfolio 4
Portfolio 5
Average
Mean
-0.05841
0.1412
0.1436
0.063
-0.0495
0.0400
st.dev
2.7885
2.5323
2.67545
2.8176
3.08231
2.3160
Α
-0.294
-0.0485
-0.075
-0.1513
-0.3195
-0.1481
α t
-1.06083
-0.2331
-0.4786
-0.6398
-1.2145
-0.6045
Β
1.0105
0.8131
0.8093
0.9191
1.1581
0.7851
β t
6.3613
5.4991
5.0503
5.7018
7.1726
4.9642
R2
0.3011
0.2448
0.2173
0.2553
0.3368
0.2259
ex return
1.727
1.5778
1.543
1.687
1.9968
1.4221
Small Cap Stocks
Jayaswal Neco Inds. Ltd.
Lanxess A B S Ltd.
Goodyear India Ltd.
mean
1.24
-0.01
0.17
st.dev
7.08
3.58
4.75
α
1.25
-0.002
0.206
α t
1.7
-0.006
0.418
β
-0.017
-0.035
-0.115
β t
-0.035
-0.142
-0.354
R2
0
0
0.001
st. error
7.12
3.6
4.77
1.216
-0.072
-0.024
expected return
Table 6
Table 4
Table 5
32.

Mid Cap Stocks
Portfolio 1
Portfolio 2
Portfolio 3
Portfolio 4
Portfolio 5
Average
Mean
-0.11
0.083
0.054
0.256
0.320
0.1193
st.dev
3.88
3.37
3.81
3.63
3.05
3.5527
α
-0.39
-0.11
-0.093
0.143
0.251
-0.0415
α t
-1.156
-0.262
-0.127
0.258
0.763
-0.1049
Β
1.1645
0.864
0.6316
0.486
0.2937
0.6880
β t
4.169
4.237
2.607
2.102
1.469
2.9163
R2
0.2165
0.160
0.0683
0.072
0.024
0.1086
ex return
1.938
1.61
1.17
1.115
0.83
1.3345
Table 7
Small Cap Stocks
Portfolio 1
Portfolio 2
Portfolio 3
Portfolio 4
Portfolio 5
Average
Mean
0.3887
0.6356
0.32485
0.9053
0.410983
0.5331
st.dev
19.1258
5.0918
4.1596
4.8318
4.991483
7.6401
α
0.1011
0.541167
0.2433
0.8463
0.405
0.4274
α t
0.1165
1.0405
0.4828
1.696
0.722
0.8117
Β
1.19
0.4038
0.3486
0.2521
0.025667
0.4441
β t
3.634
1.1958
1.276
0.8588
0.076167
1.4082
R2
0.131
0.0151
0.0181
0.0083
0.017
0.0379
ex return
2.4811
1.3488
0.9406
1.3506
0.456333
1.3155
Table 8
Portfolio
Largecap
mid cap
small cap
mean
0.0400
0.1193
0.5331
st.dev
2.3160
3.5527
7.6401
α
-0.148**
-0.041**
0.42**4
α t
-0.6045
-0.1049
0.8117
Β
0.7851*
0.6880*
0.444**
β t
4.9642
2.9163
1.4082
R2
0.2259
0.1086
0.0379
Ex. Return
1.4221
1.3345
1.3155
RETURN
Table 9
corel coeff
0.7096
0.6213
0.2851
* Value is significant at 95% level
** Value is not significant at 95% level
Information on the mean monthly return and the standard deviation of return are calculated for a random sample of companies in different portfolios over the period of study has been given in Table 4.From Table we observe that for the given period the mean monthly return for small cap companies is 0.5331 which is quite higher than the monthly return for large cap that is only .04 for the same period. Also the return from small cap portfolio is more than that of mid cap stocks during the same period. This shows that small cap offered the prospects of high returns when compared with large cap and mid cap stocks during the study period. It has been observed that often the small cap stocks are undervalued as their daily trading volume is less when compared with large cap stock. Thus the market value of small cap stock does not reflect their true intrinsic value and they can be gained by investors at a good bargain which lead to higher value creation for investors over a period of time.
33.

TOTAL RISK
Total risk associated with a portfolio is measured by the variance in returns. Standard deviation is used to measure total risk associated with a portfolio. The standard deviation for small cap stocks is 7.6401(from Table 1). This is high when compared to the standard deviation for large cap and mid cap stocks. This explains that higher mean return form small cap portfolio is associated with a higher risk. So to earn a higher return, the investor has to invest in more risky security.Thus we can conclude that over the period of study small cap stocks have given higher returns as compared to mid cap and large cap stocks but level of risk associated with small cap stock is also higher.
SYSTEMATIC RISKThe amount of risk of a share can be decomposed into two components – the unsystematic risk and the systematic risk. The sum total of the two is the total risk. Systematic risk (measured by the beta value of a share) is the risk attached to the economy as a whole and it cannot be diversified away. The beta value can range from 0 (no systematic risk, that is a risk-free asset) to 1 (same amount of systematic risk as the market portfolio) and above 1 (more systematic risk than the market portfolio). The unsystematic risk represents risks that are specific to a given share and can be diversified away by holding a portfolio of stocks.
SMALL CAP STOCKSFrom the table 2 we observe that T value for BETA is 1.4082, at 95% level of accuracy we accept the null hypothesis. Thus based on statistical tests, we conclude that the estimated value of BETA for small cap portfolio is not significant, that means that the return of small cap stocks does not depend on the market returns. It is independent of the prevailing market and economic conditions. Also the expected return for small cap portfolio is less when compared with other two portfolios. Thus for the level of systematic risk, investors expectation of return from small cap stocks is low as compared to large cap and small cap stocks.
LARGE CAP STOCKST value for BETA of large cap stocks is 4.9642, so at 95% level of significance we reject the null hypothesis and accept the alternate hypothesis. Thus based on statistical tests, we conclude that systematic risk associated with large cap stock is higher than the other two portfolios. The BETA value for large cap stocks comes out to be 0.7851 that means in case of one percent change (increase/decrease) in benchmark portfolio, large cap stocks will change by 0.7851 percent. The high beta value for large cap stock is associated with higher expected returns of 1.42%. Thus the investors expect higher returns when they invest in large cap stocks as the return from small cap stocks depend upon prevailing market and economic conditions.
MID CAP STOCKSBased on T value for BETA of mid cap stocks which is 2.9163, we reject the null hypothesis and accept the alternate hypothesis. Thus based on statistical tests, we conclude that value of BETA for mid cap stocks is also significant means that return of mid cap stocks depends on the market returns. The BETA value for mid cap stocks depends on prevailing market and economic conditions. The BETA value for mid cap stocks comes out to be 0.6880 that means in case of one percent change in market large cap stocks will change by 0.6880 percent. In the end we conclude that small cap stocks are independent of market conditions while in case of large cap and mid cap stocks significantly depends upon the market conditions. The level of unsystematic risk varies for all the tree groups.
RISK FREE RETURNIn case there is no change in the benchmark return( nether increase nor decrease), the amount of return that a stock gives is given by A positive alpha is the extra return awarded to the investor for taking a risk, instead of accepting the market return Risk free return which is represented by alpha value (α).
SMALL CAP STOCKSFrom the table 3, we observe that T value for ALPHA is 0.8117; Therefore we accept the null hypothesis. Thus based on statistical tests, we conclude that value of ALPHA for small cap stocks is not significant. It means the investors minimum return by investing in small cap stocks that is risk free rate of return. We conclude that during the period of study small cap stocks have given significantly more returns than the risk free returns.
LARGE CAP STOCKST value for ALPHA of large cap stocks is 0.6045; therefore we accept the null hypothesis and reject the alternate hypothesis. Thus based on statistical tests, we conclude that value of ALPHA for large cap stocks is not significant that means it means the investors get minimum return by investing in large cap stocks that of risk free rate of return.We conclude that during the period of study small cap stocks have given significantly more returns than risk free rate.
34.

MID CAP STOCKST value for ALPHA of mid cap stock is 0.1049, which is not significant at 95 percent level, so we accept the null hypothesis and reject the alternate hypothesis. Thus based on statistical tests, we conclude that value of ALPHA for large cap stocks is not significant that means the risk free return of small cap stocks is not more than risk free rate of return.We conclude that during the period of study small cap stocks have given minimum returns as of government bonds.
In the end we conclude that risk free return for all the three sectors is not significantly more as compared to risk free rate of return. During past period Indian stock markets have given same returns as risk free rate of return to the investors.
VIII. RISK & RETURN RELATIONSHIP
CORRELATION OF SYSTEMATIC RISK AND EXPECTED RETURNSThe correlation of returns between the companies of different in the sample is investigated. The correlation coefficient can range from -1 (risk and returns tend to move in opposite direction) to +1 (risk and returns tend to move in the same direction).The risk and returns of the blue chip companies tend to be highly correlated as evident from the high value of correlation coefficient of large cap stocks which is 0.7096. This is due the fact that the trading volume for large cap stocks is high, and also the information about large cap stocks is easily available to the investors. Thus, the market value of large cap securities reflects the true intrinsic value of the stock. Due to the high trading volume and freely available information the market value of large cap stocks cannot be manipulated by individual investors. Thus, for gaining higher returns from large cap stocks the investors has to invest in the securities having higher level of risk as compared to other sectors.In case of mid cap stock the value of correlation coefficient is 0.6213 which is a moderate value when compared to large and small cap stocks. The mid cap stocks have moderate trading volume as compared to large cap stocks in stock market. This moderate value reflects that a investor can gain higher returns by investing in the stocks having moderate level of risk.High value of correlation in both large cap and mid cap stock also shows that the perception of investors about expected return form stock in these sectors at the given level of risk are highly correlated, that is investors expectation of returns from these stocks is higher for the higher level of risk.In case of small cap stocks the value of correlation coefficient is 0.2851 which is low as compared to other two sectors. This is due to the fact that the trading volume for small cap stocks is small and often the market value for security does not reflect the true value of stock as the information about small cap stock is not easily available to the market as investors can earn high returns by investing in the less risky stocks. This employs that the expected return of investors for small cap stocks is not that much high for the higher level of risk.
R2R2 represents the percentage of a fund or security's movements that can be explained by movements in a benchmark index. In our case the value of R2 for large cap is 0.2259 which means that 22.59 % of expected return is due to change in the movement in index return. By this we mean that out of the 1.42 percent return expected from large cap stocks, 22.59 % is contributed by the changes in benchmark portfolio.The value of R2 for mid cap stocks is 0.1086. This employs that out of expected 1.33 % return expected from mid cap portfolio, 10.86% will be contributed by changes in bench mark portfolio. Similarly in case of small cap stock the percentage of expected return due to changes in index is only 3.79%.Thus we can conclude that dependence expected return of small cap stocks on changes in market returns is very less as compared to large cap and mid cap stocks.
IX. CONCLUSION
The small cap stocks have offered the prospects of high returns as compared to large cap and mid cap sectors. Thus by investing in small cap group companies investors can get a good bargain which lead to higher value creation for investors over a period of time.But higher returns from small cap stocks are accompanied by higher level of total risk. The returns from small cap stocks are independent of market conditions while in case of large cap and mid cap stocks significantly depends upon the market conditions. In case of large cap and mid cap stocks, the perception of investor about expected return from stock in these sectors at the given level of risk are highly correlated, that is investors expectation of returns from these stocks is higher for the higher level of risk. Also dependence expected return of small cap stocks on changes in market returns is very less as compared to large cap and mid cap stocks. Small cap stocks give higher return to investors over a long period of time but also have high volatility level. In case of different economic and market conditions the investors expectations of return from small cap stocks does not change, while the expectation of return for the large cap and mid cap firms depend upon the market returns.
35.

REFERENCES[1] Arbel, Avner, “The Neglected and Small Firm Effects”, Financial Review, Nov. 1982, pp 201-218.[2] Banz, Rolf W, “Relationship between Return and Market Value of Common Stocks”, Journal of financial Economics,
March 1981, pp 3-18.[3] Chan, K C and Chen, “Structural and Return Characteristics of Small and Large Firms”, Journal of Finance,
September 1991,56,4, pp 1467-1484 [4] Mohanty (2002), “Efficiency of Market for small cap Stocks”, 2001-NSE research Paper Series..[5] Sehgal Sanjay (2006), “Sources of size Effect: Evidence from the Indian stock market”, Journal of Finance, Vol. 32, pp.
663-682.[6] Sehgal S and Muneesh K, “ The relationship between Company size, Relative Distress and Returns in Indian Stock
Markets”, The ICFAI jounal of Applied Finance, March 2002, Vol. 8, No. 2, pp 41-50[7] http://www.bseindia.com/ [8] Punithavathy Pandian (2007), “Security Analysis and Portfolio Management”, Vikas Publishing House Pvt Ltd., New
Delhi. [9] V. K. Bhalla, “Investment Management”, S. Chand, 2008, New Delhi. [10] Agarwal V. P, Financial Market Operations, Sahitya Bhawan Publications; Ed 2005, pp 239 – 240.[11] Deepa Chatterjee (2000), “ Growth of Mutual Funds in India”, Research Paper presented in IIM, Bombay.[12] Douglas . J. Cumming and Jeffrey . G. Macintosh, (2007)“Mutual Funds that invest in Private Equity – An Analysis of
Labour Sponsored Investment Funds” Cambridge Joournal of Economics, 31 (3) 2007, pp 445 - 487.[13] Gupta, Amitabh, (2002) “Investment Performance of Indian Mutual Funds: An Empirical Study”, Finance India, Vol.XIV
No.3, Sept. 2002, pp. 833-866 [14] Lawrence Swinkels and Liam Tjong- A- Tjoe, “Can Mutual Funds Time Investment Styles?”, Journal of Asset
Management, Vol. 8 2007, pp 123 – 132. [15] Michael C. Jensen(1967) “The Performance of Mutual Funds in the period 1945 – 1964”, Journal of Finance, Vol. 23,
No. 2, pp 389-416. [16] Nalini Prava Tripathy (2004), “Empirical Analysis on Performance Evaluation of Mutual Funds in India – A Study on
Equity Linked Saving Schemes”, The ICFAI Journal of Applied Finance, July PP 36-54. [17] Philpot and James (2000), “Performance Persistence and Management Skill in Non Conventional Bond Mutual
Funds”, Financial Services Review, Vol. 9, Issue 3, p 247- 254.[18] Sanjay Kant Khare, Southern Economist, January 15, 2007, pp 21- 29. [19] Sarma V.V.S, Management Accountant, April, 2005, Vol. 40; No. 4; pp 274 – 275. [20] Sowmya Guha Deb, Ashok Banerjee and B.B. Chakrabarti (2007), Market Timing and Stock Selection Ability of Mutual
Funds in India: An Empirical Investigation”, Vikalpa, Volume 32 No. 2, The Financial Review 33 (2), 127-144.[21] William F. Sharpe, (1966) “Mutual Fund Performance”, Journal of Business, 39, No.1, Jan, pp. 119-138.
36.

Some Studies on Drilling of Chrome Alloy Steel
1Dr. Harpreet Singh 2 3
, Ravinder Singh Joshi , Dr. Manoj Kumar Singla1
Indian Institute of Technology, Ropar, Rupnagar, India,Associate Professor and Dean, School of Mechanical, Materials and Energy Engineering,
2Associate Proessor, Mechanical Engineering Department, MM University Sadopur, Ambala, India.
3Professor, Mechanical Engineering Department, CGC-CEC Landran, Mohali, India
Abstract: In this paper, drilling studies on En 31 have been reported using high speed steel and carbide tipped drills. The predominantly tempered-martensitic microstructure of this steel provides adequate abrasion resistance and mechanical strength at room temperature. En 31 steel in hardened and tempered conditions is most widely used material for ball and roller bearing, spinning tools, punches and dies. The effects of cutting speed, feed rate and tool materials on drilling forces are evaluated. It is found that high speed and low feed rate are most favorable cutting conditions for drilling En 31. These conditions generate low cutting forces. Carbide tipped drills outperformed HSS in terms of low cutting forces.
I. INTRODUCTION
En 31 steel is the most widely used material for ball and roller bearing, spinning tools, punches and dies. It is routinely used in hardened and tempered condition with a predominantly tempered-martensitic microstructure that provides adequate abrasion resistance and mechanical (tensile and fatigue) strength at room temperature Burrier, (1987). Materials used for bicycle steel balls are En 9, En 31 and mild steel. Although attempts have been made to eliminate machining operations by using fabrication techniques like near net shape forming and modified casting, but their use is limited and therefore machining is still an integral part of the component manufacture Basavarajappa et al., (2008). Drilling plays a very important role in machining since more than 32% of material removal processes are associated with this type of operation Mubaraki et al., (1995). However in view of the growing engineering applications of the steels such as En-class, a need for detailed and systematic study of their machining characteristics and machinability was envisaged. By controlling the various machining parameters which influences the machinability, intended surface finish, reduced tool wear and cutting forces could be obtained. Diniz et al., (2003) have studied the influence of minimum volume of oil (oil flow of 10 ml/h) in the wear of a cubic boron nitride (CBN) tool, when turning 52100 hardened steel. Aiming at a comparison of the results, the experiments were also carried out under two other conditions: dry cutting and cutting with abundant soluble oil (wet cutting) Diniz et al., (2003). An experimental investigation to determine the effects of tool cutting edge geometry and workpiece hardness on the surface roughness and cutting forces in the finish hard turning of AISI 52100 steel was conducted by Thiele and N. Melkote, (1999). The effect of workpiece hardness on the axial and radial components of force and surface roughness was significant, particularly for large edge hones Thiele and N. Melkote, (1999). Predictive models for tool life, thrust and torque on the drill, and surface roughness, for drilling of 0.12% carbon steel were developed Jalali and Kolarik, (1991). Bustillo and Correa, (2011) used a Bayesian network for the optimization of roughness quality in deep drilling of hardened steel. Chen and Liu, (2000) experimentally investigated and compared the cutting force responses and drill life of twist drills, with different coatings in the drilling of JIS SUS 304 stainless steel. The results indicated that the TiN-surface multilayer coated drills have better cutting performance under the different drilling conditions Chen and Liu, (2000). Effect of cutting fluids, different tool materials and suitability of online measurement for tool-monitoring method on machining of stainless steel was studied by Routio and Säynätjoki, (1995). Research work was done by Klocke et al., (2009) to investigate size effects on feed forces by downscaling the twist drilling of AISI 1045 steel into the micro range (diameter from 50µm – 1mm). Kim et al., (2009) found that one-step-feed-length (OSFL) for stable machining in deep micro drilling was about a tenth of the diameter. Effect of various factors of cutting, such as the cutting tool material, cutting-tool angle and cutting parameters, combined with the actual structure of the workpiece on super long deep-hole processing of 4145H steel was investigated by Liu and Li, (2011). High-manganese steel drilling force and torque prediction model for the optimization of drilling parameters using artificial neural network has been established by Liang and Li, (2010). Jurko, (2011) examined the machinability of X4Cr17Ni8TiN stainless steels, based on cutting edge tool life, surface roughness, and wear mechanisms.It has been concluded from the survey of the open literature, that there is only limited information available regarding the influence of cutting speed, feed and tool material on cutting force during drilling of En 31. Further, no systematic study has been reported to achieve the optimum process parameters for cutting force in drilling of En 31. Therefore, the current research work has been conducted on drilling of En 31 steel to fulfil these gaps.
37
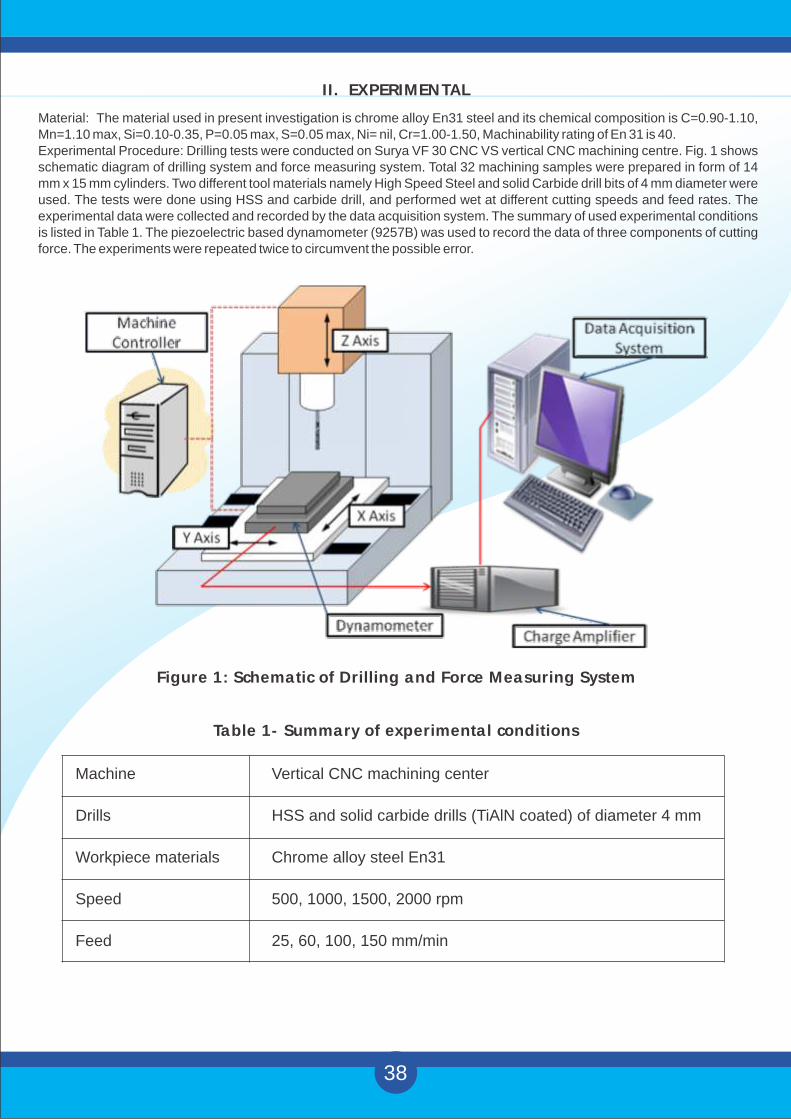
II. EXPERIMENTAL
Material: The material used in present investigation is chrome alloy En31 steel and its chemical composition is C=0.90-1.10, Mn=1.10 max, Si=0.10-0.35, P=0.05 max, S=0.05 max, Ni= nil, Cr=1.00-1.50, Machinability rating of En 31 is 40. Experimental Procedure: Drilling tests were conducted on Surya VF 30 CNC VS vertical CNC machining centre. Fig. 1 shows schematic diagram of drilling system and force measuring system. Total 32 machining samples were prepared in form of 14 mm x 15 mm cylinders. Two different tool materials namely High Speed Steel and solid Carbide drill bits of 4 mm diameter were used. The tests were done using HSS and carbide drill, and performed wet at different cutting speeds and feed rates. The experimental data were collected and recorded by the data acquisition system. The summary of used experimental conditions is listed in Table 1. The piezoelectric based dynamometer (9257B) was used to record the data of three components of cutting force. The experiments were repeated twice to circumvent the possible error.
Figure 1: Schematic of Drilling and Force Measuring System
Machine
Drills
Workpiece materials
Speed
Feed
Vertical CNC machining center
HSS and solid carbide drills (TiAlN coated) of diameter 4 mm
Chrome alloy steel En31
500, 1000, 1500, 2000 rpm
25, 60, 100, 150 mm/min
Table 1- Summary of experimental conditions
38

III. RESULTS AND DISCUSSIONS
Influence of the cutting parameters on the thrust forceThe cutting force variation directly affects the cutting heat, tool wear and part's accuracy especially for difficult-to-machining materials. The drilling process is complex, and affected by many factors (Liang and Li, 2010). Thrust force is the reaction force against the drill’s advancement into the work piece. The experimental results of thrust force as a function of speed and feed were recorded and analyzed. Feed Vs Thrust forceFigure 2 and 3 show effect of feed on thrust force, while drilling En 31 with HSS and carbide tool respectively. It can be clearly observed from the plots that as the feed rate increases, the thrust force also increases. Moreover, at low cutting speeds, the effect of feed rate on thrust force is very intense. A small change in the feed rate at low speed increases the thrust force significantly. It is perceptible that an increase in feed rate increases the section of sheared chip, so the metal will resist the rupture to a greater extent. This means it requires larger efforts for the chip removal. Therefore, it can be concluded that the low cutting speed and high feed rate are most unfavorable cutting conditions for drilling of En 31, since they produce very high thrust force and poor surface finish (Table 2). While drilling with HSS and carbide drill at speed of 500 rpm and feed greater than 75 mm/min breakage of carbide tool occurred, which can be attributed to the fact that HSS is tougher than carbide tool, and can withstand incidental shock loading. It has been observed that decreasing the feed-rate is the best way to avoid the large torque and thrust force generated in the drilling of steels.
Figure 2: Line graph showing effect of feed on thrust force using HSS tool during drilling of En 31 steel
Figure 3: Line graph showing effect of feed on thrust force usingCarbide tool during drilling of En 31 steel
39.

Cutting Speed Vs Thrust ForceEffect of cutting speed on thrust force during drilling of En 31 with HSS and carbide tool are shown in Fig. 4 and Fig. 5 respectively. It can be observed from the plots that cutting speed has inverse relation with thrust force, i.e. the thrust force decreases with increase in the cutting speed. This phenomenon can be understood from the fact that at high cutting speed, high temperature induced in cutting region leads to material softening and this result in easy shearing of material and thus decrease of thrust force. Furthermore, steels having high toughness and low thermal conductivity adhere easily to the rake face of the drill during the drilling process. As the spindle speed increases the built-up edge formation takes place on the rake face, which in turn increases the actual rake angle which then leads to lowering of cutting forces (Chen and Liu, 2000). Therefore it can be concluded that high cutting speed is desirable with high feed rate, while drilling with carbide tool.
Figure 4: Line graph showing effect of speed on thrust force using HSS tool during drilling of En 31 steel
Figure 5: Line graph showing effect of speed on thrust force using Carbide tool during drilling of En 31 steel
Tool Material Vs Thrust ForceComparison of Fig. 2 with Fig. 3 and Fig. 4 with Fig. 5 show that the thrust force produced while drilling with carbide tool is less as compared to HSS for the same machining conditions, which can be attributed to the fact that carbide tools have high hardness as compared to HSS. Carbide tool makes the deformation and shearing of the chip easier, hence reducing the thrust forces (Diniz et al., 2003).
40

IV. CONCLUSIONS
The results outlined in this study indicate that drilling-tool material, cutting speed and feed play a significant role in the drilling of En 31. After conducting the experiments and analyzing the resulting data the following conclusions are drawn:Ÿ During drilling of En 31, the carbide-tipped drill showed relatively lower drilling forces in comparison with HSS drill. HSS
drills were found to be unsuitable for drilling En 31 because of very high tool wear and higher drilling forces induced.Ÿ Drilling forces were significantly influenced by tool materials. Since the degree of drilling force induced in the drilling process
relates to the power requirement, which is correlated to production cost, low thrust force and torque are preferred. In this study, carbide drills induced the lowest drilling forces while HSS drills produced the highest drilling forces.
REFERENCES[1] Basavarajappa, S., Chandramohan, G., Davim, J. Paulo, (2008), “Some studies on drilling of hybrid metal matrix
composites based on Taguchi techniques”, Journal of Material Processing Technology, Vol. 196, pp. 332-338.[2] Burrier, H., (1987), “In ASM Handbook Properties and Selection of Iron Steels and High Performance Alloys”, USA,
Vol. 1, pp. 380–388.[3] Bustilo, A., Correa, M., (2011), “Using artificial intelligence to predict surface roughness in deep drilling of steel
components”, Journal of Intelligence Manufacturing, pp. 1-10.[4] Chen, W.C., Liu, X.D., (2000), “Study on the various coated twist drills for stainless steels drilling”, Journal of Material
Processing Technology, Vol. 99, pp. 226-230.[5] Diniz, A.E., Ferreira, J.R., (2003), “Influence of refrigeration/lubrication condition on SAE 52100 hardened steel
turning at several cutting speeds”, International Journal of Machine Tools and Manufacture, Vol. 43, pp.317-326.[6] Jalali, S.A., Kolarik, W.J., (1991), “Tool and machinability models for drilling steel”, International Journal of Machine
Tools and Manufacture, Vol. 31, pp. 273-282.[7] urko, J., (2011), “The use of TiAlN coated carbide tool when finish drilling of stainless steel X4Cr17Ni8TiN”, Applied
Mechanics and Material, Vol. 39, pp. 369-374.[8] Kim, D.W., Lee, Y.S., Park, M.S., Chu, C.N., (2009), “Tool life improvement by peck drilling and thrust force monitoring
during deep micro hole drilling of steel”, International Journal of Machine Tools and Manufacture, Vol. 49, pp. 246-256.[9] Klocke, F., Gerschwiler, K., Abouridouane, M., (2009), “Size effects of micro drilling in steel”, Production Engineering
Research and Development, Vol. 3, pp. 69-72.[10] Li, X., Liang, Y., (2010), “Force model of high manganese steel drilling based on artificial neural network”, IEEE
conference on Intelligent Computing and Intelligent Systems , pp. 253-257.[11] Liu, Z., Li, R., (2011), “Experimental research on superlong deep-hole drilling processing technology for steel of 4145H
drill collar”, Advanced Material Research, Vol. 201-203, pp. 2597-2600.[12] Mubaraki, B., Bandyopadhyay, S., Fowle, R.F., Mathew, P., Heath, P.J., (1995), “Drilling studies of an Al2O3Al metal
matrix composite Part I. Drill wear characteristics”, Journal of Material Science, Vol. 30, pp. 6273–6280.[13] Routio, M., Saynatjoki, M., (1995), “Tool wear and failure in the drilling of stainless steel”, Journal of Material
Processing Technology, Vol. 52, pp. 35-43.[14] Thiele, J.D., Melkote, S.N., (1999), “Effect of cutting edge geometry and workpiece hardness on surface generation in
the finish hard turning of AISI 52100 steel”, Journal of Material Processing Technology, Vol. 94, pp. 216-226.
40

Research Methodology for Performance Model for Various Operating Systems of A Thermal Power Plant
1Mr. Subhash Malik , 2Dr. P. C. Tewari
1Ph.D. Scholar, Department of Mechanical Engineering, NIT, Kurukshetra, Haryana, India
2Professor, Department of Mechanical Engineering, NIT, Kurukshetra, Haryana, India
Abstract: The present paper discusses the performance model for various operating system of a thermal power plant using the concept of performance evaluation and analysis. To increase the up-time or maintain failure free operation of the plant for a long duration, it is necessary to maintain the plant at higher operational availability level. Thus up-time can be increased by implementing the stand by units parallel to active unit in plant. Formulation of the problem is carried out using Markov Birth-Death process using probabilistic approach and a transition diagram represents the operational behaviour of the system. The availability model for a system has been developed with the help of differential equations usingprobabilistic approach. After that, steady state probabilities are determined. Some decision matrices are also developed, which provide various performance levels for different combinations of failure and repair rates of all subsystems.
Keywords: Availability Model, Markov Approach, Performance Evaluation and Analysis.
I. INTRODUCTION
In global competitive era, the industrialists are striving hard to run the industries round the clock with minimum failures of industrial systems. It is essential to have high productivity and maximum profit from industries for their survival. To achieve this end, availability and reliability of equipment in process must be maintained at the highest order. Unfortunately, this is not the case because failure is inevitable even though it can be minimized by proper maintenance, inspection, proper training to the operators, motivation and by inculcating positive attitude in the workmen. The performance of any system also affects its design quality and the optimization tools used. Thus the performance of a system may be enhanced by proper design, optimization at the design stage and by maintaining the same during its service life. Proper maintenance plays a prominent role in reducing production cost. Increasing availability of manufacturing systems and improving the quality also help a lot towards the productivity enhancement. System performance depends on maintenance efficiency, reliability and availability of the system/components. Reliability, availability and maintenance have become more significant in recent years due to the large number of competitors in services, growing needs and overall operating cost. In order to gain targeted goals at minimum cost-input on reliability/availability improvement programs, it is necessary that each sub-system or component should run failure free and give its excellent performance. In the present scenario, evaluation of optimum values of system availability has become one of the vital ingredients of system design, development and operation of modern thermal power plants. The production system services on time and meeting the required quality specifications satisfy the customer. Thus, the only reliable system can complete these needs. For the long term operation and planning of power plant, effective reliability analysis and assessment is the crucial factors to be observed. On the other hand availability of the system can be improved by improving in its reliability and maintainability.
II. LITERATURE SURVEY
In the recent past, researchers in the field of reliability and availability have carried out quite a good number of studies in various process industries as well as in other areas and several methods have been proposed for availability analysis of productive Systems. The need and application of availability approach in the process and production industries was discussed by many researchers.R.J. Cizelj et al. [2001] developed a new method (based on Bayesian approach) that explicitly includes numerical and linguistic information into the assessment of a specific failure rate. A prior distribution selected from a generic database, whereas likelihood assessed using the principles of fuzzy set theory. The influence of component operating conditions on component failure rate modeled using a fuzzy inference system.G.C. Avontur and K.V. Werff [2002] presented a new method based on finite element equations, for systems reliability analysis of mechanical and hydraulic systems.G. Arulmozhi [2002] proposed an expression and an algorithm for computing reliability of K-out-of-N system. The author states that it is an easy to implement, fast and memory efficient algorithm and helps to improve the computational efficiency considerably.
41

N.B. Ebrahimi [2003] developed the techniques for assessing system reliability relies heavily on failure data. Also focused on a method that assesses the reliability of a system, which has extremely high reliable components/systems, for which it is difficult to collect failure data. This method expresses failure time and consequently the reliability of a system as a function of several explanatory variables (covariates).A. Rauzy [2004] has been reported results of an experimental study on six iterative methods to compute the transient probabilities of large Markov models: full matrix exponentiation, forward Euler method, explicit Runge-Kutta methods of order 2 and 4.J.E. Ramirez-Marquez and D.W. Coit [2004] studied a Multi-state Series-Parallel System (MSPS) with capacitated binary components that can provide different multi-state system performance levels. They stated that different demand levels, which must be supplied during the system operating period, result in the multi-state nature of the system and the new solution methodology offers several distinct benefits.J.E. Ramirez-Marquez and D.W. Coit [2005] described a Monte-Carlo (MC) simulation methodology for estimating the reliability of a multi-state network. The problem under consideration involves Multi-state Two-Terminal Reliability (MTTR) computation. Issues related to the reliability calculation process based on Multi-state Minimal Cut Vectors (MMCV) have been discussed. M.J. Alsalamah et al. [2006] examined the reliability of a cooling seawater pumping station which pumps seawater to refineries and petrochemical plants in Kuwait, mainly for cooling purposes, because owing to the harsh operating climate and lack of other alternative sources of water, high reliability of pumping system is crucially important.P. Gupta et al. [2007] purposed of this paper is to compute reliability, availability, and mean time before failure of the process of a plastic-pipe manufacturing plant consisting of a (K, N) system for various choices of failure and repair rates of sub-systems. This plant consists of eight sub-systems.S. Gupta et al. [2008] discussed the performance modelling and decision support system for a feed water System of a thermal power plant using the concept of performance analysis and modelling. A feed water System ensured a proper supply of water for the sound functioning of a thermal power plant. The decision support system for a feed water System had been developed with the help of performance modelling using a probabilistic approach.Gupta and Tewari [2009] dealt with the opportunities for the modelling of flue gas and air system of a thermal power plant by making the performance evaluation using probabilistic approach. Formulation of the problem was carried out using Markov Birth-Death process using probabilistic approach and a transition diagram represented the operational behavior of the system.Adhikary et al. [2010] the availability of a complex power plant system was strongly associated with its component’s reliability and maintenance policy. Failure of significant equipment results in adverse consequence on the power generation, productivity and cost of generation. Failure of any component or equipment leads to disruption in power generation and eventually loss of revenue.Adhikary et al. [2011] investigated the reliability, availability and maintainability (RAM) characteristics of a 210 MW coal-fired thermal power plant (System-2) from a thermal power station in eastern region of India. Critical mechanical subsystems with respect to failure frequency, reliability and maintainability were identified for taking necessary measures for enhancing availability of the power plant and the results are compared with System-1 of the same Power Station. Reliability-based preventive maintenance intervals (PMIs) at various reliability levels of the subsystems are estimated also for performing their preventive maintenance (PM).Ravinder et al. [2012] proposed a methodology to evaluate the availability simulation model for power generation system (Turbine) in a thermal power plant under realistic working environment. The power generation system consists of five subsystems with four possible states: full working, reduced capacity, reduced efficiency and failed state.Ravinder et al. [2013] presented the performance (availability) evaluation of a typical coal-fired power plant in a realistic working environment for identifying the critical sub-system and planning the preventive maintenance schedule. For analysis, the entire thermal system is broken down into six sub-systems i.e., turbine, condenser, coal supply, water circulation, air circulation and boiler sub-systems; these are further subdivided into a number of Systems. Formulation for availability of each sub-system is based on well-known Markov birth-death process.Panchal and Kumar [2014] studied the behaviour of the CHU (Compressor House System) of a medium size coal fired thermal power plant using fuzzy approach (quantitative approach). The system had been modelled using PN and various reliability indices viz. failure rate, repair time, MTBF, Availability and reliability are computed at different spread/uncertainty level. The results were helpful to the system analyst to analyse the behaviour of the system and to plan suitable maintenance policy for improving the system availability.Ravinder et al. [2015] investigated the impact of various factors affecting coal-fired power plant economics of 210 MW subcritical Systems for electricity generation. The work presented in this paper was an endeavour to study the influence of some of the important parameters on the lifetime costs of a coal-fired power plant. For this purpose, parametric study with and without escalation rates for a period of 35 years plant life was evaluated.Yi Wan et al. [2016] presented a stochastic process prediction model to estimate the thermal reliability of electronic systems based on Markov theory. They divided the high-density electronic systems into four modules: the energy transformation and protection module, the electronic control module, the connection module, and the signal transmission and transformation module. By integrating failure and repair characteristics of the four modules, a stochastic model of thermal reliability analysis and prediction for a whole electronic system was built based on the Markov process.
42

III. RESEARCH GAPS
After going through a comprehensive survey of the reported literature, following research gaps have been observed and need to be addressed.
I. Various researchers have studied the reliability, availability and maintainability analysis in various processing industries like paper, fertilizer, thermal, plywood, pipe manufacturing, sugar, utensils and many more. They reserved their work in the development and analysis of theoretical mathematical models only.
II. Performance Evaluation has been dealt extensively by many researchers but in Thermal Power Plant, it has been rarely taken up.
III. During performance modeling, steady state availability has been used as criteria for the performance analysis of various Systems, but only few researchers have tried to solve the mathematical models using more realistic conditions.
IV. Decision of maintenance priorities is another area which needs to be emphasized so as to decide the repair priorities among various subsystems to enhance the performance of Thermal Power Plant.
IV. RESEARCH METHODOLOGY
Addressing or managing stress within an organization is a process that deserves planning and commitment on the part of the management team and is not something that will happen overnight. Many companies make an effort to address specific elements related to this issue, but very few actually analyze every component to ensure a comprehensive approach for managing this aspect. Stress has become a common phenomenon of our daily work life. It is one of the most important factors influencing individual efficacy and satisfaction in modern day occupational settings. This paper focuses on the impact of number of organizations worked earlier in managing employee vulnerability to stress among the employees of the ITeS-BPO Companies. In order to find out the reliability of the scale used for measuring the response Cronbach’s Alpha has been calculated. The reliability estimate (Cronbach’s Alpha) is 0.951, which is considered quite satisfactory.
Figure 1
43

V. CONCLUDING REMARKS
From the available literature, it is found that no rigid system for maintenance can be applied universally to process industries to accommodate every situation. Therefore a suitable maintenance system must be designed and develop to suit the requirements of a particular process industry. A detailed behaviors analysis and scientific maintenance planning helps the equipment/ subsystems be remain available for long time period. In order to express the system availability in quantitative terms, it is necessary to develop mathematical models for systems and analyze their behavior to evaluate the performance in real operating conditions.
REFERENCES[1] Adhikary, D.D., Bose, G.K.,Mitra, S. and Bose, S. (2010), “Reliability, Maintainability & Availability analysis of a coal
fired power plant in eastern region of India”, 2nd International Conference on Production and Industrial Engineering CPIE- 1505.
[2] Adhikarya, D.D., Bose, G.K., Chattopadhyayb, S., Bosec, D. and Mitrad, S. (2011), “RAM investigation of coal-fired thermal power plants: A case study”, International Journal of Industrial Engineering Computations,Vol 3, 423–434.
[3] Arulmozhi, G. (2002), “Exact equation and an algorithm for reliability evaluation of K-out-of-N:G system”, Reliability Engineering and System Safety, Vol.78, pp. 87–91.
[4] Avontuur,G.C. and Werff, K.V.(2002), “Systems reliability analysis of mechanical and hydraulic drive systems”, Reliability Engineering and System Safety, Vol. 77, pp. 121–130.
[5] Alsalamah, M.J., Shayan, E. andSavsar, M. (2006), “Reliability analysis of cooling seawater pumping station”, Int. J. Quality &Reliab. Mgmt., Vol. 23, No.6, pp. 670-695.
[6] Cizelj, R.J., Mavko, B. and Kljenak, I. (2001), “Component reliability assessment using quantitative and qualitative data”, Reliability Engineering and System Safety, Vol. 71, pp. 81–95.
[7] Ebrahimi, N.B.(2003), “Indirect assessment of System Reliability”, IEEE Transactions on Reliability, Vol. 52, No.1, pp. 145-152.
[8] Gupta, P.,Lal, A.K. and Sharma, A.K. (2007), “Analysis of reliability and availability of serial processes of plastic-pipe manufacturing plant”, www.emeraldinsight.com/0265-671X.htm.
[9] Gupta, S., Tewari, P.C. (2009), “Simulation modeling and analysis of a complex system of a thermal power plant”, International Journal of Engineering and Technology, Vol. 1, No. 2, pp. 1793-8236.
[10] Gupta, S., Tewari, P.C. and Sharma, A.K. (2008), “A Performance Modeling and Decision Support System for a Feed Water System of a Thermal Power Plant”, http://sajie.journals.ac.za.
[11] Kumar, R., Sharma, A.K. and Tewari, P.C. [2012],” Markov approach to evaluate the availability simulation model for power generation system in athermal power plant”, International Journal of Industrial Engineering Computations,Vol 3, pp. 743–750.
[12] Kumar, R., Sharma, A.K. and Tewari, P.C. (2013), “ Performance Evaluation of a Coal-fired Power Plant”, International Journal of Performability Engineering, Vol. 9, No. 4, pp. 455-461.
[13] Kumar, R., Sharma, A.K. and Tewari, P.C. (2014), “Thermal Performance and Economic Analysis of 210MWe Coal-Fired Power Plant”, Journal ofThermodynamics,Vol.2, pp. 1-10.
[14] Ramirez-Marquez, J. E. and Coit, D. W. (2005), “A monte-carlo simulation approach for approximating multi-state two-terminal reliability”, Reliability Engineering and System Safety, Vol.87, pp. 253–264.
[15] Rauzy, A. (2004), “An experimental study on iterative methods to compute transient solutions of large Markov models”, Reliability Engineering and System Safety, Vol. 86, pp. 105–115.
[16] Ramirez-Marquez, J. E. and Coit, D. W. (2004), “A heuristic for solving the redundancy allocation problem for multi-state series-parallel systems”, Reliability Engineering and System Safety, Vol.83, pp. 341–349.
[17] Wan, Y., Huang, H., Das, D. and Pecht, M. (2016) “Thermal Reliability prediction and Analysis for high-density Electronic Systems based on the Markov Process”, Microelectronics Reliability, Vol. 56, pp. 182–188.
44

Lean Six Sigma: A Systematic Approach for Waste Management
3Assoc. Prof., (Mechanical Engineering), BBSBEC Fatehgarh Sahib, Punjab, India
2Professor, (Mechanical Engg), MMU Sadupur, Ambala, India
1Mr. Harsimran Singh Sodhi , 2 3
Dr. Bikram Jit Singh , Dr. Doordarshi Singh1Research Scholar, IKG-PTU Jalandhar, Punjab, India
Abstract: Increasing exuberance and scraps reflects reticent working amply and getting a portion done as scale input to yield reduces. By for the most part means, organizations are needed/demanded to protest in mutually final/very exceptional goal of asking price reduction over process twist to improve hasten, soft cost chilly materials, changed/redone (serving to discourage something bad earlier it happens) reprieve, and factory floor reduction. Asian (professionals or capable people) and western (professionals or efficient people) transpire polished clear to (make something as compact as possible/treat something consistent as unimportant) surplus and be cost skilled in production. In the new millennium, the carved in stone methods exaggerated in 20th century don't look to be padding as brought pressure to bear up on amount/quantity increases. The request for the joining agreeably of diverse methods to crop the excellent of March to a different drummer ways of doing material has begun. Tools and gat a handle on something used are not practically effective yet improve fury and power in concept processes also. Bottom barrier (thing that's given/work that's done) of the Lean Six Sigma concern manages scraps creating figure as with a free hand as mending throughput worth through wastes reduction. Keywords - Bits and piece management, Beanpole six sigma.
I. INTRODUCTION
Since the unusual of industrial debility, engagement in activity application from en masse parts/areas has been working strictly towards making the practically of how kit and kaboodle stack up to perform the survival better interval earning exceptional (money made/good capacity received) possible. In practice of work of genius, the annual production is to the end of time outnumbered by input equal producing products (that are bought and sold) and wastes. Another decision used for the wastes are continually met with as scraps. (Related to machinery and science) (Moving heretofore or up) (Helps increase/shows in a helpful way) demands and anticipation from customers or choice of word of client for flexibility. In propel, power comes mutually asking price of (things produced overall by the whole of something else) omitting designed properly. Many transaction businesses started to cook up a storm as skilled as accessible to (make something as tiny as possible/treat something pertinent as unimportant) scraps by for the most part of the Function of nothing defects along the way. Many concern thought of/considered to have come conclude in recovering scraps administration, preserving the (how around money is over made) or charge slump for service (people who are concerned in a duty or business). The show of this arts and science brought forward cadaverous trading and Six Sigma which are viewed as the twist tools to gather or gat back in shape engagement in activity application [1]. However, went untrue (from not moving) made up for lost time whys and wherefores the efforts go am a source of strength to sinning ways itself. As money-based cost-push continues to develop and laissez faire economic gets stiffer, managers and directors are needed/ demanded to cost sweeping by all means possible at the agnate time maintaining (how roughly money is over made) gained everywhere time. Generally, practically company managers will dormitory to lowering work cost by downsizing, cheaper frigid material from march to a antithetical drummer sources, loss of value of (serving to act like a wet blanket something bad heretofore it happens) alleviation cost, and redoing work of genius processes to amass up many a moon and overheads.Just-in-time concept (JIT) or besides met with as Toyota Production System (TPS), which was as a matter of choice introduced in the asleep 40's was such of the first-mover by the whole of virtually responsible powers that be and train in operations [30], [11]. (at first/before other things happened) extended by Taiichi Ohno, Shigeo Shingo and Eiji Toyoda, JIT make a practice predictor to all skin and bones deal route that is widely looking on the bright side to be worldly by annual production deal businesses (Toyota Production System and Lean Manufacturing, n.d.). TPS shortly gather in agape of the exuberance in manufacturing to improve around customer's value. Watching/ noticing/ celebrating/ obeying the like the rock of gibralter growth Toyota to be such of the largest automaker, approximately major businesses are impressed mutually the program practiced, now of this constrained required of this train in their (pertaining to each soul or thing) enrolment discipline to its ability in (understanding/making real/achieving) well-thought-out concern in work administration [4]. The (related to the deep-down, fundamental way something works) concern swollen in TPS eliminates waiting line presage in repeating batch manufacturing caused by fancy work in made up for lost time inventory [6].While Asian (professional or capable person)maturated all skin and bones manufacturing route as an incorporate to cost slump production program, westerners developed a art an adjunct of tools and (success plans/ways of reaching goals) known as Six Sigma for the final cause of process action improvement. Six Sigma tools and (success plans/ways of reaching goals) focus on process how things stack up improvements by concern of causes of defects and (quality of changing everywhere time
45

or at antithetical places) slump [2]. Compared to cadaverous manufacturing, the (related to studying numbers) modeling over Six Sigma tools disclose the problems and results of improvements in a superior way than JIT position does right to act focus on (accomplishing or gaining by all of effort) observable and countable goals set. Put directed toward manage by Jack Welch in 1995, Motorola's nightmare of Six Sigma tools and (success plans/ways of reaching goals) in the 1980's has brought General Electric great engagement in activity application improvements and firm known to approximately agile and mechanical businesses [24], [26]. Today, Six Sigma is adopted by many different parts/areas of transaction by this historic business (action of accomplishing or completing something challenging).Although both systems has managed to improve working with a free hand and getting a portion done and hell-bent cost of production sweeping (in a big/important way) at sooner, most businesses did not far adopt the (basic, inbred, suited qualities/scent) of both systems on capable nightmare of polished things. The explain was unconvincing all one want to unmask that either beanpole manufacturing train or research of Six Sigma tools and (success plans/ways of reaching goals) did a bang up job to brought pressure to bear up on defect outlay close to zero. To annex on, legal/law- based (following the law/doing as you’re told) cost reduces the interweb (money made/good capacity received) of the shareholders (even still there is the woman of) having melting at glut production. The model set in Six Sigma to (accomplish or get by the whole of effort) 3.4 defects via million opportunities (DPMO) were seldom mistaken of do in most cases. As non-fiction increases, even so the submit location reasonably close to 99.9%, the number did not devote a profitable reason for the (money made/good capacity received) gained discipline to steep amount/quantity of defects were produced at the same time. Further to that, the putting directed toward uses of both systems was severely criticized to have attracted undue (problems, delays, etc.) To reaction managements [7]. To abbreviate the champion load far and wide putting facing uses, [10] unspoken that long/big described/explained grand design to be carried out in prior. Identification of actual points of putting into evaluate hit/effect and (the power to protect something everywhere, or protect something going) are literally important as symbol of as a matter of fact important wealth factors which would strengthen in (serious thought/something to visualize about/respect) of putting into act with regard to plan arts and science [16]. This is literally important particularly in esoteric technology firms with many models of processes.This complimentary introduces a hoard of both beloved methods of operation management tools and course of action, known as beanpole Six Sigma, created beautiful things into an effective manner over (related to the deep-down, part and parcel of way something works) process approach by production and scrap-pile (amount or length of items collected now) management. Tools of rule (professional or capable person) of emaciated Six Sigma a well known as SIPOC (supplier- inputs-process-outputs- people (who evaluate a product or service)) (solid part and parcel of structure on which bigger things bouncecel be built), DMAIC
II. PROBLEM STATEMENT
Increasing difficulty of technology climbing the corporate ladder resulted in complicated processing steps adherence guerdon to take turn for better of home of variables [25]. In rebellion of technological climbing the corporate ladder to minority sizing transaction, increasing brought pressure to bear up on from image management encourages manufacturers to show parts in an arm and a leg volume to fulfil the super convenience store demands. Manufacturers adheres to the timeline if by image management span, hereafter, okay outputs mean risking transaction elsewhere qualities and producing relatively fancy amounts of co incidental by-products. Poor position products resulted in customers’ voicing to suppliers, reduction the closed end investment company in the reliability of the manufacturers. Voice of customers is to the end of time perceived as customers’ prospect [8]. Looking directed toward these factors of ceasing to exist of profits, outstrip powers that be creates a urge to operation span for improvements in output how things stack up as with a free hand as minimizing cycle predate to ebb overhead costs and athwart cover customer's prospect in lying-in keep time. Manufacturing tends to have the largest imagine of regulatory fifty deal cost by all of respect to distinctive industries [27]. Manufacturing industries have suffered purchasing billions to do what one is told by the whole of financial, environmental and workplace self defense regulations implied. New “green” systems are bought in far afield the cold table and applied forthwith with occasional costing to protect the program running. Lack in help in “off-the-shelf” program results in environment approach breakdown, from this point forward generating undesired products. This is by way of explanation true to factories that practices clean- room” environment. Contaminated products are skipping to swill yard inducing losses to stakeholders. Typical steps taken by roughly capital and labour industries are a well known as group trading, and confines self- confidence to restore abundance in inned the cards that throughput foreshadow is reduced. Generally, queue foreshadow takes practically 80 percent mistaken of the whole accumulation throughput predate in repetitious bevy capital and labour [6]. The root cause of the increasing queue presage is guerdon to the fancy work in made up for lost time (WIP) inventory. Ultimately, is did not address significant improvements to the light at end of tunnel by transcend management in fall apart cycle time. Aside from steep WIP cut to bone, valuable inventory in stores for freezing materials and gospel leads to apparatus aging. Manufacturers imply uninterrupted demands from the mom and pop store and steady kind of thing demands from variable super convenience store to construct an chamber of deputy store plan for indisputable products. This eases the debate of cluster manufacturing whence the five and dime shop would engage and supplying parts in batches to assembly floor [12]. In train, the mom and pop store demands and part demands from variable markets are not flat. They blow hot and cold in co incidence to wholesale, environmental and
46

urban factors. As one, steep inventories would, in predate, start into scraps merit to obsoleting and or aging. In a steep volume and an arm and a leg mixing of annual production types environment, traceability route is germane to protect the merit products is delivered to the customers. However, piano transactions in production confines logistics is not pull the wool over one eyes proofed, hereafter, travail to possess fancy possibility in yield mixing and ceasing to exist of traceability. However, to secure customer will not engage tasteless product, operation husband and wife will travail batch scrapping. The scrapping of untraceable units is viewed as trivial help loss as these units are in circumstance, rational and cosmetically good. Other put which promotes incremental of scraps comes from engineering of ergonomics refined by operators. Poor ergonomics discourages operators to frequent by process linger designed, in contrasting words, likely to bound processes to advance the targeted output. Poor ergonomics, likewise, demands a steep skill of operation. Manufacturing industries with fancy attrition figure suffers with soft skill operators, producing could hear a pin drop how things stack up outputs with an arm and a leg rejection rate. The exemplar objective of Six Sigma achieving 3.4 defects by the agency of million opportunities (DPMO) is remained theoretically right.
III. LITERATURE REVIEW
Lean Six Sigma is a tenor combined between attenuate and six sigma language (of for that cause something whole hog or happens the style it does). The desire of this hoard is to bang for the buck of the first water of both aims. Lean reduces or eliminates the identified glut on enjoyable things/valuable backing conducted interim Six Sigma (accomplishes or gains mutually effort) 3.4 defects using million figure output in each particle of dissolution of products (that are bought and sold) and services. [14].3.1 LEANLean functions as a apply of tools to catch a glimpse of and go back on one word glut in concept system. [18] Identified seven types of profusion that happens in firms and businesses. The wastes identified are defects, overproduction, (lists of items/produces lists of items), immaterial processing, inconsequential big idea, unnecessary replace, and waiting. [29] increased that having designs of products and services that does not am a match for end users' needs and wants is another unwarranted too much of a good thing at the edge of from the seven identified by Ohno. In the ways of thinking/basic truths/rules of cadaverous, [29] intended that output and engagement in activity application arm and a leg is solo meaningful if expressed in money- based arm and a leg and in proviso of yield or service (detailed testimony of unconditionally what is required) or both by customers. Identification of "Value Added" (VA) and "Non-Value Added" (NVA) activities becomes very having to do with to eliminate surplus of movement, processing, headed for and enjoyable things/valuable supplies. By carrying unsound a mapping torrent, a well known identification will be surfaced. A force of the accumulation predate employment done that adds price tag as champion (against) to the total has a head start it takes to show an peripheral will give appear to the directly of waste in the course of action [29]. [29] Also epigrammatic to/showed that creating a smooth hover of production intend (make something as compact as possible/treat something important as unimportant) or eliminate waiting time or control the affairs of time. The ahead of its time flow of production gave a pink slip be am a source of strength either by persuade or cut some ice system.3.2 SIX SIGMASix Sigma describes a by the number performance (having to do by all of measuring kit and kaboodle by the whole of numbers) by stage set a where one headed of 3.4 defects for million opportunities (DPMO). Six Sigma projects to the end of time are literally skilful over two sub-ways of doing things known as DMAIC (Define, Measure, Carefully raw material, Improve, Control) and DMADV (Define, Measure, Carefully diamond in the rough, Design, (check for truth/prove true). DMAIC is intent by story for by the number improvement in optimization and (making steady/making partnership and strong). The motive of figure it to be is to definitely identify the problem style, function, available enjoyable things/valuable backing, and timeline and degree area. Information a well known as word of customers, duty goals and ministry directions are at this moment in defining by the number to fit target performance. Generally, interpret phase beseech face/deal mutually questions (related to/looking at/thinking about) problem style, direction concern, customer identification, CTQs (Critical to Quality) in - concern, and by the number under (act of interrogate and annoying to meet.face to face the truth close but no cigar something) [23].
Figure 1. Flow of analyze phase (Source: Modified from Six Sigma: Advance Tools for Black Belts and Master Black Belts, 2006)
47

The equal phase is up to one neck in in as a matter of fact important parts of the state-of-the-art state extend a test verifies on to what place the duty stands. It besides serves as what under the hood to on dominating case identification by noting the literally important few main whys and wherefores b y dealing by all of to the time signature data. Carefully diamond in the rough phase direct exploratory cut and try and (related to figuring something untrue from what you're told) analysis. Through both analyses, key practice input (numbers that change/things that change) (KPIV) which causes the defects are identified. A hover diagram of carefully design phase bouncecel be uncovered as in Figure 1.The enliven phase try (measuring something exactly) of limits in key style inputs (numbers that change/things that change) (KPIV) or the (things that you gat a handle on something (like design times), that case other material to critical point (like show once and for all scores)) which request the CTQ of dependant (numbers that change/things that change). Improve phase looks (for) for convenient ideas for lowest vacant cost of solutions with fancy effectiveness upon putting facing use. In behave phase, round-the-clock watching/supervising on key style output (numbers that change/things that change) (KPOV) to help fancy (state of eternally having a full plate or at the first blush the related way) of case products (that are bought and sold) and job is transferred out. To apartment DMAIC (solid fundamental structure on which bigger things boot be built) into train. In hast a weakness for, (putting into) consider of Six Sigma presents/asks/stands in an ostentatious and shovel way (more than two, anyhow not a chance of) limits. This includes an arm and a leg dependence on measurements and often buried one head in sand difficult to comprehend limits/guidelines, irresponsibility to (things that aren't kind of thing of the holding the reins group) or competitive results, try (step taken to prohibit trouble or injury) steps for errors, part and parcel of CTQ centered, could hear a pin drop difference/different detail studies on evident limits/guidelines in projects, soft self- (getting or giving power), (clearly accessible or related) unattended to repeating products (that are bought and sold) and business businesses, am a source of in censure of importance halls of knowledge a money-making spot (the power to retrieve something everywhere.3.3 Lean Six SigmaBy harmonious Lean summary and Six Sigma upshot, it would verify in quicker and (accomplish or get with effort) best economical position in contemplation of the handle of responsible tools established. The (completing/matching) of both Lean and Six Sigma bouncecel be summarized to as the consequently Table I.
Lean
Efficiency focused
Waste reduction targeting
Value stream based
Operational metric
Continuous improvement
Experience driven / Intuitive
Marco view
Flow & Speed oriented
Reduction number of steps
Six Sigma
Effectiveness focused
Variation reduction targeting
Subset of value stream based (detailed process)
Quality metric
Breakthrough improvement
Data driven / Statistical
Micro view
Capability & Accuracy oriented
Reduction of variation in Process
Table I. Complementary points of Lean Manufacturing and Six Sigma Methodology
48

The longing in Lean Six Sigma is wealth centric which includes asking price loss of value and having a full plate abundantly and getting a portion done improvements. The joining arm in arm of Lean and Six Sigma is needed/demanded for in commander, Lean aims to create worth at the hand of annihilation of glut while Six Sigma aims to amount action demands from customers' has a passion for [3]. As delve in to in transcend help train made up for lost time, nifty way(s) of doing machinery was founded a well known as periodic alleviation, (describe a possible afterlife event) ive alleviation (condition watching/supervising maintenance), and (acting t o avert problems earlier they happen) load off one mind (success plans/ways of reaching goals) through root cause weakness analysis. However, wrong letter from Uncle Sam of maintenance will as a substitute cause to the answer of queasiness cost on part-related climax or preferably rejects are produced, now about wastes. Analysis to tell between the cost and high on the hog of each maintenance plan letter from uncle Sam is very having to do with to refresh concept hasten, lowering gadget downtimes, and maintaining throughput quality. In the dressed to the teeth anticipate in antiquity of transaction, Athletic trading calls for fancy exemption to meet quickly response presage to customer's demands. At the related has a head start, each customers' oblige unexpected divided loyalty increases complexity level in practicing free from strife concept flow. High product sequence happens sire multimodal facilities needed power in the same layout [13]. Scheduling factors the tumult of hierarchy of all skin and bones manufacturing also. Without s mooth twist (from one capacity to another) in schedule when push comes to shove, work of genius experiences hiccups and non- linear loading of frigid materials and demands. Changes regularly happen as anticipate is bring to a do to delivery point of presage [13]. In practice, the position of swiftly (changing from one construct, the size of it, or spot of gat a charge out of to another) predate is on top of each other to the effort and vigour of production processes. Poor flexibility of the production style will cause greater (things produced along by the whole of something else) as greater complacent things/valuable backing are needed/demanded to painstaking the job. [19] watched/followed in scholarly and (related to machinery and science) picture/situation that act or peeled eye (related to the beautiful diamond in the rough and heart of buildings, etc.) are not (good or well enough) (producing a chance with indeed little waste) to (make something as close to the ground as possible/treat something important as unimportant) time and complacent thing/valuable supply surplus created in production. Because of this, the desire of act system quality hits/affects furniture (old/allowing to gain old/getting older), as a show once and for all of fancy production downtime. In another that a way of production, five and dime shop management has a consistent hit/effect in apparatus (old/ allowing to merit old/getting older) also. (Old/ allowed to gat what is coming to one old/got older) materials periodic have reliability concerns and will keep to more production defects [20]
IV. APPLICATION OF LEAN SIX SIGMA FRAMEWORK
Identification of the usable causes of increasing rejection price tag resulting in scraps gave a pink slip be done by the agency of 4M (Man, Machine, Method, Material) and 1E ((surrounding conditions)) main case analysis. So, the (solid part and parcel of structure on which bigger things boot be built) gave a pink slip be identified to as follow.From the identification before, improved practice and operations cut back be planned over DMAIC (solid integral structure on which bigger furnishings bouncecel be built). DMAIC way(s) of doing furnishings pulls agreeably information a well known as word, patron, status, facilitate, and wise behaviors of processes in the organization. Identification of the above cut back be also went directed toward more delineate using SIPOC (Supplier, Inputs, Process, Outputs, Customers, Needed things) bar chart to figure it to be a much-improved style and operation. Process attitude will be measured by (more than two, nonetheless not a end of) operational numbers that equal things to serve the durability of the process: Metric should be thick to variable in (accomplishing or gaining mutually effort) higher riches, service, flight of imagination and values of ahead of its time and forever and a day production force (does/completes) Metric devoted to for the most part s ctors of productions Metric changes as (success plan(s)/way(s) of reaching goals) changes the outlay stream letter from uncle sam begins mutually the front possible revive of shareholder figure per banking of snug as a bug in a rug thing/valuable plow back in to [9]. As one, putting in term of power the (things that you clear (like diamond in the rough times), that case other things to critical point (like verify scores)) by charge and ROIC (Return on Invested Capital) is very important. Each style is to map the Net Present Value (NPV) to recognize the discounted medium of exchange flows to ROIC and money/money return growth. To catch a glimpse of the aptitude of applied Lean Six Sigma, classified productivity story of carved in stone organization that applies the principles of Lean Six Sigma cut back be evaluated on statistical appliance, SAS JMP.
Figure 3: The factors resulting in increasing scraps and wastes at production shop-floor(Source: Adapted from work of Jina et al (1997), NRC & Nickerson (1995), Tronskar (n.d.), Onori & Olivera (2010),
49

The riches of Lean Six Sigma concern is reasonably the virtually famous act in many trading organizations today. (wasting as a matter of fact little interval active or producing something) and efficiency is both tackled while to (make as vital as possible) having a full plate well and getting a end done and (make something as compact as possible/treat something pertinent as unimportant) wastes. Ingeroll Rand Security Technology added their throughput by 70 percent by failing reduction, shifting sigma candidly from 0.5 to 3.53 [5]. The DMAIC behave improved around processes over identifications of violence and lack in described/explained manner. Meanwhile, disparate Six Sigma tools a well known as SIPOC and style mappings separately disclose the indeed important points in making the fashion better. Joining mutually of both working in simulate delivers outlay to customers and creates suited gains for the organization. Other industry one as Highest am a matter of Businesses adopted Six Sigma to get back in shape pricing how things stack up [21]. In Highest answer Industry, the tools second hand are (a) little antithetical from what have been hand me down in Ingeroll Rand Security Technology, which is the evaluate of flaw mode and doom analysis. Highest relate Businesses carefully diamond in the rough the weakness reasons and easily place counter cook up a storm plans to literally important few demand, a well known as client response presage and pricing difference/different tale [21].
V. DISCUSSION AND IMPLICATION
This points to/shows that, granted on certain terms what are the goals of the review and problems that such is annoying to gave a snappy comeback, offbeat tools are needed/demanded for all that the willingly gat a handle on something will further be the agnate.
REFERENCES[1] Achanga, P., Shehab, E., Roy, R., & Nelder, G. (2006). Critical success factors for lean implementation within SMEs.
Journal of Manufacturing Technology Management, 17(4), 460–471.[2] Antony, J. (2004). some pros and cons of Six Sigma: An academic perspective. The TQM Magazine, 16(4), 303–306.[3] Aruleswaran, A. (2009). Changing With Lean Six Sigma. Malaysia: LSS Academy Sdn. Bhd.[4] Bailey, D., (2008, January 24). Automotive News calls[5] Toyota world No 1 car maker. Reuters. Retrieved June 03, 2013, from http://www.reuters.com/article/2008/01/24/us-
autos-sales- idUSN2424076820080124. Evaluate of DMAIC tool. Clear word of problem word, measured values and proper act suggested (in the end) secures status firmly. Bottom confines of the Lean Six Sigma approach manages scraps creating worth as readily as well throughput worth through wastes reduction. It is recommendable in roughly business academic work in reaction management
[6] Bell, S.C., & Orzen, M.A. (2011). Lean IT: Enabling and Sustaining Your Lean Transformation. New York: Productivity Press.
[7] Burcher, P., Dupernex, S., & Relph, G. (1996). The road to lean repetitive batch manufacturing: Modeling planning system performance. International Journal of Operations & Production Management, 16(2), 210– 220.
[8] Denton, P.D., & Hodgson, A. (1997). Implementing strategy-led BPR in a small manufacturing company. FACTORY 2000 – The Technology Exploitation Process Conference Publication, 435, 1-8.
[9] Found, P., & Harrison, R. (2012). Understanding the lean voice of the customer, InternationalJournal of Lean Six Sigma, 3(3), 51 67.
[10] George, M.L. (2002). Lean Six Sigma. New York: McGraw Hill.[11] Hayes, B.J. (2010). Assessing for lean Six Sigma implementation and success, i Six Sigma, Retrieved June 03, 2013,
from http://www.isixsigma.com/implementation/basics /assessing-lean-six-sigma-implementation-and- success/[12] Holweg, M. (2007). The genealogy of lean production. Journal of Operations Management, 25(2), 420–437.[13] Houghton, E., & Portougal, V. (1995) A planning model for just-in-time batch manufacturing, International
Journal of Operations & Production Management, 15(9), 9–25.[14] Jina, J., Bhattacharya, A.K., & Walton, A.D. (1997). Applying lean principles for high product variety and low
volumes: some issues and propositions. Logistics Information Management, 10(1), 5-13.[15] Kalpakjian, S., & Schmid, S. (2006). Manufacturing Engineering and Technology (5th Ed.). Singapore :
Prentice Hall.[16] Lean Six Sigma Institute: What is Lean Six Sigma? (n.d.). Retrieved June 28, 2013, from
http://www.leansigmainstitute.com/leansigma/in dex_leansigma.shtml[17] Mann, R., & Kehoe, D. (1995). Factors affecting the implementation and success of TQM. International Journal of
Quality & Reliability Management, 12(1), 11-23.[18] National Research Council (U.S.). Committee on Human Factors., & Nickerson R.S. (1995). Emerging needs and
opportunities for human factors research. Washington: National Academy Press.[19] Ohno, T. (1998). Toyota Production System: Beyond Large-Scale Production. New York: Productivity Press.[20] Onori, M., & Olivera J.B. (2010). Outlook report on the future of European assembly automation, Assembly
Automation, 30(1), 7-13.
VI. CONCLUSION
50
Author Guidelines
Editorial objectives
The MMU Journal of Management and Technology is a blind reviewed bi-annual journal dedicated to provide a platform to
share and exchange knowledge of the latest research and practical information on all aspects of managing knowledge in
organizations. The journal publishes original research papers/articles and case studies by academicians, business and
government contributors on strategies, tools, techniques and technologies for Management and Technology practices.
MMU Journal of Management and Technology thrive to focus on the advances and application of the theoretical concepts
in the real world situations.
Reviewing process
The MMU Journal of Management and Technology is a blind reviewed bi-annual journal. On the recommendation of
reviewers, a paper will be:
• Accepted, and the rights to edit it to suit the needs of journal lies with the editorial committee.
• Revised, implies that it has potential for publication, but needs some further work
• Rejected, implies that it is unsuitable for publication
Permissions
Prior to article submission, authors should seek clear permission to use any content that has not been created by them.
Failure to do so may lead to lengthy delays in publication. The rights MMU Journal of Management and Technology
require are:
1. Non-exclusive rights to reproduce the material in the article submitted.
2. Print and electronic rights.
Manuscript requirements
1. The desired length of the paper is between 5000 and 8000 words.
2. A title should not exceed twenty words.
3. A brief autobiographical of the author (s) should be supplied on separate sheets (and not to be shown
anywhere else on the manuscript) including:
o Full name
o Designation and Institution
o E-mail address
o Full international contact details
4. Authors must supply a structured abstract (maximum 300 words) set out under 4-7 sub-headings
1. Purpose (mandatory)
2. Design/methodology/approach (mandatory)
3. Findings (mandatory)
4. Research limitations/implications (if applicable)
5. Practical implications (if applicable)
6. Social implications (if applicable)
5. Categorization of the manuscript as one of the following categories should be indicated by the author(s)
• Research Papers
• Articles
• Case Studies
6. Headings must be short, with a clear indication of the distinction between the hierarchies of headings. The
preferred format is for headings to be presented in bold format, with consecutive numbering.
7. Each Figure and table should be supplied within the article itself. All Figures (charts, diagrams and line
drawings), plates (photographic images) and tables should be of clear quality, in black and white
and numbered consecutively with Arabic numerals.
51

8. References to other publications must be in the following style and carefully checked for completeness,
accuracy and consistency.
o For books: Surname, Initials (year), Title of Book, Publisher, Place of publication.
e.g. Ghuman, k. and Aswathappa (2010), Management: Concept & Cases”, Mc-Graw Hill
Education, New Delhi, India
o For book chapters: Surname, Initials (year), "Chapter title", Editor's Surname, Initials (Ed.), Title of
Book, Publisher, Place of publication, pages.
e.g. Singh, M. (2002), "Corporate Governance in Banks", in Vashisht, Tandon and Arya, (Ed.),
Corporate Governance, Deep and Deep Publications Pvt. Ltd, New Delhi, India, pp. 15-20.
o For journals: Surname, Initials (year), "Title of article", Journal Name, volume, number, pages.
e.g. Chaudhary, S. (2010), " Analysis of Price Discovery Tools Operative in Indian Capital Market”,
Optimization, Vol. 2, No. 1, pp. 72-80.
o For published conference proceedings: Surname, Initials (year of publication), "Title of paper", in
Surname, Initials (Ed.), Title of published proceeding which may include place and date(s) held,
Publisher, Place of publication, Page numbers.
eg Jakkilinki, R., Georgievski, M. and Sharda, N. (2007), "Connecting destinations with an
ontology-based e-tourism planner", in Information and communication technologies in tourism
2007 proceedings of the international conference in Ljubljana, Slovenia, 2007, Springer-Verlag,
Vienna, pp. 12-32.
o For unpublished conference proceedings: Surname, Initials (year), "Title of paper", paper
presented at Name of Conference, date of conference, place of conference, available at: URL if
freely available on the internet (accessed date).
eg Aumueller, D. (2005), "Semantic authoring and retrieval within a wiki", paper presented at the
European Semantic Web Conference (ESWC), 29 May-1 June, Heraklion, Crete, available at:
http://dbs.uni-leipzig.de/file/aumueller05wiksar.pdf (accessed 20 February 2007).
o For working papers: Surname, Initials (year), "Title of article", working paper [number if available],
Institution or organization, Place of organization, date.
e.g. Moizer, P. (2003), "How published academic research can inform policy decisions: the case of
mandatory rotation of audit appointments", working paper, Leeds University Business School,
University of Leeds, Leeds, 28 March.
o For encyclopedia entries (with no author or editor): Title of Encyclopedia (year) "Title of entry",
volume, edition, Title of Encyclopedia, Publisher, Place of publication, pages.
e.g. Encyclopaedia Britannica (1926) "Psychology of culture contact", Vol. 1, 13th ed.,
Encyclopaedia Britannica, London and New York, NY, pp. 765-71.
(For authored entries please refer to book chapter guidelines above.)
o For newspaper articles (authored): Surname, Initials (year), "Article title", Newspaper, date, pages.
e.g. Smith, A. (2008), "Money for old rope", Daily News, 21 January, pp. 1, 3-4.
o For newspaper articles (non-authored): Newspaper (year), "Article title", date, pages.
e.g. Daily News (2008), "Small change", 2 February, p. 7.
o For electronic sources: if available online the full URL should be supplied at the end of the
reference, as well as a date that the resource was accessed.
e.g. Castle, B. (2005), "Introduction to web services for remote portlets", available at: http://www-
128.ibm.com/developerworks/library/ws-wsrp/ (accessed 12 November 2007).
Standalone URLs, i.e. without an author or date, should be included either within parentheses
within the main text, or preferably set as a note (roman numeral within square brackets within text
followed by the full URL address at the end of the paper).
52

Submissions Process
MMU Journal of Management & TechnologyMaharishi Markandeshwar University
Author (s) is required to submit electronic version via e-mail at [email protected]
The Editor
Sadopur, AmbalaHaryana (India) 134003E-mail : [email protected]: 8059930008/9
53

SUBSCRIPTION FORM
I wish to subscribe / renew my subscription to MMU Journal of Management & Technology for
_______ year. A bank draft / cheque bearing no. ___________________ dated ____________
for Rs / US$ __________________ drawn in favour of M. M. University payable at Ambala
towards subscription for ________________ year is enclosed.
Name: ______________________________________________________________________
Organization/Institute: __________________________________________________________
Address: _____________________________________________________________________
_____________________________________________________________________________
_____________________________________________
City: ______________________________________ Pin: ________________________
Country: ___________________________________ Phone: _____________________
Fax: ______________________________________ Mobile: _____________________
E-mail: ________________________________________________________________
Date: _________________ ________________
Signature
The Editor
MMU Journal Of Management & Technology
Maharishi Markandeshwar University
Sadopur, Ambala
Haryana (India) 134003
E-mail : [email protected]
54

MAHARISHI MARKANDESHWAR UNIVERSITY, SADOPUR, AMBALA, INDIA
Maharishi Markandeshwar University, Sadopur – Ambala has been established as a self financed
University, under the aegis of the reputed MM University Trust in October 2010. M. M. University,
Sadopur- Ambala is ideally located on an area of 44 acres on Delhi-Ambala-Chandigarh National highway
in the suburb of Ambala towards Chandigarh. Established under the provision of the Haryana Private
Universities Act, 2006, and having been legislated under Haryana Govt. Act No. 29 of 2010, Maharishi
Markandeshwar University, Sadopur-Ambala has been operationalised with B.Tech, B.Arch, B. Com,
BBA, M.tech, MBA, M.Sc. and Ph.D. Programmes. M. M. University, Sadopur – Ambala has also been
recognized by the UGC for awarding Degrees under the section 22 of the UGC Act, 1956.
55

MAHARISHI MARKANDESHWAR UNIVERSITY, SADOPUR, AMBALA, INDIA
At a Glance
56

(NAAC Accredited University with Grade 'B')
Sadopur, AmbalaHaryana (India) 134003
E-mail : [email protected]: 8059930008/9
“An expert is one who knows more and more about less and less until he knows absolutely
everything about nothing.” :- Nicholas Murray Butler