Embed Size (px)
Citation preview

HEALTH CARE AND HUMAN SERVICES POLICY, RESEARCH, AND CONSULTING - WITH REAL-WORLD PERSPECTIVE.
MO HealthNet Comprehensive Review Final Report
February 28, 2010Final Version – 4/30/2010
www.lewin.com502719
1
Table of Contents
Project Overview
Slide 2
Program Organization & Management
Slides 3-47
Care Management Slides 48-79
Program Structure & Financing
Slides 80-90
1115 Waiver Reform Opportunity
Slides 91-94
Next Steps
Slides 95-96
Appendix A: State Reorganization Examples
Slides 98-102
Appendix B: Dashboard Examples
Slides 103-110
Appendix C: State Care Management Programs
Slides 111-119
Appendix D: Capitated Programs for Duals
Slides 120-125
Appendix E: 1115 Waiver Examples
Slides 126-136
www.lewin.com502719
2
Project Overview
MO HealthNet retained The Lewin Group to conduct a comprehensive review of Missouri’s Medicaid program
This review included numerous interviews with Missouri officials, documentation review, and intensive data analysis
Specific areas of analysis included the pharmacy program, clinical services, long-term care, high volume providers, high cost participants, and non-emergency medical transport
Lewin also provided a prioritized list of short-term cost containment opportunities that are being used as part of the SFY11 budget development process
This report includes our “big-picture”
assessment of the Missouri Medicaid program and potential opportunities for organizational improvement
www.lewin.com502719
3
Program Organization & Management

www.lewin.com502719
4
MO HealthNet Operations: Current State Observations
Siloed
structure and divided accountability
Administration is organized by type of service divided across agencies
Low staffing levels in some areas limit effectiveness
Lack of sufficient staff dedicated to providing needed program-wide policy perspectives
Numerous vacancies, including several key management positions
Contractor reliance can lead to redundancy across contractors and limited (or highly concentrated) institutional knowledge
Repeated learning curve for new contractors
Sharing of information among contractors difficult
Limited current use of performance measurement and reporting capabilities
Many lengthy reports are generated routinely, but their use appears to be limited
www.lewin.com502719
5
Finding #1: Siloed structure inhibits coordination
MO HealthNet’s senior leadership works collaboratively on Medicaid policy development; however, with multiple cabinet-level agencies and divisions involved in administration, silos persist
Agencies with Medicaid administration responsibilities include the Departments of Social Services (DSS), Health and Senior Services
(DHSS), Mental Health (DMH), and Education
DSS has ultimate responsibility for Medicaid, but lacks authority over several components of the program including long-term care services administered by DHSS and mental health services administered by DMH
Further, while the MO HealthNet Division of DSS is responsible for Medicaid operations, eligibility services are administered by the Family Support Division
Division of authority can lead to knowledge gaps, accountability
gaps, and low levels of coordination

www.lewin.com502719
6
A Coordinating Authority Could Improve Operational Efficiency and Coordination
Overview of revised structure:
Overall responsibility for Medicaid oversight would ideally be a
cabinet-level position with authority over all aspects of the program
A unified Medicaid department is an option, but most states have
opted to coordinate Medicaid functions across different agencies
DSS may want to consider integrating eligibility policy and oversight functions with MO HealthNet
Ongoing systems integration efforts are critical to enhancing program coordination
Several examples of other states’
efforts are included in Appendix A
Rationale for change:
Currently, budget and policy decisions are coordinated by the State Budget Office, as that is the first place all Medicaid information comes together
Each agency with Medicaid oversight and operational responsibilities has its own circle of stakeholders
Effective management of the Medicaid program requires the balancing of program and financial priorities for a diverse and vulnerable set of populations
A coordinating authority would have the broader perspective and ability to balance interests necessary to achieve most efficacious use of limited State resources
www.lewin.com502719
7
A Coordinating Authority Must Be Given the Resources and Authority to Succeed
Such an approach will require legislation, appropriations and a process by which the structure and specific authority designations are defined and implemented
Responsibility and authority of existing agencies will need to be realigned
This process will require a dedicated project team to work with State leaders to refine objectives, clarify mission, and establish work plan for accomplishing realignment
Sufficient funding must be appropriated for staff levels that allow for work to be driven by the coordinating body, rather than relying on the individual departments
If undertaken, must be willing to commit significant time and energy to communicating with staff and resolving countless (often minor) operational challenges that will arise
Insufficient authority to compel coordination relegates these bodies to “facilitators” with little ability to effect real change
www.lewin.com502719
8
Regardless of Decision on Coordinating Authority, Responsibility for Institutional LTC and HCBS for the Aged Should be Realigned within the Same Agency
Currently, MHN budgets for and oversees nursing facility services and DHSS budgets for and oversees HCBS for older adults and people with disabilities
LTC and HCBS services for older adults are part of the same care
continuum and should be planned for and budgeted in a unified manner
Current arrangement fragments accountability and impedes planning and coordination
If realignment is not done, the level of interagency collaboration and coordination needs to increase significantly beyond where it is today
At a minimum, there needs to be cross-agency budget planning/collaboration, policy development, and spending authority
Development of a Medicaid coordinating authority would also have
to consider alignment of Medicaid-funded services currently administered by DMH
www.lewin.com502719
9
Finding #2: Low Staffing Levels in Some Areas Limit Effectiveness
Two senior management positions under MO HealthNet Operations are vacant (Directors of Program Management/Quality and Information Services)
These vacancies result in senior leaders devoting significant time to day-to-day operations rather than policy development and other “big picture”
goals
There is a lack of sufficient staff dedicated to providing needed program-wide policy perspectives
Staff responsible for project implementation do not have sufficient time to truly manage, measure results of, and refine project activities
Limited number of Program Integrity staff constrains depth and breadth of activities; for example:
Staff struggle to keep up with potential cases and do not have time to take advantage of data-mining technology through Thomson Medstat
Several program “dashboards”
have been created, but are not run repeatedly because staff do not have capacity to act on data
Decline in staffing at DHSS to manage community-based LTC programs has contributed to insufficient oversight
The changes we have recommended to the intake and assessment system for LTC are designed to resolve problems that appear to be a result of reductions in DHSS staffing levels
www.lewin.com502719
10
Designate Policy and Project Management Personnel
Consider adding Policy and Program Management Unit to the Medicaid Director’s office to guide policy decisions, oversee project implementation, and evaluate program effectiveness
Policy analysis and development efforts are currently spread over Operations, Clinical Services, and Finance
While each of these areas needs to retain these capabilities and
involvement, MO HealthNet will benefit from an increase in Division-wide policy perspective
With multiple program changes anticipated in a short time frame,
a focus on project management is strongly recommended
Staff would consist of a Director, 1-2 policy analysts and 1-2 project managers
High-level project management training is commercially available for existing staff
These functions could be outsourced during a transition period
www.lewin.com502719
11
Hire a Full-Time Medical Director for the MO HealthNet Program
Federal regulations require each Medicaid program to have a Medical Director
In Missouri, the Medicaid Director is also a physician and also functions as the Medical Director
Full-time demands of Medicaid Director position limit ability to pursue full range of needed Medical Director responsibilities
A Medical Director should have the ability to relate directly to
the provider community, coupled with strong policy capability and vision
Increasing national emphasis on quality of care, electronic health records, health information exchanges, and coordinated care strategies increases the need for a full-time Medical Director
A full-time Medical Director would be able to lead comprehensive quality initiatives as well as work with Clinical Services leadership to maximize effectiveness of tools such as CyberAccess and SmartPA
Without ongoing clinical responsibilities, the Medicaid Director
would be able to focus exclusively on strategic planning and day-to-
day program administration

www.lewin.com502719
12
Finding #3: MO HealthNet’s Reliance on Contractors Necessitates Stronger Coordination and Oversight
MO HealthNet relies heavily on various contractors for such functions as IT development and operations, call-center operations, program evaluation, service delivery, and consulting services
Contractors lend a depth and breadth of specialized expertise
Contractors can also fill staffing gaps and address short-term needs without long-term budget commitment
With such a range of vendors and contracted services, oversight, coordination, and performance evaluation are critical to maximizing ROI
MO HealthNet’s current oversight of contracted activities appears limited and may be the result of staffing levels, skill sets or historical lack of institutional emphasis
www.lewin.com502719
13
Recommendations for Contractor Utilization & Oversight
Each contractor should be overseen by a contract manager, responsible for ensuring adherence to the contract terms
Contractor performance should be measured using performance metrics that are incorporated into each contract
Consider opportunities to tie contractor profitability to MO HealthNet savings, where appropriate, and other performance metrics
Develop work plans for implementation and monitoring purposes and to establish key performance dates and activities against which to measure performance
Require periodic reporting and performance reviews
In the case of consultants, multiple points of view can be valuable, but care should be taken to avoid duplication of efforts
Areas of consensus should be emphasized for implementation
Some contractors are direct competitors, enhancing the silo effect
Contractor coordination is significantly hindered by competitive
relationships and must be facilitated by State staff
www.lewin.com502719
14
Finding #4: In-house Reporting Capacity is Limited
User-defined reports can be produced using Medstat
tools (Decision Analyst / Net Effect)
However, limited number of staff have ability to use these tools
(estimate about a dozen users with varying levels of ability)
MMIS staff are often relied upon to produce ad hoc reports
Requests to MMIS staff are prioritized along with other tasks
Time spent generating reports detracts from MMIS development and operations
Ad hoc requests tend to be for specialized purposes rather than general distribution for ongoing program management
Contractors produce performance reports, but these are very specific to certain program areas and not widely distributed

www.lewin.com502719
15
Focus on In-house Ability to Produce Ad Hoc Reports
In 2002, Idaho Medicaid reported savings of nearly $200K, simply
by developing the ability to access reports internally without relying on a contractor1
More than 500 reports are available through the Idaho Data Engine Acquisition, with 160 available instantly
Medstat
(now Thomson Reuters) products are designed to facilitate user-defined reporting and should be leveraged to increase staff ability to generate reports
Staff training is required to ensure that sufficient staff across the Division can generate reports
Training can be provided by Thomson Reuters, or by proficient staff
Regular user group meetings can help disseminate expertise
If new policy analysts are added, skills and/or willingness to be trained in query development and data analysis should be a top priority
Sources:1 http://www.legislature.idaho.gov/ope/publications/reports/r0405f.pdf

www.lewin.com502719
16
Finding #5: Limited Current Use of Performance Measures
Various reports are produced, but few are routinely used by senior management, and those that are used focus on program expenditures
A DSS Monthly Management Report includes 20 separate tables for MO HealthNet spanning more than 100 pages
The most commonly used include Figure 5 (60-mo payment trend) and Table 23 (recipient and payment amounts by eligibility category)
Table 23, including monthly expenditures by provider type and eligibility category, is what “everyone is judged by”
Management Reports such as Table 23 have data issues that limit their usefulness
Spending totals only include amounts paid through claims and do not include supplemental payments such as those made to hospitals
Units of service are not reliably counted and, therefore, several columns of data are disregarded
Program areas produce various performance reports with varying levels of detail and regularity (e.g. pharmacy, program integrity, call center)
A March 2009 memo from Health Management Associates (HMA) also indicated that “Individual staff and organizational unit performance standards appear to be nonexistent in the Division”
www.lewin.com502719
17
Implement Series of Metrics & Management Dashboards
Ultimate goal should be instant electronic access to current metrics
Managers and staff at different levels would have specific access permissions
Automated electronic dashboards would allow users to “drill-down”
to underlying data
Data would be compiled from a variety of sources including the data warehouse, eligibility system, and financial management system
Interim goal is the establishment of a concise set of metrics for senior leaders
We recommend that key metrics be compiled monthly and displayed graphically in an executive dashboard
Initial set of recommended metrics (included in the following slides) should be reviewed by MO HealthNet leadership and refined as needed
Format and comprehensiveness of dashboard metrics should be reviewed annually
Additional program-specific metrics should be used by program managers responsible for day-to-day operations
There are a limited number of publically available Medicaid metrics
Several examples from other states are included in Appendix B
www.lewin.com502719
18
Implementing Metric Reporting
The level of effort required to report metrics will depend on the frequency of reporting as well as the number of metrics; however, most of the data required in our examples already exists
We recommend that the executive dashboard report be produced monthly with the most current data available
MO HealthNet should also work with Thomson Reuters and Infocrossing
to automate production of charts based on claims and eligibility
data contained in the data warehouse
Establish a metric development committee including program and MMIS staff to help identify appropriate data elements
This recommendation is consistent with the March 2009 HMA memo that suggested full utilization of the Thomson Reuters data warehouse
and capabilities
Identify metrics that apply to senior leaders such as the Secretary and Medicaid Director and those that apply to program managers
www.lewin.com502719
19
Metric Examples for MO HealthNet
The following slides contain recommended metrics by program area
Generally, the data used to compile these charts already exists in program reports
Upon review, MO HealthNet and DSS may decide that some of these examples do not fit current priorities or that others are preferred
Metrics ultimately selected for dashboard inclusion should align
with Agency and Division objectives which can change
In some cases, suggested variables are not currently calculated (e.g. PMPM) and would require some additional in-house or contractor resources to implement
Potentially challenging is the inclusion of payments such as Direct Medicaid and GME add-ons that are not associated with claims; however, such payments represent a significant amount of hospital expenditures
and should be accounted for in a true “dashboard”
metricNote: Dashboard mock-ups do not contain actual data and are intended as
illustrative examples only
www.lewin.com502719
20
We Propose Performance Metrics in the Following Seven Categories
Expenditures
Enrollment
Program Integrity
Long-Term Care
Care Management
Contractor Performance
Special Projects
www.lewin.com502719
21
Expenditure Metrics
Expenditure dashboard charts are intended to provide a snapshot of expenditures versus projections
Expenditures are broken out by both eligibility category and type of service (note: we only present a couple of examples by service type, but at a minimum, the top five programs should be included)
Periodic supplemental payments should be included in expenditures and projections displayed (i.e. all
payments to providers, regardless of whether they are paid via claims or through lump sums)
Rolling 12-month trend information is also included
Top service categories are included; however, budget staff should be monitoring smaller categories for fluctuations
Budget staff compile this data monthly in a series of spreadsheets
As we discuss further in the Finance and Budget section, we recommend that this manual process be automated

www.lewin.com502719
22
Expenditures – Total Program (excluding administrative costs)
Illustrative data only
Total Expenditures: Actual vs. Projected January 2009 - January 2010
$552
$549
$559$559
$557$557$557
$556$556
$555
$553
$552
$549$550
$559$558
$557
$556$556
$555$555
$554
$552
$551
$550
$548
$542
$544
$546
$548
$550
$552
$554
$556
$558
$560
Jan. 2009 Feb. 2009 March 2009 April 2009 May 2009 June 2009 July 2009 Aug. 2009 Sept. 2009 Oct. 2009 Nov. 2009 Dec. 2009 Jan. 2010
Expe
nditu
res
(Mill
ions
)
Total (Actual) Total (Projected)
www.lewin.com502719
23
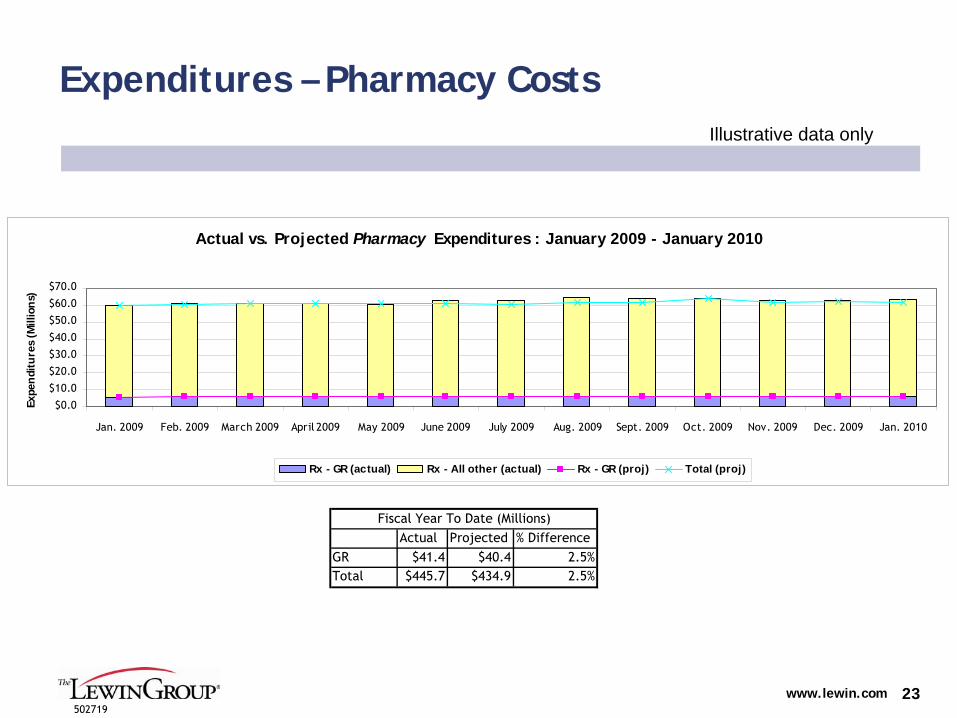
Expenditures – Pharmacy CostsIllustrative data only
Actual vs. Projected Pharmacy Expenditures : January 2009 - January 2010
$0.0
$10.0
$20.0
$30.0
$40.0
$50.0
$60.0
$70.0
Jan. 2009 Feb. 2009 March 2009 April 2009 May 2009 June 2009 July 2009 Aug. 2009 Sept. 2009 Oct. 2009 Nov. 2009 Dec. 2009 Jan. 2010
Expe
ndi
ture
s (M
illio
ns)
Rx - GR (actual) Rx - All other (actual) Rx - GR (proj) Total (proj)
Actual Projected % DifferenceGR $41.4 $40.4 2.5%Total $445.7 $434.9 2.5%
Fiscal Year To Date (Millions)
www.lewin.com502719
24
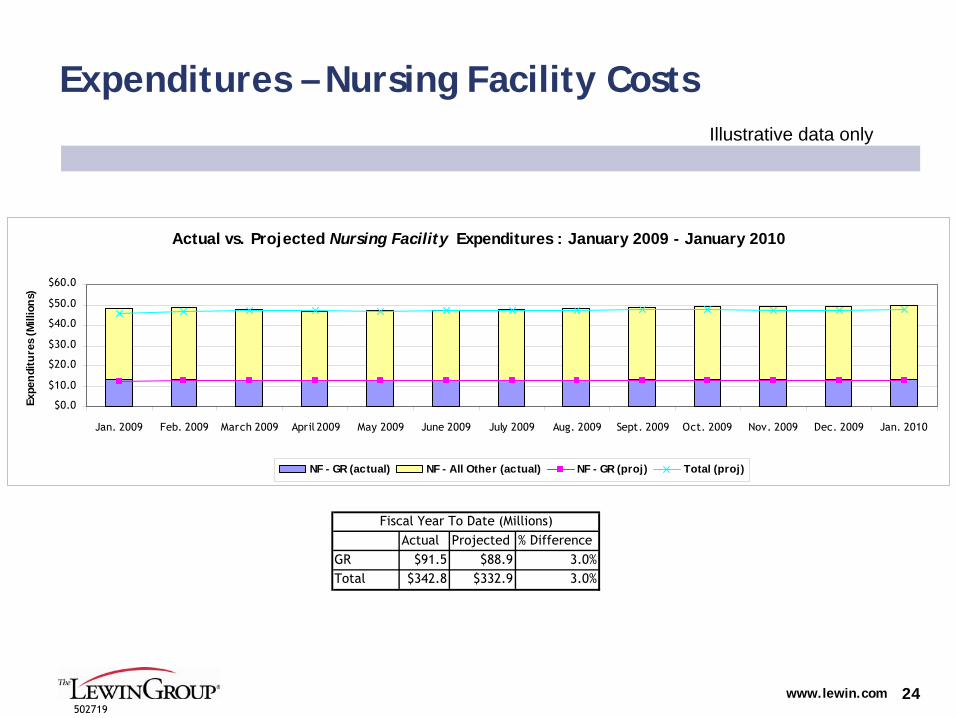
Expenditures – Nursing Facility CostsIllustrative data only
Actual Projected % DifferenceGR $91.5 $88.9 3.0%Total $342.8 $332.9 3.0%
Fiscal Year To Date (Millions)
Actual vs. Projected Nursing Facility Expenditures : January 2009 - January 2010
$0.0
$10.0
$20.0
$30.0
$40.0
$50.0
$60.0
Jan. 2009 Feb. 2009 March 2009 April 2009 May 2009 June 2009 July 2009 Aug. 2009 Sept. 2009 Oct. 2009 Nov. 2009 Dec. 2009 Jan. 2010
Expe
ndi
ture
s (M
illio
ns)
NF - GR (actual) NF - All Other (actual) NF - GR (proj) Total (proj)
www.lewin.com502719
25
Expenditures – Per Member Per Month Spending
Total spending per member per month (PMPM)
High level aggregate spending metric that allows senior leaders to monitor overall spending while accounting for caseload growth
PMPM view allows tracking by population so that shift in services can be reflected in one metric
Significant changes would require drill-down to program area to identify cause
Metric would divide total incurred
costs by same month’s membership
Due to claims lag, most current PMPM could be presented for fourth month prior and compared to fifth month prior and the same month from the previous year
Completion factors must be applied to account for claims lag

www.lewin.com502719
26
Expenditures – PMPM by RegionIllustrative data only
Total PMPM Cost by RegionFebruary 2010, Previous Month, and Current Month/Prior Yr. Comparison
$275
$235
$285
$235
$295$300
$285
$245
$280
$255
$305
$290$285
$250
$285
$250
$300$290
$0
$50
$100
$150
$200
$250
$300
$350
Northwest Northeast Southeast Southwest Kansas city St. Louis
Tota
l PM
PM C
ost
Current Mo./Prior Yr Previous Mo. Feb. 2010
www.lewin.com502719
27
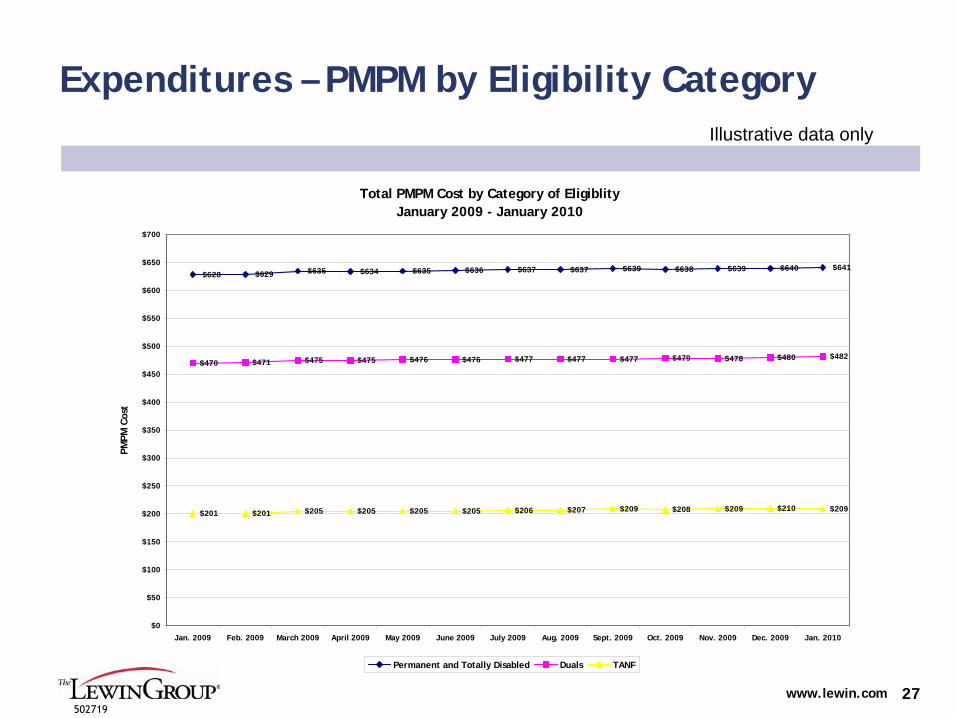
Expenditures – PMPM by Eligibility CategoryIllustrative data only
Total PMPM Cost by Category of Eligiblity January 2009 - January 2010
$628 $629 $635 $634 $635 $636 $637 $637 $639 $638 $639 $640 $641
$470 $471 $475 $475 $476 $476 $477 $477 $477 $479 $478 $480 $482
$201 $201 $205 $205 $205 $205 $206 $207 $209 $208 $209 $210 $209
$0
$50
$100
$150
$200
$250
$300
$350
$400
$450
$500
$550
$600
$650
$700
Jan. 2009 Feb. 2009 March 2009 April 2009 May 2009 June 2009 July 2009 Aug. 2009 Sept. 2009 Oct. 2009 Nov. 2009 Dec. 2009 Jan. 2010
PMPM
Cos
t
Permanent and Totally Disabled Duals TANF
www.lewin.com502719
28
Enrollment Metrics
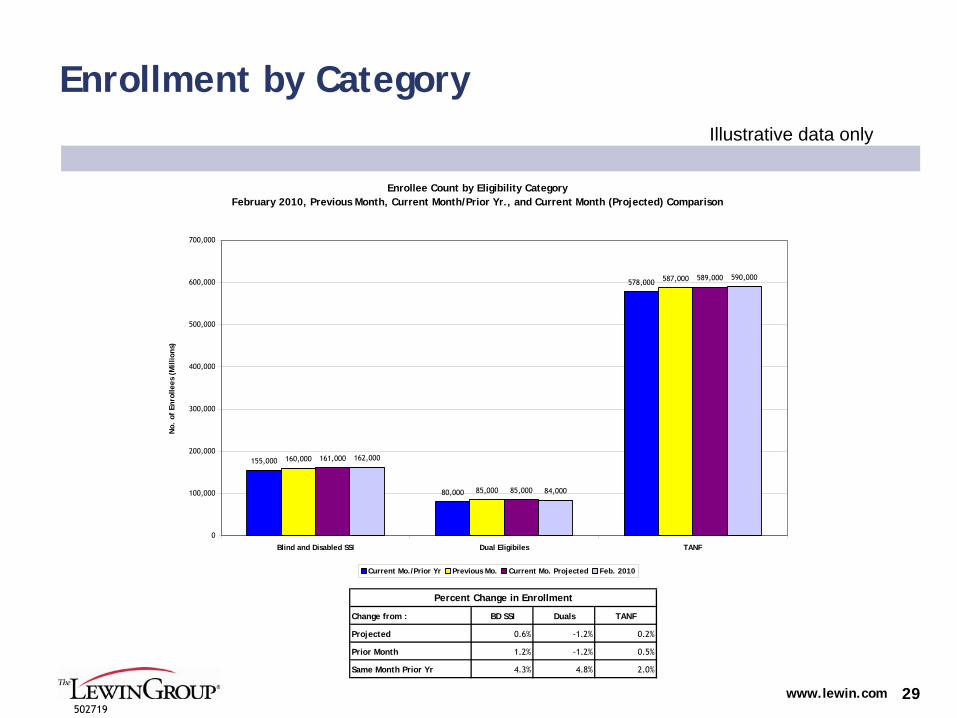
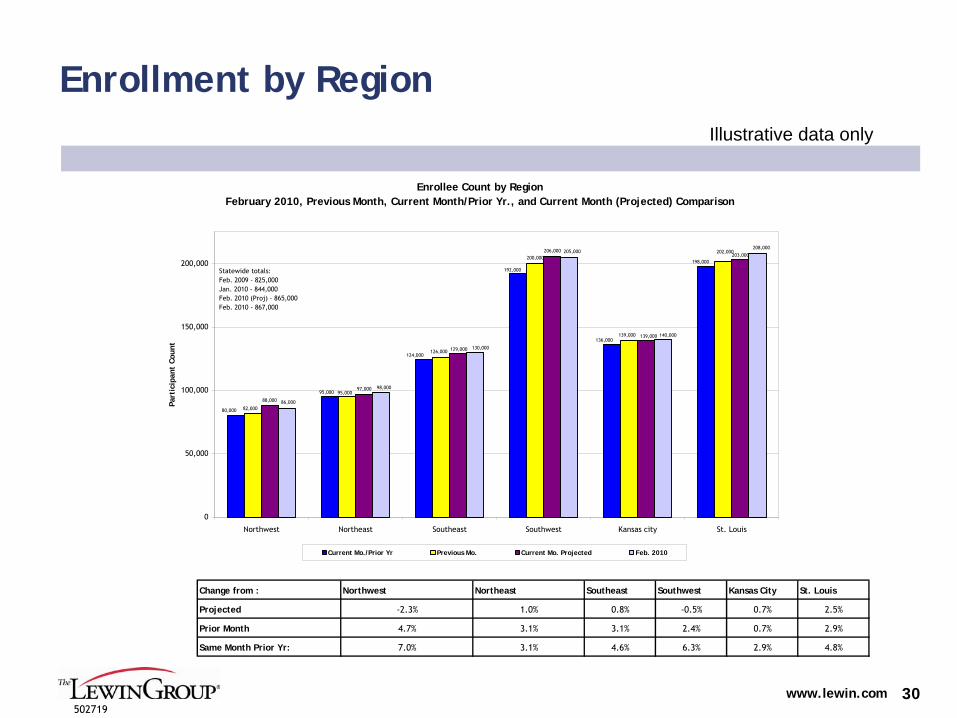
A key driver of Medicaid program costs, enrollment, is presented by region for the current month, previous month, and same month from the previous year
A separate chart is provided for eligibility categories
Existing eligibility reports include many more eligibility categories
These have been condensed into just three categories (TANF, Persons with Disabilities (non-dual), and Dual Eligible Participants)
Data table shows percent change in enrollment
All data are currently maintained by the Family Support Division
and should be readily available for summarizing
www.lewin.com502719
29
Enrollment by CategoryIllustrative data only
Enrollee Count by Eligibility CategoryFebruary 2010, Previous Month, Current Month/Prior Yr., and Current Month (Projected) Comparison
155,000
80,000
578,000
160,000
85,000
587,000
161,000
85,000
589,000
162,000
84,000
590,000
0
100,000
200,000
300,000
400,000
500,000
600,000
700,000
Blind and Disabled SSI Dual Eligibiles TANF
No.
of
Enro
llees
(M
illio
ns)
Current Mo./Prior Yr Previous Mo. Current Mo. Projected Feb. 2010
Change from : BD SSI Duals TANF
Projected 0.6% -1.2% 0.2%
Prior Month 1.2% -1.2% 0.5%
Same Month Prior Yr 4.3% 4.8% 2.0%
Percent Change in Enrollment
www.lewin.com502719
30
Enrollment by RegionIllustrative data only
Enrollee Count by RegionFebruary 2010, Previous Month, Current Month/Prior Yr., and Current Month (Projected) Comparison
80,000
95,000
124,000
136,000
198,000
192,000
202,000200,000
126,000
95,000
82,000
139,000
203,000
88,000
97,000
139,000
129,000
206,000
130,000
205,000
140,000
208,000
86,000
98,000
0
50,000
100,000
150,000
200,000
Northwest Northeast Southeast Southwest Kansas city St. Louis
Part
icip
ant
Coun
t
Current Mo./Prior Yr Previous Mo. Current Mo. Projected Feb. 2010
Statewide totals:Feb. 2009 - 825,000Jan. 2010 - 844,000Feb. 2010 (Proj) - 865,000Feb. 2010 - 867,000
Change from : Northwest Northeast Southeast Southwest Kansas City St. Louis
Projected -2.3% 1.0% 0.8% -0.5% 0.7% 2.5%
Prior Month 4.7% 3.1% 3.1% 2.4% 0.7% 2.9%
Same Month Prior Yr: 7.0% 3.1% 4.6% 6.3% 2.9% 4.8%
www.lewin.com502719
31
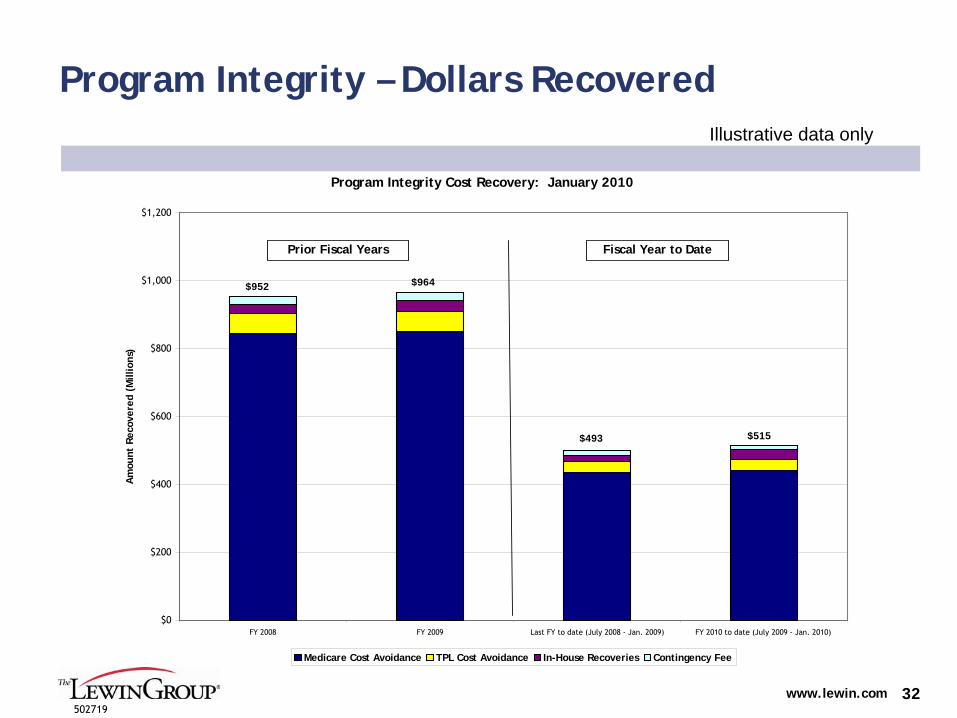
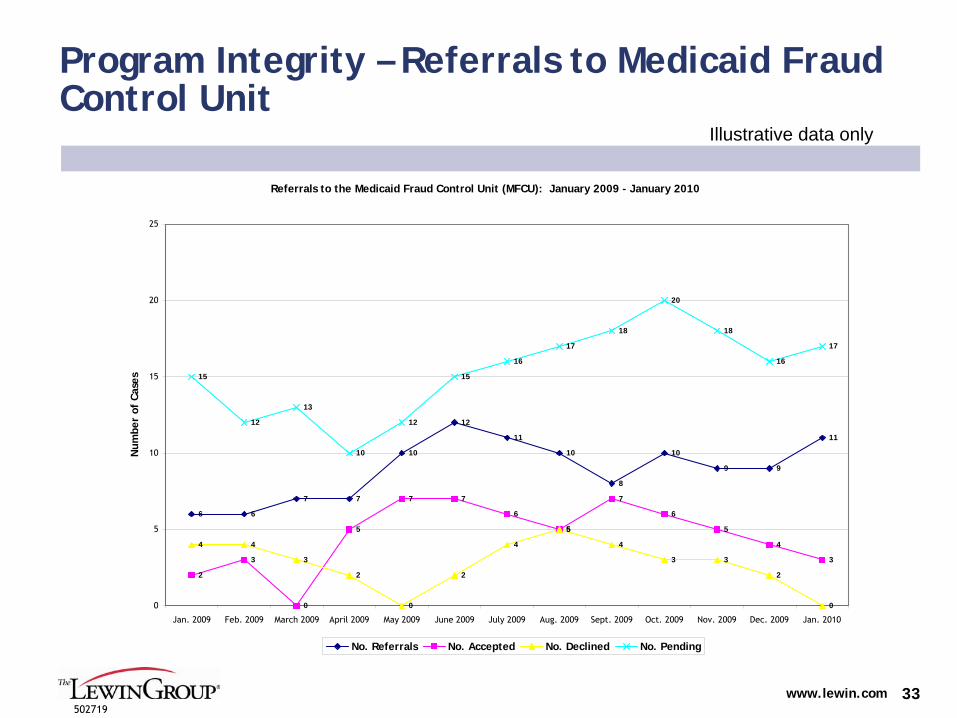
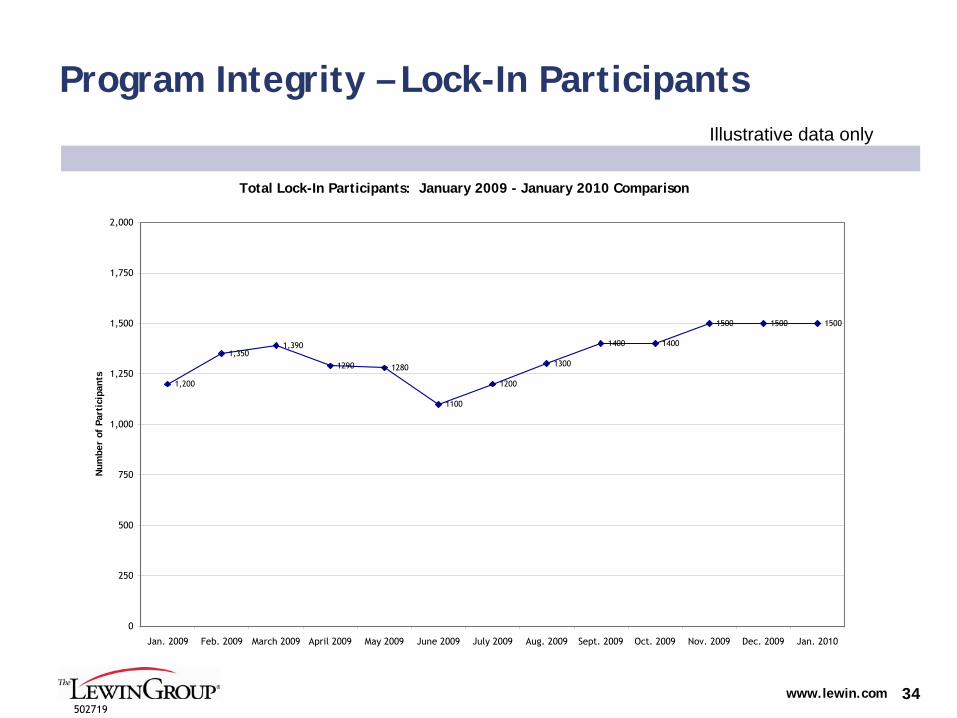
Program Integrity Metrics
The Program Integrity Unit tracks a variety of metrics in program-level reports
Some of the dashboard metric examples include an additional level of detail (e.g., MFCU cases are reported by status rather than as simple totals)
Metrics help demonstrate ROI for Program Integrity activities
www.lewin.com502719
32
Program Integrity – Dollars Recovered Illustrative data only
Program Integrity Cost Recovery: January 2010
$0
$200
$400
$600
$800
$1,000
$1,200
FY 2008 FY 2009 Last FY to date (July 2008 - Jan. 2009) FY 2010 to date (July 2009 - Jan. 2010)
Am
ount
Rec
over
ed (
Mill
ions
)
Medicare Cost Avoidance TPL Cost Avoidance In-House Recoveries Contingency Fee
$493 $515
$964$952
Fiscal Year to DatePrior Fiscal Years
www.lewin.com502719
33
Program Integrity – Referrals to Medicaid Fraud Control Unit
Illustrative data only
Referrals to the Medicaid Fraud Control Unit (MFCU): January 2009 - January 2010
6 6
7 7
10
12
11
10
8
10
9 9
11
2
3
0
5
7 7
6
5
7
6
5
4
3
4 4
3
2
0
2
4
5
4
3 3
2
0
15
12
13
10
12
15
16
17
18
20
18
16
17
0
5
10
15
20
25
Jan. 2009 Feb. 2009 March 2009 April 2009 May 2009 June 2009 July 2009 Aug. 2009 Sept. 2009 Oct. 2009 Nov. 2009 Dec. 2009 Jan. 2010
Num
ber
of C
ases
No. Referrals No. Accepted No. Declined No. Pending
www.lewin.com502719
34
Program Integrity – Lock-In ParticipantsIllustrative data only
Total Lock-In Participants: January 2009 - January 2010 Comparison
1,200
1,3501,390
1290 1280
1100
1200
1300
1400 1400
1500 1500 1500
0
250
500
750
1,000
1,250
1,500
1,750
2,000
Jan. 2009 Feb. 2009 March 2009 April 2009 May 2009 June 2009 July 2009 Aug. 2009 Sept. 2009 Oct. 2009 Nov. 2009 Dec. 2009 Jan. 2010
Num
ber
of P
arti
cipa
nts
www.lewin.com502719
35
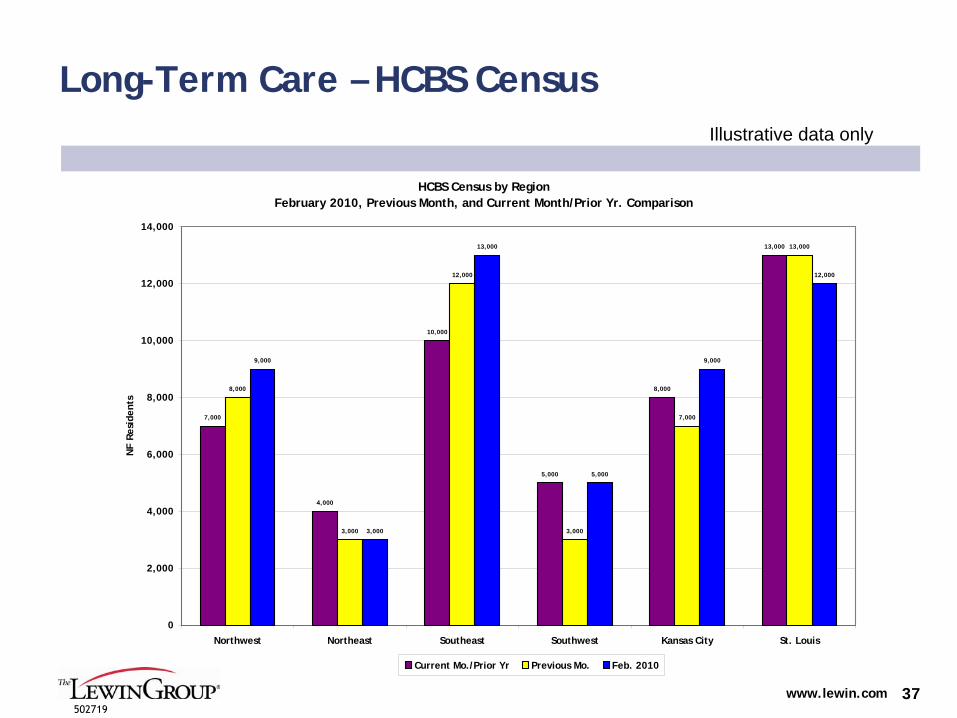
Long-Term Care Metrics
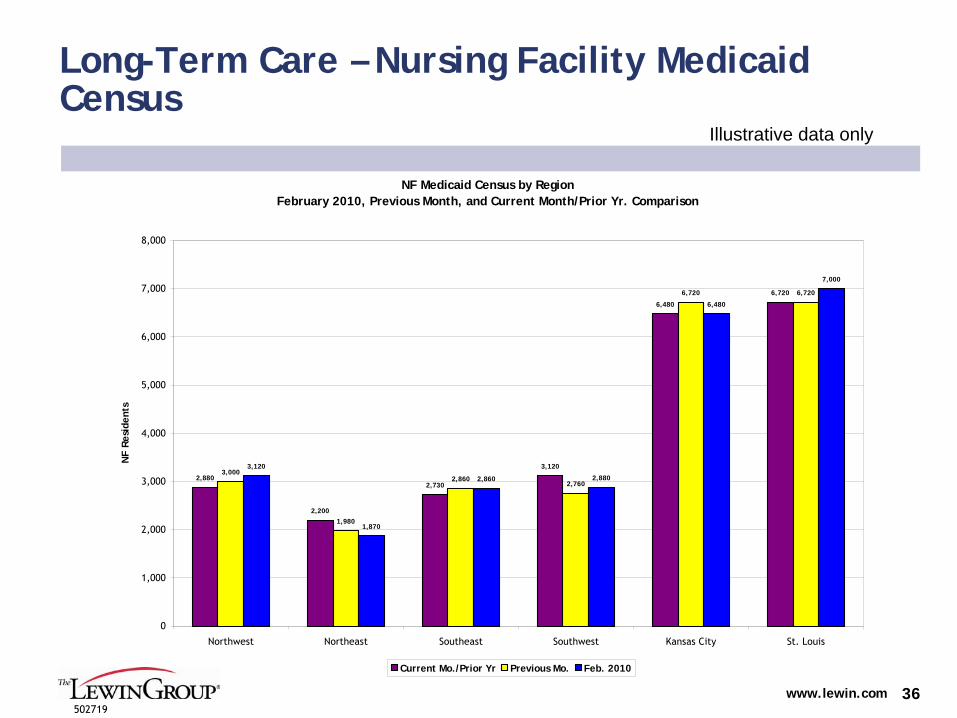
LTC Medicaid Census
Primary LTC metric that is clear and unambiguous
--
For example, want NF census to go down every single month
Recommend a county-level report or an alignment to the four DHSS regional offices or the 10 AAAs to help identify trends that require intervention at the local level
There are several potential data sources including eligibility data, MDS data, or possibly claims
DHSS is accustomed to reporting the number of Medicaid clients
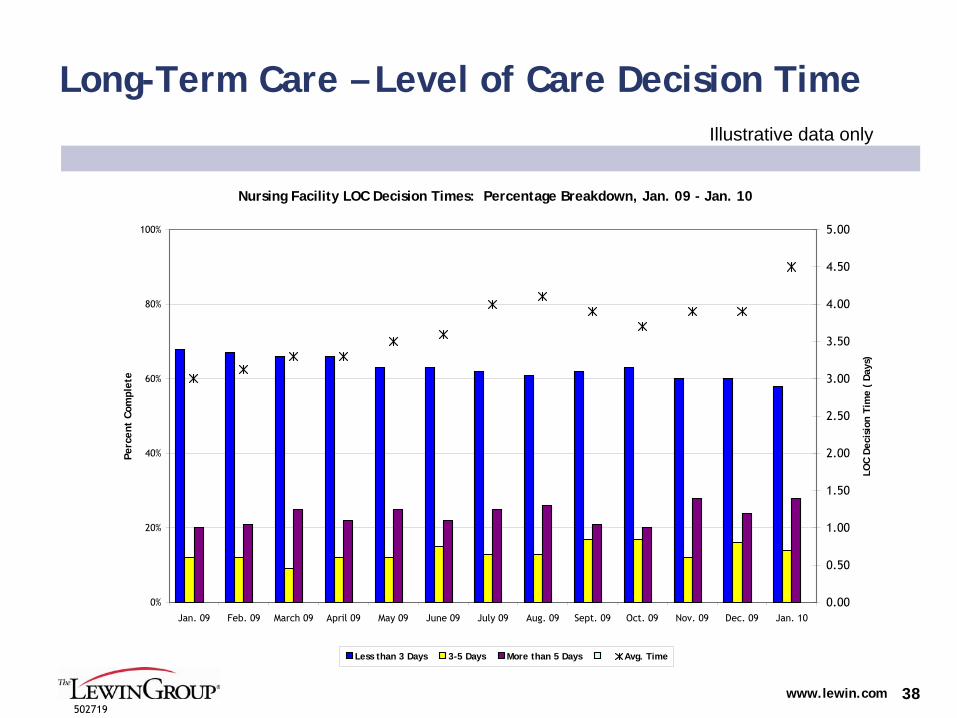
Days to Complete LOC
LOC assessments are currently conducted by a mix of DHSS staff and “community partners”
Timeliness of LOC determinations is a critical part of the Medicaid agency’s responsibilities for eligibility determinations
It is also a critical aspect of rapidly authorizing services for
people who may be ready for discharge from a hospital or struggling to stay in the community instead of an institution
When MHD reforms the intake and assessment process for LTC, tracking turnaround times for LOC assessments will help monitor successes or failures during the transition
DHSS should have this data available currently, and should require this metric as part of any future contract
www.lewin.com502719
36
Long-Term Care – Nursing Facility Medicaid Census
Illustrative data only
NF Medicaid Census by RegionFebruary 2010, Previous Month, and Current Month/Prior Yr. Comparison
2,880
2,200
2,730
3,120
6,480
6,720
3,000
1,980
2,8602,760
6,720 6,720
1,870
2,860 2,880
6,480
7,000
3,120
0
1,000
2,000
3,000
4,000
5,000
6,000
7,000
8,000
Northwest Northeast Southeast Southwest Kansas City St. Louis
NF
Resi
dent
s
Current Mo./Prior Yr Previous Mo. Feb. 2010
www.lewin.com502719
37
Long-Term Care – HCBS CensusIllustrative data only
HCBS Census by RegionFebruary 2010, Previous Month, and Current Month/Prior Yr. Comparison
7,000
4,000
10,000
5,000
8,000
13,000
8,000
3,000
12,000
3,000
7,000
13,000
9,000
3,000
13,000
5,000
9,000
12,000
0
2,000
4,000
6,000
8,000
10,000
12,000
14,000
Northwest Northeast Southeast Southwest Kansas City St. Louis
NF
Resi
dent
s
Current Mo./Prior Yr Previous Mo. Feb. 2010
www.lewin.com502719
38
Long-Term Care – Level of Care Decision TimeIllustrative data only
Nursing Facility LOC Decision Times: Percentage Breakdown, Jan. 09 - Jan. 10
0%
20%
40%
60%
80%
100%
Jan. 09 Feb. 09 March 09 April 09 May 09 June 09 July 09 Aug. 09 Sept. 09 Oct. 09 Nov. 09 Dec. 09 Jan. 10
Perc
ent
Com
plet
e
0.00
0.50
1.00
1.50
2.00
2.50
3.00
3.50
4.00
4.50
5.00
LOC
Dec
isio
n Ti
me
( D
ays)
Less than 3 Days 3-5 Days More than 5 Days Avg. Time
www.lewin.com502719
39
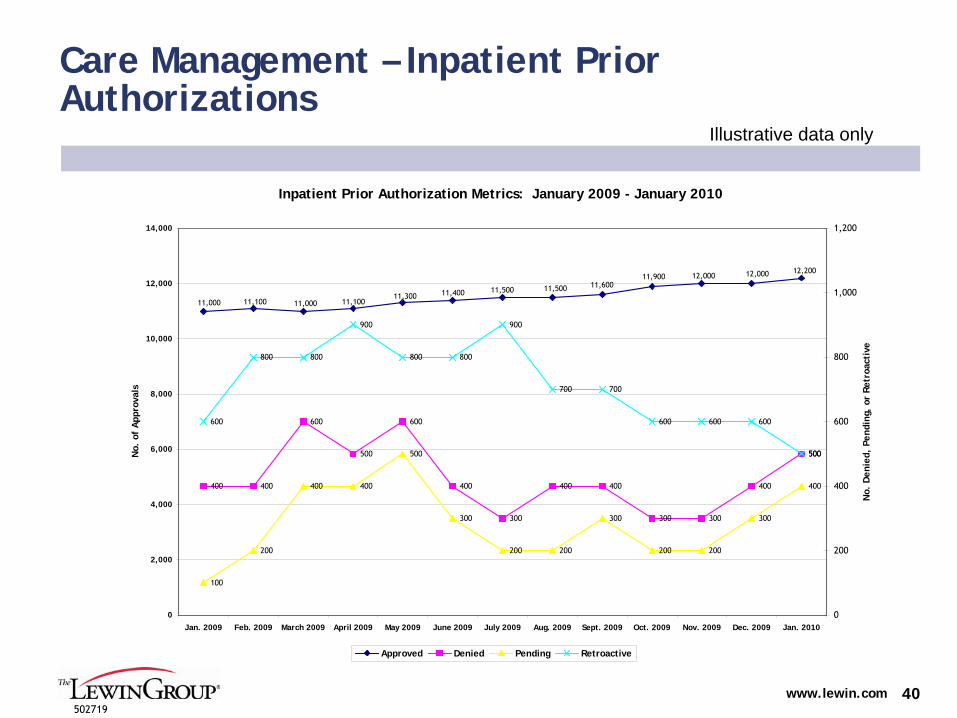
Care Management Metrics
Care management metrics can include both enrollment in care management programs as well as operational metrics such as prior authorizations
Pharmacy prior authorizations are currently reported in ACS’
monthly Drug Helpdesk Status Report
Inpatient prior authorization data should also be reported as part of the new ACS contract
Total transactions completed may also be included as one of the components of the contractor’s monthly performance score
MHD emphasis on care management makes these metrics especially important to monitor
www.lewin.com502719
40
Care Management – Inpatient Prior Authorizations
Illustrative data only
Inpatient Prior Authorization Metrics: January 2009 - January 2010
12,00011,90011,60011,50011,50011,40011,300
11,10011,00011,10011,000
12,000 12,200
400 400
600
500
600
400
300
400 400
300 300
400
500
100
200
400 400
500
300
200 200
300
200 200
300
400
600
800 800
900
800 800
900
700 700
600 600 600
500
0
2,000
4,000
6,000
8,000
10,000
12,000
14,000
Jan. 2009 Feb. 2009 March 2009 April 2009 May 2009 June 2009 July 2009 Aug. 2009 Sept. 2009 Oct. 2009 Nov. 2009 Dec. 2009 Jan. 2010
No.
of
App
rova
ls
0
200
400
600
800
1,000
1,200
No.
Den
ied,
Pen
ding
, or
Ret
roac
tive
Approved Denied Pending Retroactive

www.lewin.com502719
41
Care Management – Pharmacy Prior Authorizations
Illustrative data only
Note: If psychotropics are added as a class, we recommend adding separate approval/denial lines
Pharmacy Prior Authorization Metrics: January 2009 - January 2010
3,600 3,600 3,6003,700 3,700
3,800
4,0003,900
3,8003,900
3,8003,700
3,500
2,3002,400
2,5002,600
2,7002,800
2,600
2,4002,300
2,2002,300
2,200
3,000
0
500
1,000
1,500
2,000
2,500
3,000
3,500
4,000
4,500
Jan. 2009 Feb. 2009 March 2009 April 2009 May 2009 June 2009 July 2009 Aug. 2009 Sept. 2009 Oct. 2009 Nov. 2009 Dec. 2009 Jan. 2010
PA R
eque
sts
Approved Denied

www.lewin.com502719
42
Contractor Performance Metrics
Each contract should include several metrics that measure a contractor’s performance
For example, the APS Status Report includes several metrics, though it is not clear how the results relate to expectations
HMA’s
March 2009 memo also indicated that “interventions such as CCIP and the ASO should be managed by the Division against clear contractual quality standards”
Metrics should be weighted by importance to determine a monthly performance rating from 0-100
For example, the most critical measure of an MMIS vendor’s performance might be timely claims processing, which would be weighted higher than other metrics
Colors indicate performance relative to thresholds (e.g., green for ≥90 percent and red for <
60 percent)
Metric development and weighting will require significant effort, as they do not currently exist

www.lewin.com502719
43
Contractor Performance: January vs. February
77%
50%
90%
60% 60%
88%
100%
45%
94% 95%
42%46%
85%82%
0%
10%
20%
30%
40%
50%
60%
70%
80%
90%
100%
Contractor A Contractor B Contractor C Contractor D Contractor E Contractor F Contractor G
Perf
orm
ance
Lev
elContractor Performance
Illustrative data only
Upon gaining drill-down capability, user could view historical performance for each
contractor
>=90% Meeting of Metrics 60%-89% Meeting of Metrics < 60% Meeting of Metrics
Jan. Jan. Jan. Jan. Jan. Jan. Jan.Feb. Feb. Feb. Feb. Feb. Feb. Feb.
www.lewin.com502719
44
Special Project Metrics
In addition to routine operating metrics, we suggest including a
section to report on the status of special projects
For example, if MO HealthNet is implementing a new program, a chart could be added to show progress relative to a project plan
If specific project management personnel can be designated, they
would be responsible for collecting and reporting this information
Otherwise, program managers responsible for the project should be tracking progress against a project plan
Different types of special projects could be included such as program development activities or projects to complete a certain number of activities (processing claims, eliminating backlogs, obtaining reimbursement)
While all special projects should be monitored at the project manager/director level, we would recommend that no more than two-to-three high-profile projects be identified for the Director’s Dashboard. For example:
MMIS redesign
Nursing Facility Part A Repricing
Health Reform Eligibility Expansions
www.lewin.com502719
45
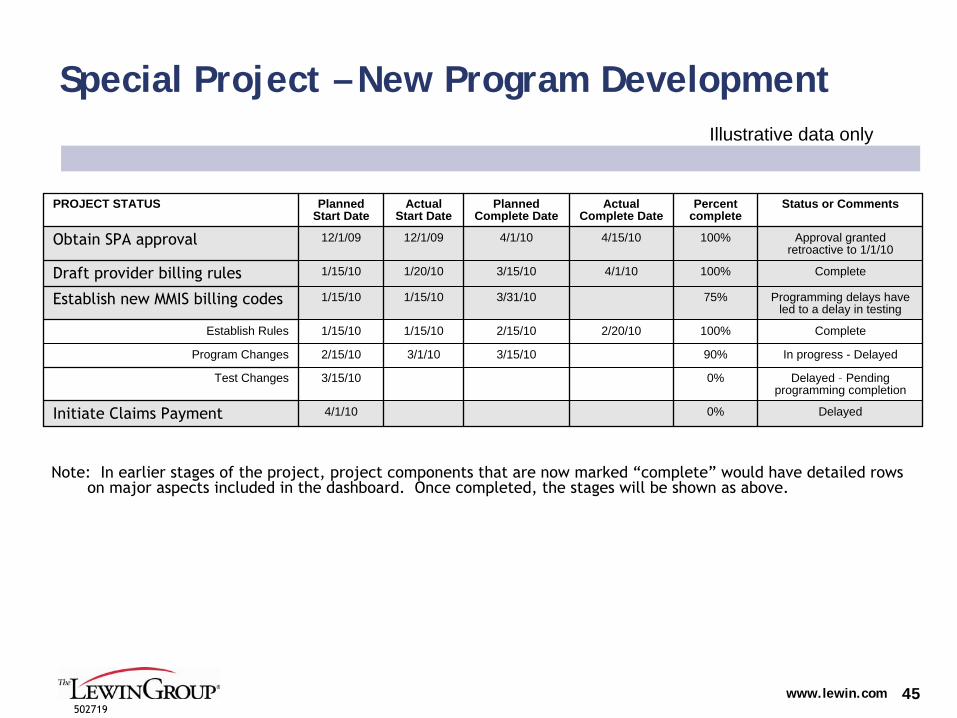
Special Project – New Program Development
PROJECT STATUS Planned Start Date
Actual Start Date
Planned Complete Date
Actual Complete Date
Percent complete
Status or Comments
Obtain SPA approval 12/1/09 12/1/09 4/1/10 4/15/10 100% Approval granted retroactive to 1/1/10
Draft provider billing rules 1/15/10 1/20/10 3/15/10 4/1/10 100% Complete
Establish new MMIS billing codes 1/15/10 1/15/10 3/31/10 75% Programming delays have led to a delay in testing
Establish Rules 1/15/10 1/15/10 2/15/10 2/20/10 100% Complete
Program Changes 2/15/10 3/1/10 3/15/10 90% In progress - Delayed
Test Changes 3/15/10 0% Delayed –
Pending programming completion
Initiate Claims Payment 4/1/10 0% Delayed
Illustrative data only
Note: In earlier stages of the project, project components that
are now marked “complete”
would have detailed rows on major aspects included in the dashboard. Once completed, the
stages will be shown as above.
www.lewin.com502719
46
Over Time Create a Consistent Culture of Accountability for Senior and Mid-level Staff
In addition to the executive dashboard metrics, program managers
should develop program specific performance metrics
Several program areas including pharmacy, call center, program integrity, budget, and MMIS already collect a variety of metrics and produce reports
Metrics should be shared with program staff to develop an understanding of how performance is being measured
Managers should use metrics to monitor performance and intervene
when necessary
Significant shifts that merit executive involvement could be added to the monthly executive dashboard, or shared separately
The following slide includes a number of sample metrics for managers
In addition to the examples here, a number of important metrics for monitoring enrollment activities were suggested in an August 2009 memo from
HMA

www.lewin.com502719
47
Examples of Metrics for Individual Program Managers
Metric Description Data Source
Average and median LOC scores for the current caseload, by program
Scores provide a proxy for average acuity of individuals; higher
average scores indicate that services are more likely substituting for higher, more expensive services
DHSS and/or future vendor
LOC denial rates, by program For monitoring the impact of proposed intake and assessment changes, and any future changes to the LOC criteria
DHSS and/or future vendor
Average and median cost of HCBS care plans, by program, by county/region
Will help expose regional variations in care plans and longitudinal trends; also part of the process for monitoring the proposed new
intake and assessment system
Care plans, potentially through CyberAccess
Electronic care management tool utilization
Used to track provider utilization of tools such as CyberAccess and SmartPA
Clinical Services / Contractor
Percent change in prescriptions by therapeutic class
Metric for monitoring physician prescribing patterns and market shifts
Pharmacy unit
DME units of service and total billed Allows monitoring of DME subcategories for significant changes in utilization
Claims data
Call center calls received, abandoned, call duration
Performance metrics related to customer service Call center operations
www.lewin.com502719
48
Care Management
www.lewin.com502719
49
Finding #6: MO HealthNet has Cultivated a Philosophical Commitment to Care Management and HIT
Commitment to care management and coordination
Chronic Care Improvement Program has established a strong foundation for providing much-needed care coordination services to MO HealthNet’s non-
capitated high-need beneficiaries
Enhanced Inpatient Review Services program is being implemented to provide pre-certification and continued stay reviews
Focus on HIT to enhance quality and efficiency
CyberAccess continues to be enhanced and is increasingly used by
Missouri providers to expand their knowledge base and facilitate efficient interaction with MO HealthNet
CCIP has innovative care management components, for example, connectivity between CyberAccess and CareConnection
and health coaches in selected federally-qualified health centers and Truman Medical Center
SmartPA
has extensive algorithm-based rules to maximize pre-certification in clinically-related areas, including durable medical equipment
www.lewin.com502719
50
Finding #7: Existing care management/service coordination approaches are not optimized
Ultimately, the current resource commitment required to build and monitor an effective care management program is insufficient
Adding a full-time Medicaid Medical Director can help increase this commitment
The CCIP program has not been effective in reducing Medicaid costs for the dual-eligible population and opportunities may exist to enhance program effectiveness for other participants
Case management/services coordination for community-based long-term care
programs is virtually non-existent
There does not appear to be any robust assistance available to Medicaid beneficiaries transitioning out of hospitals or nursing
facilities
www.lewin.com502719
51
A Significant Number of MO HealthNet Participants Would Benefit from More Robust Care Management
Similar to other states nationwide, the Aged, Blind, and Disabled (ABD) population accounts for less than 30 percent of Missouri’s Medicaid enrollees yet accounts for more than 60 percent of spending
While much of this spending is for long-term care, through claims analysis we identified more than 10,000 participants with extremely high use of pharmacy services (more than $5,000), emergency room
visits (ten or more), and/or inpatient admissions (three or more) in one year
In a separate analysis, we identified over 6,000 participants that incurred more than $100,000 of Medicaid expenses in 2008
Many participants don’t reach these thresholds, but have chronic conditions, disabilities, and/or serious mental illness and could benefit from a coordinated care management approach
www.lewin.com502719
52
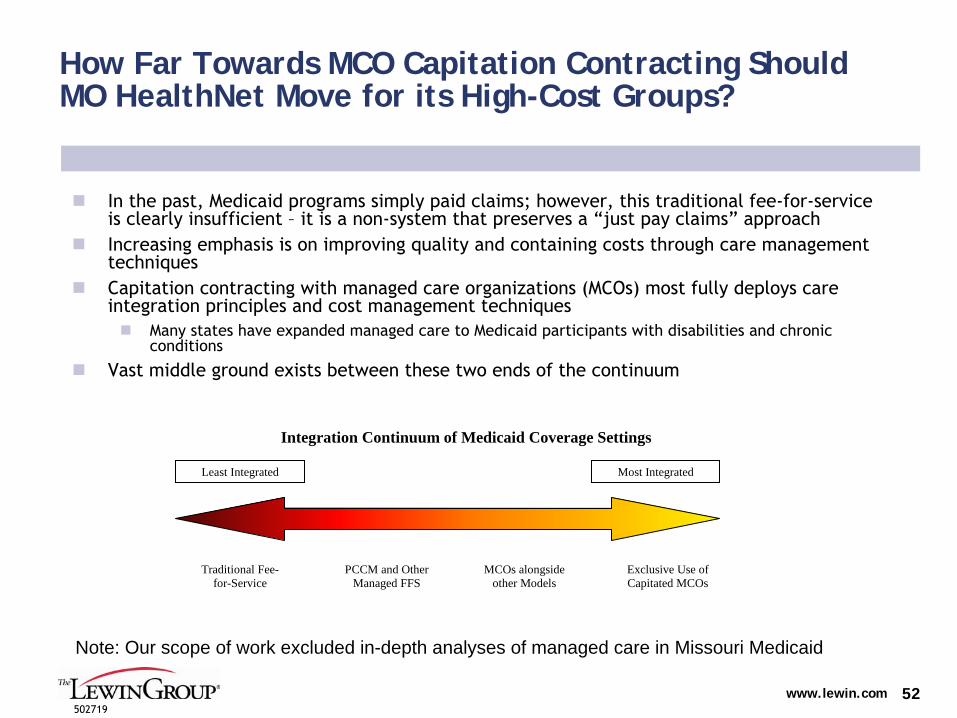
How Far Towards MCO Capitation Contracting Should MO HealthNet Move for its High-Cost Groups?
In the past, Medicaid programs simply paid claims; however, this
traditional fee-for-service is clearly insufficient –
it is a non-system that preserves a “just pay claims”
approach
Increasing emphasis is on improving quality and containing costs
through care management techniques
Capitation contracting with managed care organizations (MCOs) most fully deploys care integration principles and cost management techniques
Many states have expanded managed care to Medicaid participants with disabilities and chronic conditions
Vast middle ground exists between these two ends of the continuum
Least Integrated Most Integrated
Traditional Fee-for-Service
PCCM and Other Managed FFS
MCOs alongside other Models
Exclusive Use of Capitated MCOs
Integration Continuum of Medicaid Coverage Settings
Note: Our scope of work excluded in-depth analyses of managed care in Missouri Medicaid

www.lewin.com502719
53
Initiating MCO-based Managed Care for the ABD Population Involves Careful Consideration
Missouri may consider expanding the current Medicaid MCOs’
role or can initiate a full procurement. For either option, it will be important to consider:
1.
How to engage beneficiary stakeholders and secure their support2.
How other stakeholders (e.g. agencies, providers, contractors) will be impacted
3.
Whether to enroll the SSI population on a voluntary or mandatory
basis4.
What regions to include in a managed care expansion5.
Whether to include both dually-eligible and non-Medicare-eligible participants6.
What services to provide through the MCO7.
What financial arrangement is appropriate for the MCOs (e.g., capitation rate, stop loss)
8.
Whether the provider networks are adequate for this new, more complicated population
9.
What resources are needed within MO Medicaid10.
How to ensure sufficient managed care quality oversight11.
How MO HealthNet financing arrangement will be impacted
www.lewin.com502719
54
1. Engage Beneficiary Stakeholders and Gain Their Support
Beneficiary and advocate support is critical to ensuring a smooth program implementation and linkages outside of the traditional medical community important for this population
Strategies to gain stakeholder support include:
Public Meetings: Prior to implementation and throughout the program implementation process, public meetings can be a valuable strategy for gathering opinions from individual consumers. Pennsylvania held public meetings before and after implementation to discuss concerns from advocates and consumers regarding expansion of mandatory SSI managed care into additional areas of
the State.
Focus Groups: Focus groups are an effective way to obtain specific consumer and provider concerns and recommendations regarding implementation of an SSI program. For example, Oregon convened a wide group of stakeholders to provide feedback throughout implementation, often emphasizing that “everyone would get something and not everyone would get everything.”
Advisory Committees: Several states have used advisory committees comprised of various stakeholders to provide input on initial program design and implementation, as well as ongoing feedback. For example, Pennsylvania assembled Regional Advisory Committees (RACs) in which beneficiaries and physicians meet regularly to provide feedback on disease management activities targeting the SSI population. New York also created an SSI Task Force comprised of multiple stakeholders.

www.lewin.com502719
55
2. Involve Other Stakeholders
Agencies that administer programs that are used substantially by
the ABD population will need to be involved in planning and implementation activities, in particular:
Department of Mental Health
Department of Health and Senior Services
Providers will need to be consulted and involved in planning activities, particularly those that will be most impacted, including:
Physicians
Hospitals
Community-based providers
Several existing contracts would need to be expanded or re-procured:
Enrollment Broker
External Quality Review Organization
Actuarial
www.lewin.com502719
56
3. Decide on Mandatory vs. Voluntary Enrollment
Beneficiaries and advocates may be more comfortable with voluntary enrollment due to increased choice, while MCOs are likely to support mandatory enrollment to reduce risk
Historically, mandatory enrollment has proven far more effective
at controlling cost and minimizing administrative expenses
Most significant cost savings are associated with mandatory enrollment to ensure highest enrollment levels
However, continuity of care may be jeopardized without sufficient access to specialists and the fact that long-time providers may withdraw based on managed care
Voluntary enrollment requires more complicated risk methodology,
given the issue of beneficiaries who may “opt out”
of the program
However, voluntary enrollment allows for a gradual phase-in of the program while learning about the population and its unique needs

www.lewin.com502719
57
4. Determine Which Counties or Regions Will Be Included in ABD Managed Care
Currently, Medicaid managed care for the TANF population is limited to the I-70 corridor
Efforts to expand beyond this area have had limited success
Enrolling the ABD population into managed care will raise similar questions regarding appropriate regions and access to care in more rural parts of the State
The State may want to consider initiating a pilot program or a phased approach to implementation
Piloting or phasing-in allows the State to adjust the program based on Missouri-specific experience and outcomes
www.lewin.com502719
58
5. Dually Eligible Participants Present an Additional Challenge
Much of the ABD population is dually-eligible for both Medicaid and Medicare
Participants that are eligible for both Medicare and Medicaid are among the most expensive and most likely to need care management
While additional care management opportunities may exist, dual eligible participants present a unique challenge since most of their acute care costs are covered by Medicare
Therefore, savings associated with care management are most likely to accrue to Medicare, unless there is a shared-savings agreement with CMS
The most common option that states have pursued is the use of Special Needs Plans (SNPs)
Current SNP program authorization expires in December 2010
Other states have relied on waiver authority under Sections 1115, 1915(a), or 1915(b)/(c) of the Social Security Act to address cross-program financing and operational issues
North Carolina’s demonstration program, including shared-savings, was authorized by Section 646 of the Medicare Modernization Act
Window of opportunity under this Section is likely closed
For a detailed analysis of legal options see: http://www.chcs.org/usr_doc/Supporting_Alternative_Integrated_Models_for_Dual_Eligibles.pdf
www.lewin.com502719
59
6. Determine Services to be Provided through the MCO
There will likely be considerable pressure to exclude particular
services from managed care for the ABD population
Services that are most often “carved out”
include pharmacy, mental health, and substance abuse services
Pharmacy and mental health services account for a very significant proportion of health care spending for this population and should be included for managed care to fully succeed
To receive the greatest benefit of care coordination provided through managed care MCOs must be permitted to manage all services
Our experience is that, when services are carved out of the managed care benefit, MCOs are far less likely to consider the carved-out services in their overall care management approach
This leads to both less-effective overall care management and limits cost containment that can be affected by the MCOs
www.lewin.com502719
60
7. Analyze Financial Arrangements
Rate setting for a population with diverse and extensive health care needs is more complicated than for the TANF population
MO HealthNet may want to consider MCO risk corridors (a financial arrangement where the State would share a portion of unanticipated gains and losses) or stop-loss provisions (a financial arrangement to cap an MCO’s loss for any individual), particularly in the early years of the program
In some early state experiences, costs were significantly higher
than expected due to the fact that there had been significant unmet need in the fee-for-service program, particularly related to behavioral health
Significant start-up costs will likely limit the opportunity for short-
term savings
www.lewin.com502719
61
8. Ensure Sufficient Provider Networks
Networks to provide services to the ABD population differ from TANF networks
States are required to allow specialists to serve as primary care providers (PCPs)
PCP visits may take longer for beneficiaries with multiple or complicated conditions
Additional types of specialists may be needed to serve this population
MCOs must demonstrate adequate networks of providers (including specialists) and provide access within specified distance and timeframes
State effort to evaluate MCO readiness may be significant
Identifying sufficient numbers of providers who are able and willing to participate may be challenging, particularly in more rural areas

www.lewin.com502719
62
9. Ensure Sufficient Internal Resources
Expanding managed care to the ABD population would require significant resources within MO HealthNet
With many potential stakeholders, numerous discussions are likely prior to actually issuing an RFP
Discussions may include access concerns, quality concerns, and carve-in/out dynamics
Preparing for these discussions and addressing stakeholder concerns will likely include a variety of analytics and public communications
Impact on other aspects of MO HealthNet financing will require dedicated effort by policy development staff, possibly in conjunction with
provider associations and CMS
Significant time and effort would be required to issue an RFP, oversee rate range determination, and establish contracts with MCOs
This process could easily take 18 months or more
MMIS updates will be required to account for the expanded population in the managed care program
Sufficient time and resources will need to be devoted to submitting a waiver modification to CMS and obtaining approval
www.lewin.com502719
63
10. Strong Quality Oversight is Essential for Particularly Vulnerable Populations
Managed care quality assessment and improvement is currently overseen by a small staff within MO HealthNet Operations
Any expansion of managed care beyond the existing I-70 TANF population would require a far more robust and higher-profile oversight unit
Expansion would require a larger EQRO, as described earlier
Managed Care Operations, including plan operations as well as quality assessment and improvement, should be elevated to a Director-level position within MO HealthNet
Quality assessment and improvement activities should be emphasized by MO HealthNet and include both managed care and fee-for-service programs, regardless of the decision on expanding managed care
www.lewin.com502719
64
11. Determine Potential Impact on Existing Financing Mechanisms
As in other states, managed care is expected to reduce inpatient
hospital utilization and, therefore, result in reduced payments to hospitals
This shift would have a relatively minor impact on the FRA tax assessment because Medicaid represents a relatively small proportion of hospital revenues
Tax revenues could be more impacted if MCOs reimburse hospitals at rates substantially lower than total Medicaid payments
We expect, however, that supplemental upper payment limit (UPL) payments will be significantly impacted
Federal policies currently permit these significant supplemental
payments to hospitals, which in Missouri are financed by the FRA
However, these policies do not allow states to count inpatient days for MCO enrollees in determining the UPL
Shifting a significant proportion of the population into managed
care would lower the UPL, sharply reducing the total amount of revenue that could be paid to hospitals
While these funds could potentially be used in other parts of the program, such a decision requires careful and detailed policy analysis
If the UPL were lowered too far, total payments to hospitals may
fall short of the amount required by RSMo
§208.471, forcing a reduction in the tax assessment or expiration of the tax
www.lewin.com502719
65
Managed Care Expansion Could Ultimately Be a Viable Option if Key Challenges are Overcome
Moving high-cost subgroups into capitation may be advisable under the following circumstances:
Sufficient time and State resources are provided to ensure a successful implementation
Sufficient provider capacity is identified and providers are prepared for the expansion
High cost services are included within the managed care scope to
maximize ROI
The State is able to preserve or replace existing Federal UPL revenue, possibly through an 1115 waiver, negotiated with CMS, such as the one that created Florida’s Low Income Pool (LIP)
For dual eligibles to be included, Medicare and Medicaid spending would need to be combined in a manner that permits the State to share in the savings that occur on this entire pool of funds (this would also require a special arrangement with CMS)
www.lewin.com502719
66
Enhanced Care Management May be a More Viable Short- Term Approach for Non-Dual-Eligible ABD Participants
Managed care expansion would require significant staff attention
and resources at the same time that national health reform is already stretching limited Medicaid resources nationwide
Existing hospital financing mechanisms tied to fee-for-service patients would be significantly affected by a shift to managed care
Mitigating these impacts would most likely involve negotiations with CMS which could take a substantial amount of time to complete, further limiting any short-term savings
A targeted care management approach for the costliest participants could achieve similar reductions in inpatient utilization without significantly impacting the UPL
Such a program could potentially be funded with FRA tax revenue while mitigating the impact on total hospital revenues under the UPL
www.lewin.com502719
67
Medicaid Care Management Terminology
Patient Centered Medical Homes -
Each patient has an ongoing relationship with a personal physician who leads a team of individuals that collectively takes responsibility for the ongoing care of patients. Care is coordinated across all elements of the health care system and the patient’s community. Care is facilitated by registries, information technology, health information exchange and other means to assure that patients get
the indicated care when and where they need and want it.1
Primary Care Case Management (PCCM) –
Basic PCCM program have long been used by Medicaid programs to link patients with providers that perform basic care management functions for a small monthly fee.
Increasingly, states are using enhanced PCCM programs to provide more intensive case management and care coordination (such as through medical homes)
Sources: 1Joint Principles of the Patient-Centered Medical Home, March, 2007; accessed at: http://www.medicalhomeinfo.org/Joint%20Statement.pdf
www.lewin.com502719
68
Patient Centered Medical Homes Could Meet the State’s Care Management Objectives
Nationally, there is an increasing use of “Patient Centered Medical Homes,”
a coordinated approach that relies on primary care teams to address all of a patient’s health care needs
North Carolina has been a leader in this area through their Community Care of North Carolina (CCNC) program, an enhanced PCCM program
Vermont’s multi-payer Blueprint for Health has been touted as a model for a National Medical Home Initiative
Many other states have programs in various stages of implementation and several examples are include in Appendix C
Senate Bill 577 requires that participants “shall be enrolled in a health improvement plan and be provided a health care home”
by 2011
Health improvement plans include coordinated fee-for-service plans and are required to use evidence-based best practices
National health reform legislation signaled a federal emphasis on the concept and the potential for additional funding opportunities in the future
Program development ties neatly together with HIT tools such as CyberAccess that MO HealthNet has worked hard to implement
www.lewin.com502719
69
Federal Health Reform Bill Includes State Plan Option for “Health Homes” with 90/10 Funding
Section 2703 of H.R. 3590 provides for a state plan option to designate “health homes”
for individuals with chronic conditions beginning January 1, 2011
During the first two years that the SPA is in effect, states will receive an FMAP of 90 percent for “payments for the provision of health home services”
Payment methodology not limited to PMPM
Planning grants are also available beginning January 1, 2011 to develop a SPA under this section
Eligible individuals include those with two chronic conditions, one chronic condition and at risk for a second, or one serious and persistent mental health condition
www.lewin.com502719
70
Key Considerations for Medical Home Success
Medical homes require a sufficient supply of primary care practitioners
Missouri may want to evaluate their current method of GME reimbursement and consider incentives for training and retaining primary care practitioners in underserved areas
A critical factor in making the medical home work for beneficiaries with chronic illnesses and disabilities is to provide various forms of external support to physician practices including:1
Risk stratification through predictive modeling and targeting of
the intensity of the intervention (i.e., high-
or low-touch)
Current information about their patients’
conditions, care needs, and service use
Resources for care management and care coordination that are often not available in physician offices
Performance measurement and incentives for medical homes that improve care for beneficiaries, likely starting with “paying for participation”
Sources:1http://www.dhcs.ca.gov/provgovpart/Documents/Waiver%20Renewal/Enhanced%20Medical%20Home%20For%20Medi-Cal%27s%20SPD%20Population.PDF
www.lewin.com502719
71
Existing Care Management Program (CCIP) Provides a Foundation for Care Management, Including Medical Homes, But Needs Strengthening
Approximately 2,000 physicians participate in the current care coordination initiative
However, provider engagement is inconsistent
Interconnectivity between CyberAccess
and CareConnection
allows providers and health coaches to share patient information on a real time basis
Health information technology is an important part of the program and tools are continually being enhanced (e.g. hospital case management tool under development)
The presence of health coaches in FQHCs
and the Truman Medical Center offers in-person care management to members at a “teachable”
moment, immediately following the provision of care
However, the vast majority of patient contact is telephonic
Gateway conditions do not target those individuals who are most likely to benefit from care coordination
www.lewin.com502719
72
The Existing Care Coordination Program Can Be Improved
Future contract enhancements can further improve the program
Incorporate shared risk component to further incentivize cost containment
Stratify program so that higher intensity interventions are targeted at the participants deemed to be most impactable
and for whom lower intensity outreach efforts have not succeeded
Consider a pay-for-performance component based on outcomes
Continue to integrate HIT tools
A full evaluation of CyberAccess
is recommended to:
Evaluate the utility and ease of use of the existing system
Identify enhancement opportunities
Consider ways that CyberAccess
use can be further encouraged
For example, could it be extended to State and local government employees to make it more worthwhile for providers to use it?
Consider linking CyberAccess
to billing/claims system to simplify provider workload
www.lewin.com502719
73
MO HealthNet Should Target Individuals for Outreach Based on the Ability to Effect Change
Claims cost levels alone should not drive who is targeted
Many persons with high-costs are not amenable to being helped by outreach in a way that will yield sufficient Medicaid savings
Eligibility category should also not drive who is targeted
Many persons in ABD, for example, are using the health care system appropriately (and many have only minor health issues)
“Disease management”
model is not suggested either
Focusing on pre-selected diagnoses can include many people who are not amenable to impacts and exclude many persons who are amenable
Our suggested target groups, based on claims analysis, include approximately 10,000 non-dual eligible high utilizers
Other groups could also be targeted, but the size of this target
population is large enough to exhaust existing outreach resources
For example, we also looked at high cost individuals (>$100K) and identified about 6,000 that warrant additional analysis to determine impactability
www.lewin.com502719
74
Targeting Could Potentially be Improved Using Predictive Modeling Principles
Predictive modeling identifies individuals and subgroups that are most likely to be impactable
through outreach and care coordination
Predictive models are data-driven, decision-support tools that estimate an individual’s future potential health care costs and/or opportunities for care management
Predictive variables can include diagnosis, prescriptions, functional status, and prior cost
Building or purchasing a predictive modeling tool can be a costly and time consuming endeavor
MO HealthNet should evaluate the ROI associated with a fully capable system versus incorporation of basic predictive modeling
principles into the care management selection process
Source: Center for Health Care Strategies, “Predictive Modeling: A Guide for State Medicaid Purchasers” accessed at: http://www.chcs.org/usr_doc/Predictive_Modeling_Guide.pdf
www.lewin.com502719
75
A Stepwise Approach to Care Management Would Target Levels of Intervention Depending on Need
Lowest levels would involve phone calls and mailings
Highest levels could involve extensive face-to-face interaction by multiple persons
Impacts on individuals’
health status and costs will vary –
even when same outreach approach is taken with people with similar-looking circumstances
Some beneficiaries will improve substantially with even modest outreach
Others will be unable or unwilling to improve despite extensive outreach efforts
This stepwise approach, combined with targeting potential participants, allows MO HealthNet to match the extent of intervention to available resources
www.lewin.com502719
76
Evidence is Spotty as to Which Outreach Approaches Work Optimally for Which Persons
Existing Medicaid outreach programs have been difficult and controversial to measure
Outreach programs have not typically been designed up-front in a manner conducive to an accurate assessment of savings
Contractors tend to share only those analyses and methodologies that show savings and validate the services they are providing (or seeking
to sell)
States are also often reluctant to disclose findings that their initiatives have not been cost-effective
Seemingly minor methodological changes to how the impacts are quantified often yield dramatically different results
Assessing the impacts of Missouri’s CCIP initiative has been a good case example of the challenges involved in quantifying savings (or lack thereof)
www.lewin.com502719
77
Our Recommended Approach is Designed to Create an Ongoing Evidence-Based Structure
Electronically track all outreach attempts and interactions for each targeted individual
Support tracking the level of effort needed to make contact with
each targeted person & degree of engagement achieved with the beneficiary, family members or other key day-to-day caregivers, key providers, etc.
Outreach often needs to occur with persons other than the beneficiary due to mental health issues, home environment issues, strong degree to which significant others can “either be part of solution or part of the problem,”
etc.
Allow for comparisons between cost/usage impacts and level/nature of outreach efforts and actual interactions

www.lewin.com502719
78
Actively promote provider engagement
Create a Physician Advisory Board, with engagement by incoming Medicaid Medical Director, to engage physicians in MO HealthNet
Possible topics for discussion would include the promotion/enhancement of CyberAccess, evaluation goals, ongoing measurement strategies, care management tools for providers, future pilot or demonstration projects
Identify program champions
“Providers are critical to any care management program; interested providers will endorse the concepts of the interventions with patients, identify interventions needed for patients, and provide valuable program input.”1
Source: 1The Lewin Group, “Designing and Implementing Medicaid Disease and Care Management Programs: A User’s Guide,” March, 2008. Accessed at: http://www.ahrq.gov/qual/medicaidmgmt/medicaidmgmt.pdf
www.lewin.com502719
79
State Has Several Options as to Who Conducts the Recommended Care Management Programs
Direct performance by State
Entails creating a care management group whose sole function is to interact with targeted beneficiaries and catalogue all outreach activities
Would require redeploying some existing personnel and likely some new hiring as well. States often have difficulty hiring and retaining qualified clinical staff.
Would require substantial time to, for example, identify, develop and install a care management system
Contracting with the existing care management vendor or procuring a new vendor are other options for implementing the enhanced program
Contracting out can likely be accomplished more quickly than direct performance approach
Unclear how a vendor approach would operate in a “health home”
environment
Strong performance incentives would be needed to incent these organizations to maximize net Medicaid savings
Suggested outreach approach also requires strong analytic component
Provide initial and ongoing beneficiary-specific data to outreach team to support their efforts as well as extensive reporting to track outreach efforts
and impacts
These analytics could be performed directly by the State or contracted out
www.lewin.com502719
80
Evaluation Must Be a Strong Component of the Care Management Program
Establish clear evaluation goals (e.g., cost containment, access
to preventive care and screenings, quality outcomes) and manage expectations of key stakeholders
Continue to develop electronic tools to track providers and participants, measure outcomes, and determine ROI
Institute ongoing or periodic program monitoring activities to generate “real-
time”
results
Evaluate the appropriateness of these results for inclusion in the Executive Dashboard
Leverage incoming Medicaid Medical Director and enhanced Quality
Unit to lead evaluation component and spearhead resulting continuous quality improvement strategy
An enhanced Quality Unit should be established regardless of the
care management approach adopted
Identify appropriate opportunities to compare performance and outcomes across programs

www.lewin.com502719
81
Program Structure & Financing
www.lewin.com502719
82
MO HealthNet: The Current State
Outdated reimbursement systems
Line item budgeting hinders policy making and program assessment
Budget process requires significant manual effort
Heavy reliance on provider taxes to the detriment of policy making and program management

www.lewin.com502719
83
Finding #8: Institutional Reimbursement Systems Do Not Incentivize Efficiency
Current reimbursement systems are not value-based and reward utilization over efficiency
Per-diem inpatient reimbursement incentivizes high utilization for low-acuity patients
Cost-to-charge reimbursement for outpatient care incentivizes volume over efficiency
Outdated nursing facility cost base negates intent to reimburse providers based on cost experience
Nursing facilities also have financial incentive to seek low-
acuity Medicaid residents over high-need ones that might otherwise be kept out of a hospital
Note: Our scope of work excluded in-depth analyses of Missouri Medicaid hospital reimbursement
www.lewin.com502719
84
Missouri Should Align Reimbursement with Policy Goals of Promoting Efficiency, Effectiveness, and Quality of Care
Institutional reimbursement systems should account for patient acuity
Providers are accustomed to acuity-based reimbursement from other payers
Higher acuity hospital patients should result in higher reimbursement using a Diagnosis Related Group (DRG)-type methodology
Some states base their hospital reimbursement on Medicare DRGs
modified for state-specific attributes
CMS and other payers have also moved to an outpatient
prospective payment system that pays a fixed rate for groups of clinically similar services called Ambulatory Patient Classifications (APCs)
Nursing facility rates should include adjustment based on Resource Utilization Group (RUGs)
RUGs
are based on MDS data that is already collected by the State
Would not require an overall rate increase
www.lewin.com502719
85
Missouri Should Align Reimbursement with Policy Goals of Promoting Efficiency, Effectiveness, and Quality of Care (continued)
Reimbursing facilities on a reasonable price, rather than provider-
specific cost, basis promotes efficiency
DRGs
and APCs
are structured so that payors
can reimburse facilities a price for services that does not depend on an individual provider’s cost experience
Nursing facilities can be paid a price per day, with acuity adjustment, based on the overall cost experience of the industry
The most efficient providers have an opportunity to realize a profit by holding costs below the established rate of payment
By rebasing industry costs periodically, efficiency gains can help hold down rates
In other deliverables, we have noted multiple places where Medicaid rates appear to be only loosely based on value-based purchasing concepts (e.g., $400m in payments for personal care services)
Additional analysis of reimbursement policies is warranted for certain non-
institutional services in addition to those for hospitals and nursing facilities
www.lewin.com502719
86
Missouri Should Align Reimbursement with Policy Goals of Promoting Efficiency, Effectiveness, and Quality of Care (continued)
Reimbursement systems that promote efficiency should incorporate
components to incentivize high quality care
Helps mitigate the incentive to simply provide the minimum level
of service for the lowest cost
CMS/Premier Hospital Quality Incentive Demonstration provided 1%
–
2% bonus payments to high performing hospitals and 1% –
2% penalties to the lowest performers
Participating hospitals have improved quality scores by an average of 17.2% over four years in the five clinical areas measured1
Additional research showed that HQID participants scored on average 6.9 percentage points higher (94.64 percent to 87.36 percent) than non-participants1
The Arkansas Medicaid Inpatient Quality Incentive program provides bonus payments to hospitals that improve care for pneumonia, heart failure and prevention of surgical infection
During the most recent round, 27 Arkansas hospitals improved care sufficiently to qualify for recognition2
Other potential approaches include not paying for “never events”
and bundling payments to encompass a complete episode of care
Several states provide add-on payments to nursing facility rates based on performance indicators, although many are in early stages
Including IA, GA, KS, MN, OH, OK among others
Sources:1 www.qualitydemo.com; 2http://www.afmc.org/HTML/programs/quality_improve/hospital/iqi.aspx
www.lewin.com502719
87
Finding #9: Line Item Budgeting Hinders Coordinated Policy Making
Other states allow considerably more budget flexibility by appropriating a lump sum of Medicaid funds
Departments then allocate funding to program areas
Legislative influence over program direction is maintained through statute and oversight
In addition, appropriating funds for individual program lines inhibits coordinated care
For example, reductions in nursing facility spending should lead
to increases in HCBS spending
Separate budget lines in different agencies does not allow this to occur without legislative involvement
Similar examples exist across the care continuum (e.g. shifting costs from ERs to clinics)
This problem is not unique to Missouri
For example, a 2009 report from the Illinois Taxpayer Action Board states that “In Illinois, department heads are too often focused on particular line items within a department, or even a division, budget. In this situation, decisions are made based on available funding in a given line item, instead of available funding in the entire system.”1
Sources:1 http://www.illinois.gov/PressReleases/Documents/TAB%20Report%20FINAL.pdf
www.lewin.com502719
88
Unify Budgeting to Support Program-Wide Policymaking
Consider budgeting by population rather than service
Many states have been exploring opportunities for coordinated Medicaid budgeting
For example, create a global budget for long-term care
Current appropriations are service-
or program-specific, and this does not allow executive authority to reallocate funds within the LTC system or leverage investments in one place to achieve savings in another
Several states have used budget flexibility and administrative consolidation as essential components to improving their LTC systems (e.g., OR, NJ, VT, WA, WI; OH is also beginning the process)
www.lewin.com502719
89
Framework for PMPM budget
A budget based on per-member-per-month spending would allow the program to align spending with program needs on an ongoing basis
Assessing overall cost of care by population group allows focus to be on the cost of care per participant rather than changes in
provider category spending
For example, budgeting and monitoring on a PMPM basis could inform a discussion on the relationship between increased pharmacy spending and decreased inpatient spending
Opportunities may exist to use existing Thomson contract to monitor spending on a PMPM basis
www.lewin.com502719
90
Finding #10: Current Budget Process Requires Significant Manual Effort
Budget projections require manual update of dozens of worksheets each month
Process requires a significant amount of ongoing staff time
Data systems are not integrated
Information that is input into worksheets is all captured through financial transaction systems
MMIS and other systems development and integration should include mechanisms to automatically generate budget status and projection reports based on paid claims, provider tax revenue, enrollment trends, etc.
Automating reports would free up staff time that could be redirected toward policy development and project management
www.lewin.com502719
91
Finding #11: Heavy Reliance on Provider Taxes To the Detriment of Policy Making
Provider taxes help generate significant financial advantages for Missouri; however, they also lead to:
Significant amount of administrative effort from MO HealthNet leadership, diminishing focus on other policy issues
Policy distortions and skewed cost-benefit calculations for otherwise good policy actions (e.g., MCO carve-outs; actions to reduce ICF/MR, nursing facility, and hospital utilization)
Statutory “poison pills”
require funds generated to enhance payments to the taxed providers, rather than being used to promote policy objectives
There is risk that the 5.5 percent maximum tax rate might decrease in future years, which would jeopardize Medicaid program funding
www.lewin.com502719
92
1115 Waiver Reform Opportunity
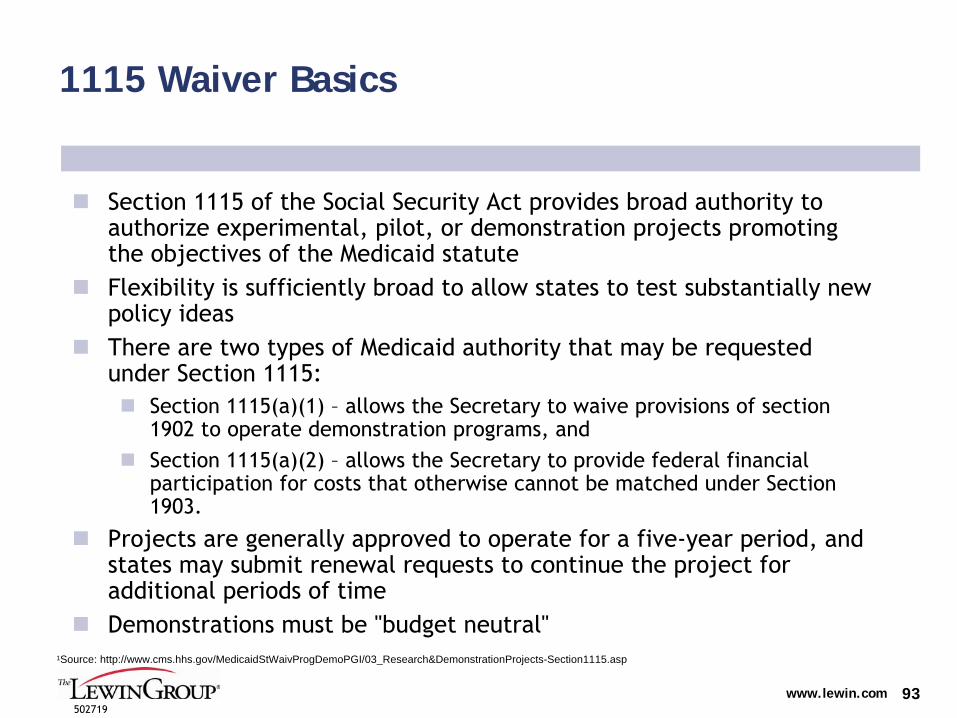
www.lewin.com502719
93
1115 Waiver Basics
Section 1115 of the Social Security Act provides broad authority
to authorize experimental, pilot, or demonstration projects promoting the objectives of the Medicaid statute
Flexibility is sufficiently broad to allow states to test substantially new policy ideas
There are two types of Medicaid authority that may be requested under Section 1115:
Section 1115(a)(1) –
allows the Secretary to waive provisions of section 1902 to operate demonstration programs, and
Section 1115(a)(2)
–
allows the Secretary to provide federal financial participation for costs that otherwise cannot be matched under Section 1903.
Projects are generally approved to operate for a five-year period, and states may submit renewal requests to continue the project for additional periods of time
Demonstrations must be "budget neutral"1Source: http://www.cms.hhs.gov/MedicaidStWaivProgDemoPGI/03_Research&DemonstrationProjects-Section1115.asp

www.lewin.com502719
94
1115 Waiver Opportunity
The only mechanism we can envision for breaking the reliance on provider taxes is negotiating an 1115 waiver demonstration
Under this demo, Missouri would terminate provider taxes in exchange for federal financial contribution to a new fund
Benefits to MO: This demo would remove many of the policy distortions attributable to provider taxes
This demo would be a structural change that might not lead to immediate savings, but it is necessary to allow future initiatives that reduce use of institutional services to proceed and to maximize the financial gain from these initiatives
Benefits to CMS: CMS has clearly grown uneasy with the widespread use of provider taxes as evidenced by recent efforts to restrict the allowable amount of taxes
Recent demonstrations have allowed states to redirect disproportionate share hospital (DSH) funds and supplemental upper payment limit (UPL) payments to provide care for the un-
and under-insured
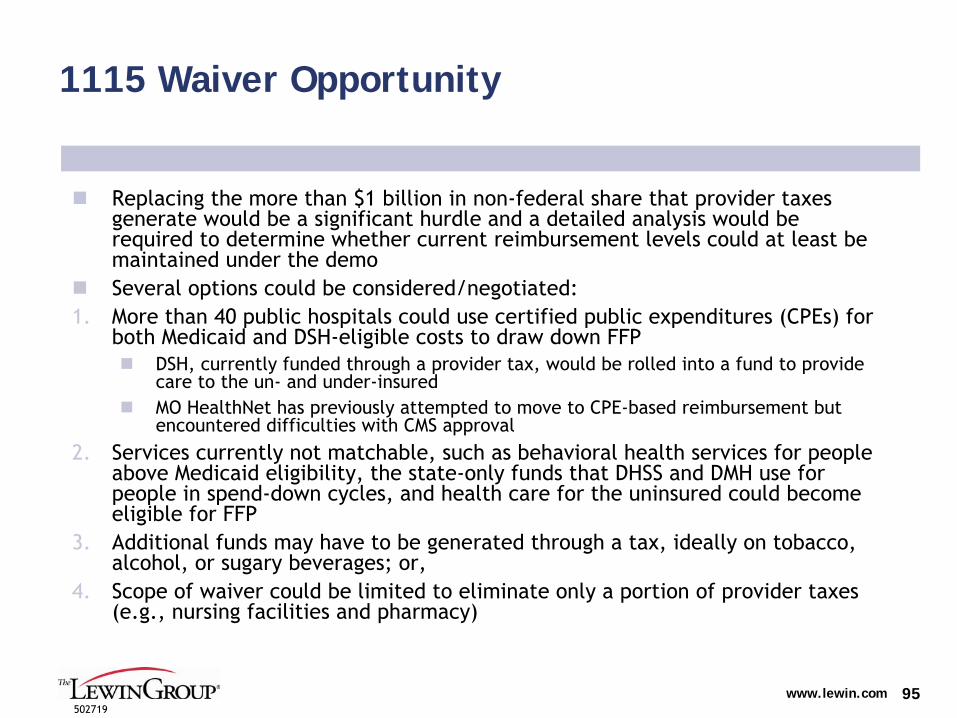
www.lewin.com502719
95
1115 Waiver Opportunity
Replacing the more than $1 billion in non-federal share that provider taxes generate would be a significant hurdle and a detailed analysis would be required to determine whether current reimbursement levels could
at least be maintained under the demo
Several options could be considered/negotiated:1.
More than 40 public hospitals could use certified public expenditures (CPEs) for both Medicaid and DSH-eligible costs to draw down FFP
DSH, currently funded through a provider tax, would be rolled into a fund to provide care to the un-
and under-insured
MO HealthNet has previously attempted to move to CPE-based reimbursement but encountered difficulties with CMS approval
2.
Services currently not matchable, such as behavioral health services for people above Medicaid eligibility, the state-only funds that DHSS and DMH use for people in spend-down cycles, and health care for the uninsured could become eligible for FFP
3.
Additional funds may have to be generated through a tax, ideally
on tobacco, alcohol, or sugary beverages; or,
4.
Scope of waiver could be limited to eliminate only a portion of provider taxes (e.g., nursing facilities and pharmacy)
www.lewin.com502719
96
Next Steps & First Priorities
www.lewin.com502719
97
Next Steps
Initiate process to refine objectives, clarify mission, and establish work plan for accomplishing Medicaid program coordination
Begin discussions with stakeholders on efforts to modify reimbursement systems to align with policy principles
Determine whether or not to pursue a managed care expansion for high cost participants, weighing financial impact, resource requirements, and provider readiness
Identify metrics and implement a performance measurement program
Initiate realignment of LTC administration and budgeting
Work with Legislature to relax restrictions on provider tax use
Begin process to refine potential approaches to a comprehensive 1115 waiver
www.lewin.com502719
98
The Lewin Group
3130 Fairview Park Drive
Suite 800
Falls Church, VA 22042
Main: (703) 269-5500
www.lewin.com
The Lewin Group | Health care and human services policy research and consulting | www.lewin.com3130 Fairview Park Drive, Suite 800 •
Falls Church, VA •
22042 From North America, call toll free: 1-877-227-5042 •
[email protected] Lewin Group is an Ingenix Company. Ingenix, a wholly-owned subsidiary of UnitedHealth Group, was founded in 1996 to develop, acquire and integrate the world's best-in-class health care information technology capabilities.
For more information, visit www.ingenix.com.
The Lewin Group operates with editorial independence and provides its clients with the very best expert and impartial health care and human services policy research and consulting services. The Lewin Group and logo, Ingenix and the Ingenix logo are registered trademarks of Ingenix. All other brand or product names are trademarks or registered marks of their respective owners. Because we are continuously improving our products and services, Ingenix reserves the right to change specifications without prior notice. Ingenix is an equal opportunity employer. Original ©
2008 Ingenix. All Rights Reserved
www.lewin.com502719
99
Appendix A – State Reorganization Examples
www.lewin.com502719
100
Examples of Other States: Program Restructuring & Coordination - Massachusetts1
In 2004, Massachusetts began reorganizing its Executive Office of Health and Human Services (EOHHS) agencies
The Medicaid office was elevated to the EOHHS level
As a unit, Medicaid shrank/decentralized
Many Medicaid staff moved into the EOHHS operating agencies (e.g., the LTC team moved to Elder Affairs)
It created many more “dotted line”
relationships between Medicaid and the other agencies, more of a matrix management model
Spawned greater interagency collaboration
Transition required a major investment of staff time, even for routine activities, when they moved into different agencies
Strong executive leadership was essential to keep re-org moving
Now “re-centralizing”
some functions to Medicaid to maximize coordination
Organization is still evolving today as MA works toward optimal balance
1 Rhode Island created a similar EOHHS in 2004
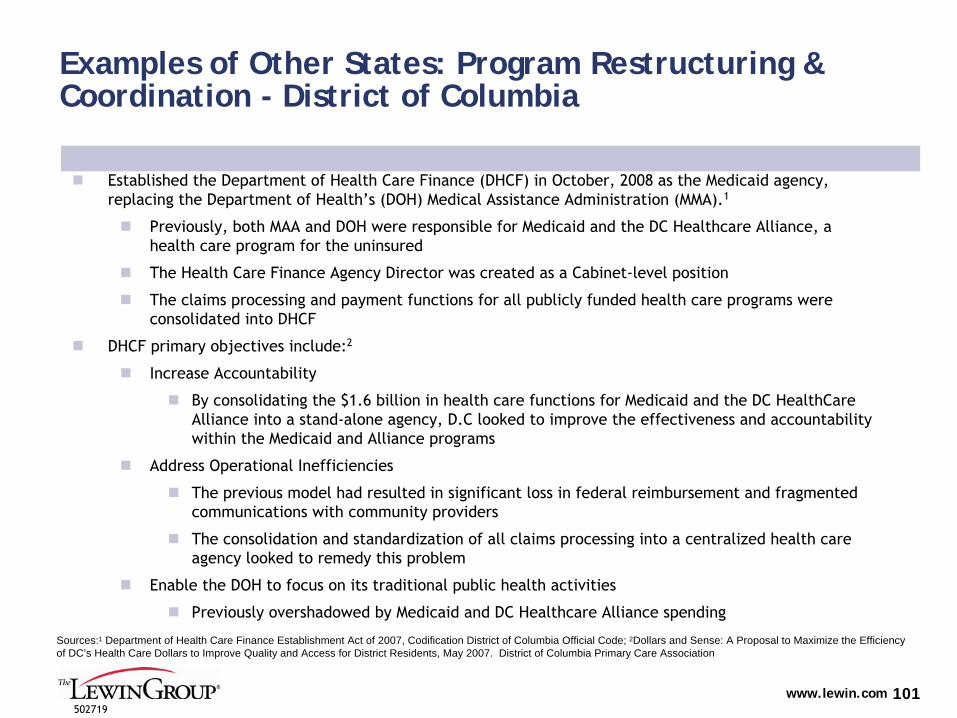
www.lewin.com502719
101
Examples of Other States: Program Restructuring & Coordination - District of Columbia
Established the Department of Health Care Finance (DHCF) in October, 2008 as the Medicaid agency, replacing the Department of Health’s (DOH) Medical Assistance Administration (MMA).1
Previously, both MAA and DOH were responsible for Medicaid and the DC Healthcare Alliance, a health care program for the uninsured
The Health Care Finance Agency Director was created as a Cabinet-level position
The claims processing and payment functions for all publicly funded health care programs were consolidated into DHCF
DHCF primary objectives include:2
Increase Accountability
By consolidating the $1.6 billion in health care functions for Medicaid and the DC HealthCare Alliance into a stand-alone agency, D.C looked to improve the effectiveness and accountability within the Medicaid and Alliance programs
Address Operational Inefficiencies
The previous model had resulted in significant loss in federal reimbursement and fragmented communications with community providers
The consolidation and standardization of all claims processing into a centralized health care agency looked to remedy this problem
Enable the DOH to focus on its traditional public health activities
Previously overshadowed by Medicaid and DC Healthcare Alliance spending
Sources:1 Department of Health Care Finance Establishment Act of 2007, Codification District of Columbia Official Code; 2Dollars and Sense: A Proposal to Maximize the Efficiency of DC’s Health Care Dollars to Improve Quality and Access for District Residents, May 2007. District of Columbia Primary Care Association
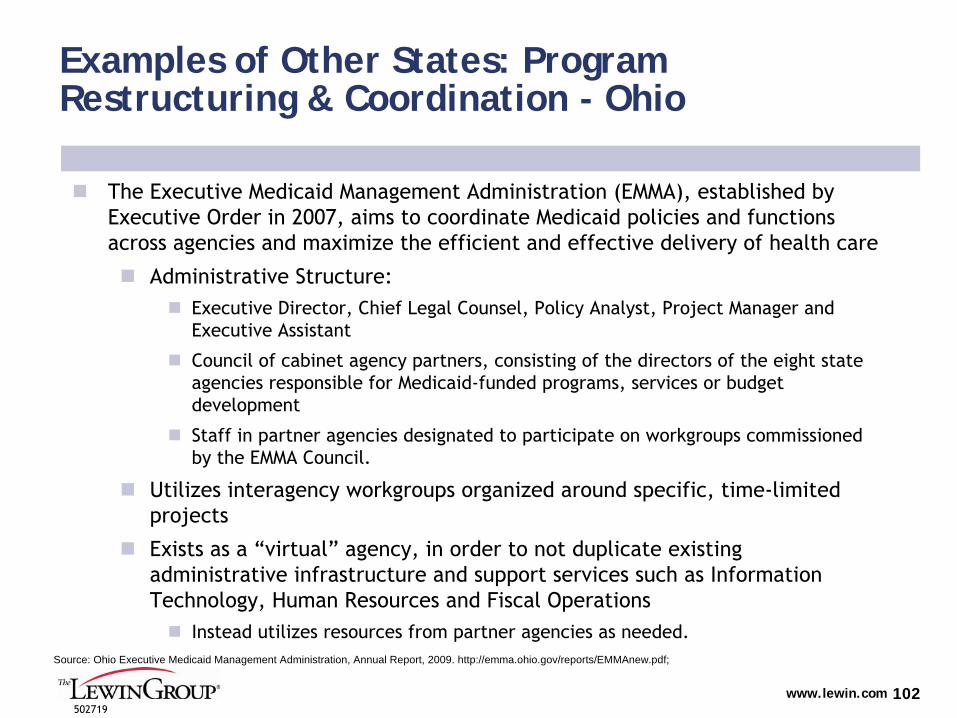
www.lewin.com502719
102
Examples of Other States: Program Restructuring & Coordination - Ohio
The Executive Medicaid Management Administration (EMMA), established by Executive Order in 2007, aims to coordinate Medicaid policies and functions across agencies and maximize the efficient and effective delivery of health care
Administrative Structure:
Executive Director, Chief Legal Counsel, Policy Analyst, Project
Manager and Executive Assistant
Council of cabinet agency partners, consisting of the directors of the eight state agencies responsible for Medicaid-funded programs, services or budget development
Staff in partner agencies designated to participate on workgroups commissioned by the EMMA Council.
Utilizes interagency workgroups organized around specific, time-limited projects
Exists as a “virtual”
agency, in order to not duplicate existing administrative infrastructure and support services such as Information Technology, Human Resources and Fiscal Operations
Instead utilizes resources from partner agencies as needed.Source: Ohio Executive Medicaid Management Administration, Annual Report, 2009. http://emma.ohio.gov/reports/EMMAnew.pdf;
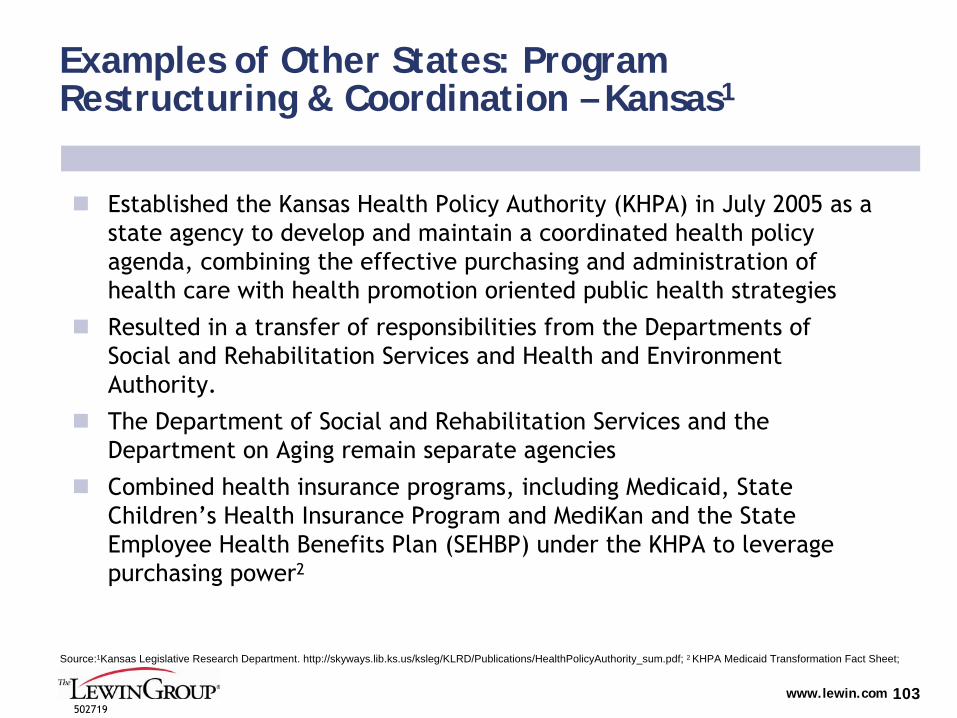
www.lewin.com502719
103
Examples of Other States: Program Restructuring & Coordination – Kansas1
Established the Kansas Health Policy Authority (KHPA) in July 2005 as a state agency to develop and maintain a coordinated health policy
agenda, combining the effective purchasing and administration of
health care with health promotion oriented public health strategies
Resulted in a transfer of responsibilities from the Departments of Social and Rehabilitation Services and Health and Environment Authority.
The Department of Social and Rehabilitation Services and the Department on Aging remain separate agencies
Combined health insurance programs, including Medicaid, State Children’s Health Insurance Program and MediKan
and the State Employee Health Benefits Plan (SEHBP) under the KHPA to leverage
purchasing power2
Source:1Kansas Legislative Research Department. http://skyways.lib.ks.us/ksleg/KLRD/Publications/HealthPolicyAuthority_sum.pdf; 2 KHPA Medicaid Transformation Fact Sheet;
www.lewin.com502719
104
Appendix B – Dashboard Examples
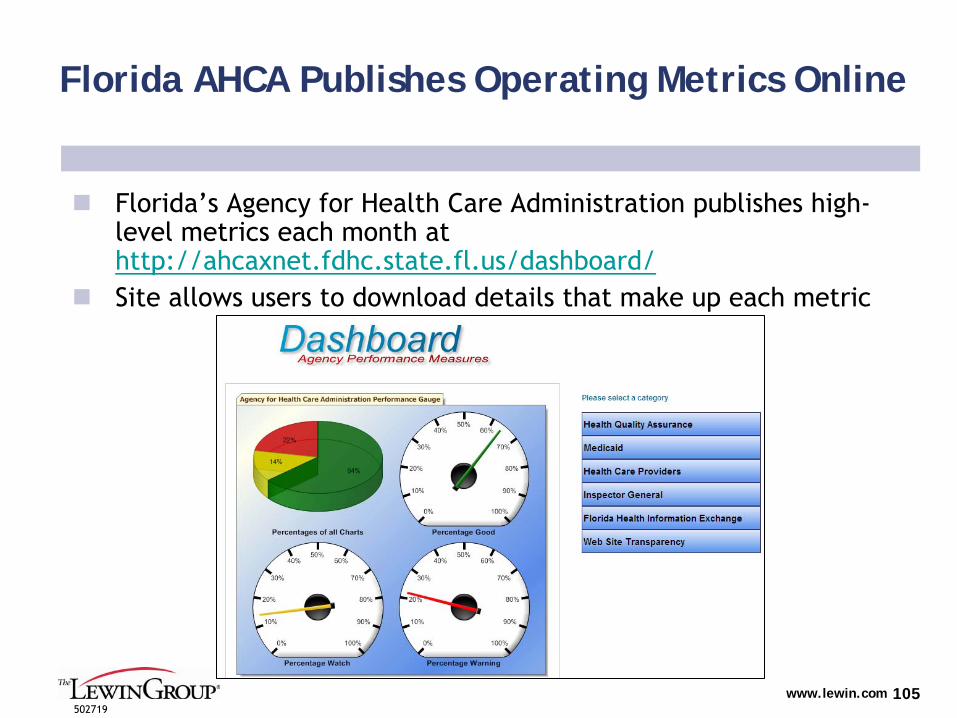
www.lewin.com502719
105
Florida AHCA Publishes Operating Metrics Online
Florida’s Agency for Health Care Administration publishes high-
level metrics each month at http://ahcaxnet.fdhc.state.fl.us/dashboard/
Site allows users to download details that make up each metric
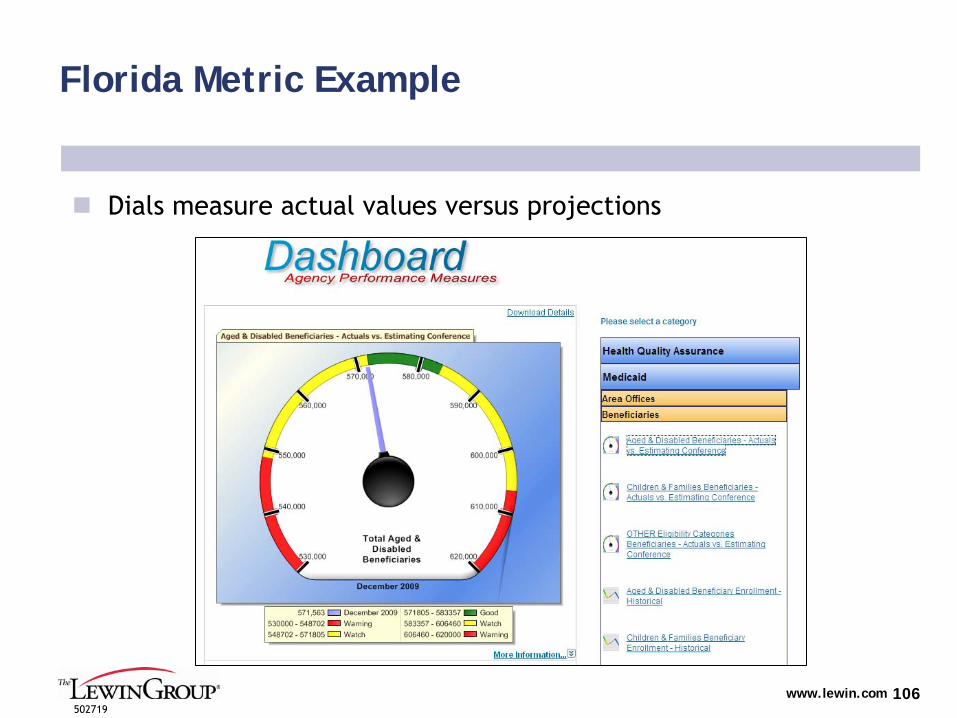
www.lewin.com502719
106
Florida Metric Example
Dials measure actual values versus projections
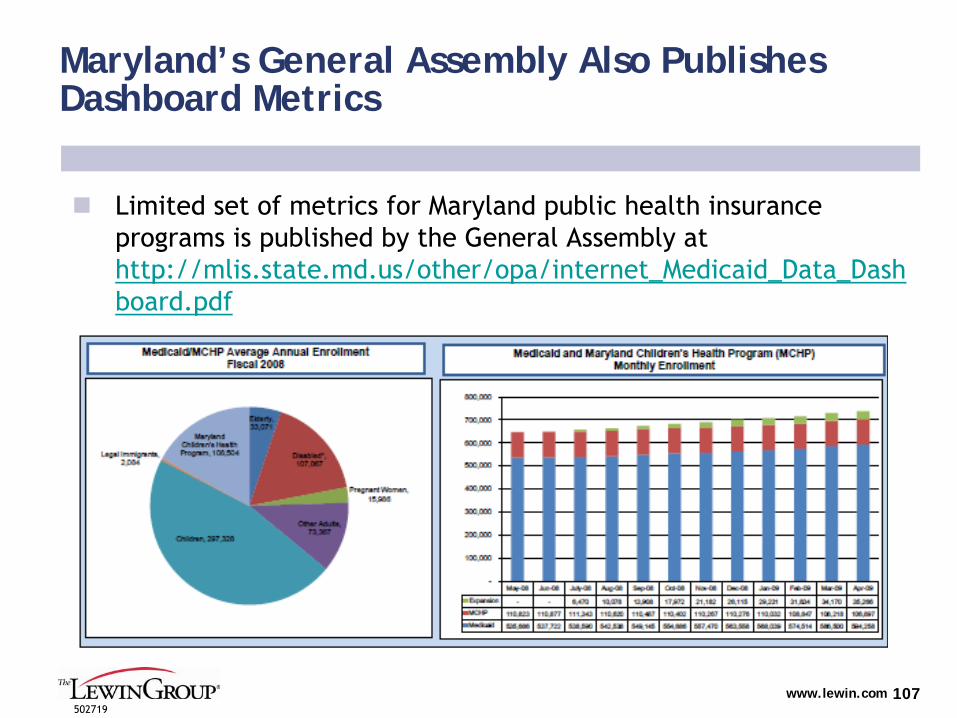
www.lewin.com502719
107
Maryland’s General Assembly Also Publishes Dashboard Metrics
Limited set of metrics for Maryland public health insurance programs is published by the General Assembly at http://mlis.state.md.us/other/opa/internet_Medicaid_Data_Dash
board.pdf
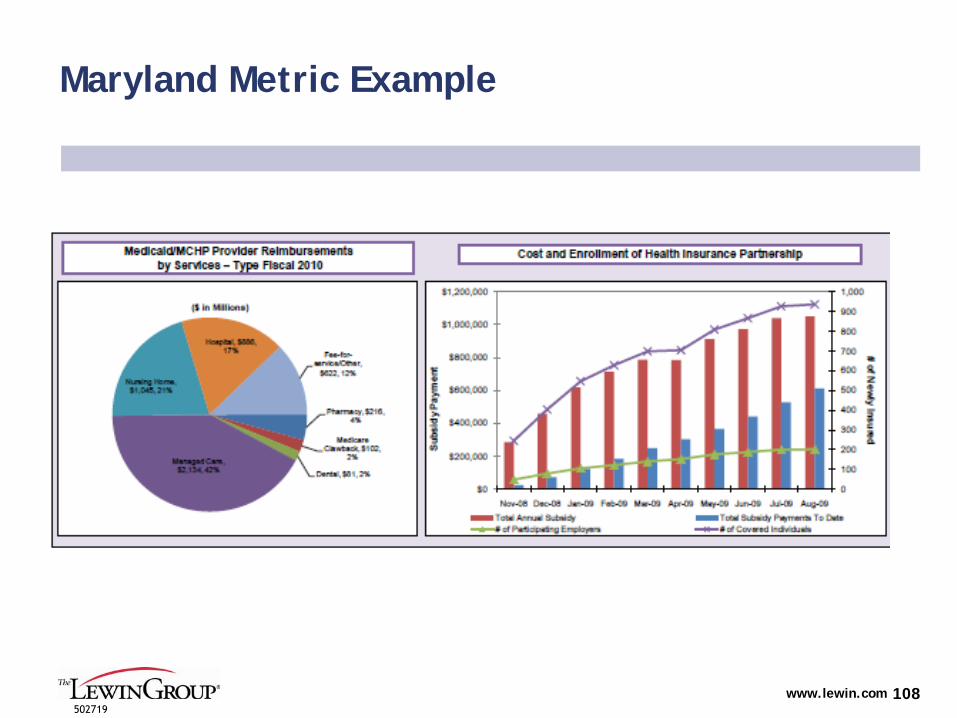
www.lewin.com502719
108
Maryland Metric Example
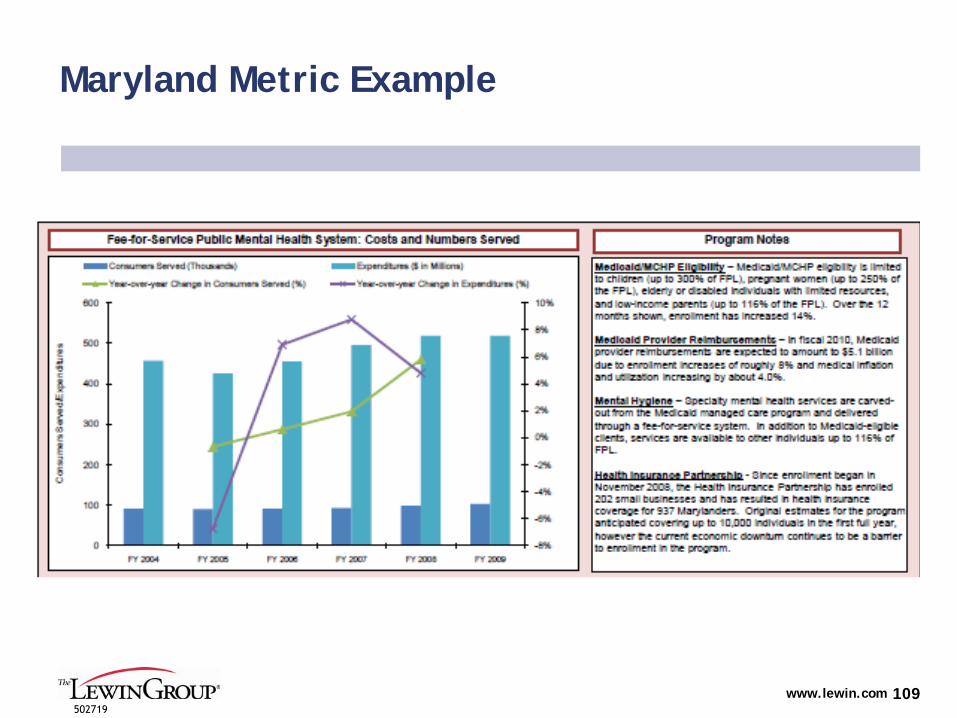
www.lewin.com502719
109
Maryland Metric Example
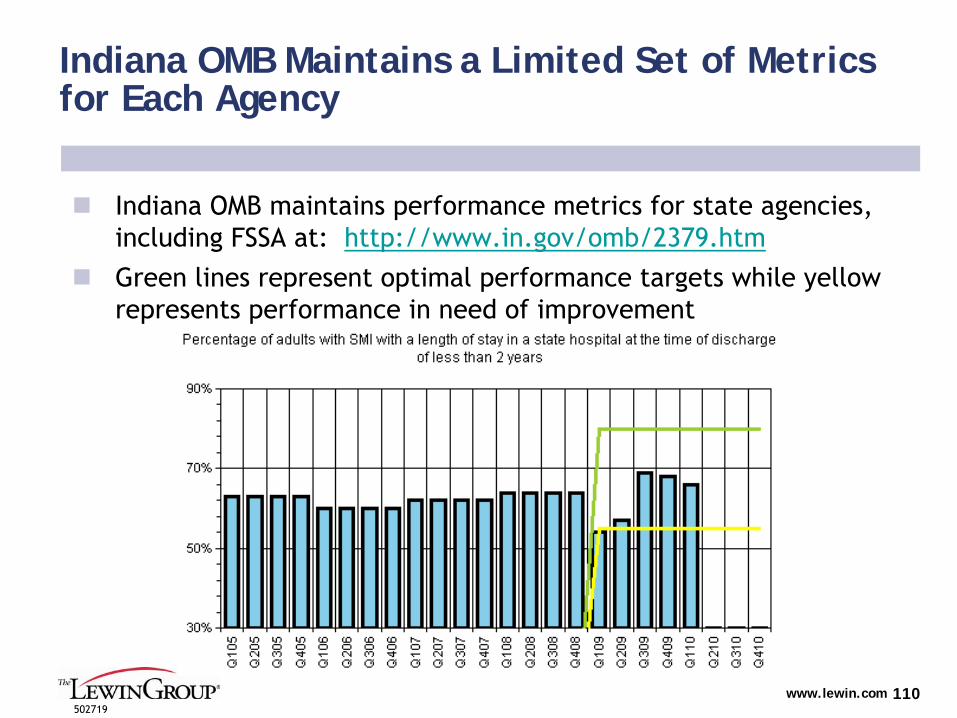
www.lewin.com502719
110
Indiana OMB Maintains a Limited Set of Metrics for Each Agency
Indiana OMB maintains performance metrics for state agencies, including FSSA at: http://www.in.gov/omb/2379.htm
Green lines represent optimal performance targets while yellow represents performance in need of improvement
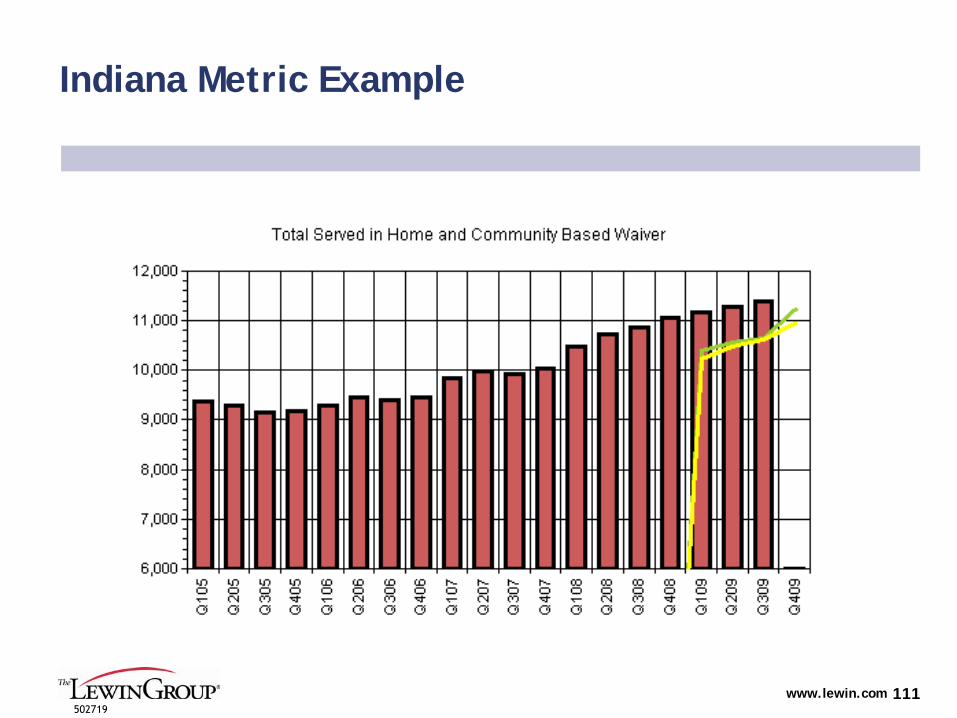
www.lewin.com502719
111
Indiana Metric Example
www.lewin.com502719
112
Appendix C – State Care Management Programs
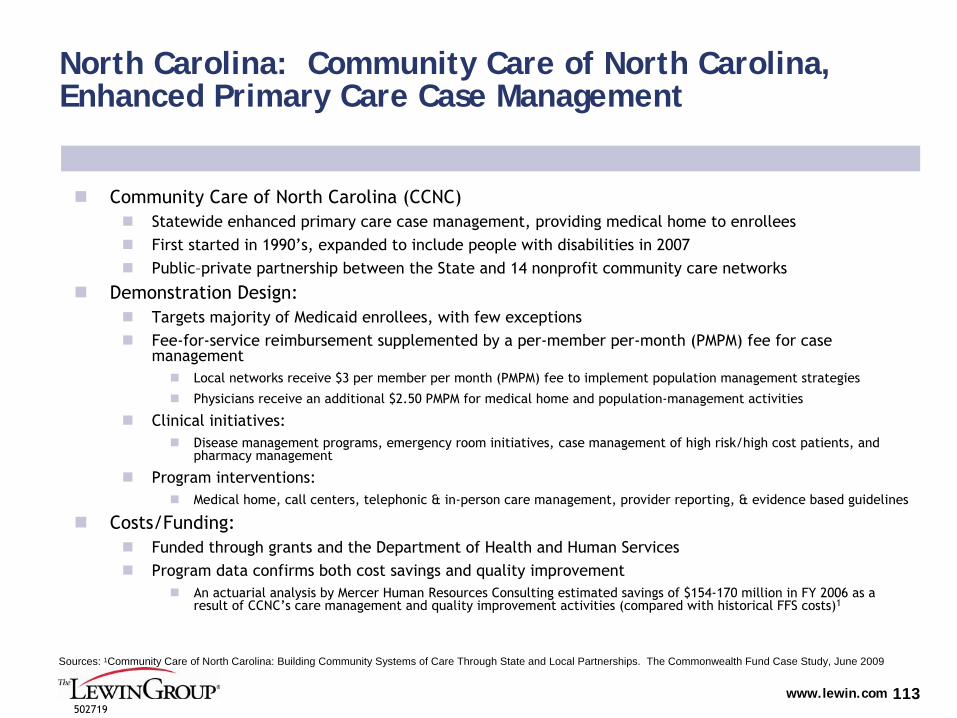
www.lewin.com502719
113
North Carolina: Community Care of North Carolina, Enhanced Primary Care Case Management
Community Care of North Carolina (CCNC)
Statewide enhanced primary care case management, providing medical home to enrollees
First started in 1990’s, expanded to include people with disabilities in 2007
Public–private partnership between the State and 14 nonprofit community
care networks
Demonstration Design:
Targets majority of Medicaid enrollees, with few exceptions
Fee-for-service reimbursement supplemented by a per-member per-month (PMPM) fee for case management
Local networks receive $3 per member per month (PMPM) fee to implement population management strategies
Physicians receive an additional $2.50 PMPM for medical home and
population-management activities
Clinical initiatives:
Disease management programs, emergency room initiatives, case management of high risk/high cost patients, and pharmacy management
Program interventions:
Medical home, call centers, telephonic & in-person care management, provider reporting, & evidence based guidelines
Costs/Funding:
Funded through grants and the Department of Health and Human Services
Program data confirms both cost savings and quality improvement
An actuarial analysis by Mercer Human Resources Consulting estimated savings of $154-170 million in FY 2006 as a result of CCNC’s
care management and quality improvement activities (compared with historical FFS costs)1
Sources: 1Community Care of North Carolina: Building Community Systems of Care Through State and Local Partnerships. The Commonwealth Fund Case Study, June 2009
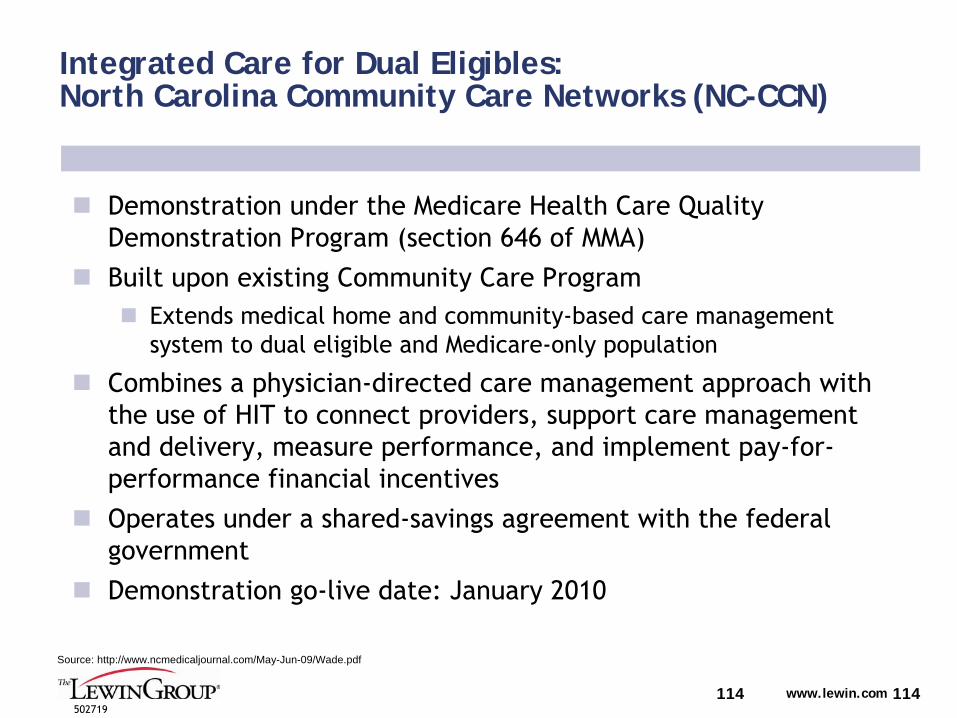
www.lewin.com502719
114
Integrated Care for Dual Eligibles: North Carolina Community Care Networks (NC-CCN)
Demonstration under the Medicare Health Care Quality Demonstration Program (section 646 of MMA)
Built upon existing Community Care Program
Extends medical home and community-based care management system to dual eligible and Medicare-only population
Combines a physician-directed care management approach with the use of HIT to connect providers, support care management and delivery, measure performance, and implement pay-for-
performance financial incentives
Operates under a shared-savings agreement with the federal government
Demonstration go-live date: January 2010
114
Source: http://www.ncmedicaljournal.com/May-Jun-09/Wade.pdf
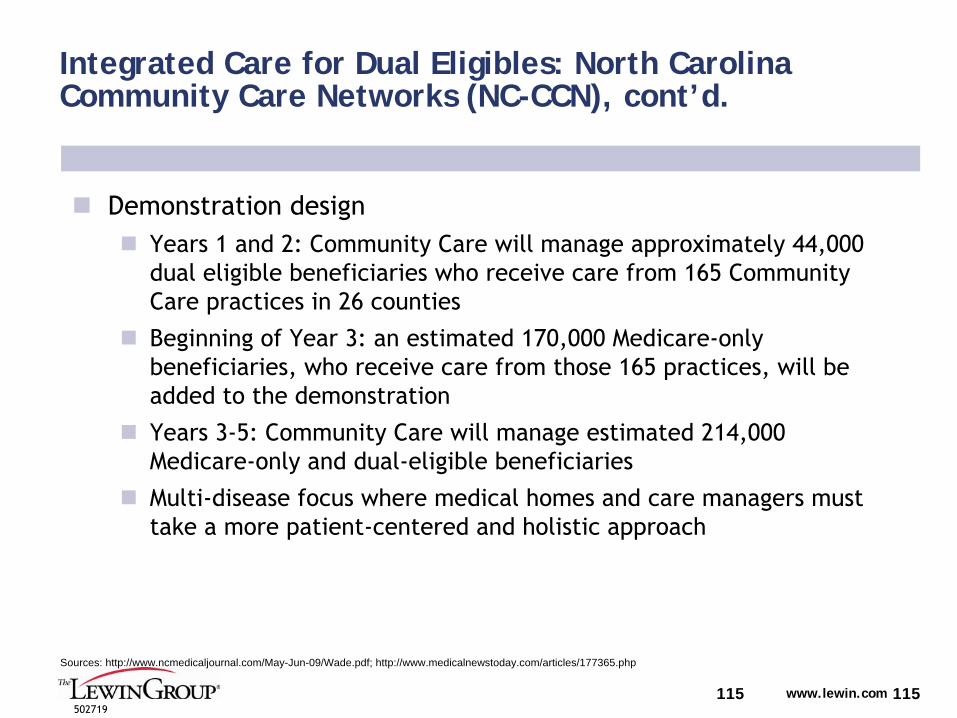
www.lewin.com502719
115
Integrated Care for Dual Eligibles: North Carolina Community Care Networks (NC-CCN), cont’d.
Demonstration design
Years 1 and 2: Community Care will manage approximately 44,000 dual eligible beneficiaries who receive care from 165 Community Care practices in 26 counties
Beginning of Year 3: an estimated 170,000 Medicare-only beneficiaries, who receive care from those 165 practices, will be added to the demonstration
Years 3-5: Community Care will manage estimated 214,000 Medicare-only and dual-eligible beneficiaries
Multi-disease focus where medical homes and care managers must take a more patient-centered and holistic approach
115
Sources: http://www.ncmedicaljournal.com/May-Jun-09/Wade.pdf; http://www.medicalnewstoday.com/articles/177365.php
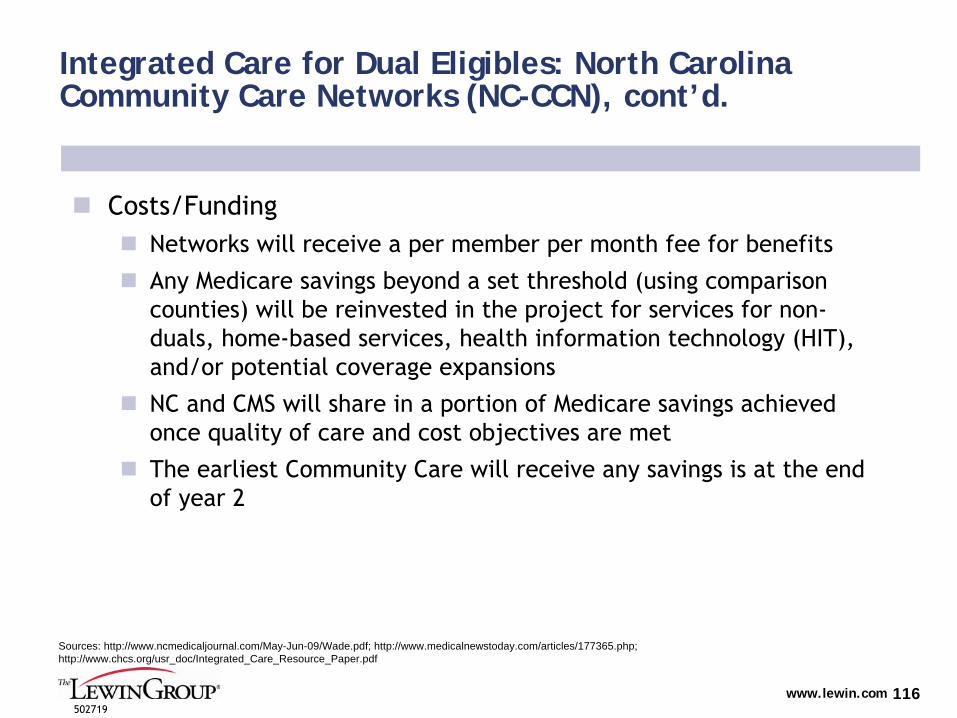
www.lewin.com502719
116
Integrated Care for Dual Eligibles: North Carolina Community Care Networks (NC-CCN), cont’d.
Costs/Funding
Networks will receive a per member per month fee for benefits
Any Medicare savings beyond a set threshold (using comparison counties) will be reinvested in the project for services for non-
duals, home-based services, health information technology (HIT), and/or potential coverage expansions
NC and CMS will share in a portion of Medicare savings achieved once quality of care and cost objectives are met
The earliest Community Care will receive any savings is at the end of year 2
Sources: http://www.ncmedicaljournal.com/May-Jun-09/Wade.pdf; http://www.medicalnewstoday.com/articles/177365.php; http://www.chcs.org/usr_doc/Integrated_Care_Resource_Paper.pdf
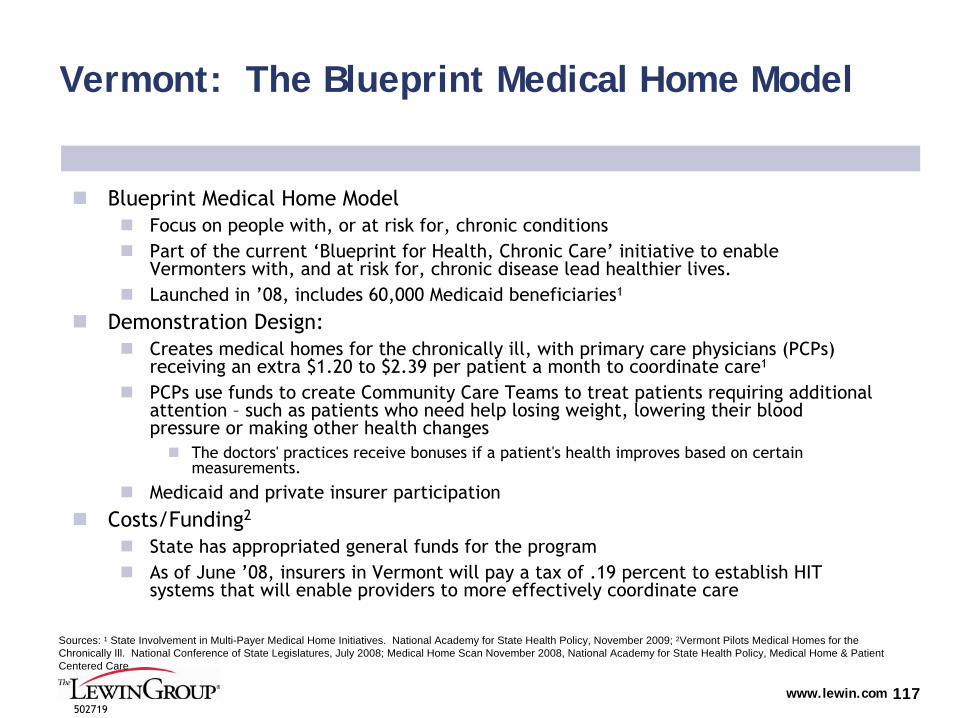
www.lewin.com502719
117
Vermont: The Blueprint Medical Home Model
Blueprint Medical Home Model
Focus on people with, or at risk for, chronic conditions
Part of the current ‘Blueprint for Health, Chronic Care’
initiative to enable Vermonters with, and at risk for, chronic disease lead healthier
lives.
Launched in ’08, includes 60,000 Medicaid beneficiaries1
Demonstration Design:
Creates medical homes for the chronically ill, with primary care
physicians (PCPs) receiving an extra $1.20 to $2.39 per patient a month to coordinate care1
PCPs use funds to create Community Care Teams to treat patients requiring additional attention –
such as patients who need help losing weight, lowering their blood pressure or making other health changes
The doctors' practices receive bonuses if a patient's health improves based on certain measurements.
Medicaid and private insurer participation
Costs/Funding2
State has appropriated general funds for the program
As of June ’08, insurers in Vermont will pay a tax of .19 percent to establish HIT systems that will enable providers to more effectively coordinate care
Sources: 1 State Involvement in Multi-Payer Medical Home Initiatives. National Academy for State Health Policy, November 2009; 2Vermont Pilots Medical Homes for the Chronically Ill. National Conference of State Legislatures, July 2008; Medical Home Scan November 2008, National Academy for State Health Policy, Medical Home & Patient Centered Care
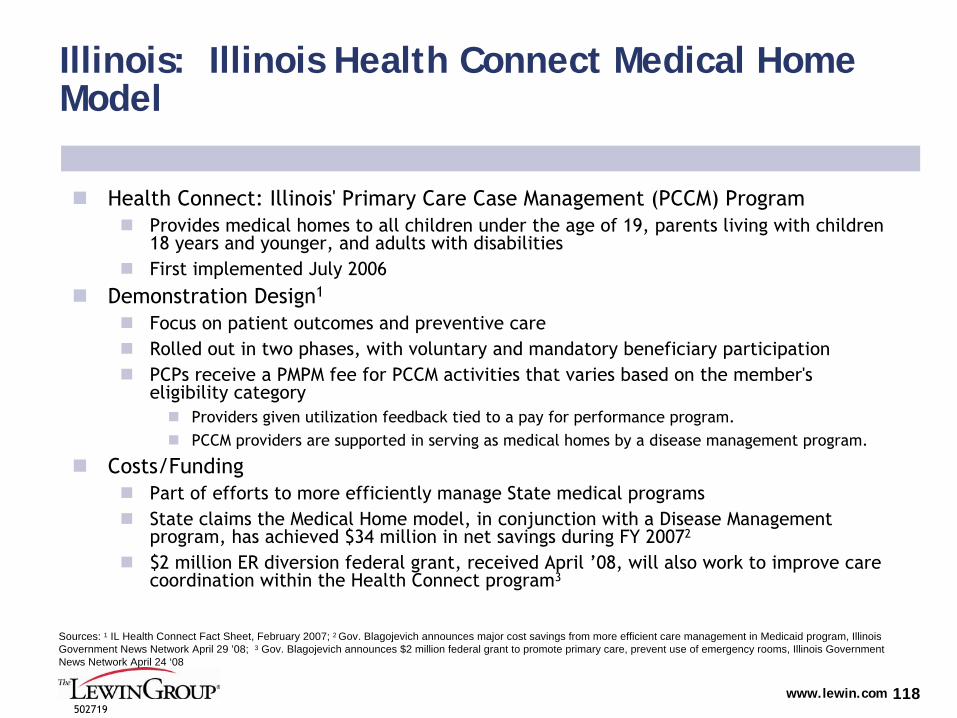
www.lewin.com502719
118
Illinois: Illinois Health Connect Medical Home Model
Health Connect: Illinois' Primary Care Case Management (PCCM) Program
Provides medical homes to
all children under the age of 19, parents living with children 18 years and younger, and adults with disabilities
First implemented July 2006
Demonstration Design1
Focus on patient outcomes and preventive care
Rolled out in two phases, with voluntary and mandatory beneficiary participation
PCPs receive a PMPM fee for PCCM activities that varies based on
the member's eligibility category
Providers given utilization feedback tied to a pay for performance program.
PCCM providers are supported in serving as medical homes by a disease management program.
Costs/Funding
Part of efforts to more efficiently manage State medical programs
State claims the Medical Home model, in conjunction with a Disease Management program, has achieved $34 million in net savings during FY 20072
$2 million ER diversion federal grant, received April ’08, will also work to improve care coordination within the Health Connect program3
Sources: 1 IL Health Connect Fact Sheet, February 2007; 2 Gov. Blagojevich announces major cost savings from more efficient care management in Medicaid program, Illinois Government News Network April 29 ’08; 3 Gov. Blagojevich announces $2 million federal grant to promote primary care, prevent use of emergency rooms, Illinois Government News Network April 24 ‘08

www.lewin.com502719
119
Oklahoma: SoonerCare Choice Primary Care Case Management Program
SoonerCare
Choice primary care case management (PCCM) program:
Implemented January 2009
Stemmed from Medical Advisory Task force recommendations in February 20071
65 percent of the State's Medicaid beneficiaries are enrolled2
Demonstration Design
Patterned after the North Carolina and Alabama medical home model
New reimbursement methodology based on:
Monthly care coordination payments
Visit based FFS component
Performance based component
Additional payments also made to provider networks
Three tiers of medical homes: Entry, Advanced, and Optimal levels (with Optimal being the most care intensive)
Care coordination payments vary depending on eligibility category and tier of medical home
Costs/Funding
No new funding source
Sources: 1 An Improved Medical Home for Every SoonerCare Choice Member, Oklahoma Healthcare Authority, February 2010 2 SoonerCare 1115 Waiver Evaluation: Final Report; Mathematica Policy Research January 2009
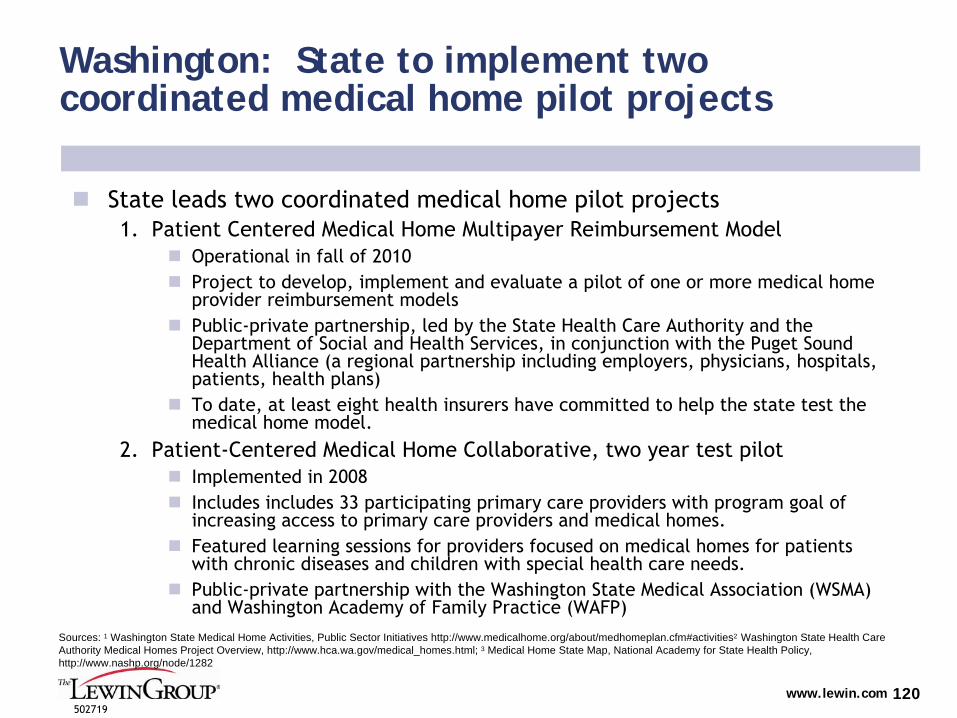
www.lewin.com502719
120
Washington: State to implement two coordinated medical home pilot projects
State leads two coordinated medical home pilot projects1. Patient Centered Medical Home Multipayer Reimbursement Model
Operational in fall of 2010
Project to develop, implement and evaluate a pilot of one or more medical home provider reimbursement models
Public-private partnership, led by the State Health Care Authority and the Department of Social and Health Services, in conjunction with the Puget Sound Health Alliance (a regional partnership including employers, physicians, hospitals, patients, health plans)
To date, at least eight health insurers have committed to help the state test the medical home model.
2. Patient-Centered Medical Home Collaborative, two year test pilot
Implemented in 2008
Includes includes 33 participating primary care providers with program goal of increasing access to primary care providers and medical homes.
Featured learning sessions for providers focused on medical homes for patients with chronic diseases and children with special health care needs.
Public-private partnership with the Washington State Medical Association (WSMA) and Washington Academy of Family Practice (WAFP)
Sources: 1 Washington State Medical Home Activities, Public Sector Initiatives http://www.medicalhome.org/about/medhomeplan.cfm#activities2 Washington State Health Care Authority Medical Homes Project Overview, http://www.hca.wa.gov/medical_homes.html; 3 Medical Home State Map, National Academy for State Health Policy, http://www.nashp.org/node/1282
www.lewin.com502719
121
Appendix D – Capitated Programs for Duals
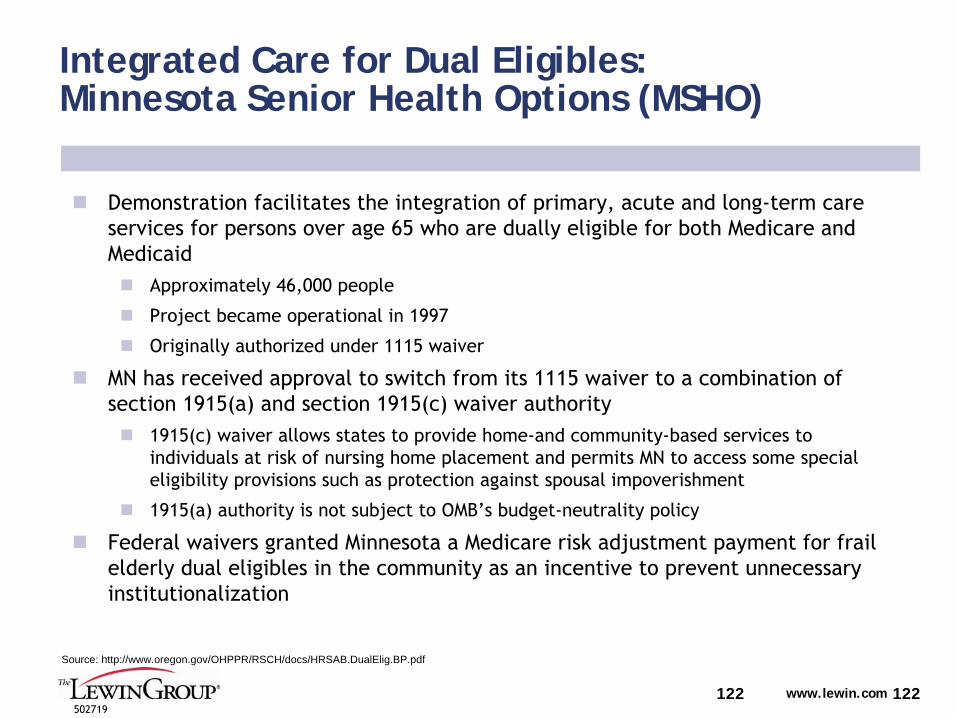
www.lewin.com502719
122
Integrated Care for Dual Eligibles: Minnesota Senior Health Options (MSHO)
Demonstration facilitates the integration of primary, acute and long-term care services for persons over age 65 who are dually eligible for both Medicare and Medicaid
Approximately 46,000 people
Project became operational in 1997
Originally authorized under 1115 waiver
MN has received approval to switch from its 1115 waiver to a combination of section 1915(a) and section 1915(c) waiver authority
1915(c) waiver allows states to provide home-and community-based services to individuals at risk of nursing home placement and permits MN to access some special eligibility provisions such as protection against spousal impoverishment
1915(a) authority is not subject to OMB’s budget-neutrality policy
Federal waivers granted Minnesota a Medicare risk adjustment payment for frail elderly dual eligibles in the community as an incentive to prevent unnecessary institutionalization
122
Source: http://www.oregon.gov/OHPPR/RSCH/docs/HRSAB.DualElig.BP.pdf
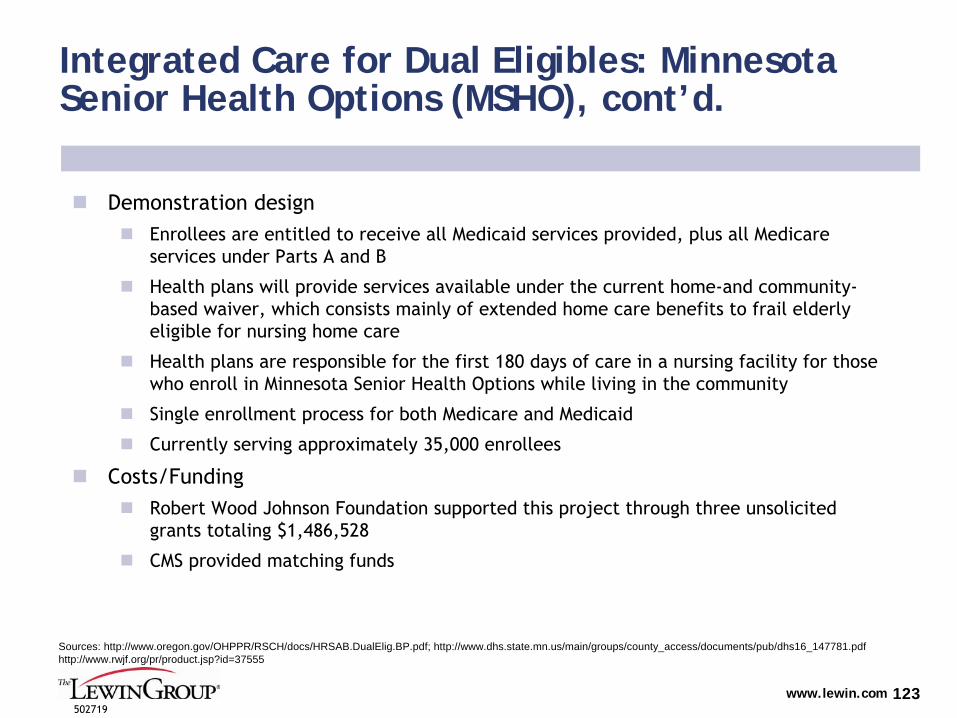
www.lewin.com502719
123
Integrated Care for Dual Eligibles: Minnesota Senior Health Options (MSHO), cont’d.
Demonstration design
Enrollees are entitled to receive all Medicaid services provided, plus all Medicare services under Parts A and B
Health plans will provide services available under the current home-and community-
based waiver, which consists mainly of extended home care benefits to frail elderly eligible for nursing home care
Health plans are responsible for the first 180 days of care in a
nursing facility for those who enroll in Minnesota Senior Health Options while living in the community
Single enrollment process for both Medicare and Medicaid
Currently serving approximately 35,000 enrollees
Costs/Funding
Robert Wood Johnson Foundation supported this project through three unsolicited grants totaling $1,486,528
CMS provided matching funds
Sources: http://www.oregon.gov/OHPPR/RSCH/docs/HRSAB.DualElig.BP.pdf; http://www.dhs.state.mn.us/main/groups/county_access/documents/pub/dhs16_147781.pdf http://www.rwjf.org/pr/product.jsp?id=37555
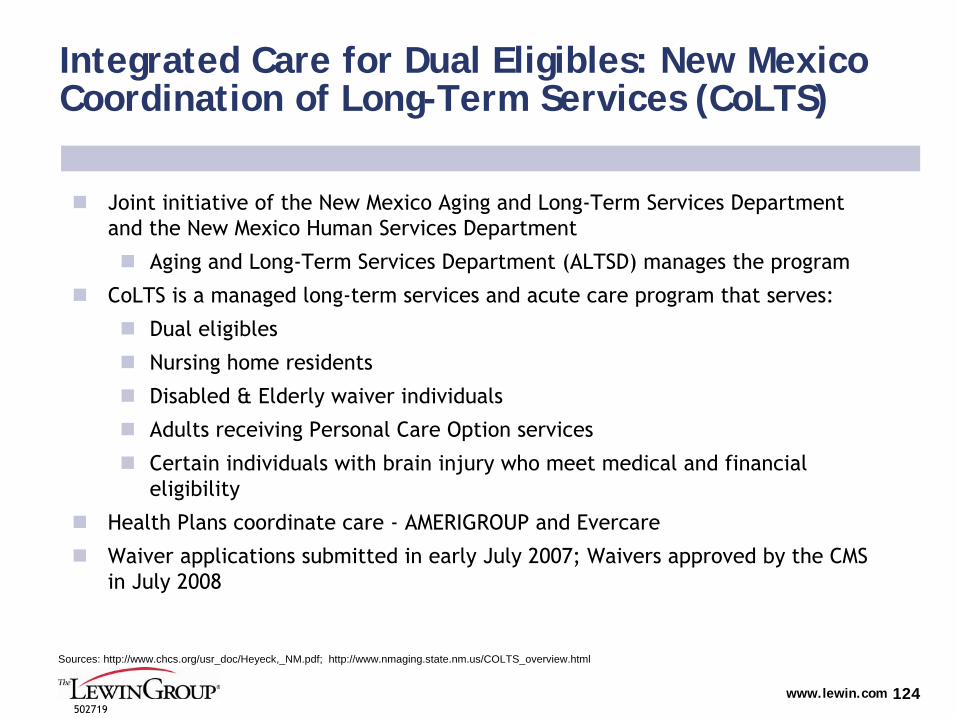
www.lewin.com502719
124
Integrated Care for Dual Eligibles: New Mexico Coordination of Long-Term Services (CoLTS)
Joint initiative of the New Mexico Aging and Long-Term Services Department and the New Mexico Human Services Department
Aging and Long-Term Services Department (ALTSD) manages the program
CoLTS
is a managed long-term services and acute care program that serves:
Dual eligibles
Nursing home residents
Disabled & Elderly waiver individuals
Adults receiving Personal Care Option services
Certain individuals with brain injury who meet medical and financial eligibility
Health Plans coordinate care -
AMERIGROUP and Evercare
Waiver applications submitted in early July 2007; Waivers approved by the CMS in July 2008
Sources: http://www.chcs.org/usr_doc/Heyeck,_NM.pdf; http://www.nmaging.state.nm.us/COLTS_overview.html

www.lewin.com502719
125
Integrated Care for Dual Eligibles: New Mexico Coordination of Long-Term Services (CoLTS), cont’d.
Demonstration design
Estimated number of eligible individuals: 38,000
Covered services:
Nursing facility services, primary and acute care, dental and vision care, transportation, service coordination, adult day health, respite, assisted living, community transition services, relocation specialists, environmental modifications, private duty nursing for adults, skilled maintenance therapy
Risk-bearing contracts to provide Medicaid benefits
Statewide provider networks capable of providing all covered services
Costs/Funding
FY09 CoLTS
MCO Contracts -
$390 million (phase-in year)
MCO administration fee is limited -
5 –
7% depending on cohort
Average per member per month (pmpm) capitation rate = $1,530.00
Sources: http://www.chcs.org/usr_doc/Heyeck,_NM.pdf; http://www.nmaging.state.nm.us/COLTS_overview.html
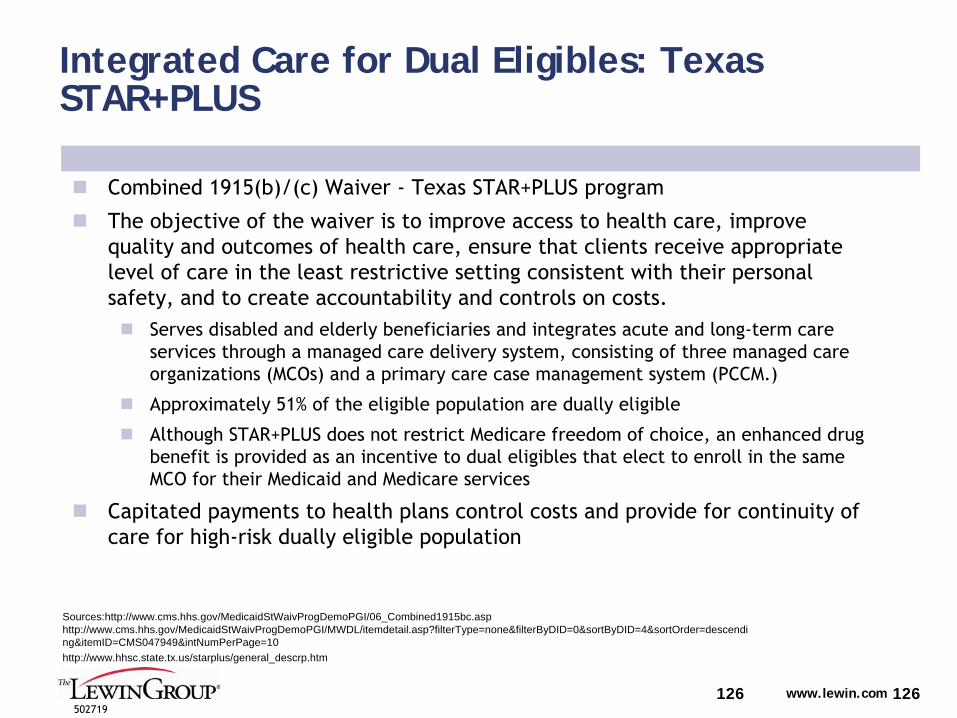
www.lewin.com502719
126
Integrated Care for Dual Eligibles: Texas STAR+PLUS
Combined 1915(b)/(c) Waiver -
Texas STAR+PLUS program
The objective of the waiver is to improve access to health care,
improve quality and outcomes of health care, ensure that clients receive
appropriate level of care in the least restrictive setting consistent with their personal safety, and to create accountability and controls on costs.
Serves disabled and elderly beneficiaries and integrates acute and long-term care services through a managed care delivery system, consisting of three managed care organizations (MCOs) and a primary care case management system (PCCM.)
Approximately 51% of the eligible population are dually eligible
Although STAR+PLUS does not restrict Medicare freedom of choice,
an enhanced drug benefit is provided as an incentive to dual eligibles that elect
to enroll in the same MCO for their Medicaid and Medicare services
Capitated payments to health plans control costs and provide for
continuity of care for high-risk dually eligible population
126
Sources:http://www.cms.hhs.gov/MedicaidStWaivProgDemoPGI/06_Combined1915bc.asp http://www.cms.hhs.gov/MedicaidStWaivProgDemoPGI/MWDL/itemdetail.asp?filterType=none&filterByDID=0&sortByDID=4&sortOrder=descendi ng&itemID=CMS047949&intNumPerPage=10http://www.hhsc.state.tx.us/starplus/general_descrp.htm

www.lewin.com502719
127
Appendix E – 1115 Waiver Examples
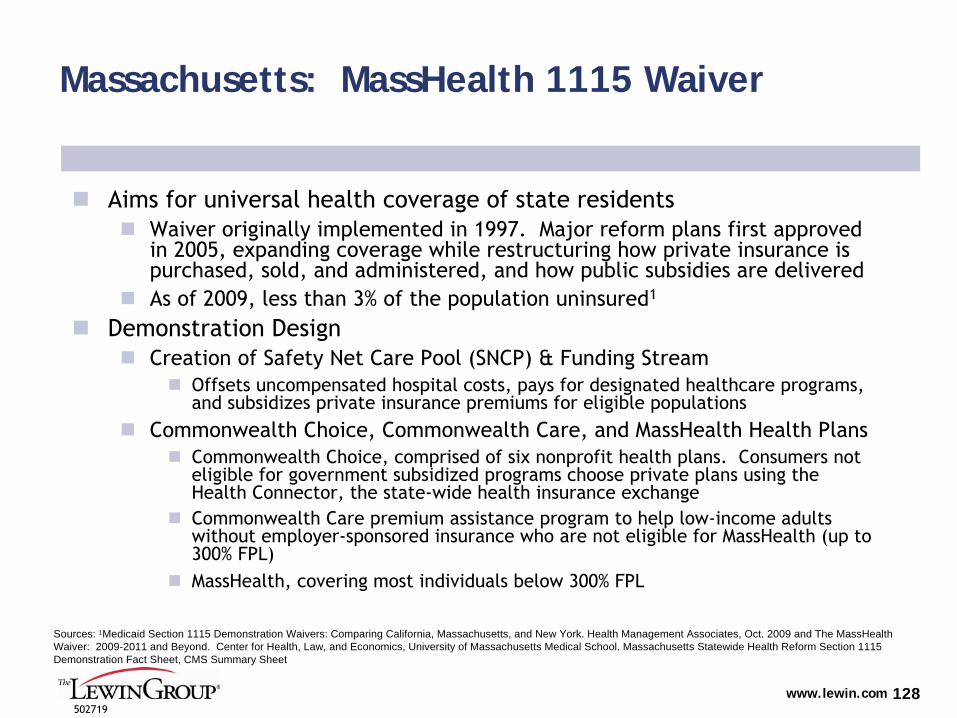
www.lewin.com502719
128
Massachusetts: MassHealth 1115 Waiver
Aims for universal health coverage of state residents
Waiver originally implemented in 1997. Major reform plans first
approved in 2005, expanding coverage while restructuring how private insurance is purchased, sold, and administered, and how public subsidies are delivered
As of 2009, less than 3% of the population uninsured1
Demonstration Design
Creation of Safety Net Care Pool (SNCP) & Funding Stream
Offsets uncompensated hospital costs, pays for designated healthcare programs, and subsidizes private insurance premiums for eligible populations
Commonwealth Choice, Commonwealth Care, and MassHealth
Health Plans
Commonwealth Choice, comprised of six nonprofit health plans. Consumers not eligible for government subsidized programs choose private plans
using the Health Connector, the state-wide health insurance exchange
Commonwealth Care premium assistance program to help low-income adults without employer-sponsored insurance who are not eligible for MassHealth
(up to 300% FPL)
MassHealth, covering most individuals below 300% FPL
Sources: 1Medicaid Section 1115 Demonstration Waivers: Comparing California, Massachusetts, and New York. Health Management Associates, Oct. 2009 and The MassHealth Waiver: 2009-2011 and Beyond. Center for Health, Law, and Economics, University of Massachusetts Medical School. Massachusetts Statewide Health Reform Section 1115 Demonstration Fact Sheet, CMS Summary Sheet
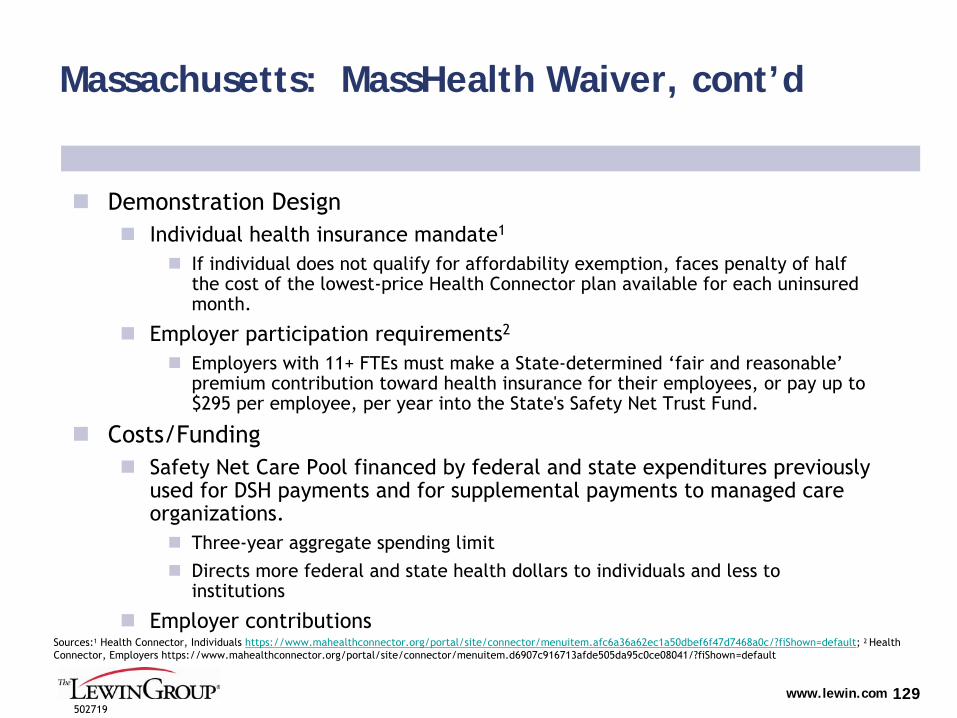
www.lewin.com502719
129
Massachusetts: MassHealth Waiver, cont’d
Demonstration Design
Individual health insurance mandate1
If individual does not qualify for affordability exemption, faces penalty of half the cost of the lowest-price Health Connector plan available for each uninsured month.
Employer participation requirements2
Employers with 11+ FTEs must make a State-determined ‘fair and reasonable’
premium contribution toward health insurance for their employees, or pay up to $295 per employee, per year into the State's Safety Net Trust Fund.
Costs/Funding
Safety Net Care Pool financed by federal and state expenditures previously used for DSH payments and for supplemental payments to managed care organizations.
Three-year aggregate spending limit
Directs more federal and state health dollars to individuals and
less to institutions
Employer contributionsSources:1
Health Connector, Individuals https://www.mahealthconnector.org/portal/site/connector/menuitem.afc6a36a62ec1a50dbef6f47d7468a0c/?fiShown=default; 2 Health Connector, Employers https://www.mahealthconnector.org/portal/site/connector/menuitem.d6907c916713afde505da95c0ce08041/?fiShown=default

www.lewin.com502719
130
Vermont: Global Commitment 1115 Waiver
Encompasses majority of State Medicaid programs
Demonstration approved by CMS and State legislature in ‘05, expires Sept. ’10
Demonstration Design:
Managed Care Delivery System
Agency of Human Services contracts with the Office of Vermont Health Access to serve as a publicly sponsored managed care organization, paying a lump sum premium per month
Premium assistance to purchase private coverage
Offered to State residents who have been without health insurance coverage for a year or more, have income at or below 200 percent of the FPL, and who do not have access to ‘cost effective’
employer-sponsored insurance as determined by the State.
Program Flexibility
Allows benefit change of up to 5% of comparison year expenditures for non-mandatory populations
Coverage expansions for specific populations
Costs/Funding
Aggregate Budget Neutrality Cap
Operates under five-year budget neutrality ceiling, with annual ceiling increases based on 9% inflation rate. Places State at risk for caseload, inflation, utilization
Sources:1 Vermont Global Commitment to Health Section 1115 Demonstration Fact Sheet, CMS Summary Sheet; State of Vermont, Agency of Human Services. Global Commitment to Health Revised Evaluation Plan, March 2008
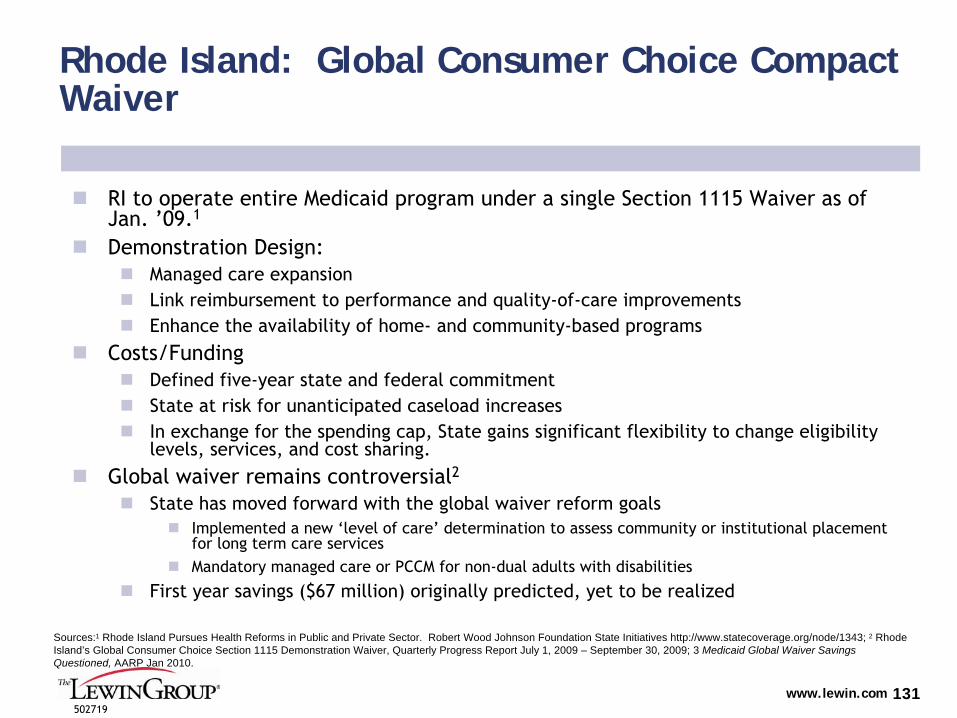
www.lewin.com502719
131
Rhode Island: Global Consumer Choice Compact Waiver
RI to operate entire Medicaid program under a single Section 1115 Waiver as of Jan. ’09.1
Demonstration Design:
Managed care expansion
Link reimbursement to performance and quality-of-care improvements
Enhance the availability of home-
and community-based programs
Costs/Funding
Defined five-year state and federal commitment
State at risk for unanticipated caseload increases
In exchange for the spending cap, State gains significant flexibility to change eligibility levels, services, and cost sharing.
Global waiver remains controversial2
State has moved forward with the global waiver reform goals
Implemented a new ‘level of care’
determination to assess community or institutional placement for long term care services
Mandatory managed care or PCCM for non-dual adults with disabilities
First year savings ($67 million) originally predicted, yet to be
realized
Sources:1 Rhode Island Pursues Health Reforms in Public and Private Sector. Robert Wood Johnson Foundation State Initiatives http://www.statecoverage.org/node/1343; 2 Rhode Island’s Global Consumer Choice Section 1115 Demonstration Waiver, Quarterly Progress Report July 1, 2009 – September 30, 2009; 3 Medicaid Global Waiver Savings Questioned, AARP Jan 2010.
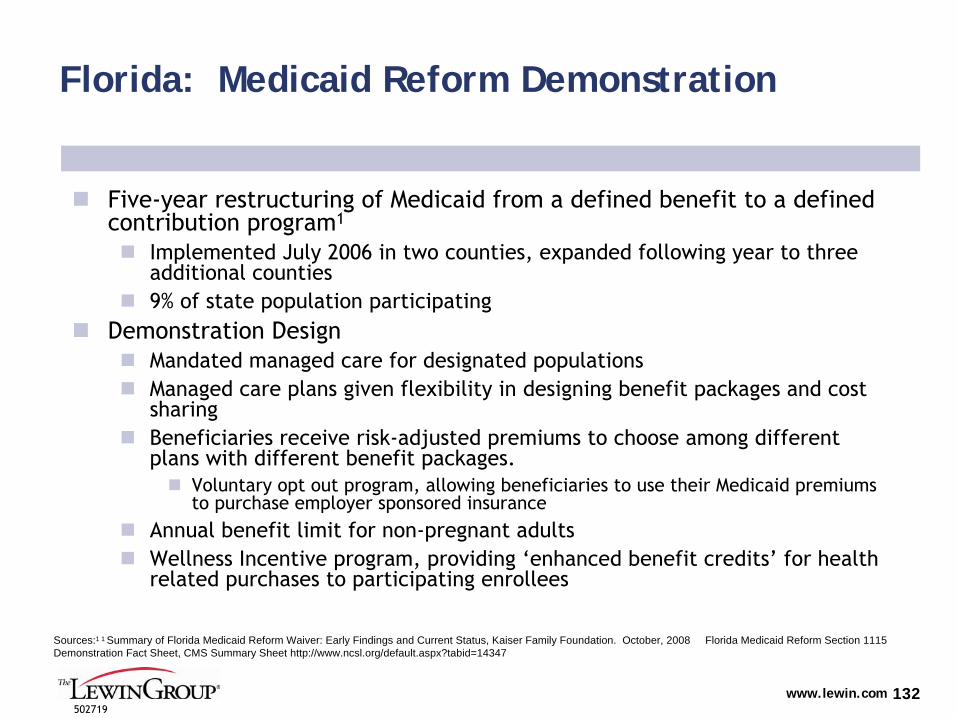
www.lewin.com502719
132
Florida: Medicaid Reform Demonstration
Five-year restructuring of Medicaid from a defined benefit to a defined contribution program1
Implemented July 2006 in two counties, expanded following year to three additional counties
9% of state population participating
Demonstration Design
Mandated managed care for designated populations
Managed care plans given flexibility in designing benefit packages and cost sharing
Beneficiaries receive risk-adjusted premiums to choose among different plans with different benefit packages.
Voluntary opt out program, allowing beneficiaries to use their Medicaid premiums to purchase employer sponsored insurance
Annual benefit limit for non-pregnant adults
Wellness Incentive program, providing ‘enhanced benefit credits’
for health related purchases to participating enrollees
Sources:1 1 Summary of Florida Medicaid Reform Waiver: Early Findings and Current Status, Kaiser Family Foundation. October, 2008 Florida Medicaid Reform Section 1115 Demonstration Fact Sheet, CMS Summary Sheet http://www.ncsl.org/default.aspx?tabid=14347
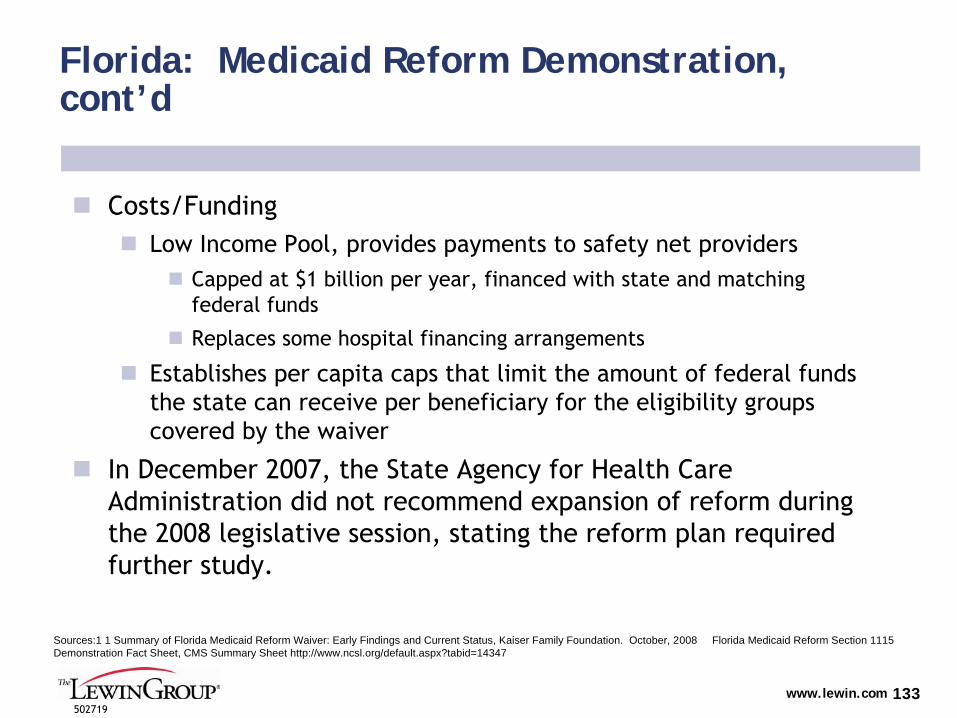
www.lewin.com502719
133
Florida: Medicaid Reform Demonstration, cont’d
Costs/Funding
Low Income Pool, provides payments to safety net providers
Capped at $1 billion per year, financed with state and matching federal funds
Replaces some hospital financing arrangements
Establishes per capita caps that limit the amount of federal funds the state can receive per beneficiary for the eligibility groups
covered by the waiver
In December 2007, the State Agency for Health Care Administration did not recommend expansion of reform during the 2008 legislative session, stating the reform plan required further study.
Sources:1 1 Summary of Florida Medicaid Reform Waiver: Early Findings and Current Status, Kaiser Family Foundation. October, 2008 Florida Medicaid Reform Section 1115 Demonstration Fact Sheet, CMS Summary Sheet http://www.ncsl.org/default.aspx?tabid=14347
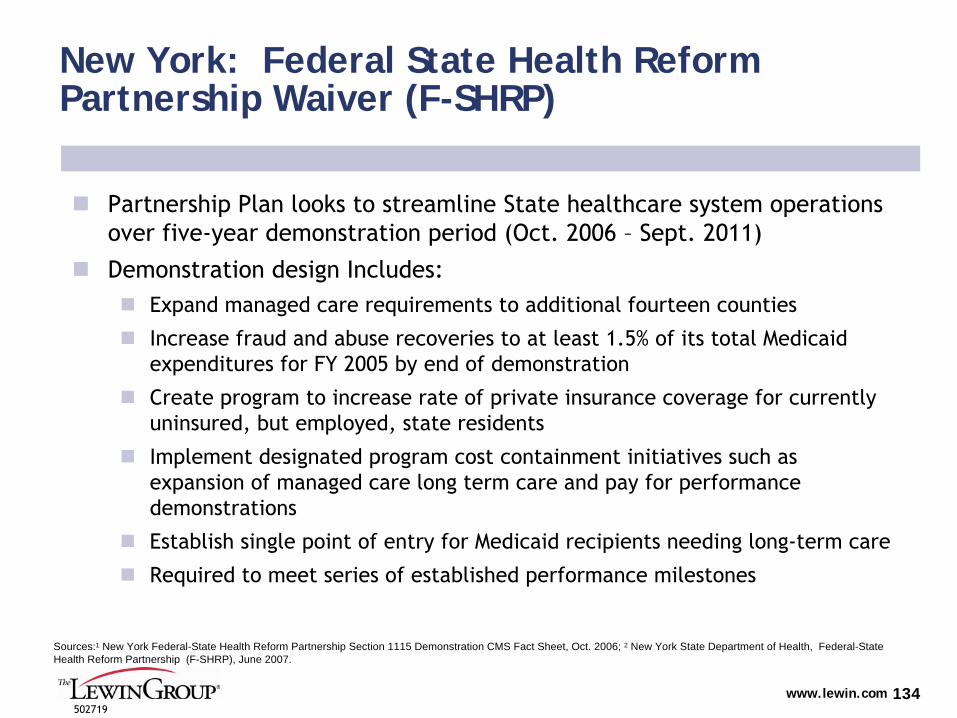
www.lewin.com502719
134
New York: Federal State Health Reform Partnership Waiver (F-SHRP)
Partnership Plan looks to streamline State healthcare system operations over five-year demonstration period (Oct. 2006 –
Sept. 2011)
Demonstration design Includes:
Expand managed care requirements to additional fourteen counties
Increase fraud and abuse recoveries to at least 1.5% of its total Medicaid expenditures for FY 2005 by end of demonstration
Create program to increase rate of private insurance coverage for currently uninsured, but employed, state residents
Implement designated program cost containment initiatives such as expansion of managed care long term care and pay for performance
demonstrations
Establish single point of entry for Medicaid recipients needing long-term care
Required to meet series of established performance milestones
Sources:1 New York Federal-State Health Reform Partnership Section 1115 Demonstration CMS Fact Sheet, Oct. 2006; 2 New York State Department of Health, Federal-State Health Reform Partnership (F-SHRP), June 2007.
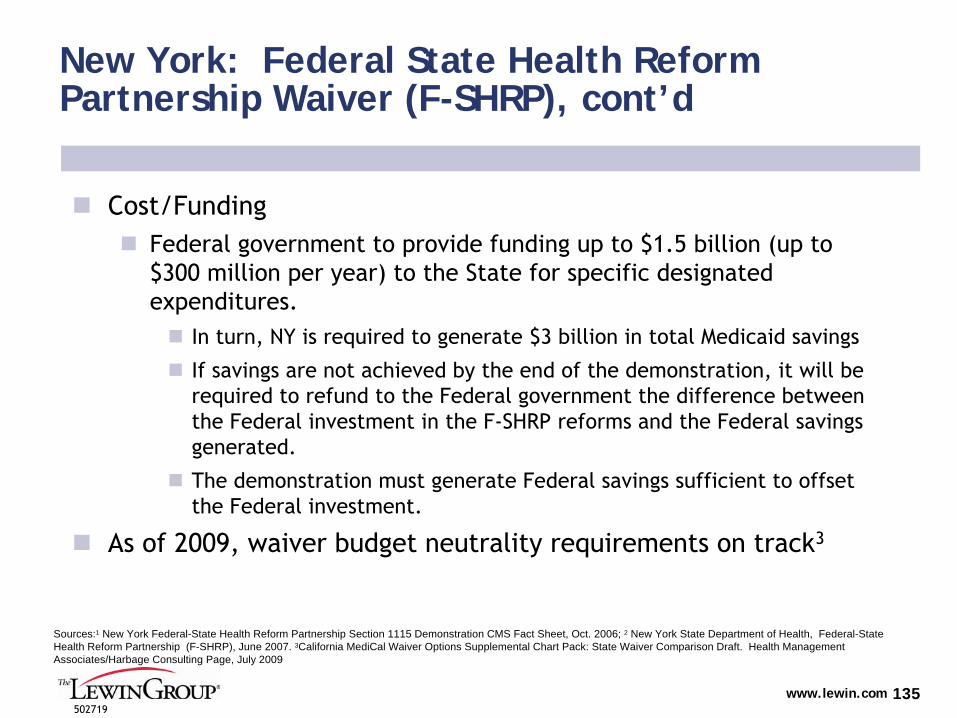
www.lewin.com502719
135
New York: Federal State Health Reform Partnership Waiver (F-SHRP), cont’d
Cost/Funding
Federal government to provide funding up to $1.5 billion (up to $300 million per year) to the State for specific designated expenditures.
In turn, NY is required to generate $3 billion in total Medicaid
savings
If savings are not achieved by the end of the demonstration, it will be required to refund to the Federal government the difference between the Federal investment in the F-SHRP reforms and the Federal savings generated.
The demonstration must generate Federal savings sufficient to offset the Federal investment.
As of 2009, waiver budget neutrality requirements on track3
Sources:1 New York Federal-State Health Reform Partnership Section 1115 Demonstration CMS Fact Sheet, Oct. 2006; 2 New York State Department of Health, Federal-State Health Reform Partnership (F-SHRP), June 2007. 3California MediCal Waiver Options Supplemental Chart Pack: State Waiver Comparison Draft. Health Management Associates/Harbage Consulting Page, July 2009
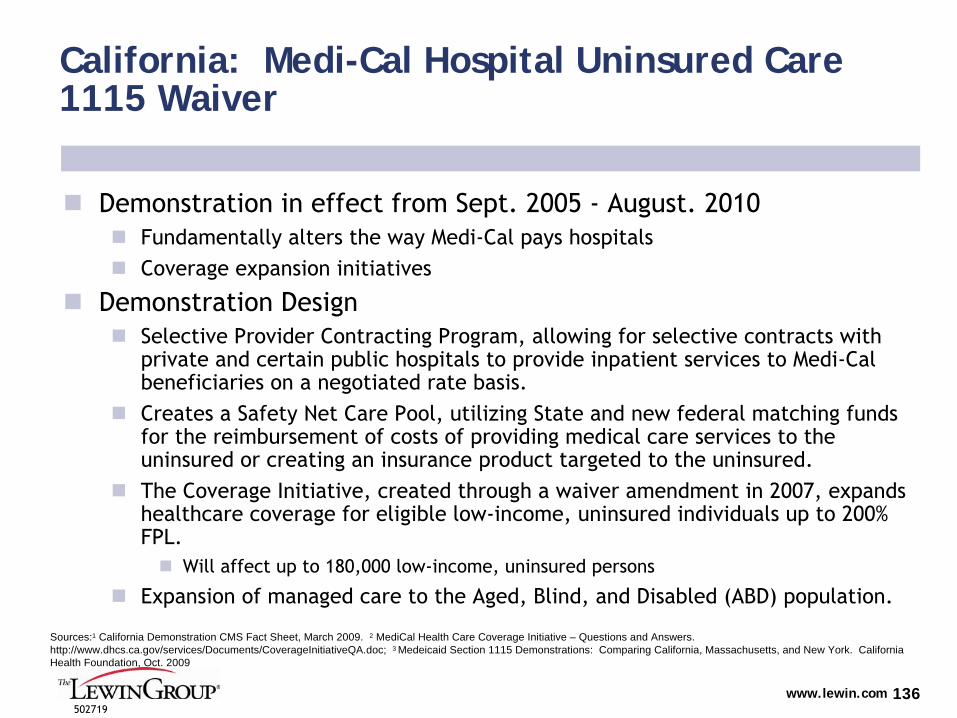
www.lewin.com502719
136
California: Medi-Cal Hospital Uninsured Care 1115 Waiver
Demonstration in effect from Sept. 2005 -
August. 2010
Fundamentally alters the way Medi-Cal pays hospitals
Coverage expansion initiatives
Demonstration Design
Selective Provider Contracting Program, allowing for selective contracts with private and certain public hospitals to provide inpatient services to Medi-Cal beneficiaries on a negotiated rate basis.
Creates a Safety Net Care Pool, utilizing State and new federal matching funds for the reimbursement of costs of providing medical care services to the uninsured or creating an insurance product targeted to the uninsured.
The Coverage Initiative, created through a waiver amendment in 2007, expands healthcare coverage for eligible low-income, uninsured individuals up to 200% FPL.
Will affect up to 180,000 low-income, uninsured persons
Expansion of managed care to the Aged, Blind, and Disabled (ABD)
population.
Sources:1 California Demonstration CMS Fact Sheet, March 2009. 2 MediCal Health Care Coverage Initiative – Questions and Answers. http://www.dhcs.ca.gov/services/Documents/CoverageInitiativeQA.doc; 3 Medeicaid Section 1115 Demonstrations: Comparing California, Massachusetts, and New York. California Health Foundation, Oct. 2009

www.lewin.com502719
137
California: Medi-Cal Hospital Uninsured Care 1115 Waiver, cont’d
Costs/Funding
With the Safety Net Care Pool, CA receives $766 million per year
for five years (total of $3.83 billion) in federal matching dollars for the costs of caring for uninsured, or for the creation of an insurance product targeted to the uninsured.
First two years of demonstration, $360 million in federal matching funds conditioned on mandated enrollment of managed care for the ABD population (CA failed to accomplish this on large scale and lost
funds)
Last three years of waiver $540 million must be used in support of the Coverage Initiative
State is not allowed to create new inpatient, outpatient, and physician services taxes as source of federal matching funds
Sources:1 California Demonstration CMS Fact Sheet, March 2009. 2 MediCal Health Care Coverage Initiative – Questions and Answers. http://www.dhcs.ca.gov/services/Documents/CoverageInitiativeQA.doc; 3 Medeicaid Section 1115 Demonstrations: Comparing California, Massachusetts, and New York. California Health Foundation, Oct. 2009