Embed Size (px)
Citation preview

Comparative Analysis of Comparative Analysis of Quality of Care and Quality of Care and
Access to Services in Access to Services in MO HealthNetMO HealthNet
MISSOURI DEPARTMENTMISSOURI DEPARTMENT
OF SOCIAL SERVICESOF SOCIAL SERVICES
MO HealthNet DIVISIONMO HealthNet DIVISION
October 27, 2009October 27, 2009
Presented By:

2
MO HealthNet GOALSMO HealthNet GOALS
The system must pay attention to the wellness of the individual, including health education.Participants must have access to chronic care management.MO HealthNet should provide services in the appropriate setting at the right cost.Care plans should emphasize the needs of the individual.Care should be based on evidence‐based guidelines to improve quality.Participants should be responsible for their own health.
3
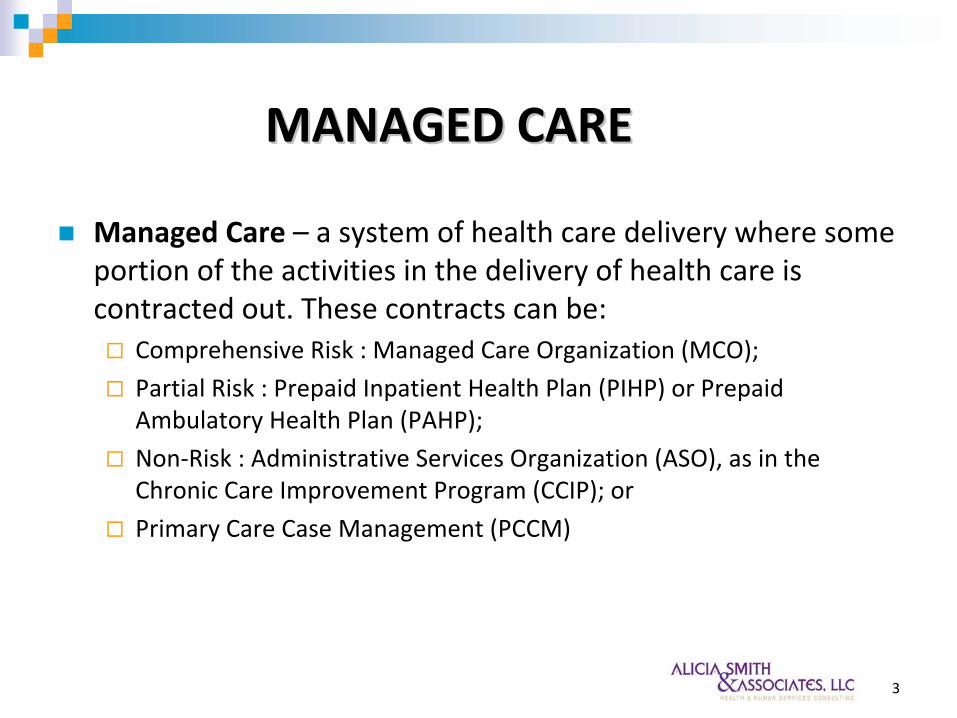
MANAGED CAREMANAGED CARE
Managed Care – a system of health care delivery where some portion of the activities in the delivery of health care is contracted out. These contracts can be:
Comprehensive Risk : Managed Care Organization (MCO);
Partial Risk : Prepaid Inpatient Health Plan (PIHP) or Prepaid Ambulatory Health Plan (PAHP);
Non‐Risk : Administrative Services Organization (ASO), as in the Chronic Care Improvement Program (CCIP); or
Primary Care Case Management (PCCM)

4
TOOLS TO MANAGE CARE WAIVERS/BBATOOLS TO MANAGE CARE WAIVERS/BBA
1915(b) – Medicaid waiver that allows the state to waive State Plan requirements for Freedom of Choice, Statewidedness, and Comparability.
1115 – A research and demonstration waiver that allows greater flexibility for the state to modify other requirements in the State Plan, including eligibility.
The Balanced Budget Act of 1997 allows states to have managed care under a state plan amendment.

5
NATIONAL TRENDSNATIONAL TRENDS
MEDICAID
MANAGED
% MANAGED
POPULATION
CARE
CAREYEAR2008 47,142,791 33,427,582 70.91%2007 45,962,271 29,463,098 64.10%2006 45,652,642 29,830,406 65.34%2005 45,392,325 28,575,585 62.95%2004 44,355,955 26,913,570 60.68%2003 42,740,719 25,262,873 59.11%2002 40,147,539 23,117,668 57.58%2001 36,562,567 20,773,813 56.82%2000 33,690,364 18,786,137 55.76%1999 31,940,188 17,756,603 55.59%

6
NATIONAL TRENDS (cont.)NATIONAL TRENDS (cont.)
All but two states (Alaska and Wyoming) have some form of managed care.
70% enrollment figure can be deceiving. Not all of those participants are enrolled in full‐risk managed care. Many states offer PCCM, ASO, or partial‐risk options.

7
FEEFEE‐‐FORFOR‐‐SERVICESERVICETraditional method of administering the Medicaid State Plan where the state staff of the Single State Agency is responsible for provider enrollment, determining the scope of coverage and the rates of reimbursement. States may contract out certain activities such as disease management or claims processing.
Even in instances when the state has contracted all or part of these duties under managed care, the ultimate authority for decisions and responsibility to the federal government still resides with the Single State Agency.

8
ADVANTAGES OF FEEADVANTAGES OF FEE‐‐FORFOR‐‐SERVICESERVICE
Open provider network for those providers who meet state standards.
Maximum state control over rates, services, medical necessity determinations.
Claims data is maintained within the state MMIS system.

9
ADVANTAGES OF MANAGED CAREADVANTAGES OF MANAGED CARE
Budget predictability.
Provider network is contractually obligated to meet state standards.
Quality reporting to the state is enhanced with supplemental data (chart reviews, client satisfaction surveys) that goes beyond administrative claims data.

10
MEDICAID IN MISSOURIMEDICAID IN MISSOURI
Single State Agency – the Department of Social Services
Medicaid Division – MO HealthNet (fee‐for‐service and managed care)

11
MANAGED CARE AND FEEMANAGED CARE AND FEE‐‐FORFOR‐‐SERVICE SERVICE REGIONSREGIONS
12
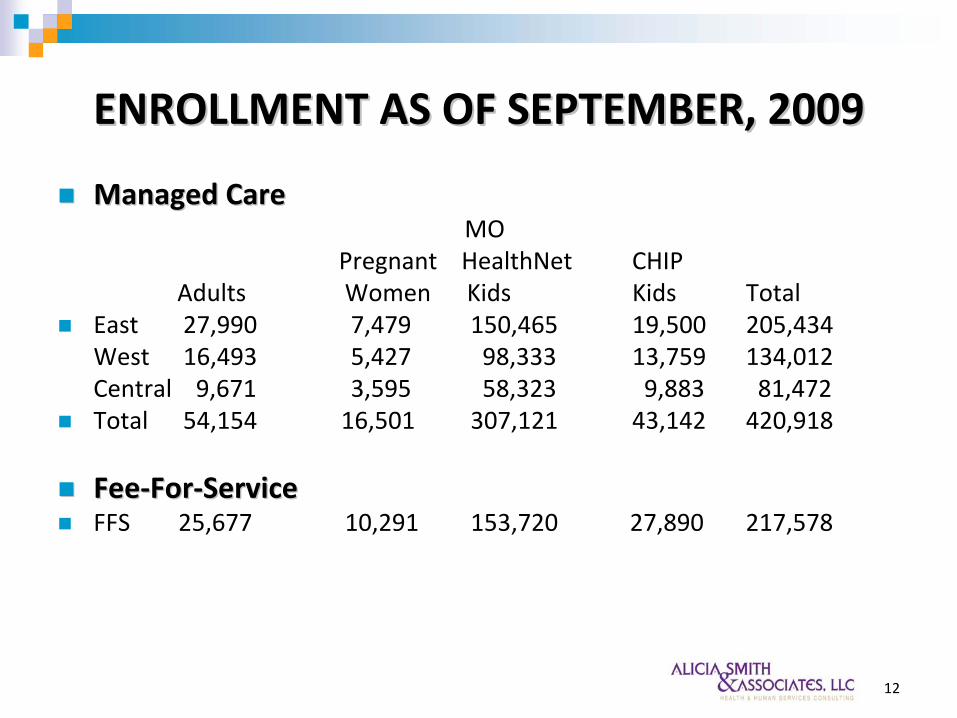
ENROLLMENT AS OF SEPTEMBER, 2009ENROLLMENT AS OF SEPTEMBER, 2009
Managed CareManaged CareMO
Pregnant HealthNet
CHIPAdults
Women Kids
Kids
TotalEast 27,990 7,479 150,465 19,500 205,434 West
16,493
5,427
98,333
13,759
134,012 Central 9,671
3,595
58,323
9,883
81,472Total 54,154 16,501 307,121 43,142 420,918
FeeFee‐‐ForFor‐‐ServiceServiceFFS 25,677 10,291 153,720 27,890 217,578

13
TIMELINETIMELINESeptember 1, 1995 – Missouri introduces MC+ in the Eastern Region.
March 1, 1996 ‐Missouri introduces MC+ in the Central Region.
November 8, 1997 ‐Missouri introduces MC+ in the Western Region.

14
MANAGED CARE QUALITY MANAGED CARE QUALITY MEASURESMEASURES
Performance measurement – HEDIS (Healthcare Effectiveness Data and Information Set)
EQRO (External Quality Review Organization)
Accreditation by NCQA (National Committee for Quality Assurance)
Provider Access Standards

15
VIEW FROM SURROUNDING STATESVIEW FROM SURROUNDING STATES

16
VIEW FROM SURROUNDING STATES VIEW FROM SURROUNDING STATES (cont.)(cont.)
Indiana ‐Moved from a mixed model of PCCM and at‐risk MCOs to statewide MCOs
Arkansas ‐Moved from Fee‐for‐Service to statewide PCCM
Oklahoma ‐ Moved from Fee‐for‐Service, to a mixed Model (MCOs and PCCM), to statewide PCCM

17
RESEARCH METHODOLOGYRESEARCH METHODOLOGY
HEDIS and HEDIS‐like measures for fee‐for‐service developed by MO HealthNet
Well‐Child Visits, first 15 months: 6+ visits
Well‐Child Visits 3rd through 6th Year
Childhood Immunizations
Timeliness of Prenatal Care
Postpartum Care
Cervical Cancer Screening
18
HEDIS vs. ADMINISTRATIVE DATAHEDIS vs. ADMINISTRATIVE DATA
Both Fee‐for‐Service and Managed Care report administrative data (paid claims, encounter data)
MCOs also report on HEDIS measures using supplemental data (i.e. sample chart reviews, surveys)

19
MCO HEDIS METHODS: ADMINISTRATIVE vs. HYBRIDMCO HEDIS METHODS: ADMINISTRATIVE vs. HYBRID
2007Method of Collecting HEDIS Data
012345678
Adol
esce
ntW
ell-C
are
Visi
ts (A
WC
)
Annu
al D
enta
lVi
sit (
ADV)
Chi
ldho
odIm
mun
izat
ion
Stat
us (C
IS)
Follo
w-u
pAf
ter
Hos
pita
lizat
ion
for M
enta
lIlln
ess
(FU
H)
Men
tal H
ealth
Utili
zatio
n(M
PT)
Use
of
Appr
opria
teM
edic
atio
nsfo
r Peo
ple
with
Ast
hma
Wel
l-Chi
ldVi
sits
3-6
Year
s of
Life
(W34
)
Measure
Cou
nt Hybrid (Administrative & Survey)
Administrative

20
MCO HEDIS METHODS: ADMINISTRATIVE vs. MCO HEDIS METHODS: ADMINISTRATIVE vs. HYBRID (cont.)HYBRID (cont.)
2008Method of Collecting HEDIS Data
0123456789
Ado
lesc
ent
Wel
l-Car
eV
isits
(AW
C)
Annu
al D
enta
lV
isit
(AD
V)
Chi
ldho
odIm
mun
izat
ion
Sta
tus
(CIS
)
Follo
w-u
p A
fter
Hos
pita
lizat
ion
for M
enta
lIll
ness
(FU
H)
Men
tal H
ealth
Util
izat
ion
(MPT
)
Use
of
App
ropr
iate
Med
icat
ions
for
Peo
ple
with
Asth
ma
(ASM
)
Wel
l-Chi
ldV
isits
3-6
Yea
rs o
f Life
(W34
)
Measure
Cou
nt Hybrid (Administrative & Survey)
Administrative

21
MCO HEDIS METHODS: ADMINISTRATIVE vs. MCO HEDIS METHODS: ADMINISTRATIVE vs. HYBRID (cont.)HYBRID (cont.)
2009Method of Collecting HEDIS Data
012345678
Ado
lesc
ent
Wel
l-Car
eV
isits
(AW
C)
Ann
ual D
enta
lVi
sit (
AD
V)
Chi
ldho
odIm
mun
izat
ion
Sta
tus
(CIS
)
Follo
w-u
p Af
ter
Hos
pita
lizat
ion
for M
enta
lIll
ness
(FU
H)
Men
tal H
ealth
Util
izat
ion
(MPT
)
Use
of
App
ropr
iate
Med
icat
ions
for
Peop
le w
ithA
sthm
a (A
SM
)
Wel
l-Chi
ldV
isits
3-6
Yea
rs o
f Life
(W34
)
Measure
Cou
nt
Hybrid (Administrative & Survey)
Administrative

22
HEDIS RESULTS: FFS vs. MANAGED CAREHEDIS RESULTS: FFS vs. MANAGED CARE

23
RESEARCH METHODOLOGYRESEARCH METHODOLOGY
Early and Periodic Screening, Diagnosis and Treatment program
Participation Rate (percentage of eligible children who received at least one well‐child screen)
Screening Rate (percentage of total expected screens that occurred)
Referred for Treatment

24
2007 EPSDT PARTICIPANT RATIO 2007 EPSDT PARTICIPANT RATIO COMPARISON COMPARISON ––
TOP TEN STATESTOP TEN STATES
25
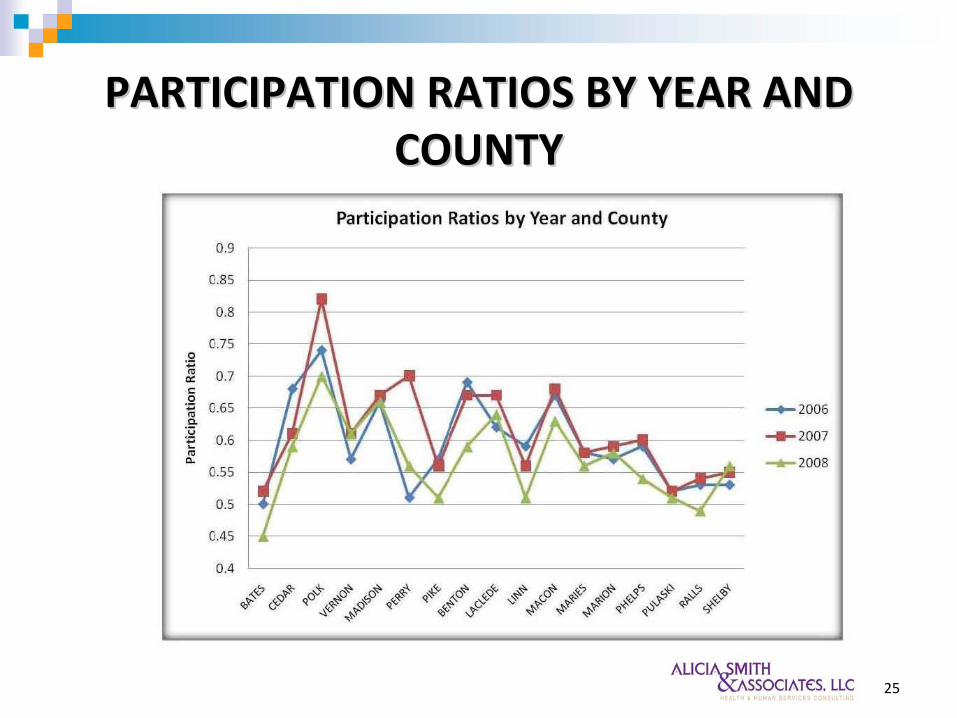
PARTICIPATION RATIOS BY YEAR AND PARTICIPATION RATIOS BY YEAR AND COUNTYCOUNTY

26
PARTICIPATION RATIOS BY YEAR AND PARTICIPATION RATIOS BY YEAR AND COUNTYCOUNTY

27
RATIO OF ELIGIBLES THAT WERE RATIO OF ELIGIBLES THAT WERE REFERRED FOR CORRECTIVE TREATMENTREFERRED FOR CORRECTIVE TREATMENT

28
RESEARCH METHODOLOGYRESEARCH METHODOLOGY
Birth trends and Outcomes
Data reported by Department of Insurance
1994‐2008Low Birth Weight (<2500grams)
Pre‐term Births (<32 weeks)
Inadequate prenatal care

29
BIRTH TRENDS: FFS vs. MANAGED CAREBIRTH TRENDS: FFS vs. MANAGED CARE

30
PROVIDERS TO PARTICIPANTS RATIOSPROVIDERS TO PARTICIPANTS RATIOS
Primary Care Providers (PCP) to Participants
Dentists to Participants
Mental Health Providers to Participants

31
FFS PROVIDER NETWORK ACCESSFFS PROVIDER NETWORK ACCESS

32
PCPs TO PARTICIPANTSPCPs TO PARTICIPANTS

33
DENTISTS TO PARTICIPANTSDENTISTS TO PARTICIPANTS

34
MH PROVIDERS TO PARTICIPANTSMH PROVIDERS TO PARTICIPANTS

35
MANAGED CARE SPECIFIC DATAMANAGED CARE SPECIFIC DATA
CAHPS (Community Assessment of Healthcare Providers and Systems)

36
CAHPS RESULTS 2006CAHPS RESULTS 2006‐‐20082008

37
CAHPS RESULTS 2006CAHPS RESULTS 2006‐‐2008 (cont.)2008 (cont.)

38
CAHPS RESULTS 2006CAHPS RESULTS 2006‐‐2008 (cont.)2008 (cont.)

39
CONCLUSIONS AND RECOMMENDATIONSCONCLUSIONS AND RECOMMENDATIONSWe did not observe any consistent difference in access to care or quality of care between fee‐for‐service and managed care. Managed care performed better on access and birth outcomes and on providing education to participants. Fee‐for‐Service performed better on Well‐Child Screenings for newborns and the early initiation of prenatal care.
However, managed care does provide the state with an accountable system, backed by improved reporting (HEDIS)
MO HealthNet should be applauded for their efforts to develop HEDIS‐like measures to provide a comparison between fee‐for‐service and managed care.
40
CONCLUSIONS AND RECOMMENDATIONS CONCLUSIONS AND RECOMMENDATIONS (cont.)(cont.)
MO HealthNet should consider eligibility and enrollment strategies to improve access for pregnant women to prenatal care
HEDIS results on immunization rates for children are significantly below the national average for both fee‐for‐service and managed care.
There was a slight difference in the percentage of children who received a well‐child screen who were referred on for corrective treatment between FFS and managed care.
MO HealthNet should consider additional measures in both FFS and managed care to audit provider networks.