Embed Size (px)
Citation preview
© Sam Ransbotham
Mobile Marketing: The Persuasive Impact of
Real-Time Reviews
Sam Ransbotham (Boston College)
Nick Lurie (University of Connecticut)
© Sam Ransbotham 2
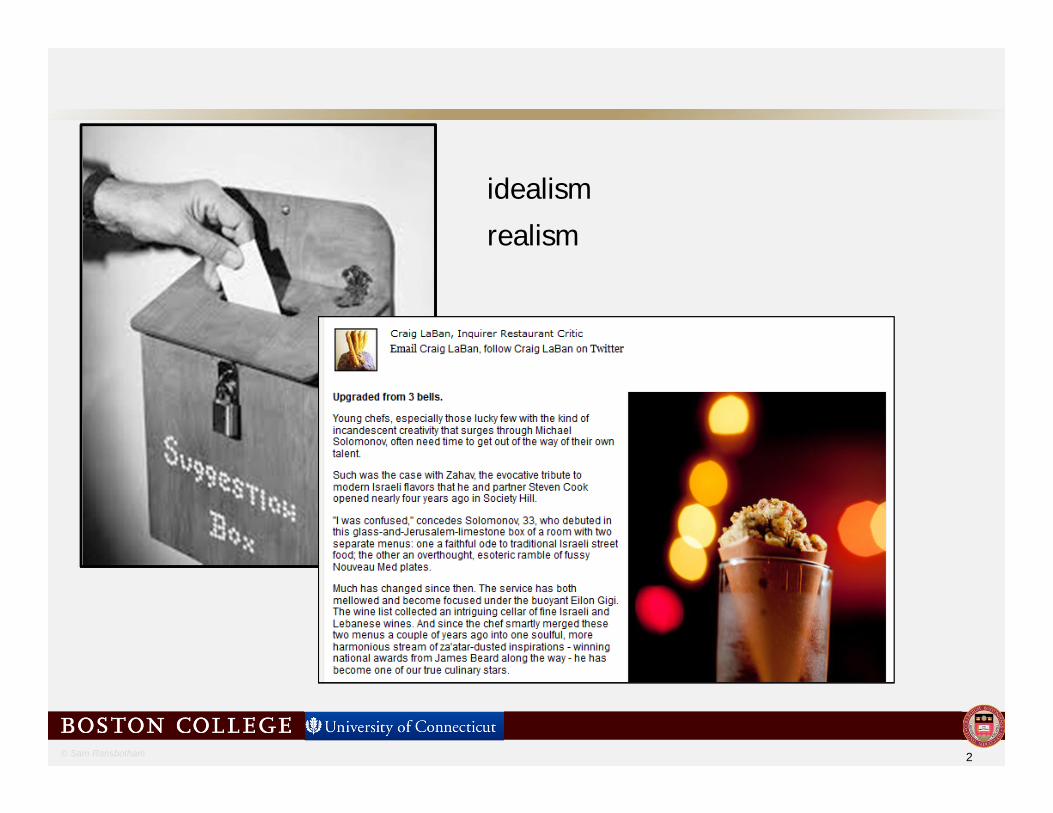
idealism
realism
© Sam Ransbotham
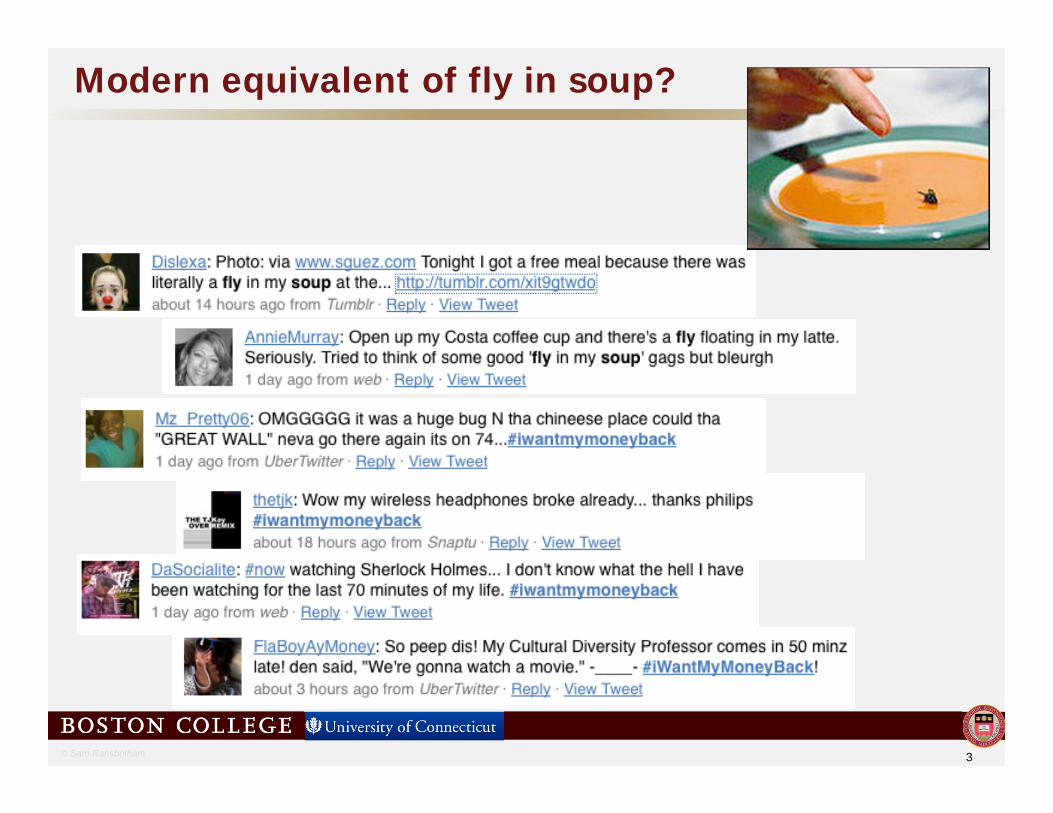
Modern equivalent of fly in soup?
3
© Sam Ransbotham
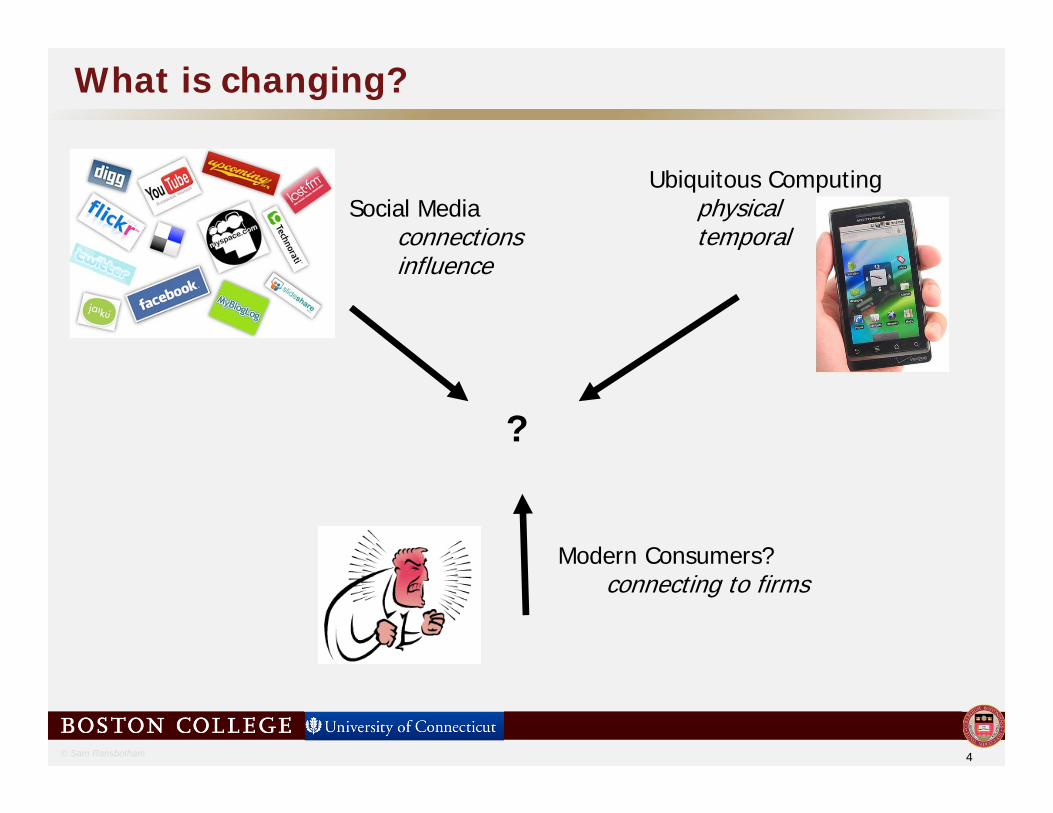
What is changing?
4
Ubiquitous Computingphysicaltemporal
Social Mediaconnectionsinfluence
Modern Consumers?connecting to firms
?

© Sam Ransbotham 5
Comparing reviews written using mobile devices with those written on traditional desktop computers…
How do they differ in content?
How do they differ in influence?
What mechanisms drive differences?
Mobile computing and user reviews
© Sam Ransbotham
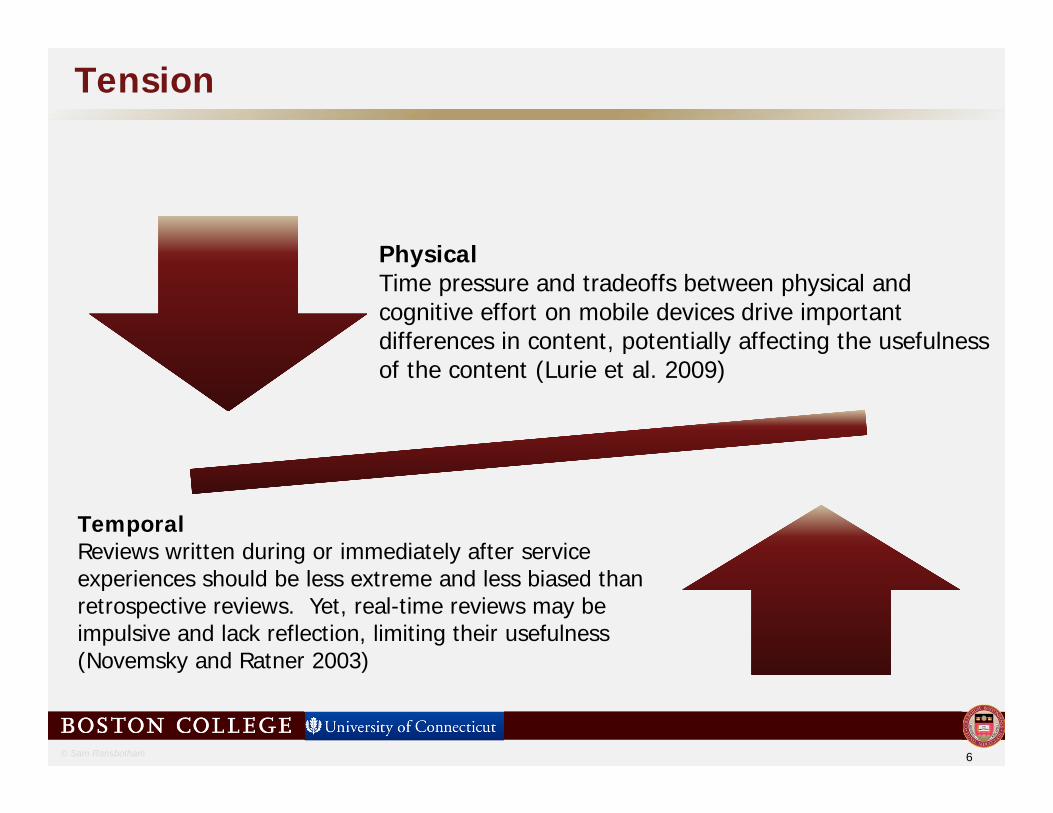
Tension
PhysicalTime pressure and tradeoffs between physical and cognitive effort on mobile devices drive important differences in content, potentially affecting the usefulness of the content (Lurie et al. 2009)
TemporalReviews written during or immediately after service experiences should be less extreme and less biased than retrospective reviews. Yet, real-time reviews may be impulsive and lack reflection, limiting their usefulness (Novemsky and Ratner 2003)
6
© Sam Ransbotham
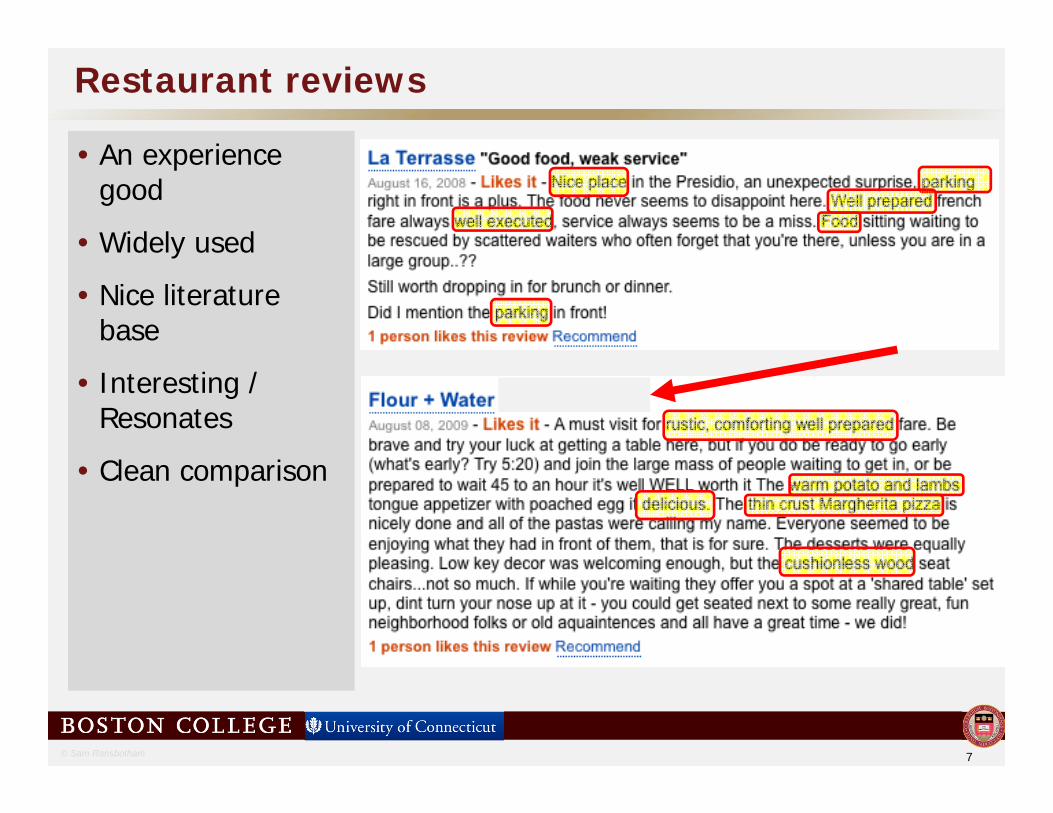
Restaurant reviews
• An experience good
• Widely used
• Nice literature base
• Interesting / Resonates
• Clean comparison
7
© Sam Ransbotham
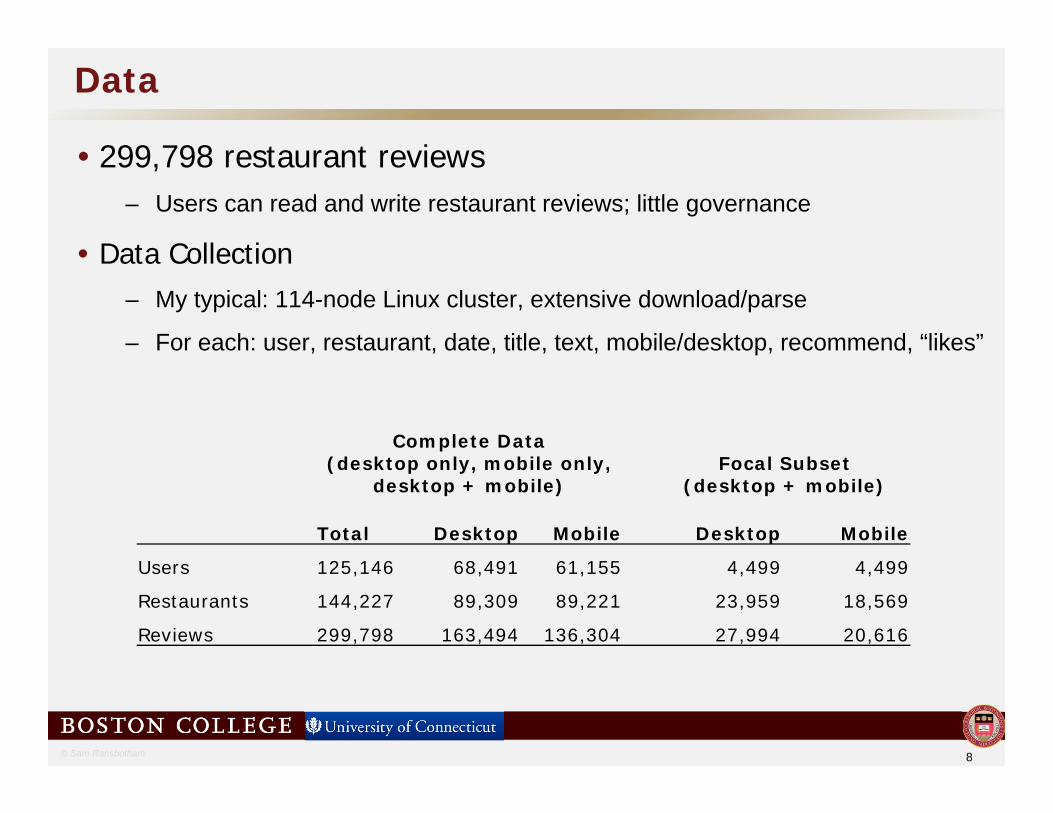
Data
• 299,798 restaurant reviews– Users can read and write restaurant reviews; little governance
• Data Collection– My typical: 114-node Linux cluster, extensive download/parse
– For each: user, restaurant, date, title, text, mobile/desktop, recommend, “likes”
8
Complete Data(desktop only, mobile only,
desktop + mobile)Focal Subset
(desktop + mobile)
Total Desktop Mobile Desktop Mobile
Users 125,146 68,491 61,155 4,499 4,499
Restaurants 144,227 89,309 89,221 23,959 18,569
Reviews 299,798 163,494 136,304 27,994 20,616

© Sam Ransbotham
Reviews over time
9
200808 200810 200812 200902 200904 200906 200908
MobileDesktop
Month
Num
ber
of R
evie
ws
010
0020
0030
0040
0050
0060
00

© Sam Ransbotham
Text analysis
• Linguistic Inquiry and Word Count with 2007 dictionaries– Originally developed by Pennebaker, Booth, Francis (UT-Austin)
– Used in text analysis research, often with transcription
• Based on word usage– Typically categorizes ~86% of words used
– Example: Negative emotion scale (affective) uses 499 words (e.g. “hurt”, “ugly”, “nasty”)
– Example: Amazon
10
“Knowing what your customers are worth is the secret to focusing your time and money where it makes the most difference. You can't be all things to all people, so you need to learn to find out who really matters to your success. Fader makes it clear with great ideas and a readable style.” - Andy Sernovitz
Dimension This Review All ReviewsSelf-references (%) 0.00 1.15Social words (%) 14.81 4.49Positive emotions (%) 1.85 4.36Negative emotions (%) 0.00 0.64Cognitive wording (%) 12.96 7.05Swearing (%) 0.00 0.00Big words (%) 12.96 30.77
Quite addictive…class emails, spouse, peer-reviews,…
© Sam Ransbotham
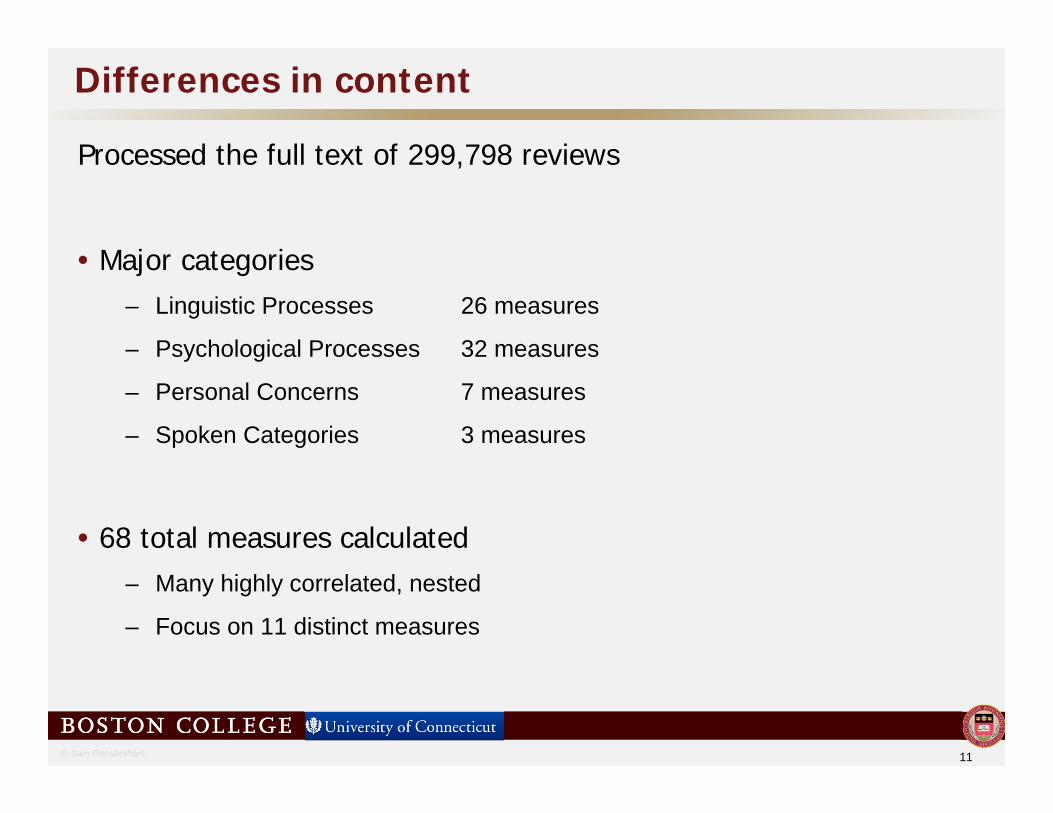
Differences in content
Processed the full text of 299,798 reviews
• Major categories– Linguistic Processes 26 measures
– Psychological Processes 32 measures
– Personal Concerns 7 measures
– Spoken Categories 3 measures
• 68 total measures calculated– Many highly correlated, nested
– Focus on 11 distinct measures
11
© Sam Ransbotham
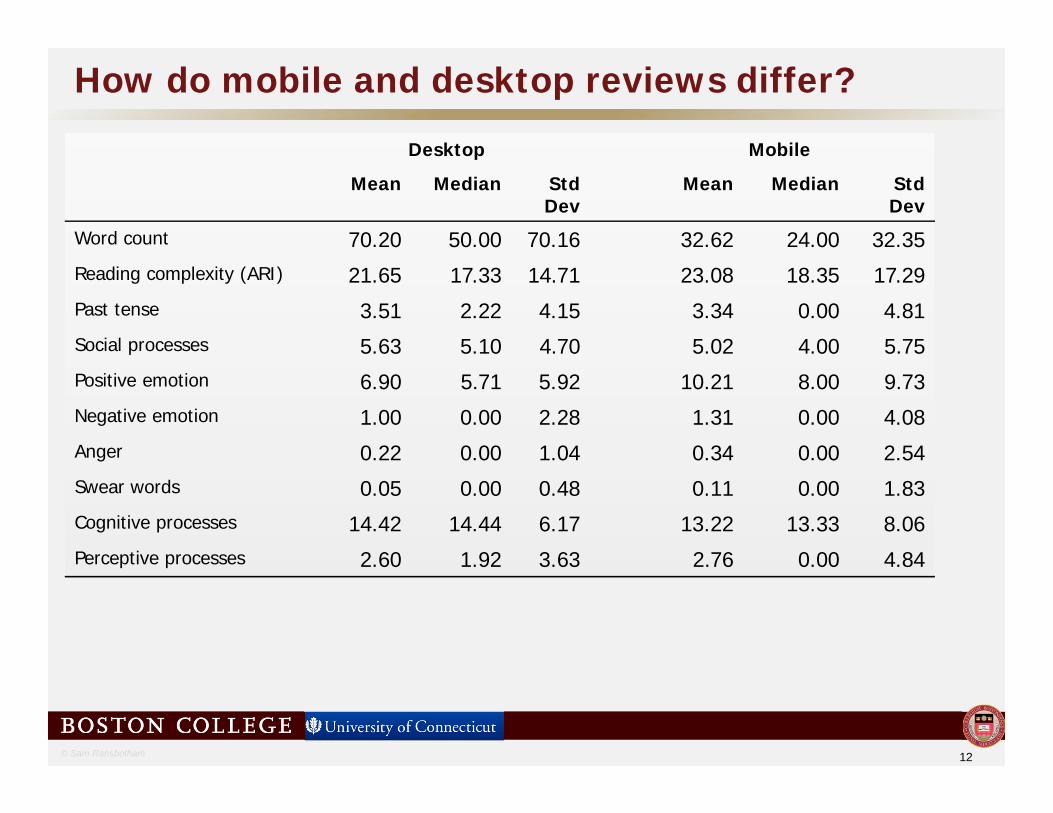
How do mobile and desktop reviews differ?
12
Desktop Mobile
Mean Median StdDev
Mean Median StdDev
Word count 70.20 50.00 70.16 32.62 24.00 32.35Reading complexity (ARI) 21.65 17.33 14.71 23.08 18.35 17.29Past tense 3.51 2.22 4.15 3.34 0.00 4.81Social processes 5.63 5.10 4.70 5.02 4.00 5.75Positive emotion 6.90 5.71 5.92 10.21 8.00 9.73Negative emotion 1.00 0.00 2.28 1.31 0.00 4.08Anger 0.22 0.00 1.04 0.34 0.00 2.54Swear words 0.05 0.00 0.48 0.11 0.00 1.83Cognitive processes 14.42 14.44 6.17 13.22 13.33 8.06Perceptive processes 2.60 1.92 3.63 2.76 0.00 4.84
© Sam Ransbotham
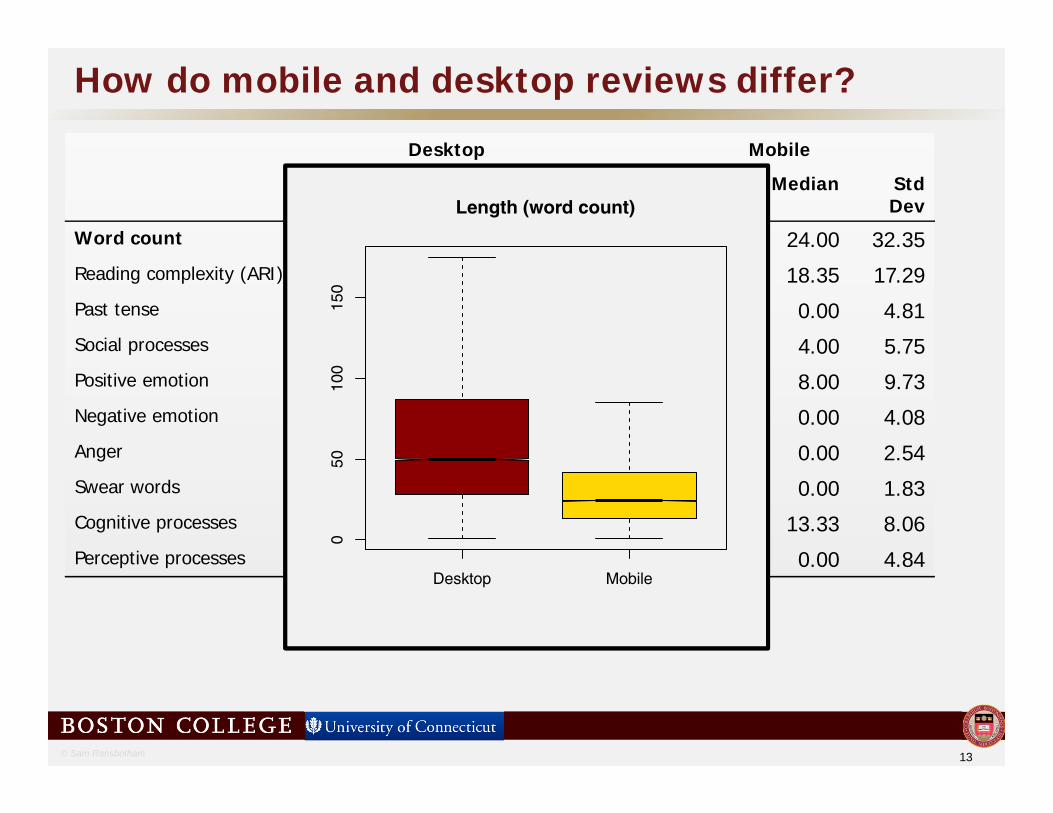
How do mobile and desktop reviews differ?
13
Desktop Mobile
Mean Median StdDev
Mean Median StdDev
Word count 70.20 50.00 70.16 32.62 24.00 32.35Reading complexity (ARI) 21.65 17.33 14.71 23.08 18.35 17.29Past tense 3.51 2.22 4.15 3.34 0.00 4.81Social processes 5.63 5.10 4.70 5.02 4.00 5.75Positive emotion 6.90 5.71 5.92 10.21 8.00 9.73Negative emotion 1.00 0.00 2.28 1.31 0.00 4.08Anger 0.22 0.00 1.04 0.34 0.00 2.54Swear words 0.05 0.00 0.48 0.11 0.00 1.83Cognitive processes 14.42 14.44 6.17 13.22 13.33 8.06Perceptive processes 2.60 1.92 3.63 2.76 0.00 4.84
Desktop Mobile
050
100
150
Length (word count)
Desktop Mobile
050
100
150
Length (word count)

© Sam Ransbotham
How do mobile and desktop reviews differ?
14
Desktop Mobile
Mean Median StdDev
Mean Median StdDev
Word count 70.20 50.00 70.16 32.62 24.00 32.35Reading complexity 21.65 17.33 14.71 23.08 18.35 17.29Past tense 3.51 2.22 4.15 3.34 0.00 4.81Social processes 5.63 5.10 4.70 5.02 4.00 5.75Positive emotion 6.90 5.71 5.92 10.21 8.00 9.73Negative emotion 1.00 0.00 2.28 1.31 0.00 4.08Anger 0.22 0.00 1.04 0.34 0.00 2.54Swear words 0.05 0.00 0.48 0.11 0.00 1.83Cognitive processes 14.42 14.44 6.17 13.22 13.33 8.06Perceptive processes 2.60 1.92 3.63 2.76 0.00 4.84
Desktop Mobile
1015
2025
3035
40
Complexity (ARI)
Desktop Mobile
1015
2025
3035
40
Complexity (ARI)
© Sam Ransbotham
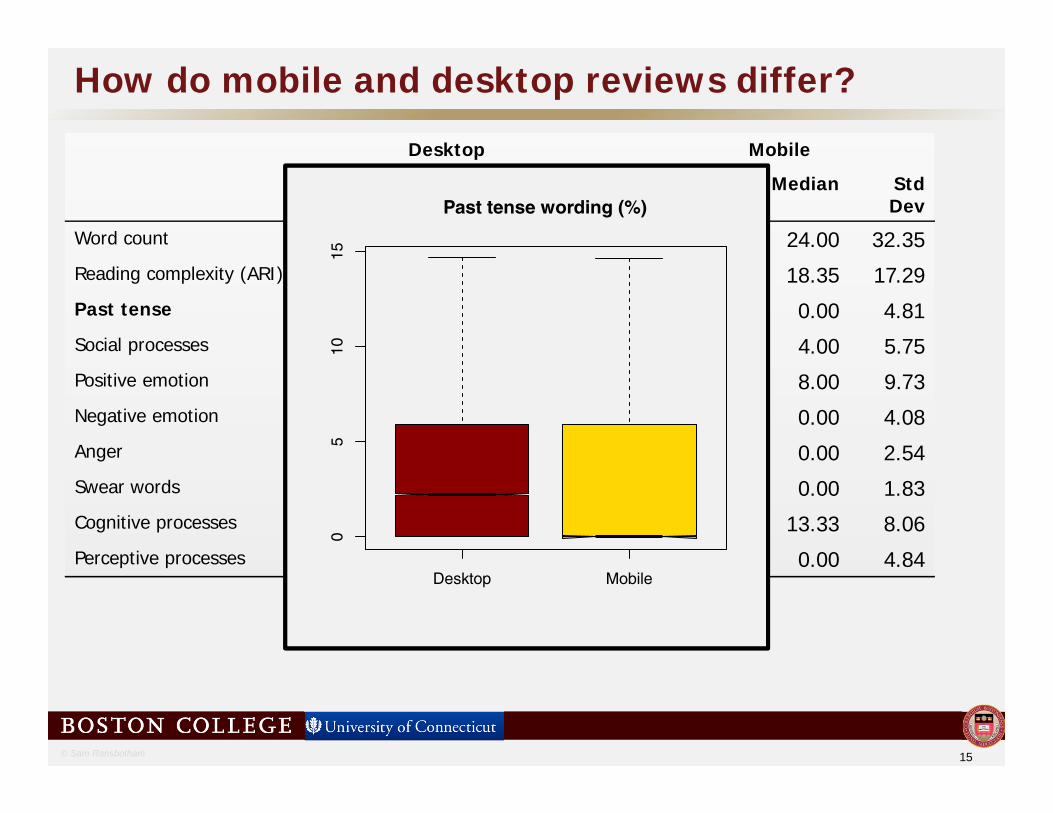
How do mobile and desktop reviews differ?
15
Desktop Mobile
Mean Median StdDev
Mean Median StdDev
Word count 70.20 50.00 70.16 32.62 24.00 32.35Reading complexity (ARI) 21.65 17.33 14.71 23.08 18.35 17.29Past tense 3.51 2.22 4.15 3.34 0.00 4.81Social processes 5.63 5.10 4.70 5.02 4.00 5.75Positive emotion 6.90 5.71 5.92 10.21 8.00 9.73Negative emotion 1.00 0.00 2.28 1.31 0.00 4.08Anger 0.22 0.00 1.04 0.34 0.00 2.54Swear words 0.05 0.00 0.48 0.11 0.00 1.83Cognitive processes 14.42 14.44 6.17 13.22 13.33 8.06Perceptive processes 2.60 1.92 3.63 2.76 0.00 4.84
Desktop Mobile
05
1015
Past tense wording (%)
Desktop Mobile
05
1015
Past tense wording (%)
© Sam Ransbotham
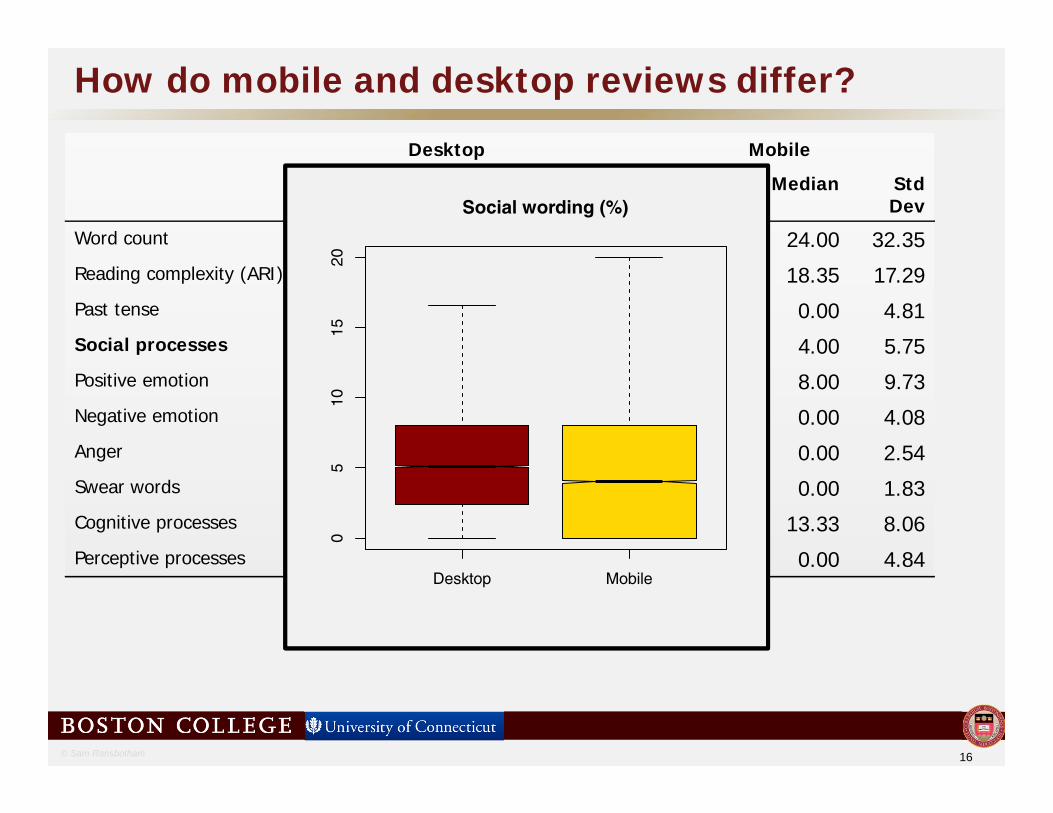
How do mobile and desktop reviews differ?
16
Desktop Mobile
Mean Median StdDev
Mean Median StdDev
Word count 70.20 50.00 70.16 32.62 24.00 32.35Reading complexity (ARI) 21.65 17.33 14.71 23.08 18.35 17.29Past tense 3.51 2.22 4.15 3.34 0.00 4.81Social processes 5.63 5.10 4.70 5.02 4.00 5.75Positive emotion 6.90 5.71 5.92 10.21 8.00 9.73Negative emotion 1.00 0.00 2.28 1.31 0.00 4.08Anger 0.22 0.00 1.04 0.34 0.00 2.54Swear words 0.05 0.00 0.48 0.11 0.00 1.83Cognitive processes 14.42 14.44 6.17 13.22 13.33 8.06Perceptive processes 2.60 1.92 3.63 2.76 0.00 4.84
Desktop Mobile
05
1015
20
Social wording (%)
Desktop Mobile
05
1015
20
Social wording (%)

© Sam Ransbotham
How do mobile and desktop reviews differ?
17
Desktop Mobile
Mean Median StdDev
Mean Median StdDev
Word count 70.20 50.00 70.16 32.62 24.00 32.35Reading complexity (ARI) 21.65 17.33 14.71 23.08 18.35 17.29Past tense 3.51 2.22 4.15 3.34 0.00 4.81Social processes 5.63 5.10 4.70 5.02 4.00 5.75Positive emotion 6.90 5.71 5.92 10.21 8.00 9.73Negative emotion 1.00 0.00 2.28 1.31 0.00 4.08Anger 0.22 0.00 1.04 0.34 0.00 2.54Swear words 0.05 0.00 0.48 0.11 0.00 1.83Cognitive processes 14.42 14.44 6.17 13.22 13.33 8.06Perceptive processes 2.60 1.92 3.63 2.76 0.00 4.84
Desktop Mobile
05
1015
2025
Positive emotion (%)
Desktop Mobile
05
1015
2025
Positive emotion (%)

© Sam Ransbotham
How do mobile and desktop reviews differ?
18
Desktop Mobile
Mean Median StdDev
Mean Median StdDev
Word count 70.20 50.00 70.16 32.62 24.00 32.35Reading complexity (ARI) 21.65 17.33 14.71 23.08 18.35 17.29Past tense 3.51 2.22 4.15 3.34 0.00 4.81Social processes 5.63 5.10 4.70 5.02 4.00 5.75Positive emotion 6.90 5.71 5.92 10.21 8.00 9.73Negative emotion 1.00 0.00 2.28 1.31 0.00 4.08Anger 0.22 0.00 1.04 0.34 0.00 2.54Swear words 0.05 0.00 0.48 0.11 0.00 1.83Cognitive processes 14.42 14.44 6.17 13.22 13.33 8.06Perceptive processes 2.60 1.92 3.63 2.76 0.00 4.84
Desktop Mobile
0.0
0.5
1.0
1.5
2.0
2.5
3.0
3.5
Negative emotion (%)
Desktop Mobile
0.0
0.5
1.0
1.5
2.0
2.5
3.0
3.5
Negative emotion (%)
© Sam Ransbotham
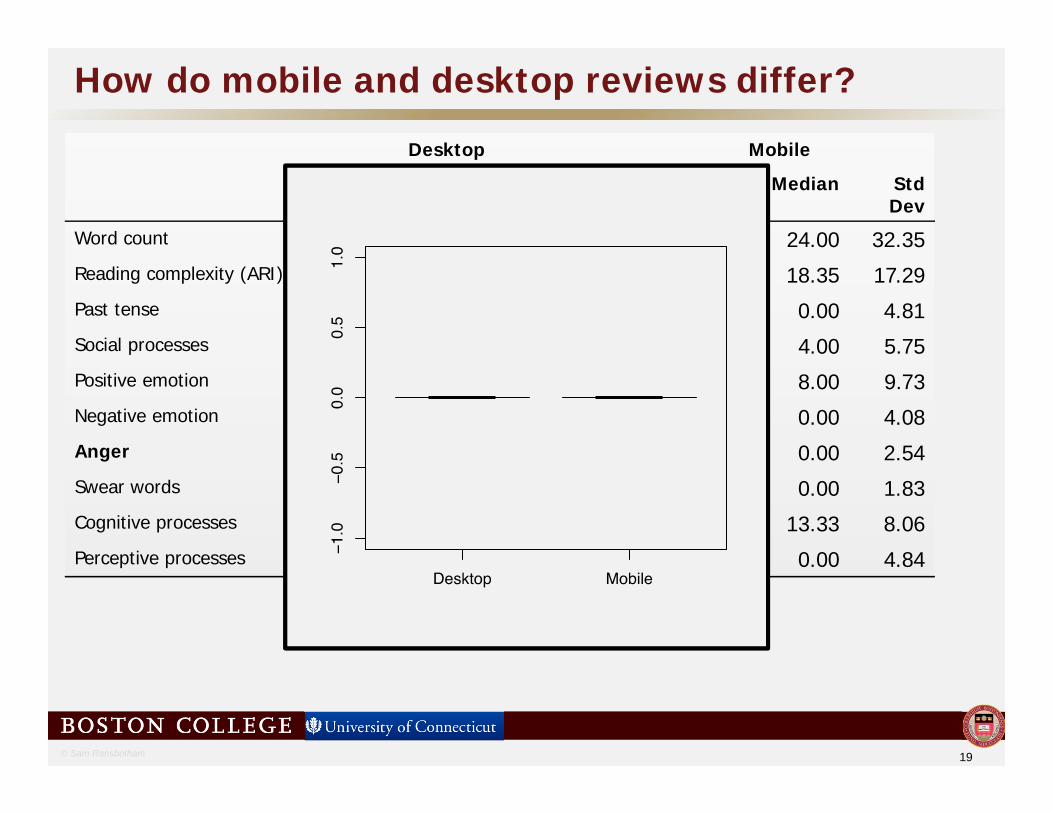
How do mobile and desktop reviews differ?
19
Desktop Mobile
Mean Median StdDev
Mean Median StdDev
Word count 70.20 50.00 70.16 32.62 24.00 32.35Reading complexity (ARI) 21.65 17.33 14.71 23.08 18.35 17.29Past tense 3.51 2.22 4.15 3.34 0.00 4.81Social processes 5.63 5.10 4.70 5.02 4.00 5.75Positive emotion 6.90 5.71 5.92 10.21 8.00 9.73Negative emotion 1.00 0.00 2.28 1.31 0.00 4.08Anger 0.22 0.00 1.04 0.34 0.00 2.54Swear words 0.05 0.00 0.48 0.11 0.00 1.83Cognitive processes 14.42 14.44 6.17 13.22 13.33 8.06Perceptive processes 2.60 1.92 3.63 2.76 0.00 4.84

© Sam Ransbotham
How do mobile and desktop reviews differ?
20
Desktop Mobile
Mean Median StdDev
Mean Median StdDev
Word count 70.20 50.00 70.16 32.62 24.00 32.35Reading complexity (ARI) 21.65 17.33 14.71 23.08 18.35 17.29Past tense 3.51 2.22 4.15 3.34 0.00 4.81Social processes 5.63 5.10 4.70 5.02 4.00 5.75Positive emotion 6.90 5.71 5.92 10.21 8.00 9.73Negative emotion 1.00 0.00 2.28 1.31 0.00 4.08Anger 0.22 0.00 1.04 0.34 0.00 2.54Swear words 0.05 0.00 0.48 0.11 0.00 1.83Cognitive processes 14.42 14.44 6.17 13.22 13.33 8.06Perceptive processes 2.60 1.92 3.63 2.76 0.00 4.84

© Sam Ransbotham
How do mobile and desktop reviews differ?
21
Desktop Mobile
Mean Median StdDev
Mean Median StdDev
Word count 70.20 50.00 70.16 32.62 24.00 32.35Reading complexity (ARI) 21.65 17.33 14.71 23.08 18.35 17.29Past tense 3.51 2.22 4.15 3.34 0.00 4.81Social processes 5.63 5.10 4.70 5.02 4.00 5.75Positive emotion 6.90 5.71 5.92 10.21 8.00 9.73Negative emotion 1.00 0.00 2.28 1.31 0.00 4.08Anger 0.22 0.00 1.04 0.34 0.00 2.54Swear words 0.05 0.00 0.48 0.11 0.00 1.83Cognitive processes 14.42 14.44 6.17 13.22 13.33 8.06Perceptive processes 2.60 1.92 3.63 2.76 0.00 4.84
Desktop Mobile
05
1015
2025
30
Cognitive processes (%)
Desktop Mobile
05
1015
2025
30
Cognitive processes (%)
© Sam Ransbotham
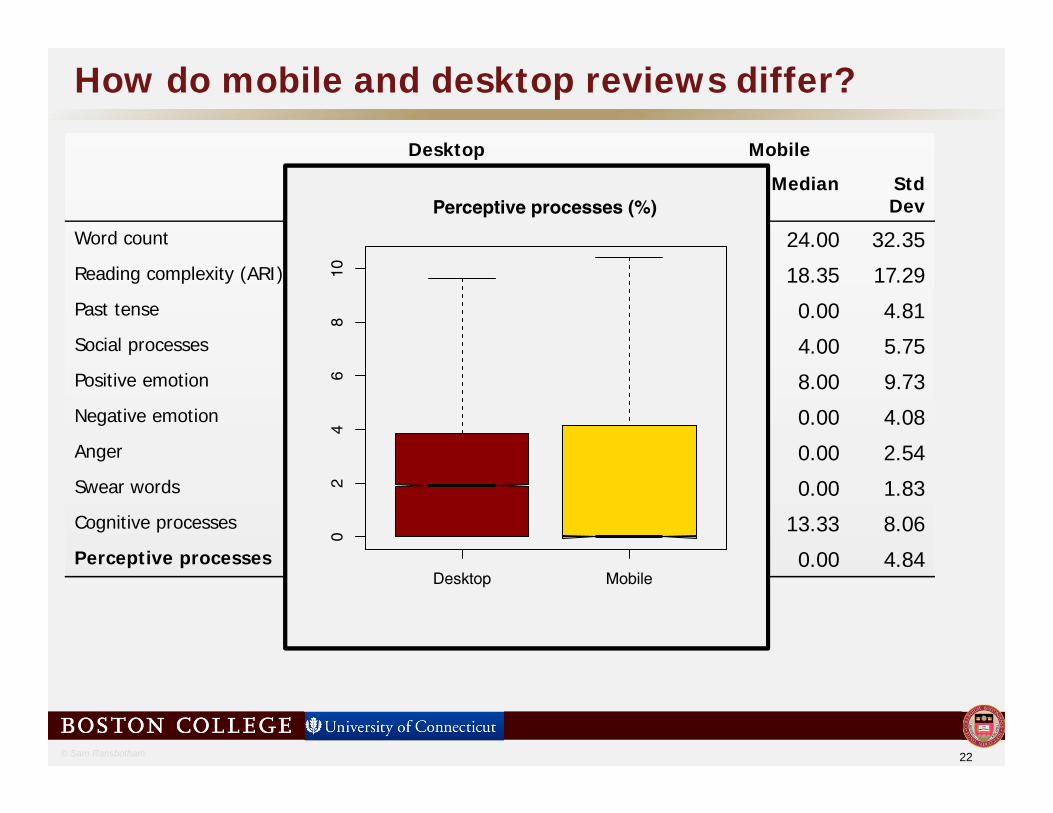
How do mobile and desktop reviews differ?
22
Desktop Mobile
Mean Median StdDev
Mean Median StdDev
Word count 70.20 50.00 70.16 32.62 24.00 32.35Reading complexity (ARI) 21.65 17.33 14.71 23.08 18.35 17.29Past tense 3.51 2.22 4.15 3.34 0.00 4.81Social processes 5.63 5.10 4.70 5.02 4.00 5.75Positive emotion 6.90 5.71 5.92 10.21 8.00 9.73Negative emotion 1.00 0.00 2.28 1.31 0.00 4.08Anger 0.22 0.00 1.04 0.34 0.00 2.54Swear words 0.05 0.00 0.48 0.11 0.00 1.83Cognitive processes 14.42 14.44 6.17 13.22 13.33 8.06Perceptive processes 2.60 1.92 3.63 2.76 0.00 4.84
Desktop Mobile
02
46
810
Perceptive processes (%)
Desktop Mobile
02
46
810
Perceptive processes (%)

© Sam Ransbotham
How do mobile and desktop reviews differ?
23
Desktop Mobile
Mean Median StdDev
Mean Median StdDev
Word count 70.20 50.00 70.16 32.62 24.00 32.35Reading complexity (ARI) 21.65 17.33 14.71 23.08 18.35 17.29Past tense 3.51 2.22 4.15 3.34 0.00 4.81Social processes 5.63 5.10 4.70 5.02 4.00 5.75Positive emotion 6.90 5.71 5.92 10.21 8.00 9.73Negative emotion 1.00 0.00 2.28 1.31 0.00 4.08Anger 0.22 0.00 1.04 0.34 0.00 2.54Swear words 0.05 0.00 0.48 0.11 0.00 1.83Cognitive processes 14.42 14.44 6.17 13.22 13.33 8.06Perceptive processes 2.60 1.92 3.63 2.76 0.00 4.84

© Sam Ransbotham
What do mobile reviews recommend?
24
Model A0 Model A1 Model A2 Model B2Mobile -0.28*** -0.39*** -0.40***
Word count (x1000) 2.12*** 1.21*** 0.68**
Complexity (ARI x 100) 0.90*** -0.94*** -1.56***
Past (std) -0.31*** -0.30*** -0.43***
Social (std) 0.06*** 0.05*** 0.10***
Positive emotions (std) 0.36*** 0.39*** 0.42***
Negative emotions (std) -0.56*** -0.55*** -0.63***
Anger (std) 0.05*** 0.05*** 0.20***
Swearing (std) -0.01 -0.01 0.01
Cognitive (std) -0.08*** -0.08*** -0.13***
Perceptive (std) 0.01** 0.01*** 0.07***
User fixed effects included
Ordered logistic regression (Bayesian) on the rating (dislike, neutral, like, really like)48,610 observations of 4,499 users with at least one mobile and one desktop review5000 iterations; *** p < 0.001
Mobile reviews more likely negative than by non-mobile reviews
© Sam Ransbotham
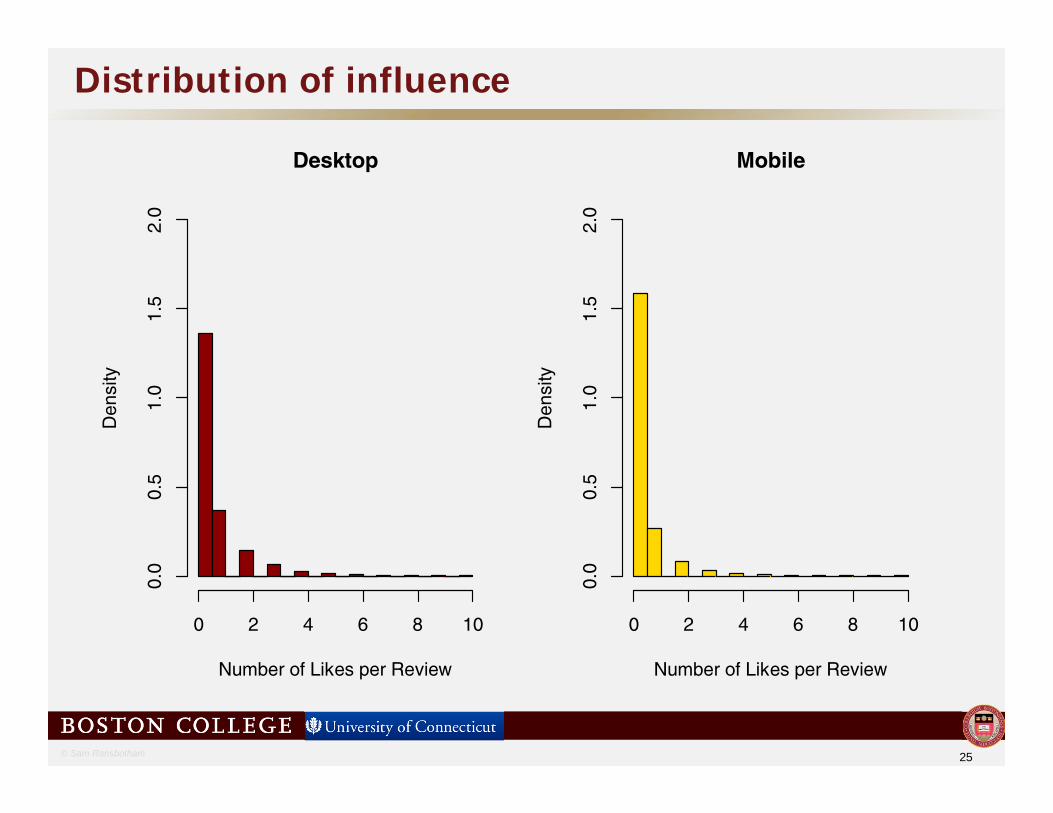
Distribution of influence
25
Desktop
Number of Likes per Review
Den
sity
0 2 4 6 8 10
0.0
0.5
1.0
1.5
2.0
Mobile
Number of Likes per Review
Den
sity
0 2 4 6 8 10
0.0
0.5
1.0
1.5
2.0

© Sam Ransbotham
How influential are mobile reviews?
26
Negative binomial regression on the number of users who like the review. 48,610 observations of 4,499 users with at least one mobile and one desktop review(additional controls for age, time, intercept)
Users are less influenced by mobile reviews than by desktop reviews
Model 0 Model 1 Model 2Score: dislike 0.27*** 0.18*** 0.20***
Score: like -0.02 -0.02 -0.03
Score: really like 0.26*** 0.24*** 0.22***
Mobile -0.44*** -0.27***
Word count (x1000) 4.27*** 3.73***
Complexity (ARI x 100) -0.13 -0.17*
Past (std) 0.01 0.01
Social (std) 0.03** 0.02*
Positive emotions (std) -0.04*** -0.02
Negative emotions (std) 0.02 0.02
Anger (std) -0.03* -0.03*
Swearing (std) -0.01 -0.01
Cognitive (std) -0.02 -0.02*
Perceptive (std) -0.04*** -0.04**
© Sam Ransbotham
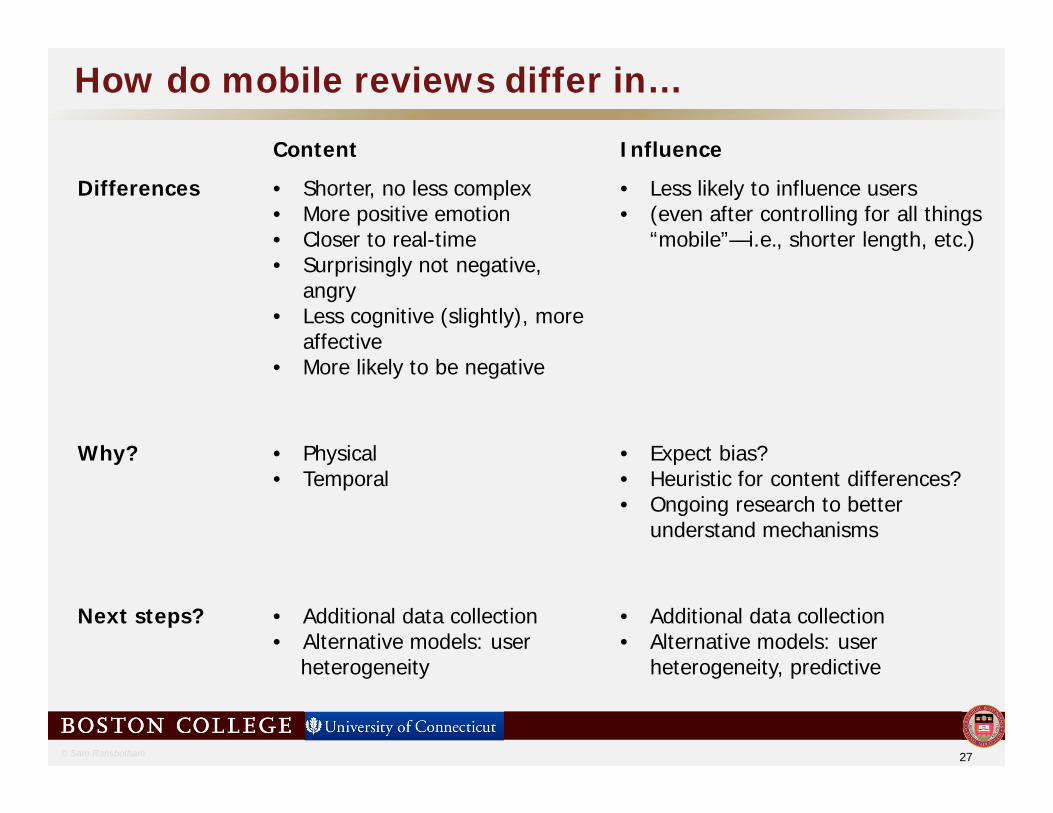
How do mobile reviews differ in…
Content Influence
Differences • Shorter, no less complex• More positive emotion• Closer to real-time• Surprisingly not negative,
angry• Less cognitive (slightly), more
affective• More likely to be negative
• Less likely to influence users • (even after controlling for all things
“mobile”—i.e., shorter length, etc.)
Why? • Physical• Temporal
• Expect bias? • Heuristic for content differences?• Ongoing research to better
understand mechanisms
Next steps? • Additional data collection• Alternative models: user
heterogeneity
• Additional data collection• Alternative models: user
heterogeneity, predictive
27

© Sam Ransbotham
What mechanisms drive differences?
• Review characteristics (page placement?)
• Endogenous choice of real-time (only if extreme?)
• Use of “likes” as measure of influence (same as behavior?)
Next step (experiment)
• Controlled mapping of “mobile” to “real-time”
• Measure influence
• Both scenarios and field
28
© Sam Ransbotham
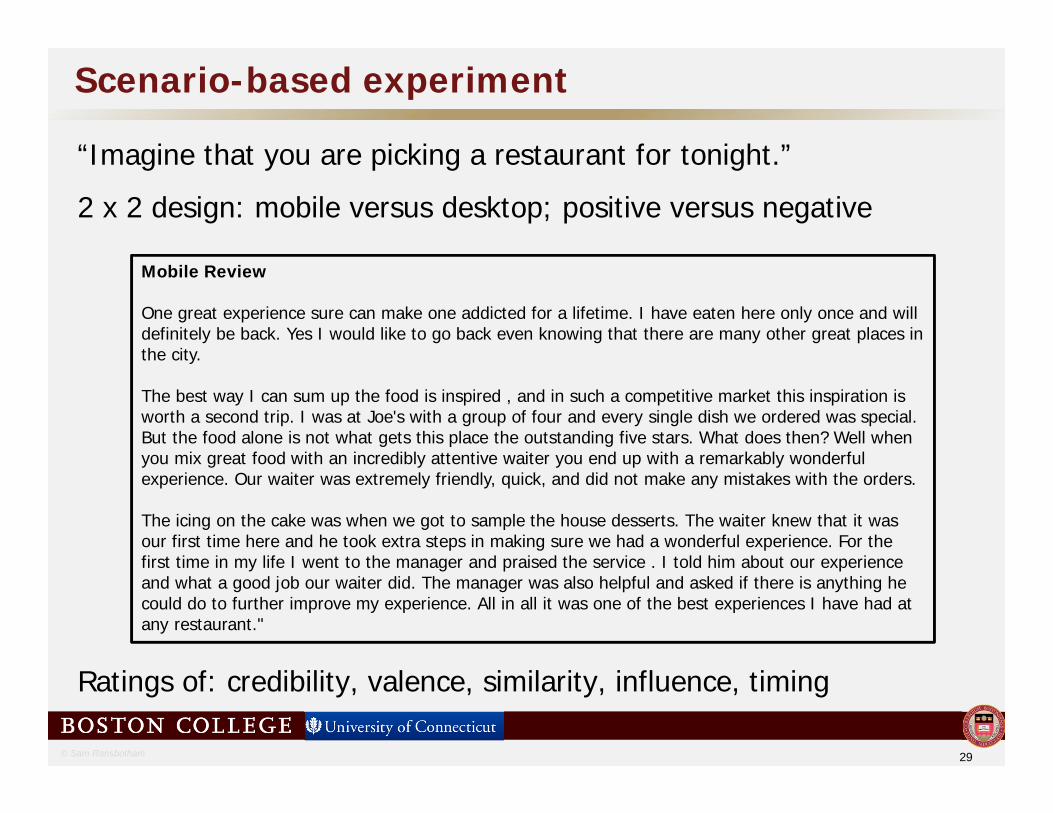
Scenario-based experiment
“Imagine that you are picking a restaurant for tonight.”
2 x 2 design: mobile versus desktop; positive versus negative
Ratings of: credibility, valence, similarity, influence, timing
29
Mobile Review
One great experience sure can make one addicted for a lifetime. I have eaten here only once and will definitely be back. Yes I would like to go back even knowing that there are many other great places in the city.
The best way I can sum up the food is inspired , and in such a competitive market this inspiration is worth a second trip. I was at Joe's with a group of four and every single dish we ordered was special. But the food alone is not what gets this place the outstanding five stars. What does then? Well when you mix great food with an incredibly attentive waiter you end up with a remarkably wonderful experience. Our waiter was extremely friendly, quick, and did not make any mistakes with the orders.
The icing on the cake was when we got to sample the house desserts. The waiter knew that it was our first time here and he took extra steps in making sure we had a wonderful experience. For the first time in my life I went to the manager and praised the service . I told him about our experience and what a good job our waiter did. The manager was also helpful and asked if there is anything he could do to further improve my experience. All in all it was one of the best experiences I have had at any restaurant."

© Sam Ransbotham
Preliminary experimental results
30
Negative Positive
DesktopMobile
Usefulness of Reviews
Valence
Use
fuln
ess
02
46
8
6.59
4.87
7.27
7.67
Negative Positive
DesktopMobile
Usefulness of Reviews
Valence
Use
fuln
ess
02
46
8
6.59
4.87
7.27
7.67
Negative Positive
DesktopMobile
Credibility of Reviews
Valence
Cre
dibi
lity
02
46
8
6.00
5.27
6.606.87
Negative Positive
DesktopMobile
Credibility of Reviews
Valence
Cre
dibi
lity
02
46
8
6.00
5.27
6.606.87
© Sam Ransbotham
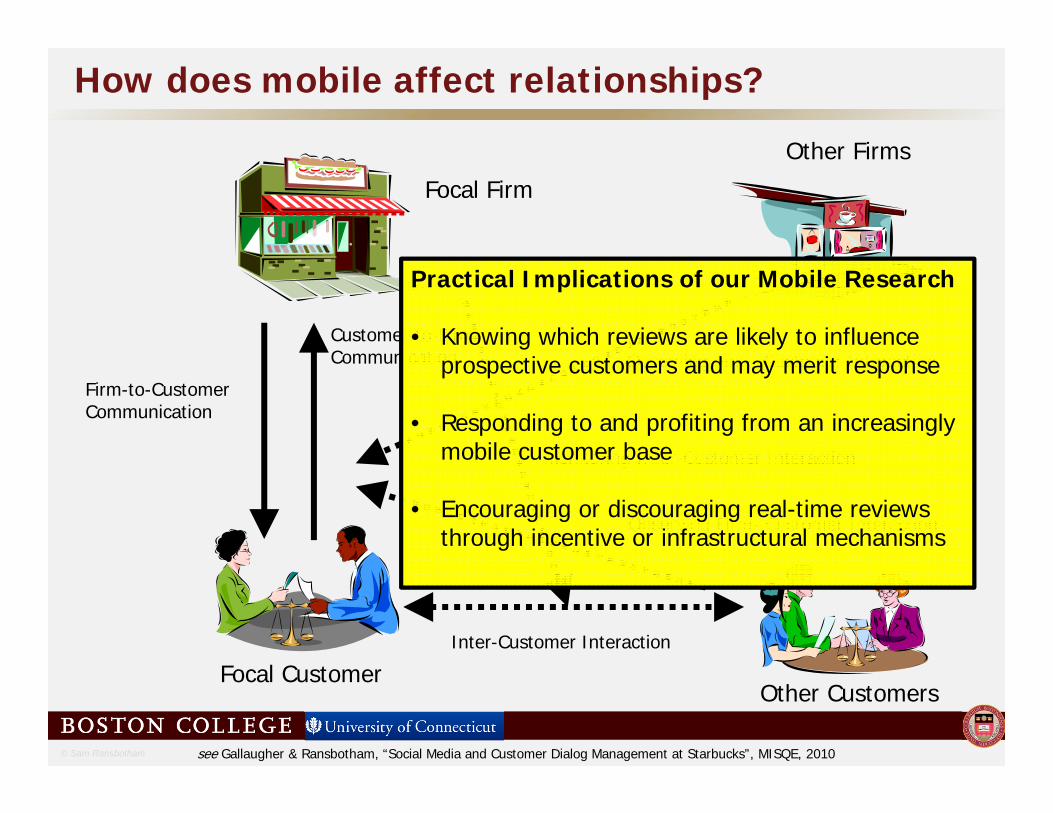
How does mobile affect relationships?
Firm-to-Customer Communication
Customer-to-Firm Communication
Inter-Customer Interaction
Monitoring Inter-Customer Interaction
Observing Firm- Customer Interaction
Observing Firm- Customer Interaction
Focal Customer
Focal Firm
Other Customers
Other Firms
see Gallaugher & Ransbotham, “Social Media and Customer Dialog Management at Starbucks”, MISQE, 2010
Practical Implications of our Mobile Research
• Knowing which reviews are likely to influence prospective customers and may merit response
• Responding to and profiting from an increasingly mobile customer base
• Encouraging or discouraging real-time reviews through incentive or infrastructural mechanisms