Embed Size (px)
Citation preview
From Mass Migration to Mass Mobility | 1
Concept Paper From Mass Migration to Mass Mobility: Conceptualising Human Mobility in the 21st Century August 2015
Dr Jacques Collard Mobility and Trade Research Section Policy, Research and Statistics Branch. Policy Group Telephone: (02) 6264-2404 Email: [email protected]
From Mass Migration to Mass Mobility | 2
Table of Contents
Executive summary ......................................................................................................... 3
Introduction .................................................................................................................... 5
Mobility in the 21st century ............................................................................................. 6
Mapping human mobility................................................................................................ 7
Typology of people movements ............................................................................................... 8
Motility ................................................................................................................................. 9
Global and regional context .......................................................................................... 11
Economic prospects for Australia ............................................................................................11
Global value chains and productivity ............................................................................ 13
Australia’s mobility flows ............................................................................................. 15
Demographic implications ............................................................................................ 17
Conclusion..................................................................................................................... 20
From Mass Migration to Mass Mobility | 3
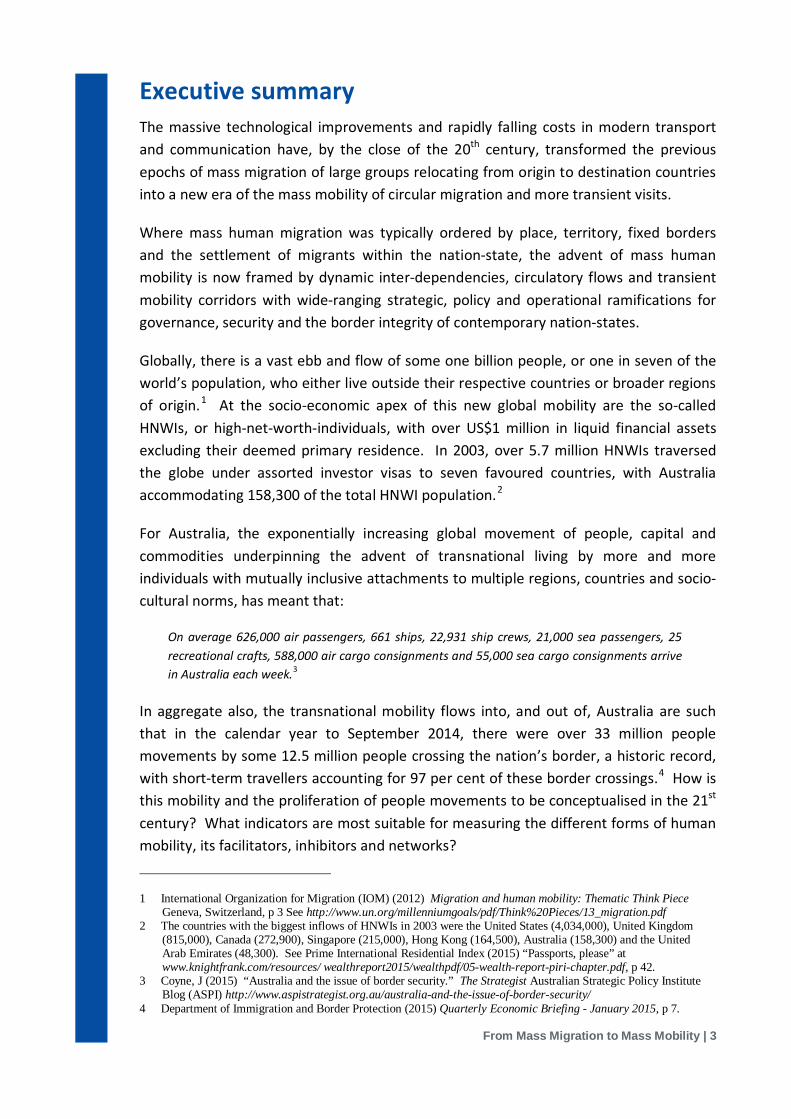
Executive summary The massive technological improvements and rapidly falling costs in modern transport and communication have, by the close of the 20th century, transformed the previous epochs of mass migration of large groups relocating from origin to destination countries into a new era of the mass mobility of circular migration and more transient visits.
Where mass human migration was typically ordered by place, territory, fixed borders and the settlement of migrants within the nation-state, the advent of mass human mobility is now framed by dynamic inter-dependencies, circulatory flows and transient mobility corridors with wide-ranging strategic, policy and operational ramifications for governance, security and the border integrity of contemporary nation-states.
Globally, there is a vast ebb and flow of some one billion people, or one in seven of the world’s population, who either live outside their respective countries or broader regions of origin.1 At the socio-economic apex of this new global mobility are the so-called HNWIs, or high-net-worth-individuals, with over US$1 million in liquid financial assets excluding their deemed primary residence. In 2003, over 5.7 million HNWIs traversed the globe under assorted investor visas to seven favoured countries, with Australia accommodating 158,300 of the total HNWI population.2
For Australia, the exponentially increasing global movement of people, capital and commodities underpinning the advent of transnational living by more and more individuals with mutually inclusive attachments to multiple regions, countries and socio-cultural norms, has meant that:
On average 626,000 air passengers, 661 ships, 22,931 ship crews, 21,000 sea passengers, 25 recreational crafts, 588,000 air cargo consignments and 55,000 sea cargo consignments arrive in Australia each week.3
In aggregate also, the transnational mobility flows into, and out of, Australia are such that in the calendar year to September 2014, there were over 33 million people movements by some 12.5 million people crossing the nation’s border, a historic record, with short-term travellers accounting for 97 per cent of these border crossings.4 How is this mobility and the proliferation of people movements to be conceptualised in the 21st century? What indicators are most suitable for measuring the different forms of human mobility, its facilitators, inhibitors and networks?
1 International Organization for Migration (IOM) (2012) Migration and human mobility: Thematic Think Piece Geneva, Switzerland, p 3 See http://www.un.org/millenniumgoals/pdf/Think%20Pieces/13_migration.pdf
2 The countries with the biggest inflows of HNWIs in 2003 were the United States (4,034,000), United Kingdom (815,000), Canada (272,900), Singapore (215,000), Hong Kong (164,500), Australia (158,300) and the United Arab Emirates (48,300). See Prime International Residential Index (2015) “Passports, please” at www.knightfrank.com/resources/ wealthreport2015/wealthpdf/05-wealth-report-piri-chapter.pdf, p 42.
3 Coyne, J (2015) “Australia and the issue of border security.” The Strategist Australian Strategic Policy Institute Blog (ASPI) http://www.aspistrategist.org.au/australia-and-the-issue-of-border-security/
4 Department of Immigration and Border Protection (2015) Quarterly Economic Briefing - January 2015, p 7.
From Mass Migration to Mass Mobility | 4
This paper provides a framework for conceptualising mobility as a continuum that presupposes ‘motility’, or the anticipation of a person or group to be spatially mobile in the very near future, through to the varying frequency of actual circulatory movements and, now comparatively less often, to a permanent migration culminating in citizenship. Quantifiable aspects of a human mobility continuum, notably the total numbers, duration and frequency of people movements, may be expressed in terms of the following attributes or variables, namely:
production movement: production-related moves, whether permanent or temporary, with the person making an economic contribution to the destination country through the ownership and/or use of capital, or by being self-employed or simply as an employee;
consumption movement: human mobility motivated by consumption is typically distinguished by its greater frequency and shorter duration in movements, which include pleasure-related moves such as shopping, excursions and vacations in particular seasons;
seasonal movement: mobility at particular times of the year may be either production-related moves, for example seasonal agricultural workers, or in the case of consumption-related moves, tourists and other circulatory or transient visitors; and
location of domicile: predominant geographical location of either short- or long-term residents in a city, urban, regional or rural area, which will also reflect the magnitude, duration and frequency of movements.
The above categories are necessarily fluid and overlap given that a production-related movement may be complemented by consumption-related activities or events. For example, an overseas consultant surgeon on a skilled visa working in the health industry may have also pre-booked a local dentist for personal dental services in another sector of the same industry.
To the extent that human mobility continues to be understood through the traditional prism of mass migration as a more or less permanent linear trajectory from an origin to a destination country, the border must accordingly be objectified, regulated and governed as the fixed outer perimeters of a fortress nation-state.
To the extent, however, that human mobility in the 21st century is conceptualised, mapped and charted as a web of transnational inter-dependencies and circulatory flows of increasingly transient movements, the border must be more innovatively managed as a set of social relations and governance strategies straddling a globally porous, fluid and dynamic continuum anchored in, and mediated by, the modern nation state.
From Mass Migration to Mass Mobility | 5
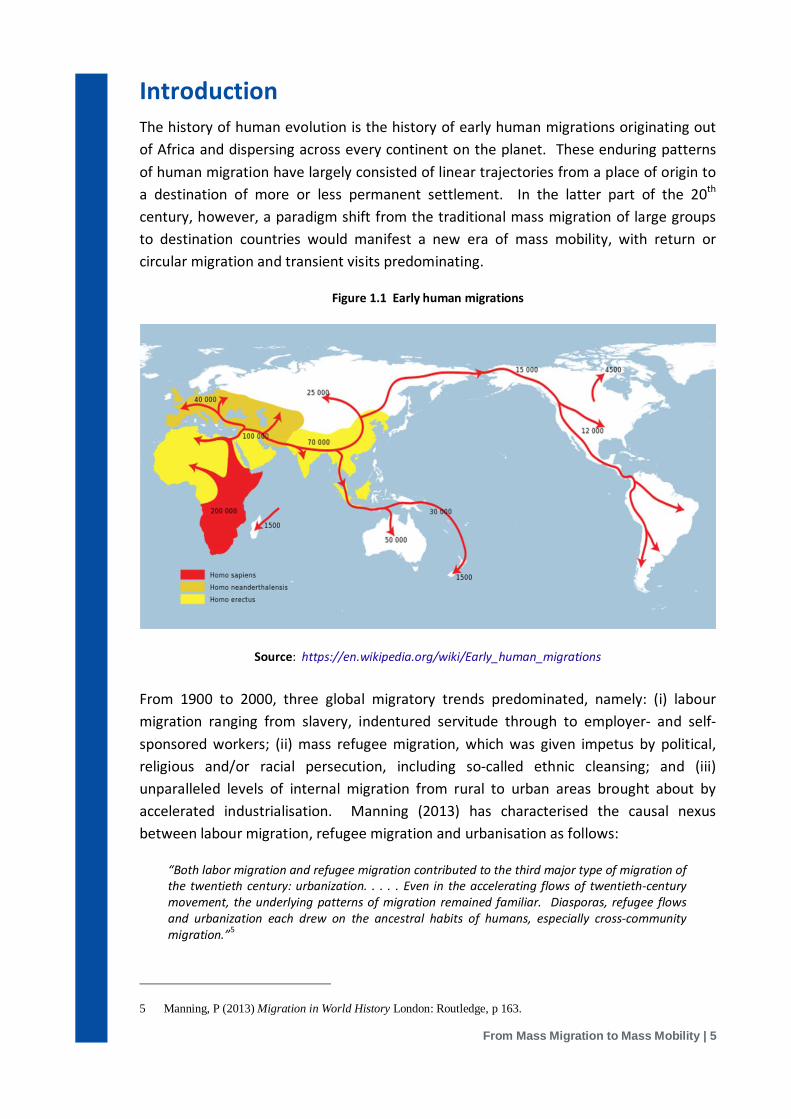
Introduction The history of human evolution is the history of early human migrations originating out of Africa and dispersing across every continent on the planet. These enduring patterns of human migration have largely consisted of linear trajectories from a place of origin to a destination of more or less permanent settlement. In the latter part of the 20th century, however, a paradigm shift from the traditional mass migration of large groups to destination countries would manifest a new era of mass mobility, with return or circular migration and transient visits predominating.
Figure 1.1 Early human migrations
Source: https://en.wikipedia.org/wiki/Early_human_migrations
From 1900 to 2000, three global migratory trends predominated, namely: (i) labour migration ranging from slavery, indentured servitude through to employer- and self-sponsored workers; (ii) mass refugee migration, which was given impetus by political, religious and/or racial persecution, including so-called ethnic cleansing; and (iii) unparalleled levels of internal migration from rural to urban areas brought about by accelerated industrialisation. Manning (2013) has characterised the causal nexus between labour migration, refugee migration and urbanisation as follows:
“Both labor migration and refugee migration contributed to the third major type of migration of the twentieth century: urbanization. . . . . Even in the accelerating flows of twentieth-century movement, the underlying patterns of migration remained familiar. Diasporas, refugee flows and urbanization each drew on the ancestral habits of humans, especially cross-community migration.”5
5 Manning, P (2013) Migration in World History London: Routledge, p 163.
From Mass Migration to Mass Mobility | 6
The massive technological improvements and rapidly falling costs in modern transport and communication by the close of the 20th century, resulted in mass migration being eclipsed by mass mobility, with the advent of transnational living by individuals who share mutually inclusive attachments to diverse locations, countries and socio-cultural norms.6
Whereas human migration was typically constituted by place, territory, fixed borders and the management and settlement of vew arrivals within the nation-state, the advent of mass human mobility is now framed by transnational inter-dependencies and dynamic flows of people movements, with strategic, policy and operational ramifications for a modern state’s governance, national security and the integrity of its borders.7
Mobility in the 21st century In previous eras dominated by mass migration, governments in destination countries would routinely anticipate, model and seek to influence the ‘push and pull factors’ of permanent immigrants, the better to leverage the migration pathways to their shores and naturalise the migrant populations within their sovereign borders.
At the close of the 20th century, however, the global landscape and patterns of people movement have been irrevocably transformed, such that:
“The global order is increasingly criss-crossed by tourists, workers, terrorists, students, migrants, asylum-seekers, scientists, scholars, family members, business people, soldiers, guest workers and so on. Such multiple and intersecting mobilities seem to produce a more ‘networked’ patterning of economic and social life, even for those who have not moved . . . . These changes are having many effects. Mobilities are centrally involved in reorganizing institutions, generating climate change, moving risks and illnesses across the globe, altering travel, tourism and migration patterns, producing a more distant family life, transforming the social and educational life of young people, connecting distant people through ‘weak ties’ and so on.”8
In the 21st century, the ever-expanding scale of human mobility has been described as ‘staggering’, given that:
“In 2010, an estimated 214 million individuals were living outside their country of birth (United Nations 2009), and a further 763 million people were living within their country, but outside their region of birth (Bell & Charles-Edwards 2013). Temporary movements are even more substantial. There were over one billion international tourist arrivals in 2012, up from just 25 million in 1950 (UNWTO 2013). While there is no global estimate of tourist movements within national borders, country-specific data suggest their scale. In Australia, for instance, over 74 million overnight trips, an average of three trips per person, were undertaken by Australians
6 Hugo, G (2004) ‘‘A New Paradigm of International Migration: Implications for Migration Policy and Planning in Australia.’’ Research Paper No. 10, 2003–04, Information and Research Services, Parliamentary Library, Department of Parliamentary Services. http://aph.govt.au/library Levitt, P; De Wind, J and Vertovec, S (2003) ‘‘International Perspectives on Transitional Migration: An Introduction.’’ International Migration Review 37(3):565–575. Portes, A (2003) ‘‘Conclusion: Theoretical Convergencies and Empirical Evidence in the Study of Immigrant Transnationalism.’’ International Migration Review 37(3) : 874–892. Hugo, G (1999) ‘‘A New Paradigm of International Migration in Australia.’’ New Zealand Population Review 25:1–40.
7 Urry, J (2000) Sociology Beyond Societies: Mobilities for the Twenty-first Century. London: Routledge. Castells, M (1996) The Rise of the Network Society. Cambridge, MA: Blackwell.
8 Hannam, K; Sheller, M and Urry, J (2006) “Mobilities, Immobilities and Moorings” Mobilities Vol 1, No 1, p 2.

From Mass Migration to Mass Mobility | 7
aged 15 and over in 2012 (TRA 2013a). Nor is there a simple tally of daily commuting trips around the globe, although national statistics again provide some insight. For example, there were an estimated 133 million daily commuters in the USA in 2009 (McKenzie and Rapino 2011). Virtually innumerable are the frequent short journeys made by almost every planetary citizen in the course of meeting the obligations of daily life (e.g. shopping, visiting friends).”9
The complex relational dynamics of 21st century mobility are not only limited to human mobility, but also include the complementary mobilities of finance, capital, goods and services, objects, information, transportation and communication systems.
Governments must in practice, therefore, manage the gamut of global mobility networks and transnational corridors impacting their borders and address the strategic risks, challenges as well as opportunities.
Increasingly also, the transnational complexities of mobility in the new ‘world of flows’ presuppose more enhanced methods of inquiry, analysis and evaluation of ‘flow data’ that will be underpinned by:
“. . . . inter-disciplinary or trans-disciplinary study, requiring multiple methods that can address the intertwined practices of many different kinds of contemporary (im)mobility at a variety of scales, including public and private transport systems; tourism, migration and border studies; mobile communications and software-supported infrastructures . . . . and studies of the regulation, governance and legal structures pertaining to all of these.”10
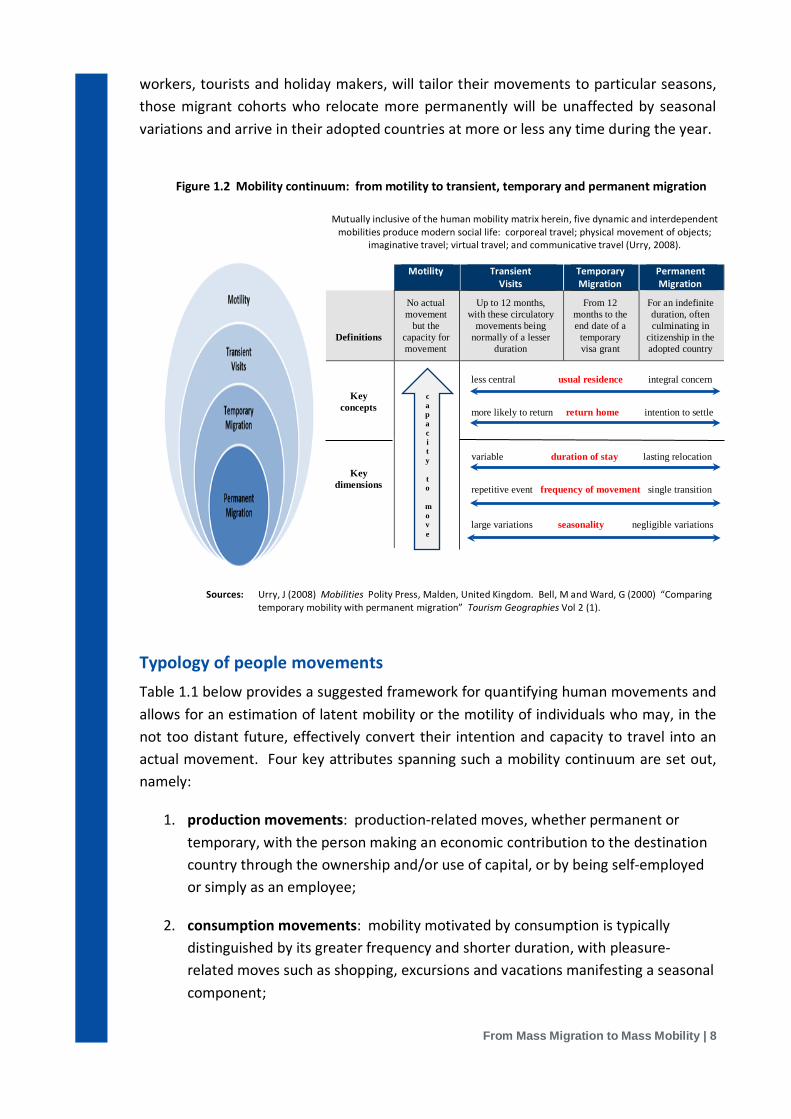
Mapping human mobility Human mobility manifests itself along a continuum, which includes its precursor or ‘motility’, being the effective capacity of a person or group to be spatially mobile, through to an actual movement or series of movements. For more permanent migrants, their mobility is manifested as an enduring relocation that is likely to culminate in citizenship of their destination countries.11
Figure 1.2 schematises a flow of people movements across a continuum ranging from individuals who have a genuine intention and capacity to be mobile through to those who are relocating more or less permanently to a destination country. The more frequent and transient is an individual’s or a group’s mobility, the less likely they will be attached to a usual place of residence, with their manifested preference being for a ‘network of places.’12 And whereas more temporary visitors, including agricultural
9 Charles-Edwards, E; Bell, M and Corcoran, J (2014) “Integrating undergraduate fieldwork into the study of human mobility” Australian Geographer Vol. 45, No. 4, p. 506.
10 Sheller, M (2011) “Mobility” Sociopedia.isa DOI: 10.1177/205684601163, p 6. Salt (2005) has similarly argued that: “For the most part the concepts of migration used as the basis for collecting statistics do not reflect many of the realities of today’s movements, characterised as they are by new forms and dynamics. Particularly difficult to capture are short-term movements and status changes as well as, most obviously, illegal migration.” See Salt, J (2005) Current Trends in International Migration in Europe Strasbourg: Council of Europe, p 7.
11 Aybek, C; Huinink, J and Muttarak, R (eds.) (2015) Spatial Mobility, Migration, and Living Arrangements Vienna: Austria.
12 Taylor, J and Bell, M (1996) “Population mobility and indigenous peoples: the view from Australia.” International Journal of Population Geography 2: 153–69.
From Mass Migration to Mass Mobility | 8
workers, tourists and holiday makers, will tailor their movements to particular seasons, those migrant cohorts who relocate more permanently will be unaffected by seasonal variations and arrive in their adopted countries at more or less any time during the year.
Figure 1.2 Mobility continuum: from motility to transient, temporary and permanent migration
Mutually inclusive of the human mobility matrix herein, five dynamic and interdependent mobilities produce modern social life: corporeal travel; physical movement of objects;
imaginative travel; virtual travel; and communicative travel (Urry, 2008).
Motility Transient Visits
Temporary Migration
Permanent Migration
Definitions
No actual movement
but the capacity for movement
Up to 12 months, with these circulatory
movements being normally of a lesser
duration
From 12 months to the end date of a
temporary visa grant
For an indefinite duration, often culminating in
citizenship in the adopted country
Key concepts
less central usual residence integral concern
more likely to return return home intention to settle
Key dimensions
variable duration of stay lasting relocation
repetitive event frequency of movement single transition
large variations seasonality negligible variations
Sources: Urry, J (2008) Mobilities Polity Press, Malden, United Kingdom. Bell, M and Ward, G (2000) “Comparing
temporary mobility with permanent migration” Tourism Geographies Vol 2 (1).
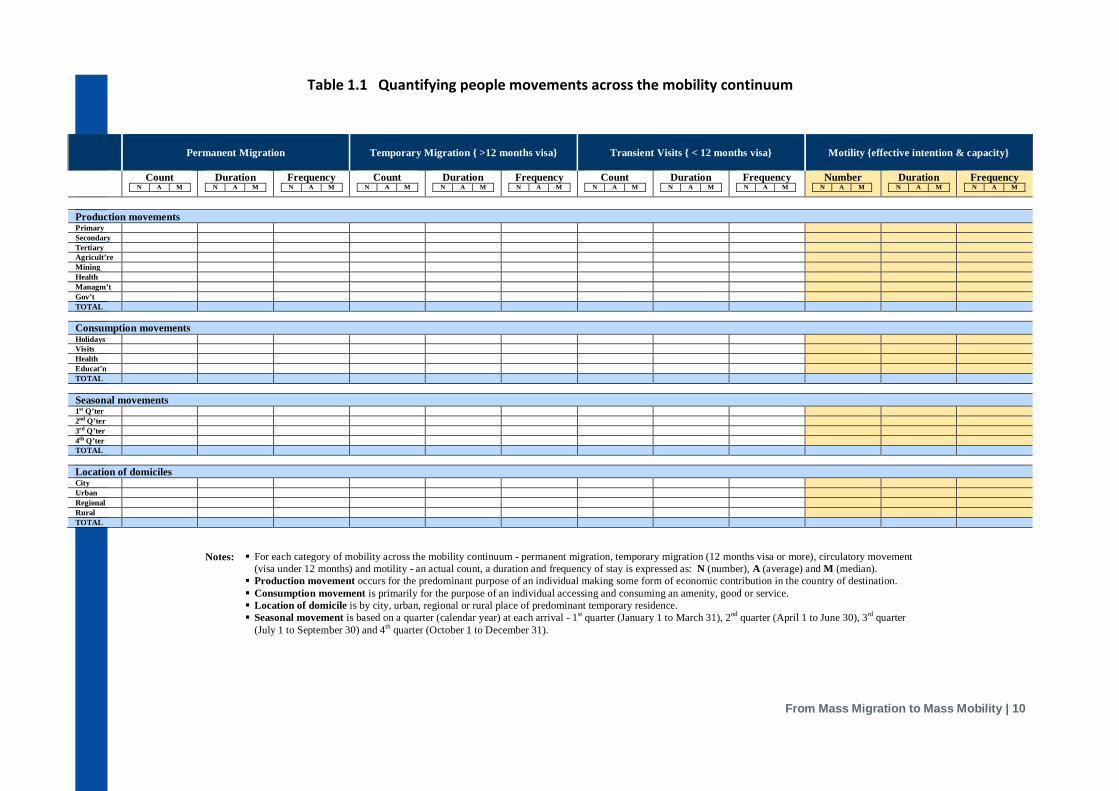
Typology of people movements Table 1.1 below provides a suggested framework for quantifying human movements and allows for an estimation of latent mobility or the motility of individuals who may, in the not too distant future, effectively convert their intention and capacity to travel into an actual movement. Four key attributes spanning such a mobility continuum are set out, namely:
1. production movements: production-related moves, whether permanent or temporary, with the person making an economic contribution to the destination country through the ownership and/or use of capital, or by being self-employed or simply as an employee;
2. consumption movements: mobility motivated by consumption is typically distinguished by its greater frequency and shorter duration, with pleasure-related moves such as shopping, excursions and vacations manifesting a seasonal component;
capacity to
move
From Mass Migration to Mass Mobility | 9
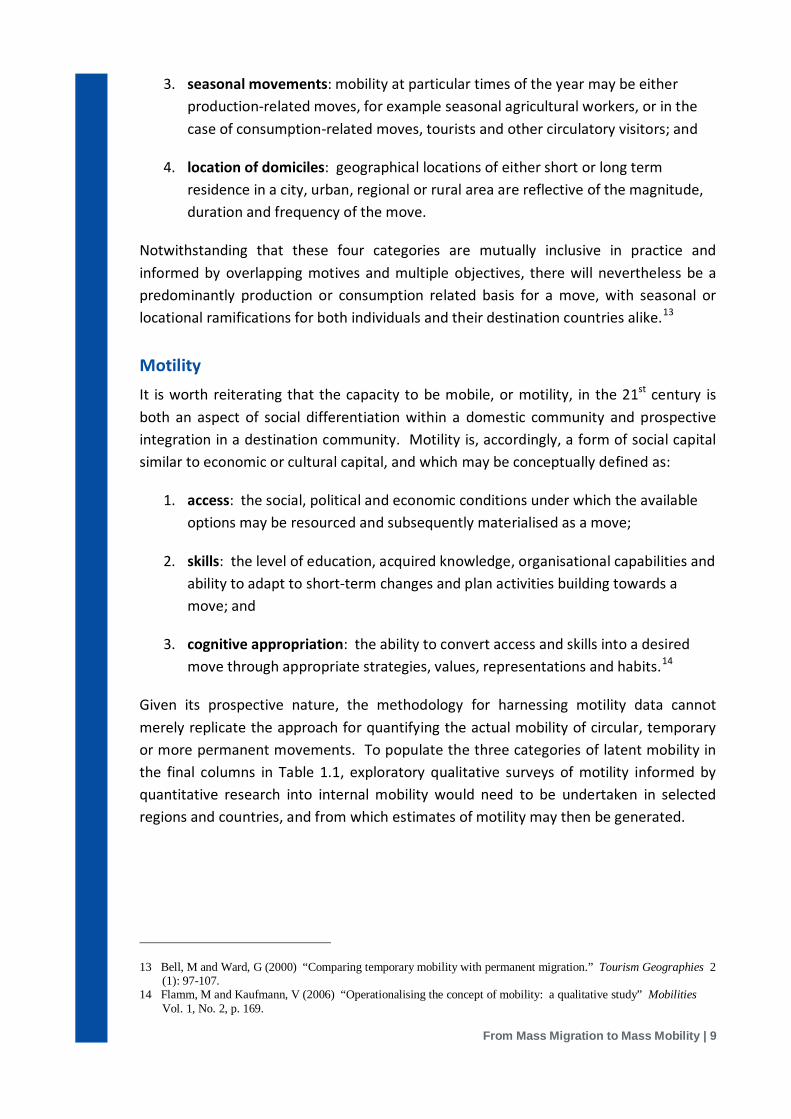
3. seasonal movements: mobility at particular times of the year may be either production-related moves, for example seasonal agricultural workers, or in the case of consumption-related moves, tourists and other circulatory visitors; and
4. location of domiciles: geographical locations of either short or long term residence in a city, urban, regional or rural area are reflective of the magnitude, duration and frequency of the move.
Notwithstanding that these four categories are mutually inclusive in practice and informed by overlapping motives and multiple objectives, there will nevertheless be a predominantly production or consumption related basis for a move, with seasonal or locational ramifications for both individuals and their destination countries alike.13
Motility It is worth reiterating that the capacity to be mobile, or motility, in the 21st century is both an aspect of social differentiation within a domestic community and prospective integration in a destination community. Motility is, accordingly, a form of social capital similar to economic or cultural capital, and which may be conceptually defined as:
1. access: the social, political and economic conditions under which the available options may be resourced and subsequently materialised as a move;
2. skills: the level of education, acquired knowledge, organisational capabilities and ability to adapt to short-term changes and plan activities building towards a move; and
3. cognitive appropriation: the ability to convert access and skills into a desired move through appropriate strategies, values, representations and habits.14
Given its prospective nature, the methodology for harnessing motility data cannot merely replicate the approach for quantifying the actual mobility of circular, temporary or more permanent movements. To populate the three categories of latent mobility in the final columns in Table 1.1, exploratory qualitative surveys of motility informed by quantitative research into internal mobility would need to be undertaken in selected regions and countries, and from which estimates of motility may then be generated.
13 Bell, M and Ward, G (2000) “Comparing temporary mobility with permanent migration.” Tourism Geographies 2 (1): 97-107.
14 Flamm, M and Kaufmann, V (2006) “Operationalising the concept of mobility: a qualitative study” Mobilities Vol. 1, No. 2, p. 169.
From Mass Migration to Mass Mobility | 10
Table 1.1 Quantifying people movements across the mobility continuum
Permanent Migration
Temporary Migration { >12 months visa} Transient Visits { < 12 months visa} Motility {effective intention & capacity}
Count N A M
Duration N A M
Frequency N A M
Count N A M
Duration N A M
Frequency N A M
Count N A M
Duration N A M
Frequency N A M
Number N A M
Duration N A M
Frequency N A M
Production movements Primary Secondary Tertiary Agricult’re Mining Health Managm’t Gov’t TOTAL Consumption movements Holidays Visits Health Educat’n TOTAL Seasonal movements 1st Q’ter 2nd Q’ter 3rd Q’ter 4th Q’ter TOTAL Location of domiciles City Urban Regional Rural TOTAL
Notes: For each category of mobility across the mobility continuum - permanent migration, temporary migration (12 months visa or more), circulatory movement
(visa under 12 months) and motility - an actual count, a duration and frequency of stay is expressed as: N (number), A (average) and M (median). Production movement occurs for the predominant purpose of an individual making some form of economic contribution in the country of destination. Consumption movement is primarily for the purpose of an individual accessing and consuming an amenity, good or service. Location of domicile is by city, urban, regional or rural place of predominant temporary residence. Seasonal movement is based on a quarter (calendar year) at each arrival - 1st quarter (January 1 to March 31), 2nd quarter (April 1 to June 30), 3rd quarter
(July 1 to September 30) and 4th quarter (October 1 to December 31).
From Mass Migration to Mass Mobility | 11
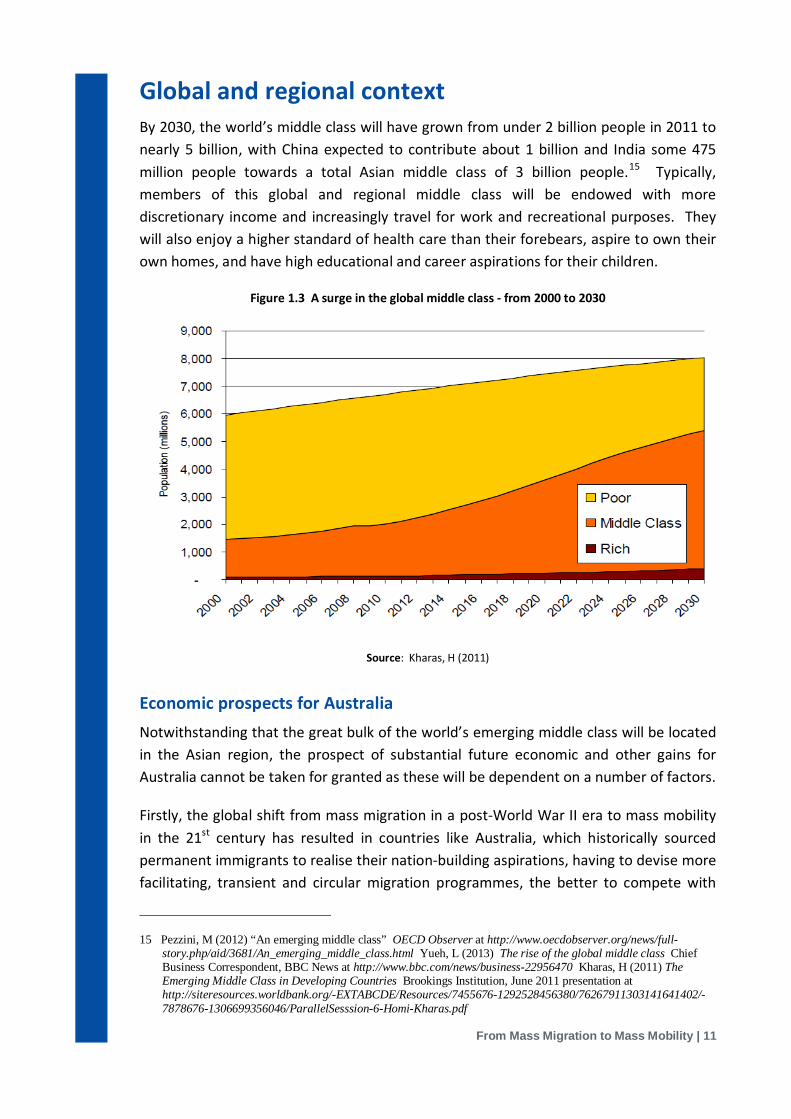
Global and regional context By 2030, the world’s middle class will have grown from under 2 billion people in 2011 to nearly 5 billion, with China expected to contribute about 1 billion and India some 475 million people towards a total Asian middle class of 3 billion people.15 Typically, members of this global and regional middle class will be endowed with more discretionary income and increasingly travel for work and recreational purposes. They will also enjoy a higher standard of health care than their forebears, aspire to own their own homes, and have high educational and career aspirations for their children.
Figure 1.3 A surge in the global middle class - from 2000 to 2030
Source: Kharas, H (2011)
Economic prospects for Australia Notwithstanding that the great bulk of the world’s emerging middle class will be located in the Asian region, the prospect of substantial future economic and other gains for Australia cannot be taken for granted as these will be dependent on a number of factors.
Firstly, the global shift from mass migration in a post-World War II era to mass mobility in the 21st century has resulted in countries like Australia, which historically sourced permanent immigrants to realise their nation-building aspirations, having to devise more facilitating, transient and circular migration programmes, the better to compete with
15 Pezzini, M (2012) “An emerging middle class” OECD Observer at http://www.oecdobserver.org/news/full-story.php/aid/3681/An_emerging_middle_class.html Yueh, L (2013) The rise of the global middle class Chief Business Correspondent, BBC News at http://www.bbc.com/news/business-22956470 Kharas, H (2011) The Emerging Middle Class in Developing Countries Brookings Institution, June 2011 presentation at http://siteresources.worldbank.org/-EXTABCDE/Resources/7455676-1292528456380/76267911303141641402/-7878676-1306699356046/ParallelSesssion-6-Homi-Kharas.pdf
From Mass Migration to Mass Mobility | 12
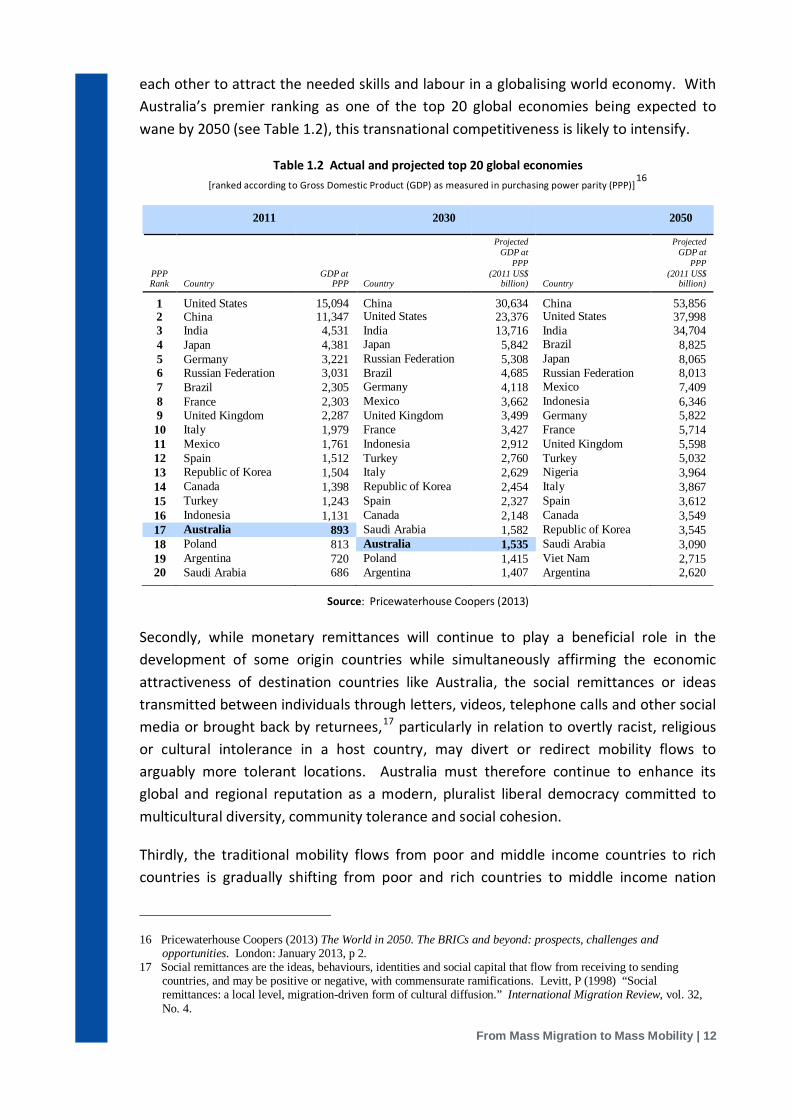
each other to attract the needed skills and labour in a globalising world economy. With Australia’s premier ranking as one of the top 20 global economies being expected to wane by 2050 (see Table 1.2), this transnational competitiveness is likely to intensify.
Table 1.2 Actual and projected top 20 global economies [ranked according to Gross Domestic Product (GDP) as measured in purchasing power parity (PPP)]
16
2011 2030 2050
PPP
GDP at
Projected
GDP at PPP
(2011 US$
Projected
GDP at PPP
(2011 US$ Rank Country PPP Country billion) Country billion)
1 United States 15,094 China 30,634 China 53,856 2 China 11,347 United States 23,376 United States 37,998 3 India 4,531 India 13,716 India 34,704 4 Japan 4,381 Japan 5,842 Brazil 8,825 5 Germany 3,221 Russian Federation 5,308 Japan 8,065 6 Russian Federation 3,031 Brazil 4,685 Russian Federation 8,013 7 Brazil 2,305 Germany 4,118 Mexico 7,409 8 France 2,303 Mexico 3,662 Indonesia 6,346 9 United Kingdom 2,287 United Kingdom 3,499 Germany 5,822 10 Italy 1,979 France 3,427 France 5,714 11 Mexico 1,761 Indonesia 2,912 United Kingdom 5,598 12 Spain 1,512 Turkey 2,760 Turkey 5,032 13 Republic of Korea 1,504 Italy 2,629 Nigeria 3,964 14 Canada 1,398 Republic of Korea 2,454 Italy 3,867 15 Turkey 1,243 Spain 2,327 Spain 3,612 16 Indonesia 1,131 Canada 2,148 Canada 3,549 17 Australia 893 Saudi Arabia 1,582 Republic of Korea 3,545 18 Poland 813 Australia 1,535 Saudi Arabia 3,090 19 Argentina 720 Poland 1,415 Viet Nam 2,715 20 Saudi Arabia 686 Argentina 1,407 Argentina 2,620
Source: Pricewaterhouse Coopers (2013)
Secondly, while monetary remittances will continue to play a beneficial role in the development of some origin countries while simultaneously affirming the economic attractiveness of destination countries like Australia, the social remittances or ideas transmitted between individuals through letters, videos, telephone calls and other social media or brought back by returnees,17 particularly in relation to overtly racist, religious or cultural intolerance in a host country, may divert or redirect mobility flows to arguably more tolerant locations. Australia must therefore continue to enhance its global and regional reputation as a modern, pluralist liberal democracy committed to multicultural diversity, community tolerance and social cohesion.
Thirdly, the traditional mobility flows from poor and middle income countries to rich countries is gradually shifting from poor and rich countries to middle income nation
16 Pricewaterhouse Coopers (2013) The World in 2050. The BRICs and beyond: prospects, challenges and opportunities. London: January 2013, p 2.
17 Social remittances are the ideas, behaviours, identities and social capital that flow from receiving to sending countries, and may be positive or negative, with commensurate ramifications. Levitt, P (1998) “Social remittances: a local level, migration-driven form of cultural diffusion.” International Migration Review, vol. 32, No. 4.

From Mass Migration to Mass Mobility | 13
states. The latter are not only offering the prospect of economic betterment for the poor, but also new challenges, opportunities and lifestyle changes for those relocating from developed countries. Increasingly also, rising middle income countries such as China, Singapore, Malaysia and Indonesia are competing with high income Western countries for desirable cohorts such as students and skilled migrants, with the emerging motto for rich countries being not so much ‘who we want’ as ‘who chooses us’.18
Fourthly, the development and regulation of Australia’s visa and related travel programmes have significant implications for future mobility flows, particularly for the burgeoning Asian middle class in our immediate region. Traditional and electronic visas, electronic travel authorities, transit arrangements and the automated border processing SmartGate system, as well as any bilateral commitments to reciprocal health care and other agreements, will differentially enhance or dampen the extent and frequency of Australia’s mobility flows in the 21st century.
Global value chains and productivity Mobility flows are also implicated in global value chains (GVCs) or networks of production located across multiple countries, which now account for 80 per cent of world trade.19 In a commissioned report to the G20 Trade Ministers’ Meeting in Sydney in July 2014, the OECD, WTO and World Bank Group noted that:
“The rise of GVCs has produced a new ‘trade-investment-services-know-how nexus’ or the intertwining of trade in intermediates, the movement of capital and ideas, and demand for services to coordinate the dispersed production and distribution of goods and services. As such, GVCs are becoming increasingly influential in determining future trade and FDI patterns, as well as growth opportunities. Policy needs to respond to this new reality and promote a business environment that not only makes a country attractive for location of GVCs, but also facilitates upgrading opportunities over time.”20
The mobility flows impacting on, and influenced by, the internationally joined-up production arrangements have significant implications for the competitiveness of Australia’s industries, productivity and output growth, with a contemporary world economy characterised by GVCs continuing to present Australian businesses with significant opportunities, not least to capitalise on high value stages of, or niches within, these transnationalised production webs.
18 ASEAN Workshop (2014) Migration, mobility and governance in ASEAN: An Australian perspective Workshop sponsored by the Department of Immigration and Border Protection (DIBP) and hosted by the Australian Population and Migration Research Centre, University of Adelaide at the Crawford School of Public Policy, ANU College of Asia & the Pacific, Australian National University on 17-18 November 2014.
19 Commonwealth Department of Industry, Office of the Chief Economist (2014) Australian Industry Report 2014 Canberra, p 16. http://www.industry.gov.au/industry/Office-of-the-Chief-Economist/Publications/Documents/-Australian-Industry-Report.pdf
20 OECD, WTO and World Bank Group (2014) Global value chains: challenges, opportunities and implications for policy. Report prepared for submission to the G20 Trade Ministers Meeting in Sydney, Australia, on 19 July 2014, p 3.
From Mass Migration to Mass Mobility | 14
The prominence and ongoing expansion of GVCs additionally present Australian businesses with the opportunity to source inputs that are likely to be cheaper than domestic equivalents or of a higher quality, and with the further potential to stimulate innovation, boost productivity and contribute to Australia’s output growth.21
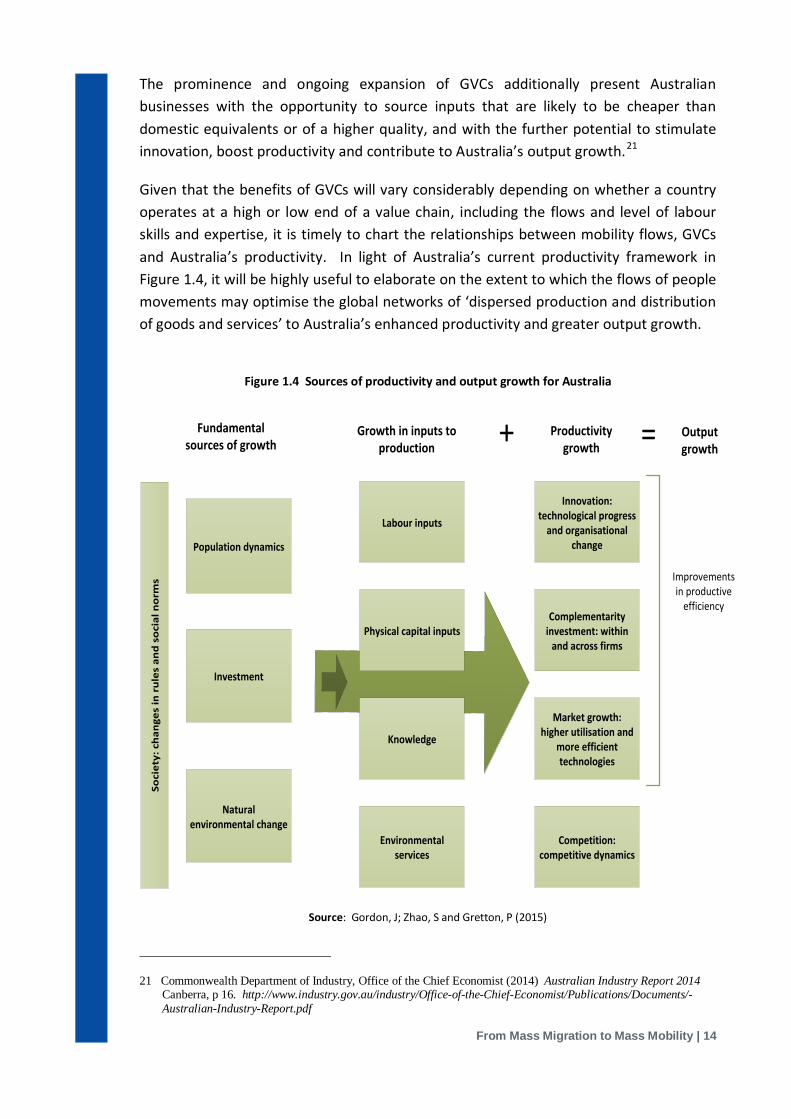
Given that the benefits of GVCs will vary considerably depending on whether a country operates at a high or low end of a value chain, including the flows and level of labour skills and expertise, it is timely to chart the relationships between mobility flows, GVCs and Australia’s productivity. In light of Australia’s current productivity framework in Figure 1.4, it will be highly useful to elaborate on the extent to which the flows of people movements may optimise the global networks of ‘dispersed production and distribution of goods and services’ to Australia’s enhanced productivity and greater output growth.
Figure 1.4 Sources of productivity and output growth for Australia
Source: Gordon, J; Zhao, S and Gretton, P (2015)
21 Commonwealth Department of Industry, Office of the Chief Economist (2014) Australian Industry Report 2014 Canberra, p 16. http://www.industry.gov.au/industry/Office-of-the-Chief-Economist/Publications/Documents/-Australian-Industry-Report.pdf
Labour inputs
Physical capital inputs
Knowledge
Environmental services
Innovation: technological progress
and organisational change
Complementarity investment: within
and across firms
Market growth: higher utilisation and
more efficient technologies
Competition: competitive dynamics
Improvements in productive
efficiency
Fundamental sources of growth
Growth in inputs to production
Productivity growth+ = Output
growth
Population dynamics
Investment
Natural environmental change
Soci
ety:
cha
nges
in r
ules
and
soc
ial n
orm
s
From Mass Migration to Mass Mobility | 15
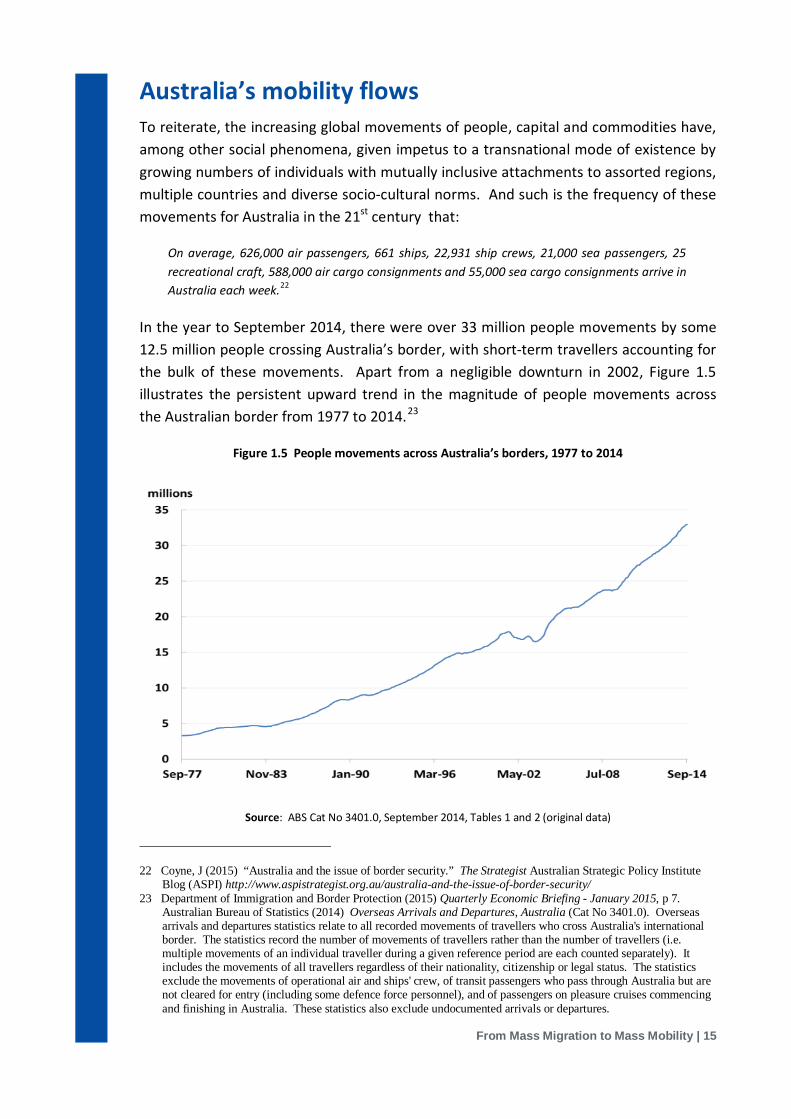
Australia’s mobility flows To reiterate, the increasing global movements of people, capital and commodities have, among other social phenomena, given impetus to a transnational mode of existence by growing numbers of individuals with mutually inclusive attachments to assorted regions, multiple countries and diverse socio-cultural norms. And such is the frequency of these movements for Australia in the 21st century that:
On average, 626,000 air passengers, 661 ships, 22,931 ship crews, 21,000 sea passengers, 25 recreational craft, 588,000 air cargo consignments and 55,000 sea cargo consignments arrive in Australia each week.22
In the year to September 2014, there were over 33 million people movements by some 12.5 million people crossing Australia’s border, with short-term travellers accounting for the bulk of these movements. Apart from a negligible downturn in 2002, Figure 1.5 illustrates the persistent upward trend in the magnitude of people movements across the Australian border from 1977 to 2014.23
Figure 1.5 People movements across Australia’s borders, 1977 to 2014
Source: ABS Cat No 3401.0, September 2014, Tables 1 and 2 (original data)
22 Coyne, J (2015) “Australia and the issue of border security.” The Strategist Australian Strategic Policy Institute Blog (ASPI) http://www.aspistrategist.org.au/australia-and-the-issue-of-border-security/
23 Department of Immigration and Border Protection (2015) Quarterly Economic Briefing - January 2015, p 7. Australian Bureau of Statistics (2014) Overseas Arrivals and Departures, Australia (Cat No 3401.0). Overseas arrivals and departures statistics relate to all recorded movements of travellers who cross Australia's international border. The statistics record the number of movements of travellers rather than the number of travellers (i.e. multiple movements of an individual traveller during a given reference period are each counted separately). It includes the movements of all travellers regardless of their nationality, citizenship or legal status. The statistics exclude the movements of operational air and ships' crew, of transit passengers who pass through Australia but are not cleared for entry (including some defence force personnel), and of passengers on pleasure cruises commencing and finishing in Australia. These statistics also exclude undocumented arrivals or departures.

From Mass Migration to Mass Mobility | 16
In Figure 1.6, the higher trend line and data points indicate the increasing number of movements across Australia’s border, with the lower trend line and data points referring to the growing number of people crossing the border. More people are travelling into, and out of, Australia and they are are doing so more often.
Figure 1.6 Trend movements across Australia’s borders, 1977 to 2014
Source: ABS Cat No 3401.0, September 2014, Tables 1 and 2 (original data) and DIBP data
In 1977, some 2.7 million people undertook approximately 3 million movements across Australia’s border, which is an average of 1.1 moves per person. By 2014, some 12.9 million people traversed the border and undertook about 33 million movements or 2.56 border crossings per person on average. This increasing magnitude and frequency of mobility reflect the wider trends brought on by:
The globalisation of capital, the transformation of international travel and communications systems, the instant worldwide distribution of information, the increasing levels of education, the internationalisation of many labour markets and the creation of political and environmental refugees, are among only a few of the processes and trends which are producing an exponential increase in all forms of international population movements and opening up such movement to a much broader spectrum of the world’s population . . . . These changes not only have important implications for people wishing to come to Australia, but also for Australian residents wishing to move elsewhere.24
24 Hugo, G (2004) “A new paradigm of international migration: implications for migration policy and planning in Australia.” Research Paper No 10 2003-2004 Information and Research Services, Parliamentary Library, p 2.
From Mass Migration to Mass Mobility | 17
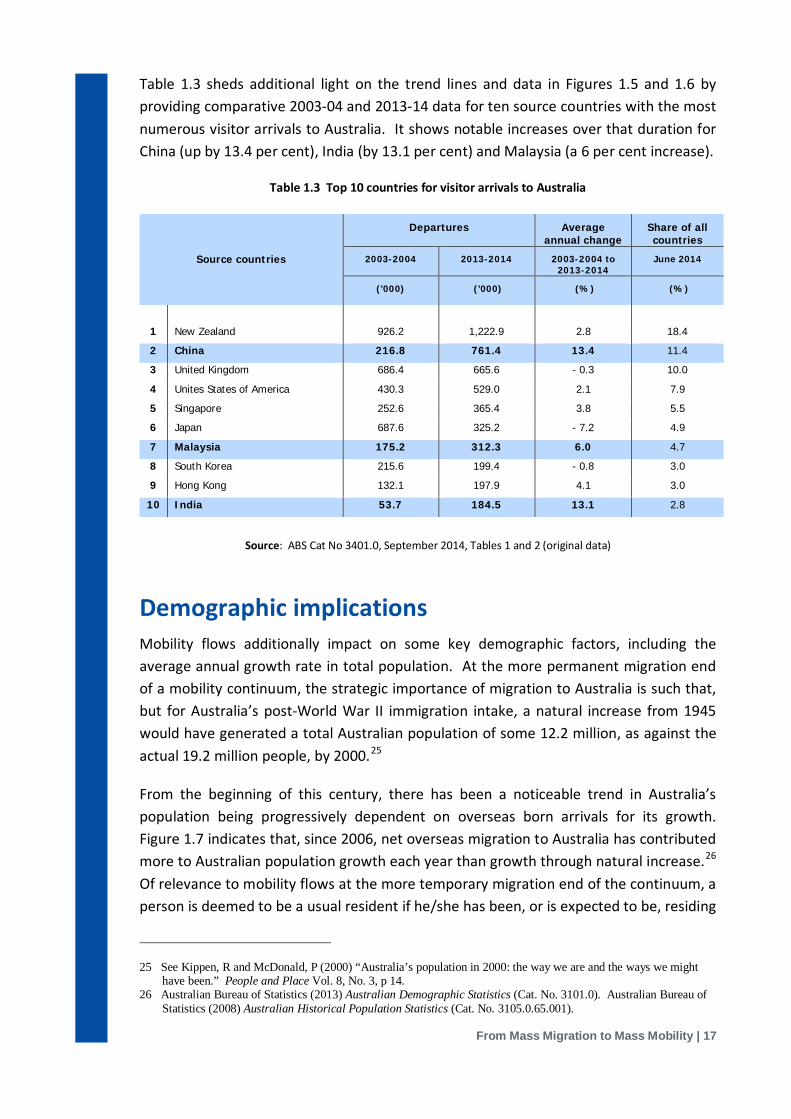
Table 1.3 sheds additional light on the trend lines and data in Figures 1.5 and 1.6 by providing comparative 2003-04 and 2013-14 data for ten source countries with the most numerous visitor arrivals to Australia. It shows notable increases over that duration for China (up by 13.4 per cent), India (by 13.1 per cent) and Malaysia (a 6 per cent increase).
Table 1.3 Top 10 countries for visitor arrivals to Australia
Source countries
Departures
Average annual change
Share of all countries
2003-2004
2013-2014
2003-2004 to 2013-2014
June 2014
(’000)
(’000)
(%)
(%)
1
New Zealand
926.2
1,222.9
2.8
18.4
2 China 216.8 761.4 13.4 11.4
3 United Kingdom 686.4 665.6 - 0.3 10.0
4 Unites States of America 430.3 529.0 2.1 7.9
5 Singapore 252.6 365.4 3.8 5.5
6 Japan 687.6 325.2 - 7.2 4.9
7 Malaysia 175.2 312.3 6.0 4.7
8 South Korea 215.6 199.4 - 0.8 3.0
9 Hong Kong 132.1 197.9 4.1 3.0
10 India 53.7 184.5 13.1 2.8
Source: ABS Cat No 3401.0, September 2014, Tables 1 and 2 (original data)
Demographic implications Mobility flows additionally impact on some key demographic factors, including the average annual growth rate in total population. At the more permanent migration end of a mobility continuum, the strategic importance of migration to Australia is such that, but for Australia’s post-World War II immigration intake, a natural increase from 1945 would have generated a total Australian population of some 12.2 million, as against the actual 19.2 million people, by 2000.25
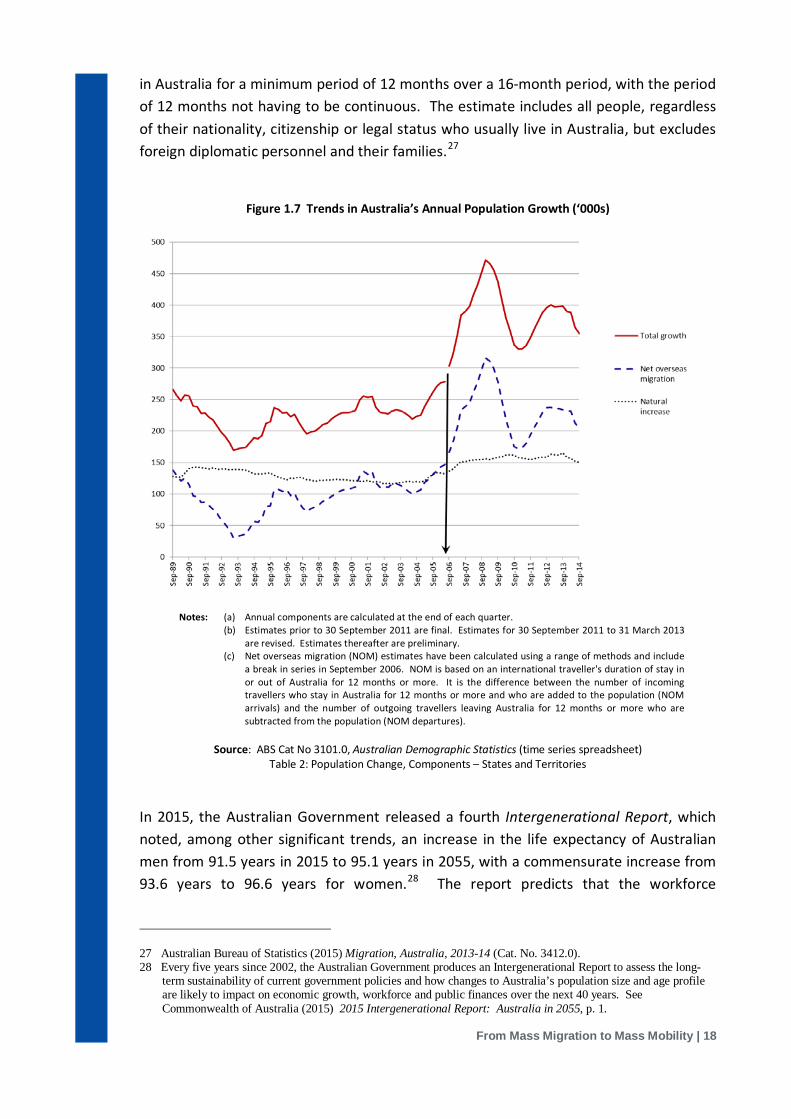
From the beginning of this century, there has been a noticeable trend in Australia’s population being progressively dependent on overseas born arrivals for its growth. Figure 1.7 indicates that, since 2006, net overseas migration to Australia has contributed more to Australian population growth each year than growth through natural increase.26 Of relevance to mobility flows at the more temporary migration end of the continuum, a person is deemed to be a usual resident if he/she has been, or is expected to be, residing
25 See Kippen, R and McDonald, P (2000) “Australia’s population in 2000: the way we are and the ways we might have been.” People and Place Vol. 8, No. 3, p 14.
26 Australian Bureau of Statistics (2013) Australian Demographic Statistics (Cat. No. 3101.0). Australian Bureau of Statistics (2008) Australian Historical Population Statistics (Cat. No. 3105.0.65.001).
From Mass Migration to Mass Mobility | 18
in Australia for a minimum period of 12 months over a 16-month period, with the period of 12 months not having to be continuous. The estimate includes all people, regardless of their nationality, citizenship or legal status who usually live in Australia, but excludes foreign diplomatic personnel and their families.27
Figure 1.7 Trends in Australia’s Annual Population Growth (‘000s)
Notes:
(a) Annual components are calculated at the end of each quarter. (b) Estimates prior to 30 September 2011 are final. Estimates for 30 September 2011 to 31 March 2013
are revised. Estimates thereafter are preliminary. (c) Net overseas migration (NOM) estimates have been calculated using a range of methods and include
a break in series in September 2006. NOM is based on an international traveller's duration of stay in or out of Australia for 12 months or more. It is the difference between the number of incoming travellers who stay in Australia for 12 months or more and who are added to the population (NOM arrivals) and the number of outgoing travellers leaving Australia for 12 months or more who are subtracted from the population (NOM departures).
Source: ABS Cat No 3101.0, Australian Demographic Statistics (time series spreadsheet)
Table 2: Population Change, Components – States and Territories
In 2015, the Australian Government released a fourth Intergenerational Report, which noted, among other significant trends, an increase in the life expectancy of Australian men from 91.5 years in 2015 to 95.1 years in 2055, with a commensurate increase from 93.6 years to 96.6 years for women.28 The report predicts that the workforce
27 Australian Bureau of Statistics (2015) Migration, Australia, 2013-14 (Cat. No. 3412.0). 28 Every five years since 2002, the Australian Government produces an Intergenerational Report to assess the long-
term sustainability of current government policies and how changes to Australia’s population size and age profile are likely to impact on economic growth, workforce and public finances over the next 40 years. See Commonwealth of Australia (2015) 2015 Intergenerational Report: Australia in 2055, p. 1.
From Mass Migration to Mass Mobility | 19
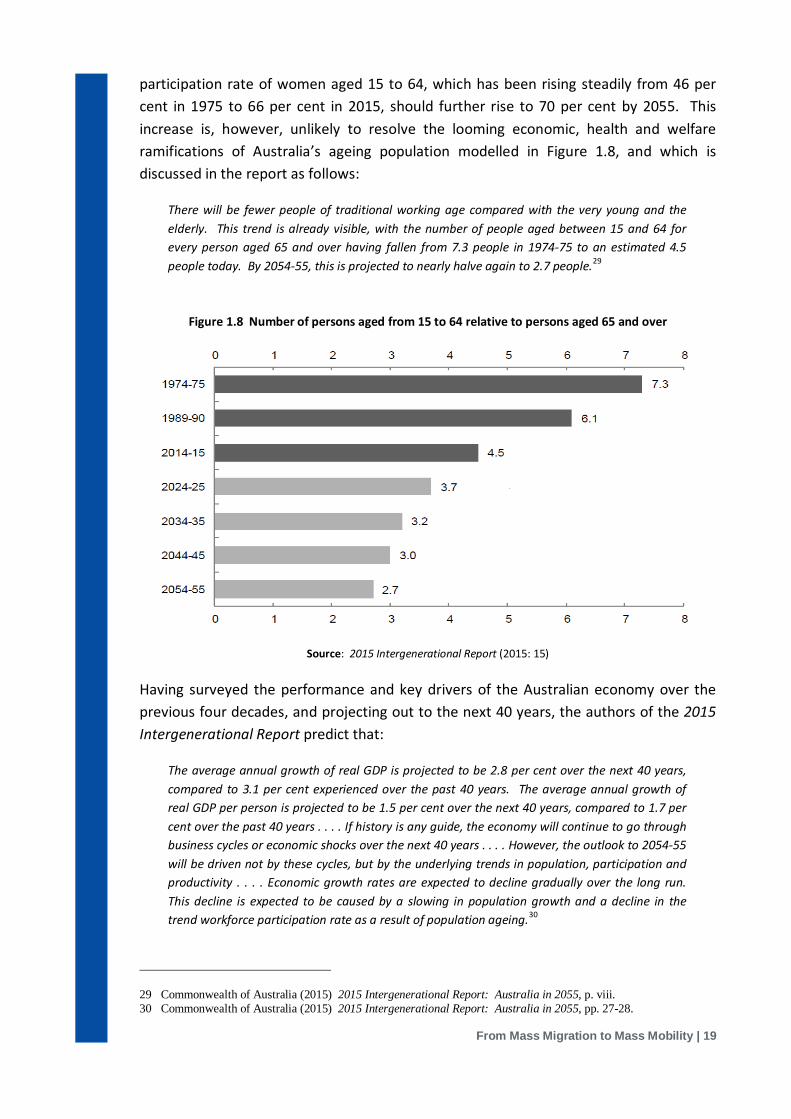
participation rate of women aged 15 to 64, which has been rising steadily from 46 per cent in 1975 to 66 per cent in 2015, should further rise to 70 per cent by 2055. This increase is, however, unlikely to resolve the looming economic, health and welfare ramifications of Australia’s ageing population modelled in Figure 1.8, and which is discussed in the report as follows:
There will be fewer people of traditional working age compared with the very young and the elderly. This trend is already visible, with the number of people aged between 15 and 64 for every person aged 65 and over having fallen from 7.3 people in 1974-75 to an estimated 4.5 people today. By 2054-55, this is projected to nearly halve again to 2.7 people.29
Figure 1.8 Number of persons aged from 15 to 64 relative to persons aged 65 and over
Source: 2015 Intergenerational Report (2015: 15)
Having surveyed the performance and key drivers of the Australian economy over the previous four decades, and projecting out to the next 40 years, the authors of the 2015 Intergenerational Report predict that:
The average annual growth of real GDP is projected to be 2.8 per cent over the next 40 years, compared to 3.1 per cent experienced over the past 40 years. The average annual growth of real GDP per person is projected to be 1.5 per cent over the next 40 years, compared to 1.7 per cent over the past 40 years . . . . If history is any guide, the economy will continue to go through business cycles or economic shocks over the next 40 years . . . . However, the outlook to 2054-55 will be driven not by these cycles, but by the underlying trends in population, participation and productivity . . . . Economic growth rates are expected to decline gradually over the long run. This decline is expected to be caused by a slowing in population growth and a decline in the trend workforce participation rate as a result of population ageing.30
29 Commonwealth of Australia (2015) 2015 Intergenerational Report: Australia in 2055, p. viii. 30 Commonwealth of Australia (2015) 2015 Intergenerational Report: Australia in 2055, pp. 27-28.

From Mass Migration to Mass Mobility | 20
Conclusion This concept paper has outlined, from an Australian perspective, some strategic aspects of the exponentially increasing mobility flows in the 21st century. Globally, there is a vast ebb and flow of some one billion people, or one in seven of the world’s population, who either live outside their respective countries or broader regions of origin.
Massive technological improvements and rapidly falling costs in modern transport and communication have, by the close of the 20th century, transformed the previous epoch of mass migration into a contemporary era of mass mobility, with dynamic inter-dependencies, circulatory flows and transient mobility corridors. This has wide-ranging strategic, policy and operational ramifications for governance, security and the border integrity of contemporary nation-states.
To the extent that human mobility continues to be understood through the traditional prism of mass migration as a more or less permanent linear trajectory from an origin to a destination country, the border must accordingly be objectified, regulated and governed as the fixed outer perimeters of a fortress nation-state.
To the extent, however, that human mobility in the 21st century is conceptualised, mapped and charted as a web of transnational inter-dependencies and circulatory flows of increasingly transient movements, the border must be more innovatively managed as a set of social relations and governance strategies straddling a globally porous, fluid and dynamic continuum anchored in, and mediated by, the modern nation state.