Embed Size (px)
Citation preview
H1 2014 Results - Analyst & Investor Presentation
Mobistar always in touch*
2
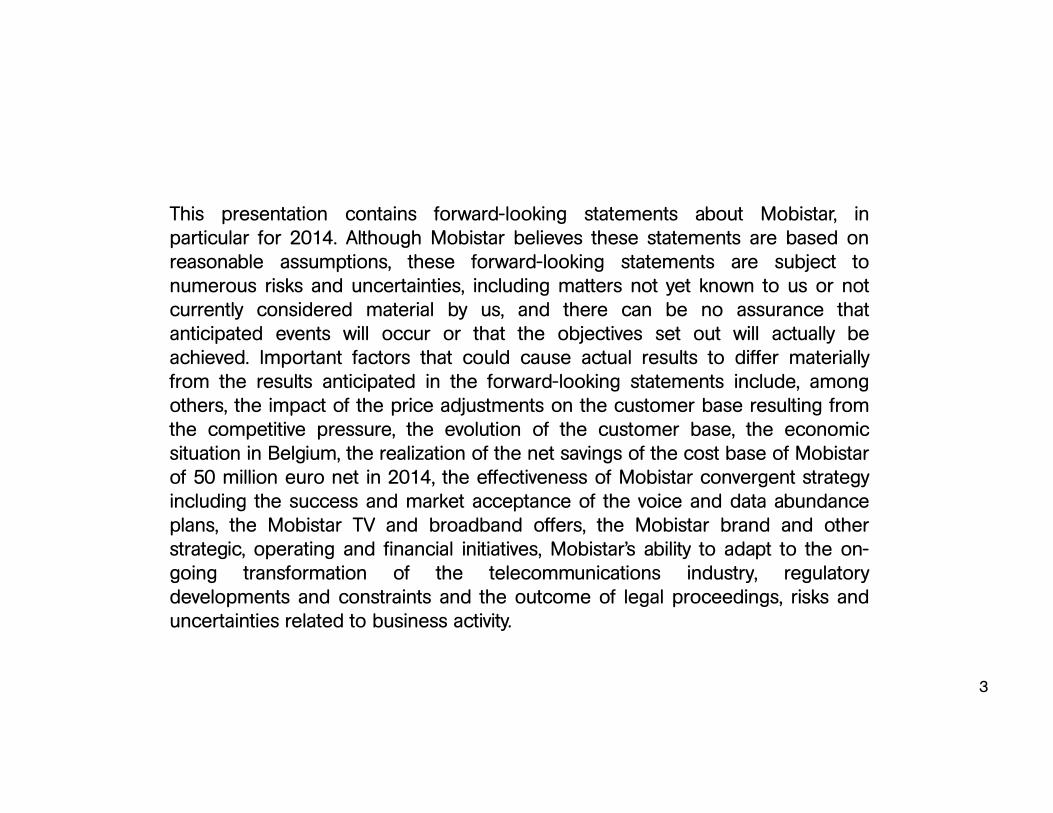
This presentation contains forward-looking statements about Mobistar, inparticular for 2014. Although Mobistar believes these statements are based onreasonable assumptions, these forward-looking statements are subject tonumerous risks and uncertainties, including matters not yet known to us or notcurrently considered material by us, and there can be no assurance thatanticipated events will occur or that the objectives set out will actually beachieved. Important factors that could cause actual results to differ materiallyfrom the results anticipated in the forward-looking statements include, amongothers, the impact of the price adjustments on the customer base resulting fromthe competitive pressure, the evolution of the customer base, the economicsituation in Belgium, the realization of the net savings of the cost base of Mobistarof 50 million euro net in 2014, the effectiveness of Mobistar convergent strategyincluding the success and market acceptance of the voice and data abundanceplans, the Mobistar TV and broadband offers, the Mobistar brand and otherstrategic, operating and financial initiatives, Mobistar’s ability to adapt to the on-going transformation of the telecommunications industry, regulatorydevelopments and constraints and the outcome of legal proceedings, risks anduncertainties related to business activity.
3
Mobistar’s Transformation:Accelerating Momentum
4
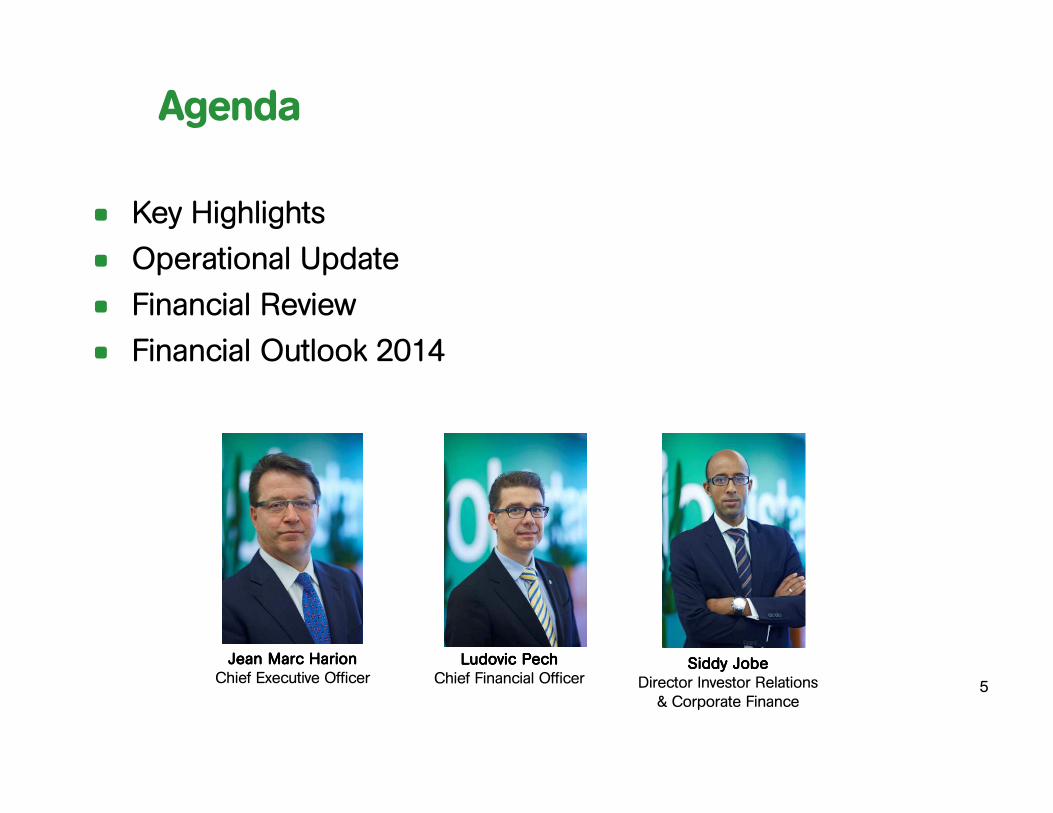
Agenda
• Key Highlights
• Operational Update
• Financial Review
• Financial Outlook 2014
Jean Marc HarionJean Marc HarionJean Marc HarionJean Marc HarionChief Executive Officer
Siddy JobeSiddy JobeSiddy JobeSiddy JobeDirector Investor Relations
& Corporate Finance
Ludovic PechLudovic PechLudovic PechLudovic PechChief Financial Officer
5
‘Mobistar’s progress confirms our path is right and we remain reasonably optimistic going forward’
Key HighlightsJean-Marc Harion
6
Delivering on
Transformation
Financial & KPI’s in line with guidance
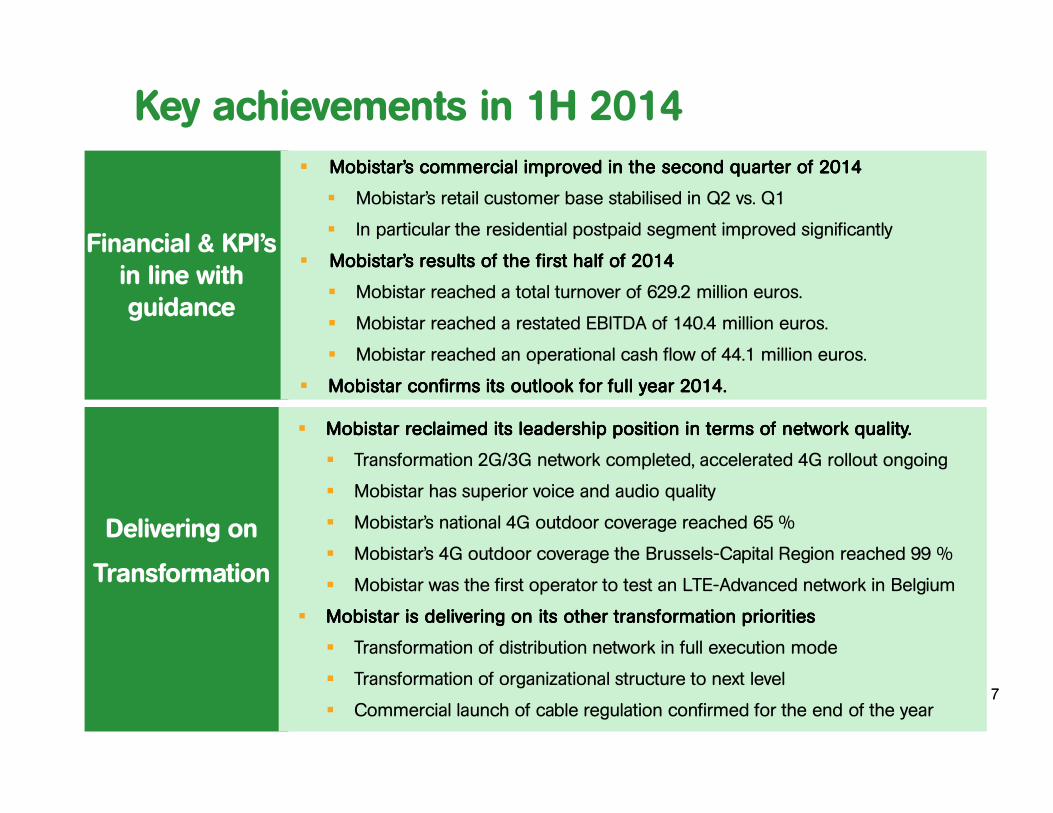
� Mobistar’s commercial improved in the second quarter of 2014Mobistar’s commercial improved in the second quarter of 2014Mobistar’s commercial improved in the second quarter of 2014Mobistar’s commercial improved in the second quarter of 2014
� Mobistar’s retail customer base stabilised in Q2 vs. Q1
� In particular the residential postpaid segment improved significantly
� Mobistar’s results of the first half of 2014 Mobistar’s results of the first half of 2014 Mobistar’s results of the first half of 2014 Mobistar’s results of the first half of 2014
� Mobistar reached a total turnover of 629.2 million euros.
� Mobistar reached a restated EBITDA of 140.4 million euros.
� Mobistar reached an operational cash flow of 44.1 million euros.
� Mobistar confirms its outlook for full year 2014.Mobistar confirms its outlook for full year 2014.Mobistar confirms its outlook for full year 2014.Mobistar confirms its outlook for full year 2014.
� Mobistar reclaimed its leadership position in terms of network quality.Mobistar reclaimed its leadership position in terms of network quality.Mobistar reclaimed its leadership position in terms of network quality.Mobistar reclaimed its leadership position in terms of network quality.
� Transformation 2G/3G network completed, accelerated 4G rollout ongoing
� Mobistar has superior voice and audio quality
� Mobistar’s national 4G outdoor coverage reached 65 %
� Mobistar’s 4G outdoor coverage the Brussels-Capital Region reached 99 %
� Mobistar was the first operator to test an LTE-Advanced network in Belgium
� Mobistar is delivering on its other transformation prioritiesMobistar is delivering on its other transformation prioritiesMobistar is delivering on its other transformation prioritiesMobistar is delivering on its other transformation priorities
� Transformation of distribution network in full execution mode
� Transformation of organizational structure to next level
� Commercial launch of cable regulation confirmed for the end of the year
Key achievements in 1H 2014
7
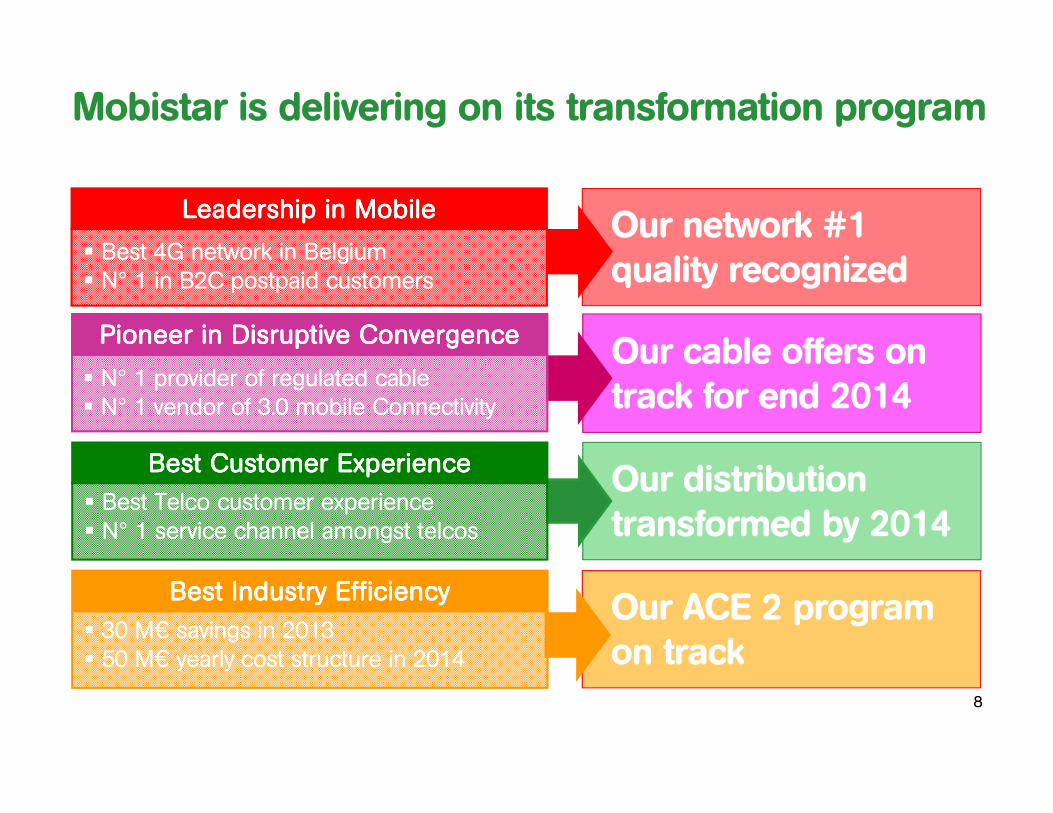
Our distribution transformed by 2014
Our cable offers on track for end 2014
Our network #1 quality recognized
Leadership in MobileLeadership in MobileLeadership in MobileLeadership in Mobile
� Best 4G network in Belgium� N° 1 in B2C postpaid customers
Best Customer ExperienceBest Customer ExperienceBest Customer ExperienceBest Customer Experience
� Best Telco customer experience� N° 1 service channel amongst telcos
Pioneer in Disruptive ConvergencePioneer in Disruptive ConvergencePioneer in Disruptive ConvergencePioneer in Disruptive Convergence
� N° 1 provider of regulated cable� N° 1 vendor of 3.0 mobile Connectivity
Best Industry EfficiencyBest Industry EfficiencyBest Industry EfficiencyBest Industry Efficiency
� 30 M€ savings in 2013� 50 M€ yearly cost structure in 2014
Our ACE 2 program on track
Mobistar is delivering on its transformation program
8
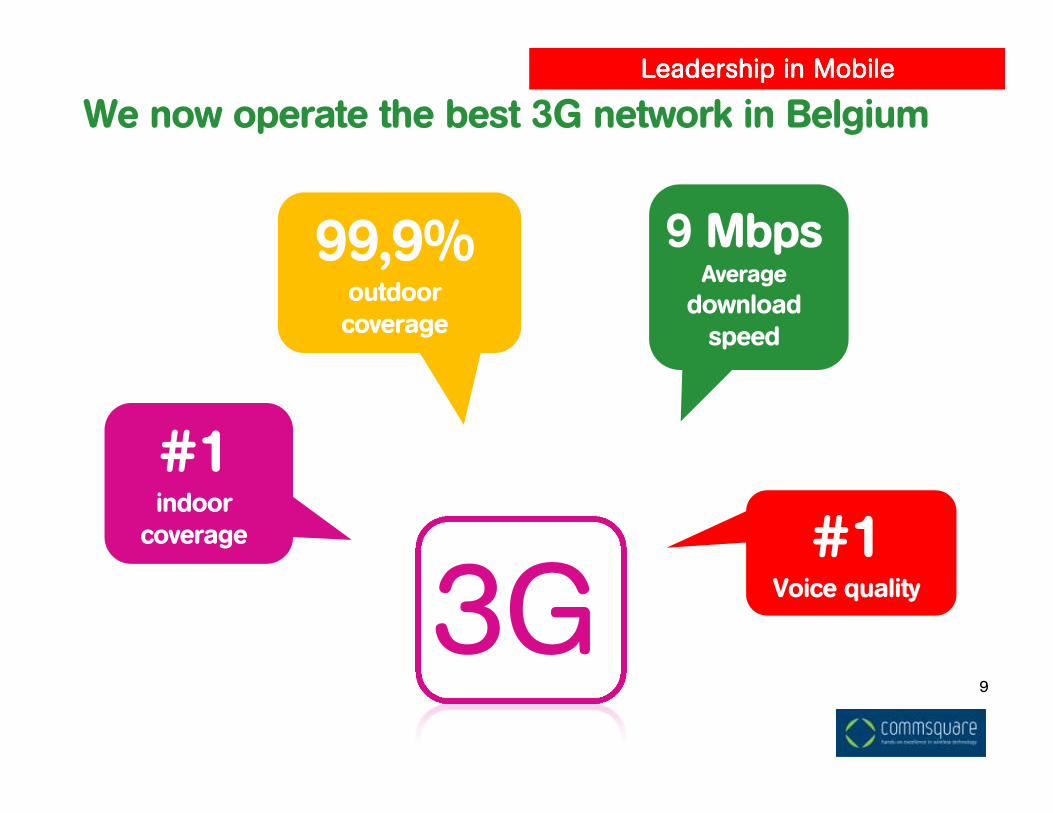
3G
99,9%outdoorcoverage
#1indoor
coverage
Leadership in MobileLeadership in MobileLeadership in MobileLeadership in Mobile
9 MbpsAverage
download speed
#1Voice quality
We now operate the best 3G network in Belgium
9
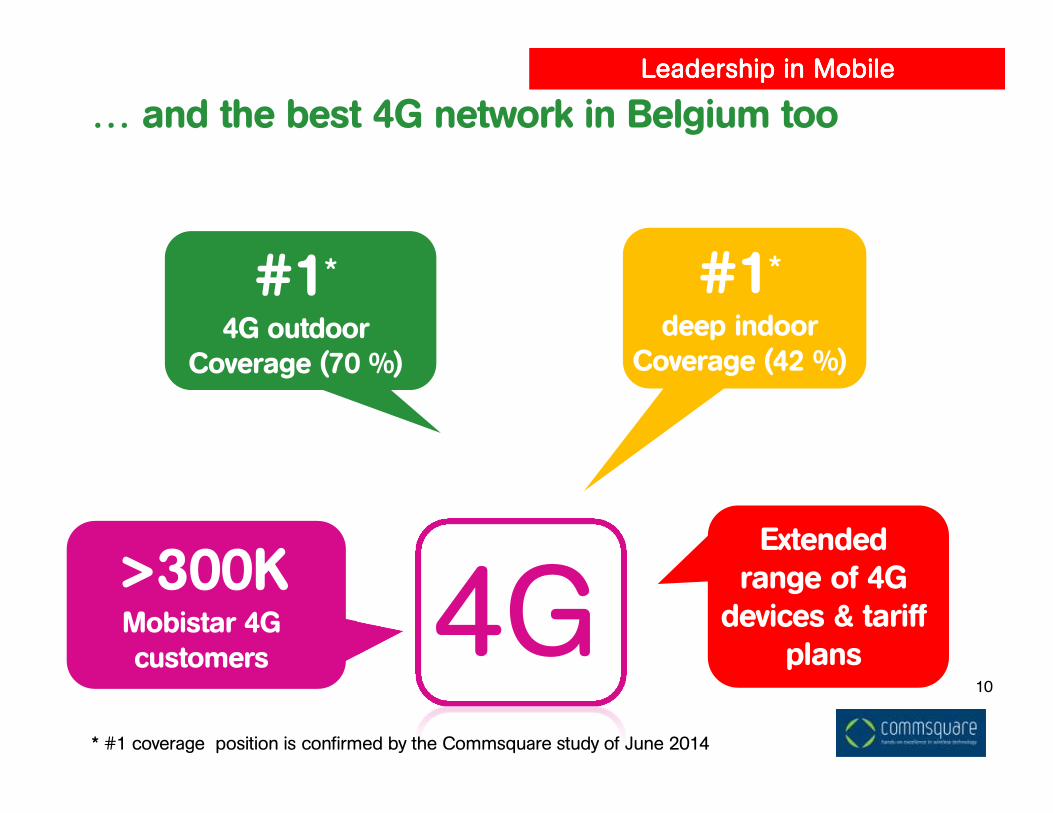
>300KMobistar 4G customers
#1*
4G outdoorCoverage (70 %)
4G
Leadership in MobileLeadership in MobileLeadership in MobileLeadership in Mobile
#1*
deep indoorCoverage (42 %)
… and the best 4G network in Belgium too
Extended range of 4G
devices & tariff plans
10
* #1 coverage position is confirmed by the Commsquare study of June 2014
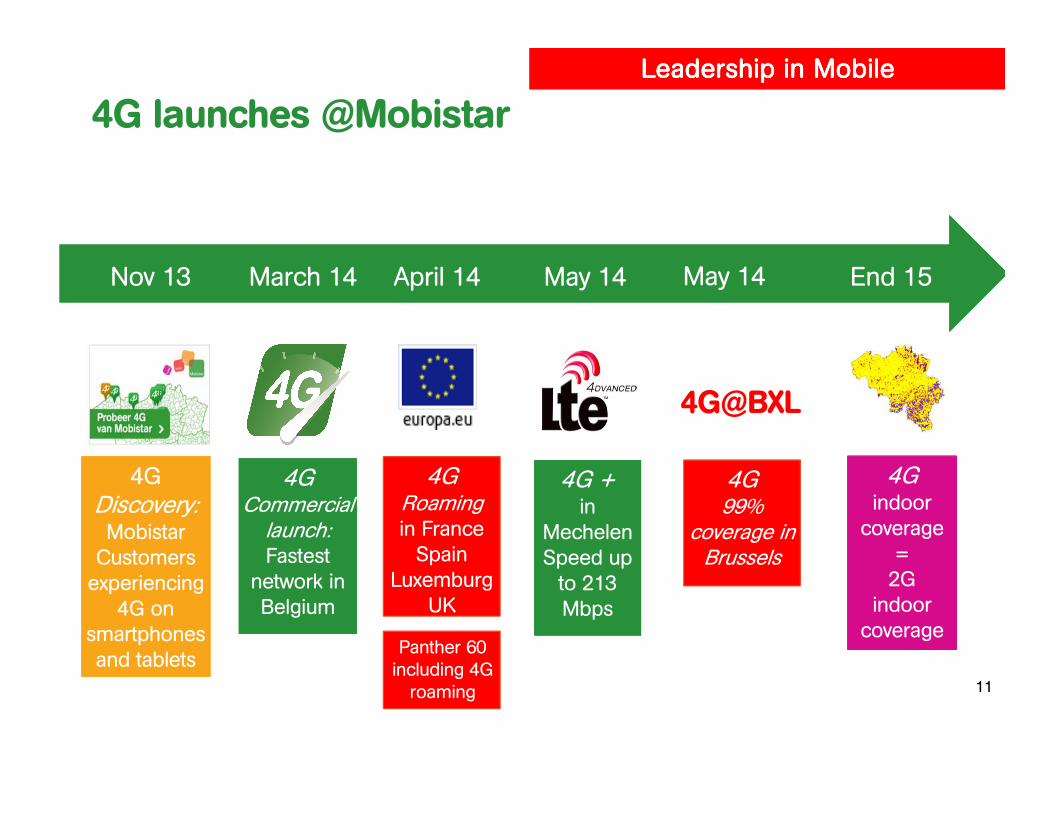
4Gindoor
coverage =2G
indoor coverage
Nov 13
experiencing
smartphones
4G Discovery: MobistarCustomers experiencing
4G on smartphones and tablets
March 14 End 15
4GCommercial launch: Fastest
network in Belgium
4GCommercial launch: Fastest
network in Belgium
April 14
UK
4GRoaming in France Spain
LuxemburgUK
Panther 60 including 4G roaming
4G + in
MechelenSpeed up to 213 Mbps
4G + in
MechelenSpeed up to 213 Mbps
May 14
coverage in
4G99%
coverage in Brussels
May 14
4G@BXL
Leadership in MobileLeadership in MobileLeadership in MobileLeadership in Mobile
4G launches @Mobistar
11
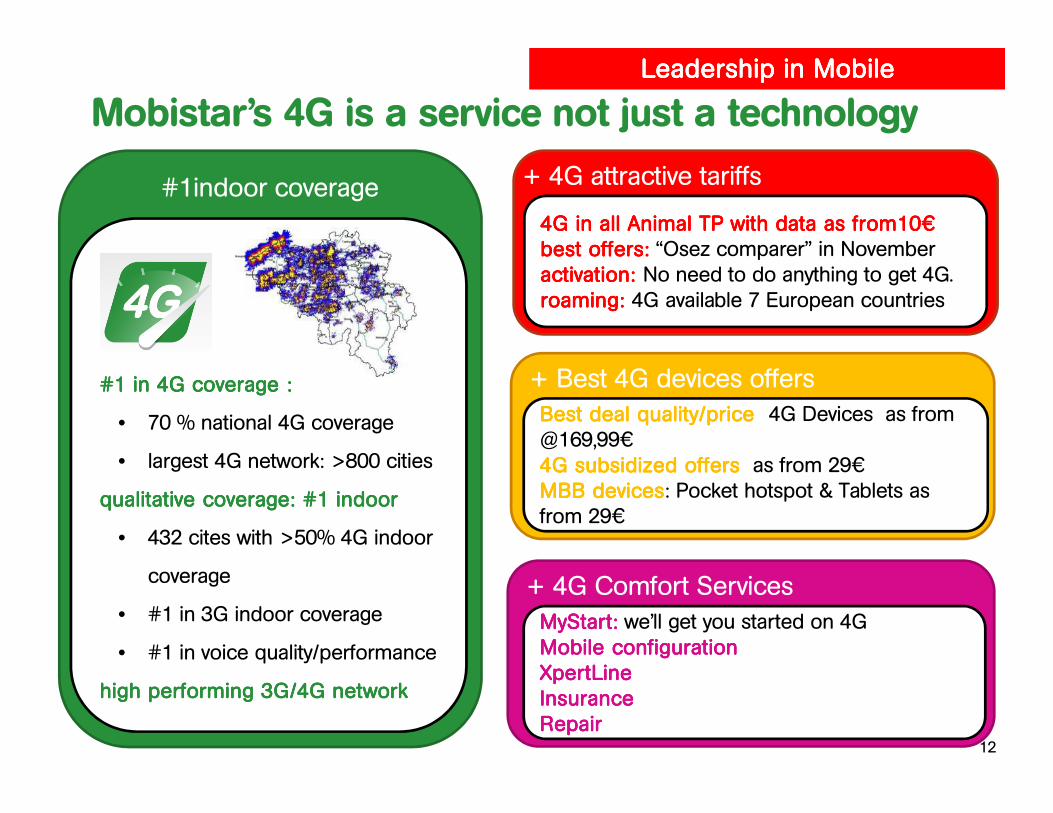
#1indoor coverage
#1 in 4G coverage : #1 in 4G coverage : #1 in 4G coverage : #1 in 4G coverage :
• 70 % national 4G coverage
• largest 4G network: >800 cities
qualitative coverage: #1 indoor qualitative coverage: #1 indoor qualitative coverage: #1 indoor qualitative coverage: #1 indoor
• 432 cites with >50% 4G indoor
coverage
• #1 in 3G indoor coverage
• #1 in voice quality/performance
high performing 3G/4G networkhigh performing 3G/4G networkhigh performing 3G/4G networkhigh performing 3G/4G network
Mobistar’s 4G is a service not just a technology
Leadership in MobileLeadership in MobileLeadership in MobileLeadership in Mobile
12
+ 4G attractive tariffs
4G in all Animal TP with data as from104G in all Animal TP with data as from104G in all Animal TP with data as from104G in all Animal TP with data as from10€€€€best offers:best offers:best offers:best offers: “Osez comparer” in Novemberactivation: activation: activation: activation: No need to do anything to get 4G.roaming: roaming: roaming: roaming: 4G available 7 European countries
+ Best 4G devices offers
Best deal quality/price Best deal quality/price Best deal quality/price Best deal quality/price 4G Devices as from @169,99€4G subsidized offers 4G subsidized offers 4G subsidized offers 4G subsidized offers as from 29€MBB devicesMBB devicesMBB devicesMBB devices: Pocket hotspot & Tablets as from 29€
+ 4G Comfort Services
MyStartMyStartMyStartMyStart:::: we’ll get you started on 4GMobile configurationMobile configurationMobile configurationMobile configurationXpertLineXpertLineXpertLineXpertLineInsuranceInsuranceInsuranceInsuranceRepairRepairRepairRepair

99% of Brussels population covered
96% of Brusselspopulation covered
56% of Brusselspopulation covered
Leadership in MobileLeadership in MobileLeadership in MobileLeadership in Mobile
1st to provide 99% 4G coverage in Brussels
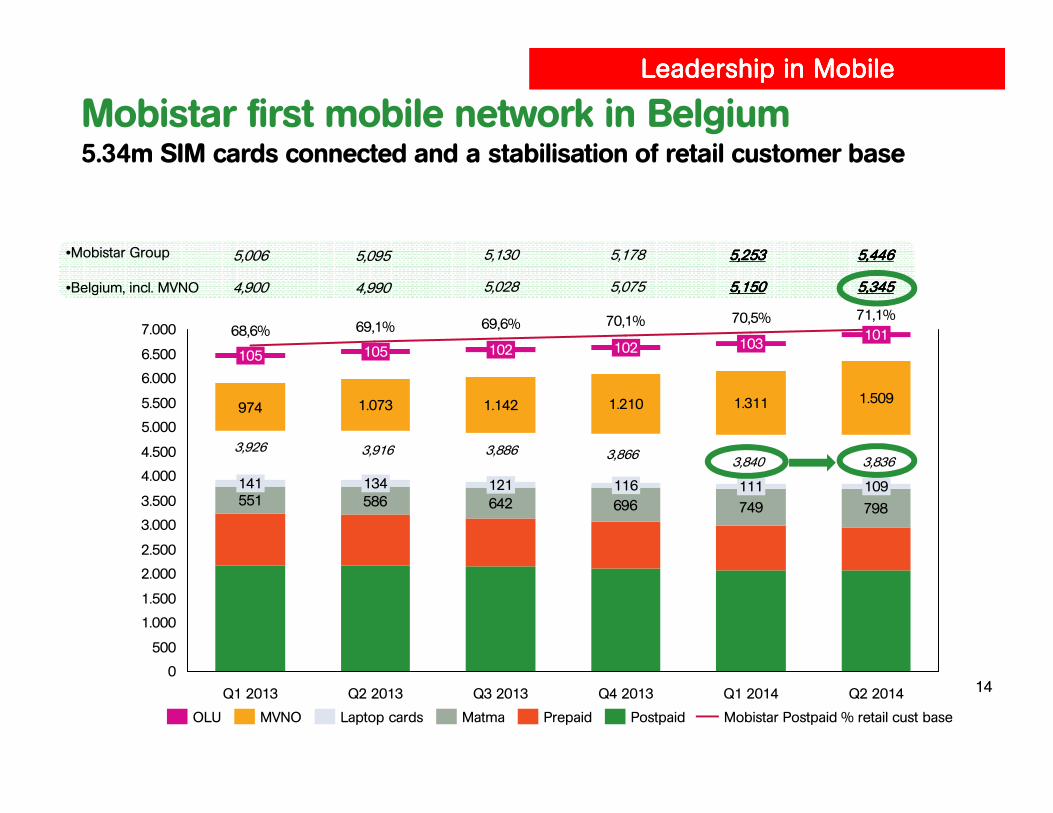
551 586 642 696 749 798
974
4.500
7.000
6.500
4.000
3.500
3.000
6.000
5.500
5.000
2.500
2.000
1.500
1.000
500
0
Q1 2014
70,5%
111
1.311
103
Q4 2013
70,1%
116
1.210
102
Q3 2013
69,6%
121
1.142
102
Q2 2013
69,1%
134
1.073
105
Q1 2013
68,6%
141
105
Q2 2014
109
1.509
101
71,1%
3,926 3,916
5,006 5,095 5,130
3,886
Prepaid Mobistar Postpaid % retail cust baseMatmaLaptop cardsMVNOOLU Postpaid
5,178
3,866
5,2535,2535,2535,253
3,840
14
•Mobistar Group
•Belgium, incl. MVNO 4,900 4,990 5,028 5,075 5,1505,1505,1505,150
3,836
5,4465,4465,4465,446
5,3455,3455,3455,345
Mobistar first mobile network in Belgium5.34m SIM cards connected and a stabilisation of retail customer base
Leadership in MobileLeadership in MobileLeadership in MobileLeadership in Mobile
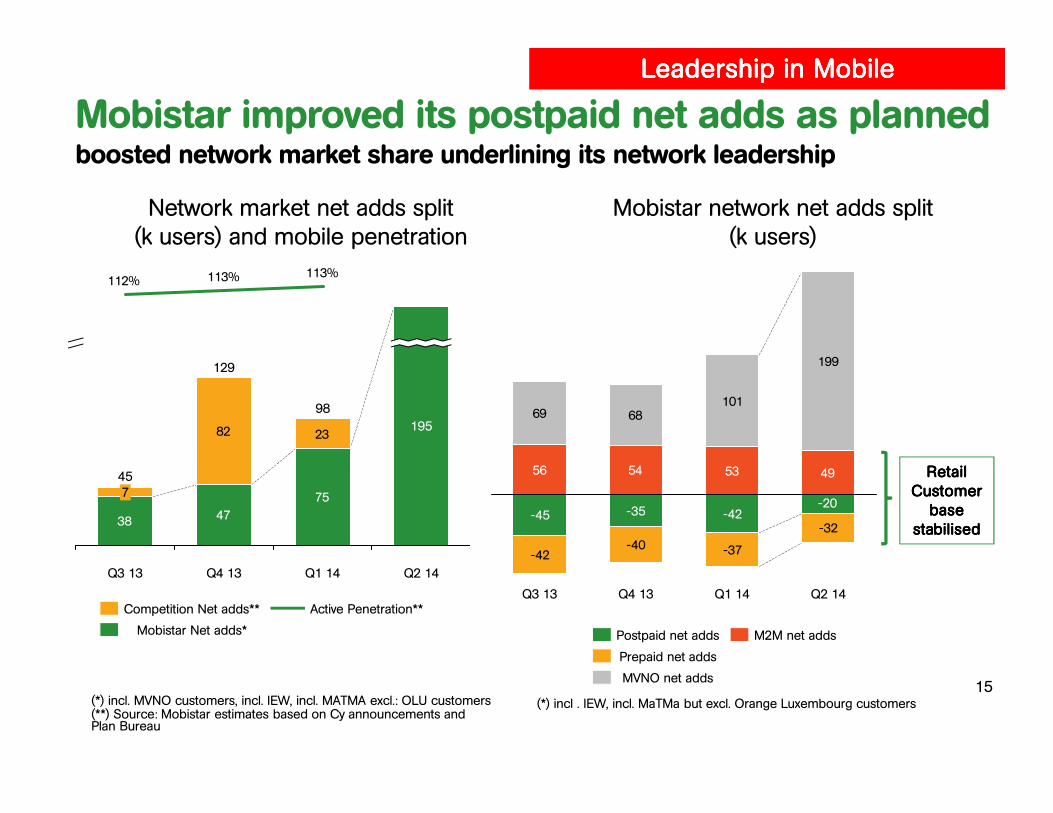
Mobistar improved its postpaid net adds as plannedboosted network market share underlining its network leadership
15
38 47
75
82 23
113%113%112%
Q2 14
195
Q1 14
98
Q4 13
129
Q3 13
457
Active Penetration**
Mobistar Net adds*
Competition Net adds**
-45 -35 -42
-42-40
-32
56 54 49
69 68101
199
-20
-37
53
Q1 14 Q2 14Q4 13Q3 13
M2M net adds
MVNO net adds
Prepaid net adds
Postpaid net adds
(*) incl. MVNO customers, incl. IEW, incl. MATMA excl.: OLU customers(**) Source: Mobistar estimates based on Cy announcements and Plan Bureau
(*) incl . IEW, incl. MaTMa but excl. Orange Luxembourg customers
Network market net adds split(k users) and mobile penetration
Mobistar network net adds split(k users)
Retail Retail Retail Retail Customer Customer Customer Customer
base base base base stabilisedstabilisedstabilisedstabilised
Leadership in MobileLeadership in MobileLeadership in MobileLeadership in Mobile
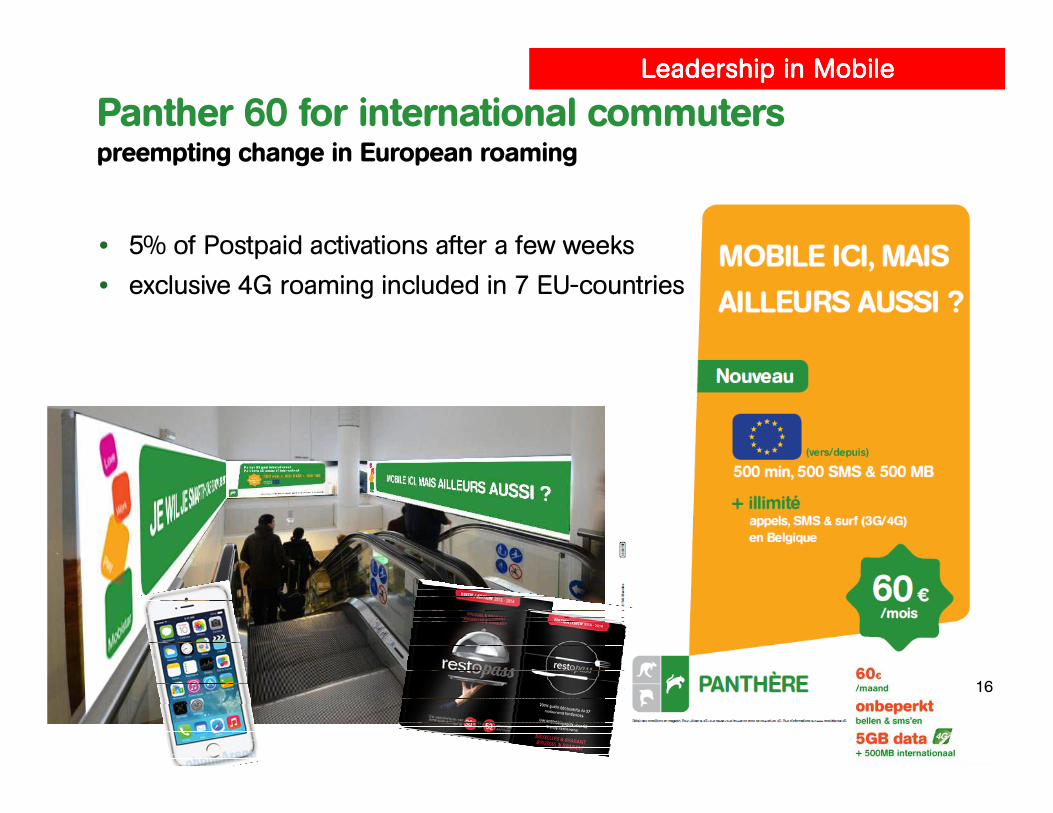
Panther 60 for international commuterspreempting change in European roaming
• 5% of Postpaid activations after a few weeks
• exclusive 4G roaming included in 7 EU-countries
Leadership in MobileLeadership in MobileLeadership in MobileLeadership in Mobile
16
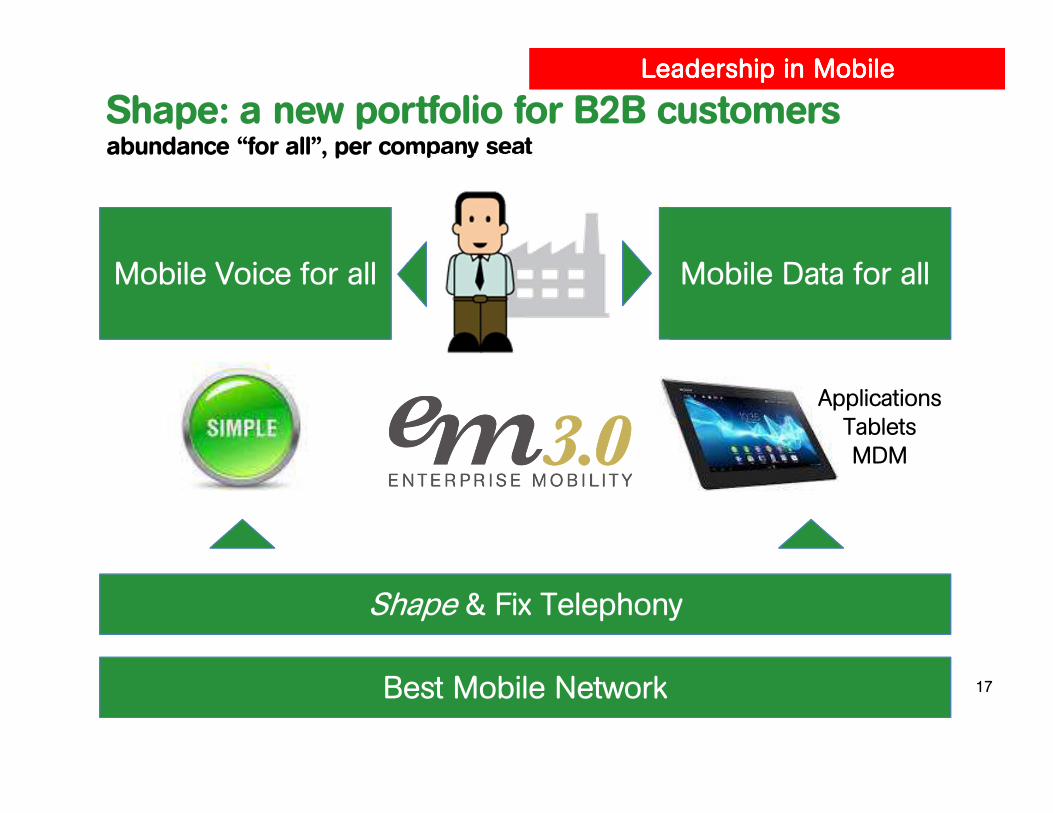
Shape & Fix Telephony
Best Mobile Network
Leadership in MobileLeadership in MobileLeadership in MobileLeadership in Mobile
Shape: a new portfolio for B2B customersabundance “for all”, per company seat
Mobile Voice for all Mobile Data for all
ApplicationsTabletsMDM
17

Have a nice day:our customers are special, let’s surprise them!
Best Customer ExperienceBest Customer ExperienceBest Customer ExperienceBest Customer Experience
18
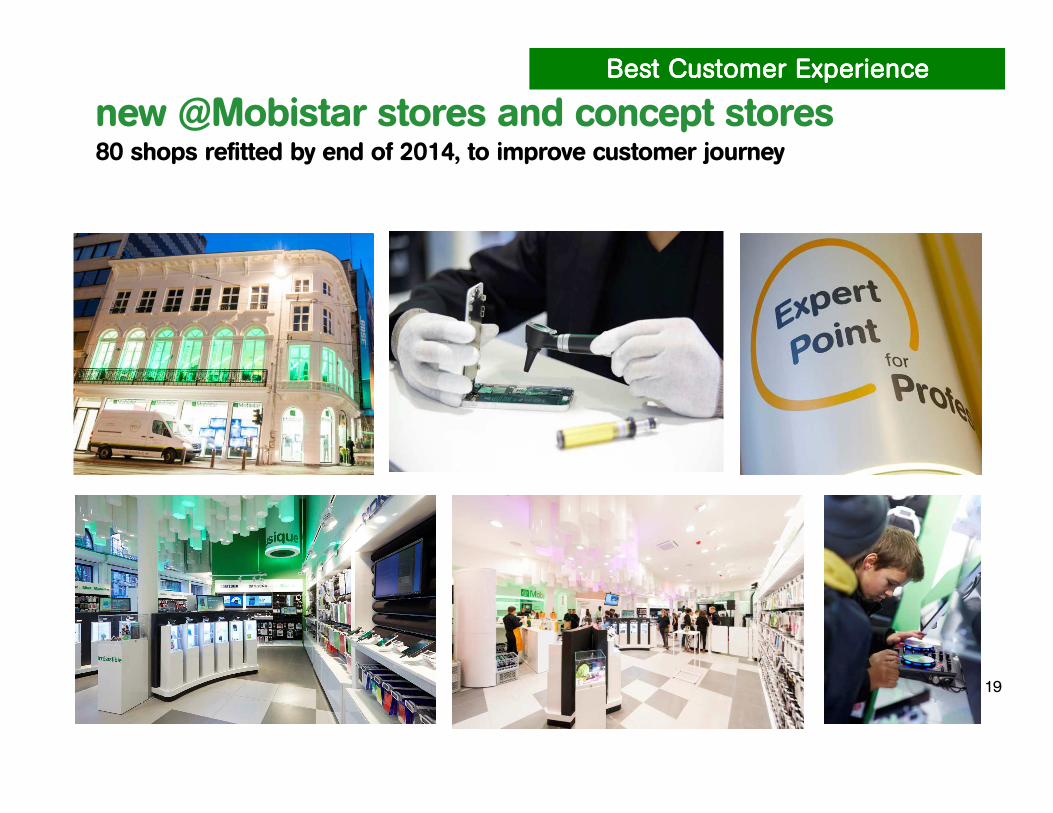
new @Mobistar stores and concept stores80 shops refitted by end of 2014, to improve customer journey
Best Customer ExperienceBest Customer ExperienceBest Customer ExperienceBest Customer Experience
19
.be
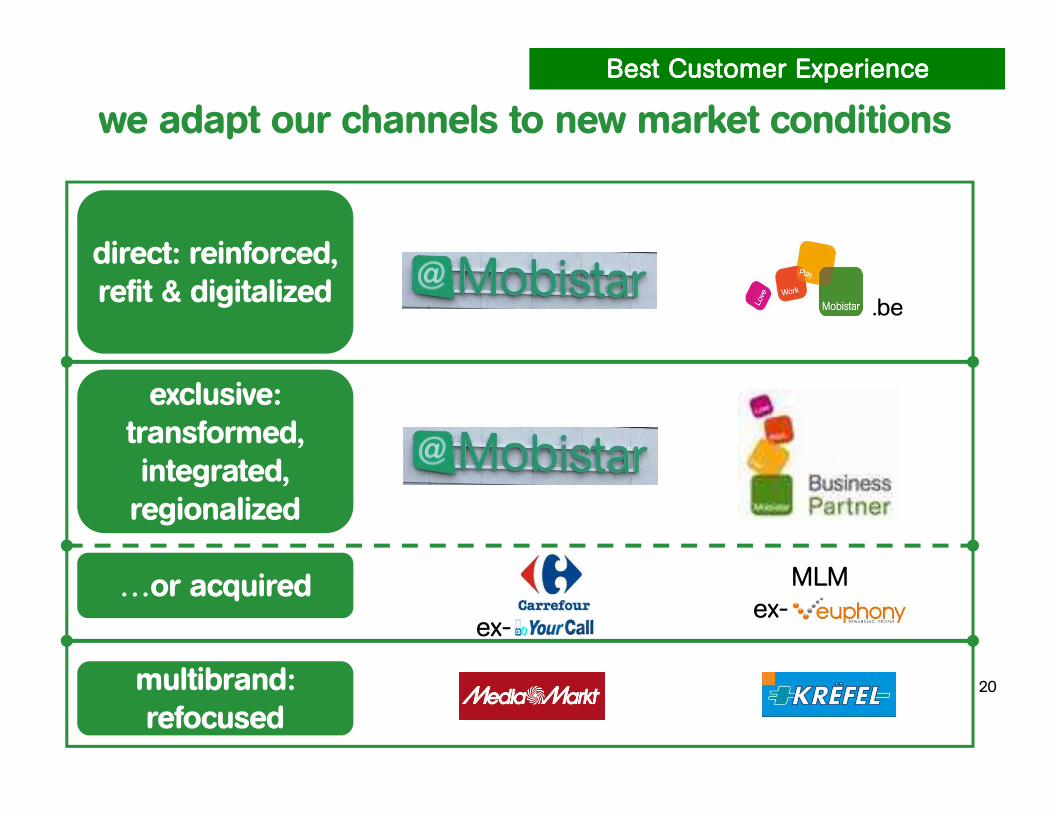
direct: reinforced, refit & digitalized
exclusive: transformed, integrated, regionalized
multibrand: refocused
MLMex-
we adapt our channels to new market conditions
ex-
…or acquired
Best Customer ExperienceBest Customer ExperienceBest Customer ExperienceBest Customer Experience
20
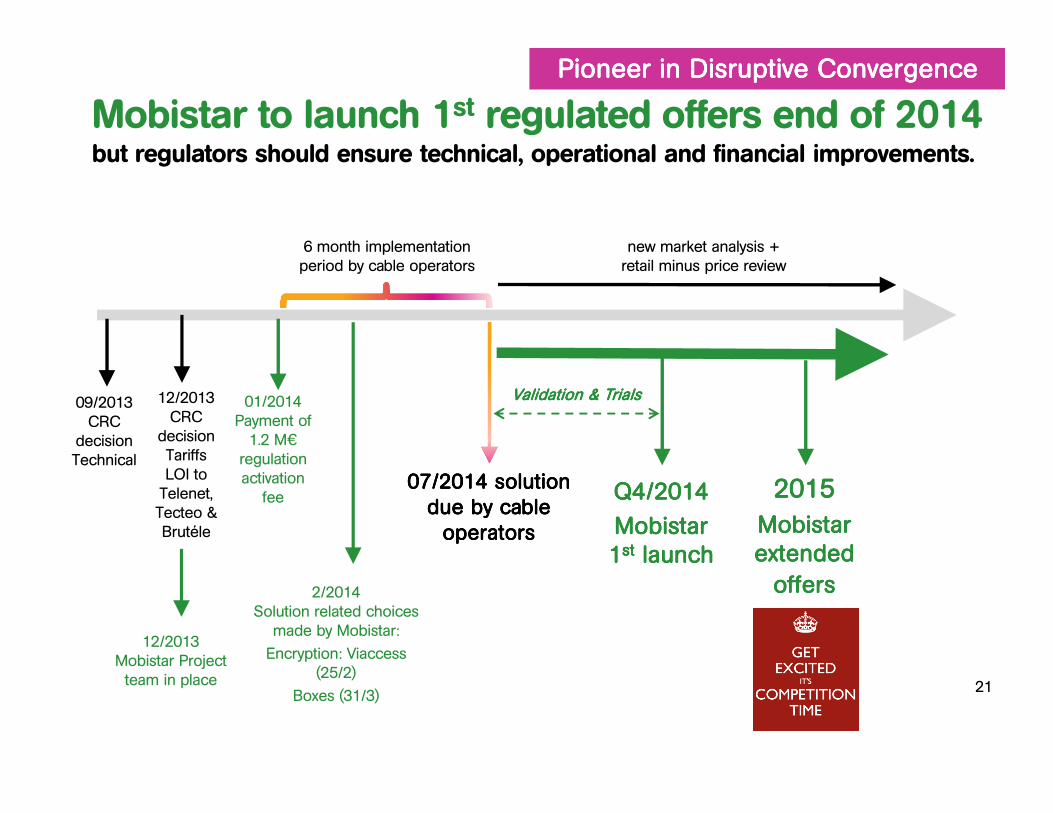
6 month implementation period by cable operators
09/2013CRC
decisionTechnical
07/2014 solution 07/2014 solution 07/2014 solution 07/2014 solution due by cable due by cable due by cable due by cable operatorsoperatorsoperatorsoperators
12/2013CRC
decisionTariffs LOI to Telenet, Tecteo & Brutéle
Q4/2014Q4/2014Q4/2014Q4/2014
MobistarMobistarMobistarMobistar1111stststst launchlaunchlaunchlaunch
12/2013Mobistar Projectteam in place
2/2014Solution related choices
made by Mobistar:
Encryption: Viaccess (25/2)
Boxes (31/3)
01/2014Payment of 1.2 M€
regulation activation
fee
Mobistar to launch 1st regulated offers end of 2014but regulators should ensure technical, operational and financial improvements.
Pioneer in Disruptive ConvergencePioneer in Disruptive ConvergencePioneer in Disruptive ConvergencePioneer in Disruptive Convergence
2015201520152015
Mobistar Mobistar Mobistar Mobistar extendedextendedextendedextended
offers offers offers offers
Validation & TrialsValidation & TrialsValidation & TrialsValidation & Trials
new market analysis + retail minus price review
21
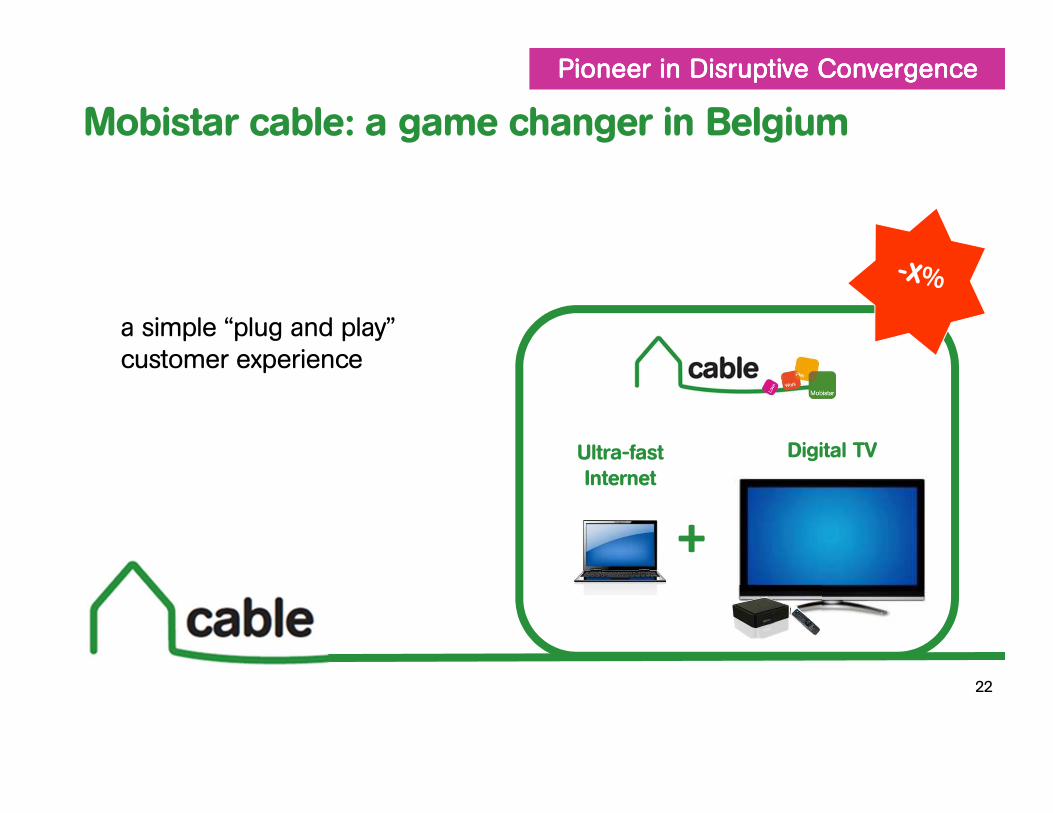
Mobistar cable: a game changer in Belgium
Pioneer in Disruptive ConvergencePioneer in Disruptive ConvergencePioneer in Disruptive ConvergencePioneer in Disruptive Convergence
a simple “plug and play”customer experience
Ultra-fast Internet
Digital TV
+
22
Best Industry EfficiencyBest Industry EfficiencyBest Industry EfficiencyBest Industry Efficiency
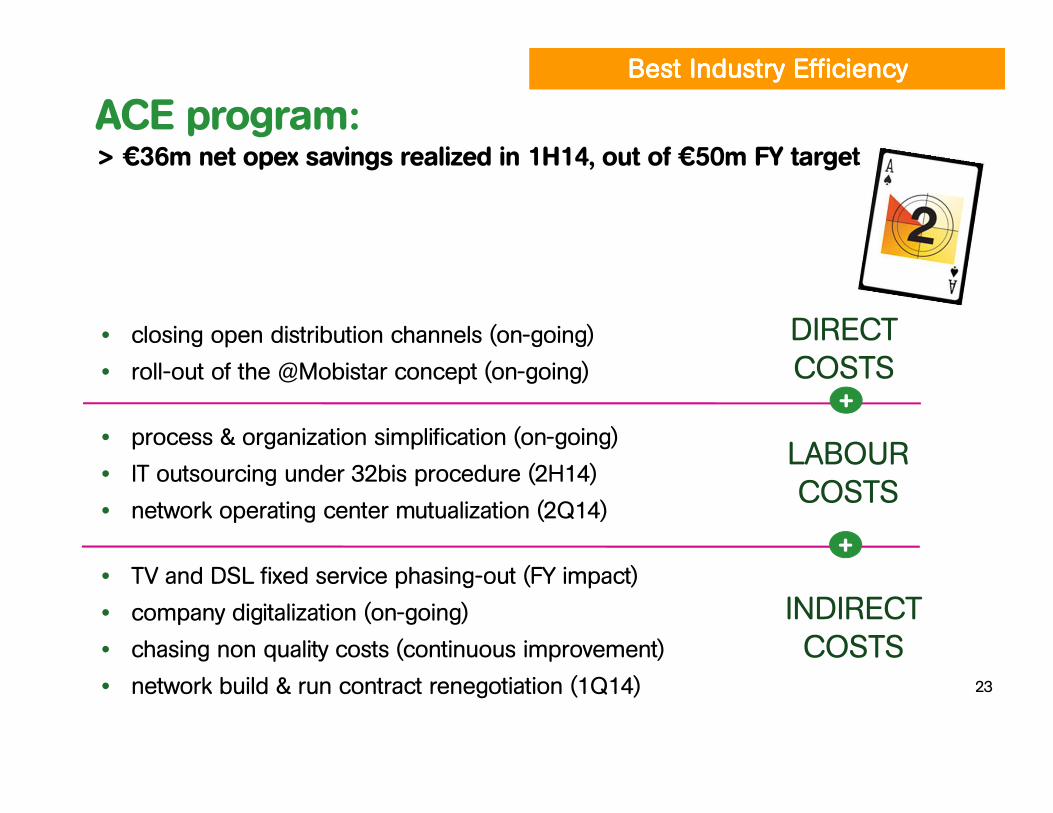
ACE program:> €36m net opex savings realized in 1H14, out of €50m FY target
• closing open distribution channels (on-going)
• roll-out of the @Mobistar concept (on-going)
• process & organization simplification (on-going)
• IT outsourcing under 32bis procedure (2H14)
• network operating center mutualization (2Q14)
• TV and DSL fixed service phasing-out (FY impact)
• company digitalization (on-going)
• chasing non quality costs (continuous improvement)
• network build & run contract renegotiation (1Q14)
DIRECTCOSTS
LABOURCOSTS
INDIRECTCOSTS
+
+
23
‘We will carry on our determined work to
fundamentally transform this company and its cost
structure’
Financial Review Ludovic Pech
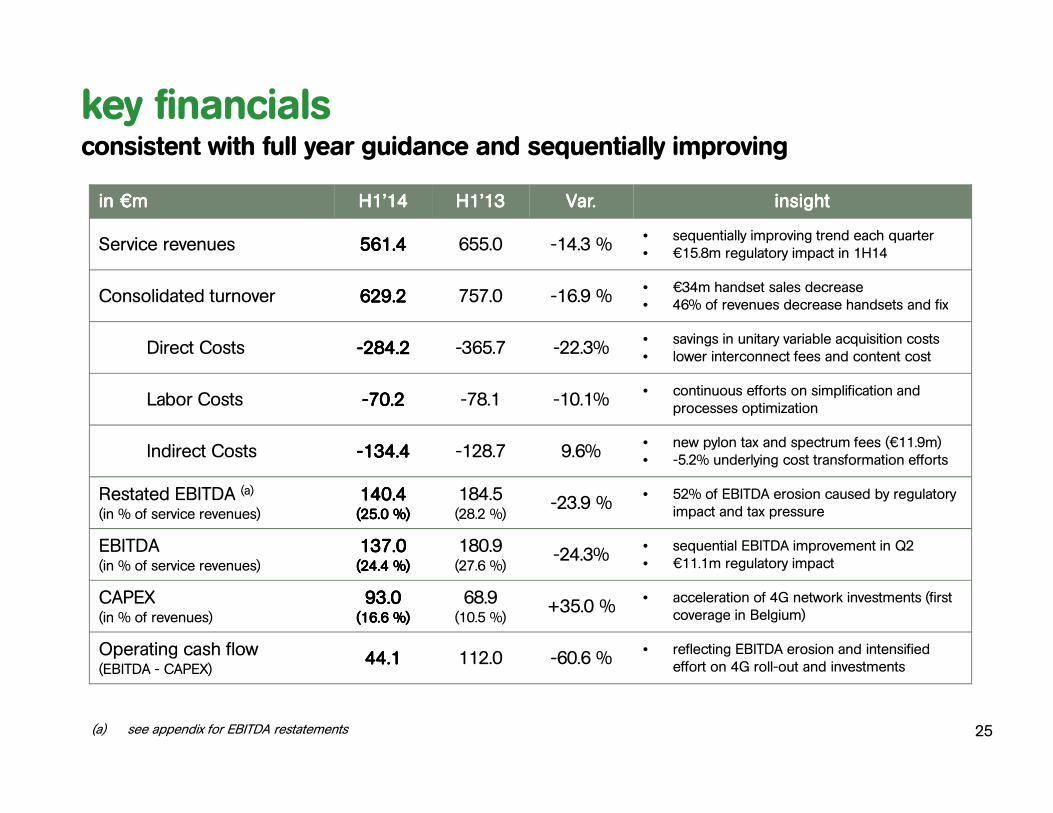
in in in in €€€€mmmm H1’14H1’14H1’14H1’14 H1’13H1’13H1’13H1’13 Var.Var.Var.Var. insightinsightinsightinsight
Service revenues 561.4561.4561.4561.4 655.0 -14.3 %• sequentially improving trend each quarter• €15.8m regulatory impact in 1H14
Consolidated turnover 629.2629.2629.2629.2 757.0 -16.9 %• €34m handset sales decrease• 46% of revenues decrease handsets and fix
Direct Costs ----284.2284.2284.2284.2 -365.7 -22.3%• savings in unitary variable acquisition costs • lower interconnect fees and content cost
Labor Costs ----70.270.270.270.2 -78.1 -10.1%• continuous efforts on simplification and
processes optimization
Indirect Costs ----134.4134.4134.4134.4 -128.7 9.6%• new pylon tax and spectrum fees (€11.9m)• -5.2% underlying cost transformation efforts
Restated EBITDA (a)
(in % of service revenues)
140.4140.4140.4140.4(25.0 %)(25.0 %)(25.0 %)(25.0 %)
184.5(28.2 %)
-23.9 %• 52% of EBITDA erosion caused by regulatory
impact and tax pressure
EBITDA (in % of service revenues)
137.0137.0137.0137.0(24.4 %)(24.4 %)(24.4 %)(24.4 %)
180.9(27.6 %)
-24.3%• sequential EBITDA improvement in Q2• €11.1m regulatory impact
CAPEX(in % of revenues)
93.093.093.093.0(16.6 %)(16.6 %)(16.6 %)(16.6 %)
68.9(10.5 %)
+35.0 %• acceleration of 4G network investments (first
coverage in Belgium)
Operating cash flow(EBITDA - CAPEX)
44.144.144.144.1 112.0 -60.6 %• reflecting EBITDA erosion and intensified
effort on 4G roll-out and investments
key financialsconsistent with full year guidance and sequentially improving
(a) see appendix for EBITDA restatements 25
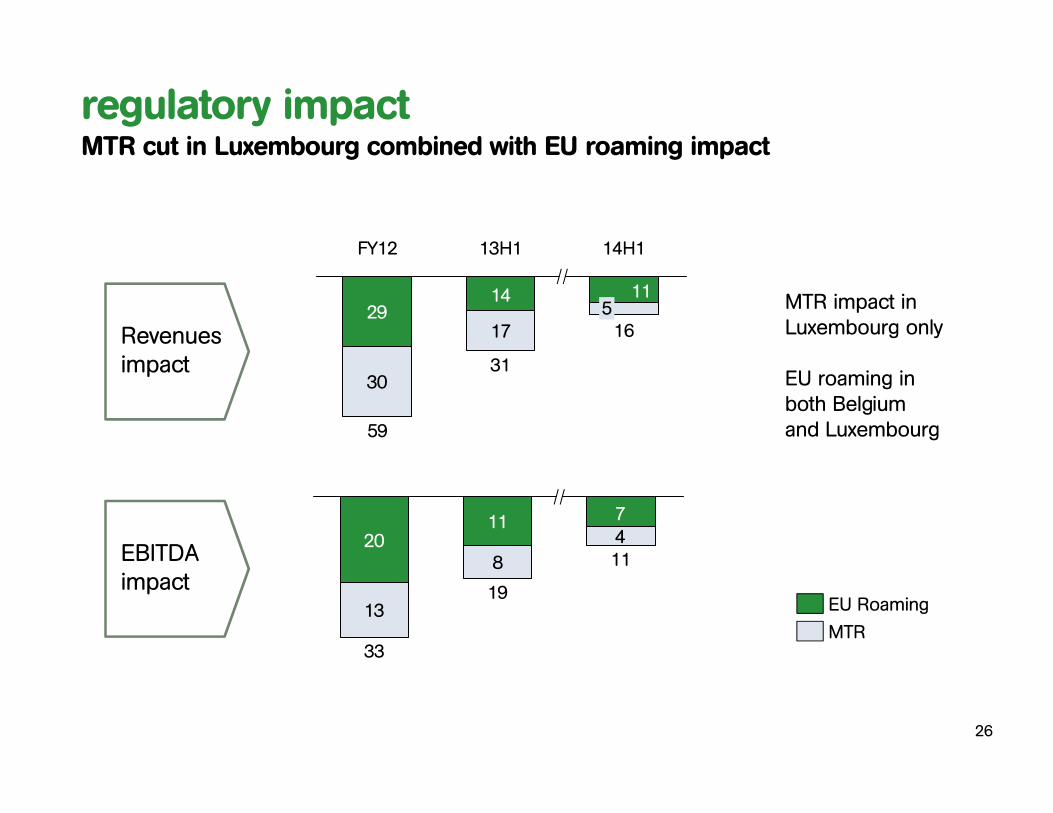
Revenuesimpact
EBITDAimpact
29
30
17
1114
13H1 14H1
16
31
59
5
FY12
2011
13
8
47
33
11
19
MTR
EU Roaming
regulatory impactMTR cut in Luxembourg combined with EU roaming impact
MTR impact in Luxembourg only
EU roaming in both Belgium and Luxembourg
26
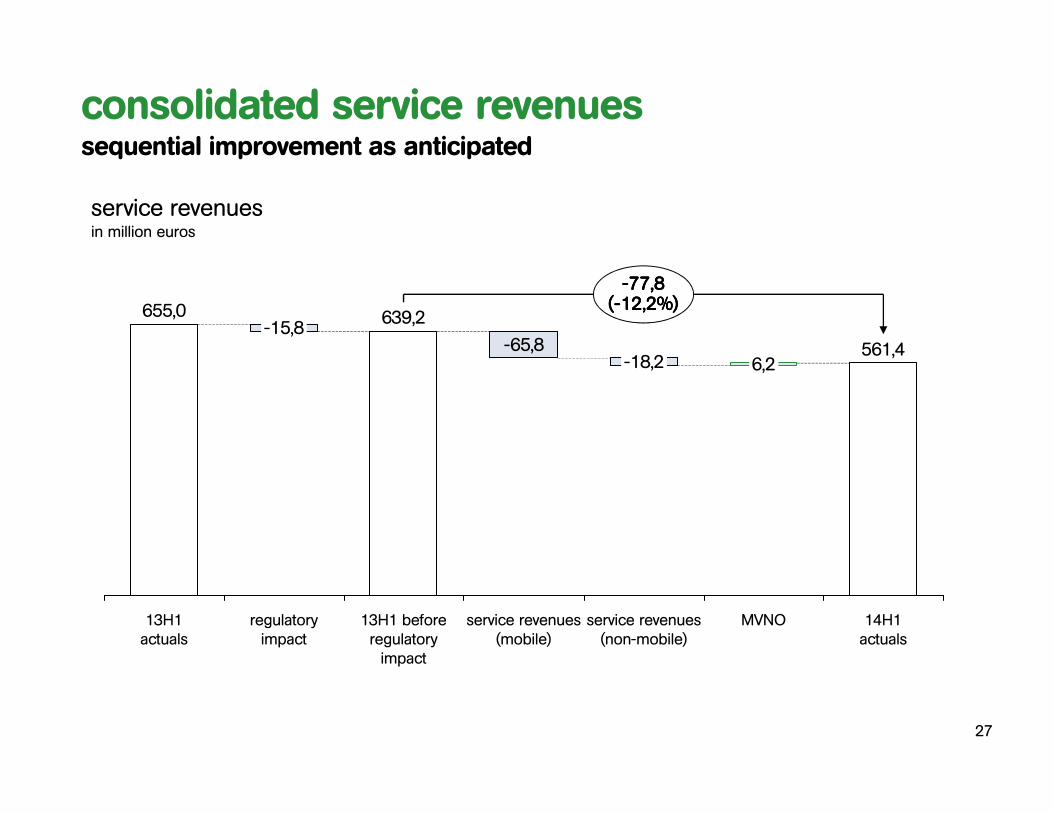
655,0
561,4
----77,877,877,877,8((((----12,2%12,2%12,2%12,2%))))
14H1actuals
-18,2
MVNO
6,2
service revenues (non-mobile)
-65,8
service revenues (mobile)
13H1 beforeregulatory impact
639,2
regulatory impact
-15,8
13H1actuals
service revenuesin million euros
consolidated service revenuessequential improvement as anticipated
27
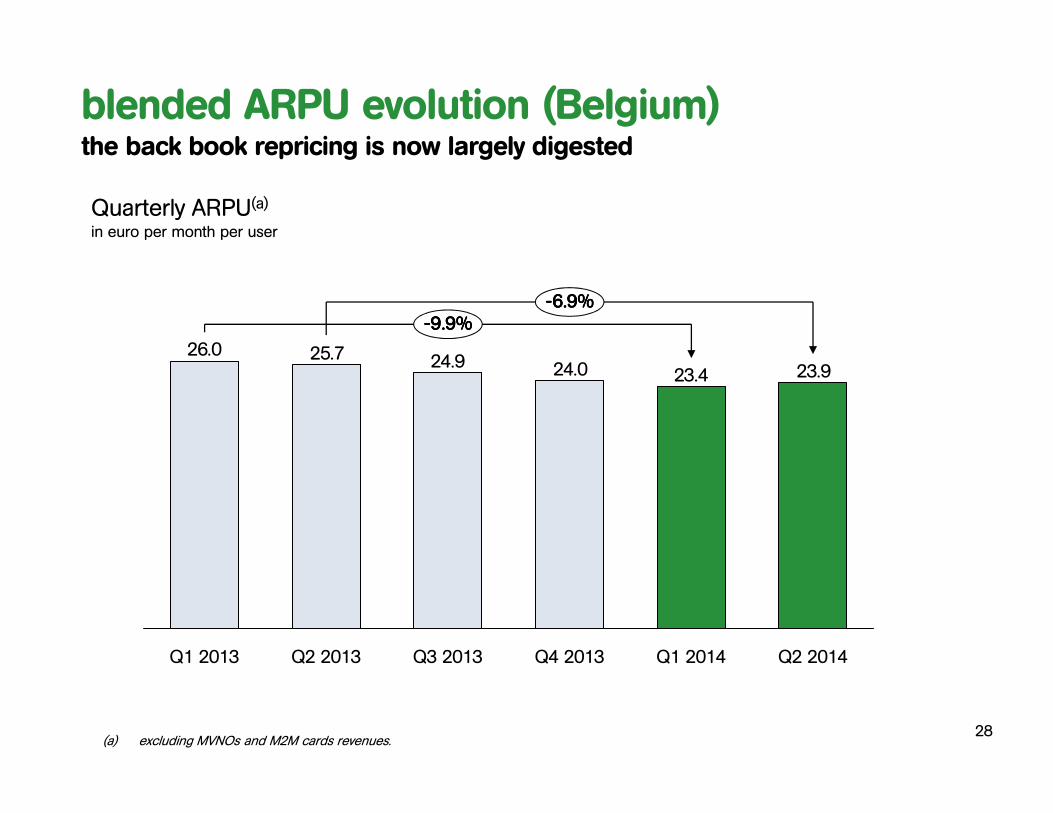
23.923.424.024.925.726.0
----9.9%9.9%9.9%9.9%----6.9%6.9%6.9%6.9%
Q2 2014Q1 2014Q4 2013Q1 2013 Q3 2013Q2 2013
(a) excluding MVNOs and M2M cards revenues.
blended ARPU evolution (Belgium)the back book repricing is now largely digested
28
Quarterly ARPU(a)
in euro per month per user
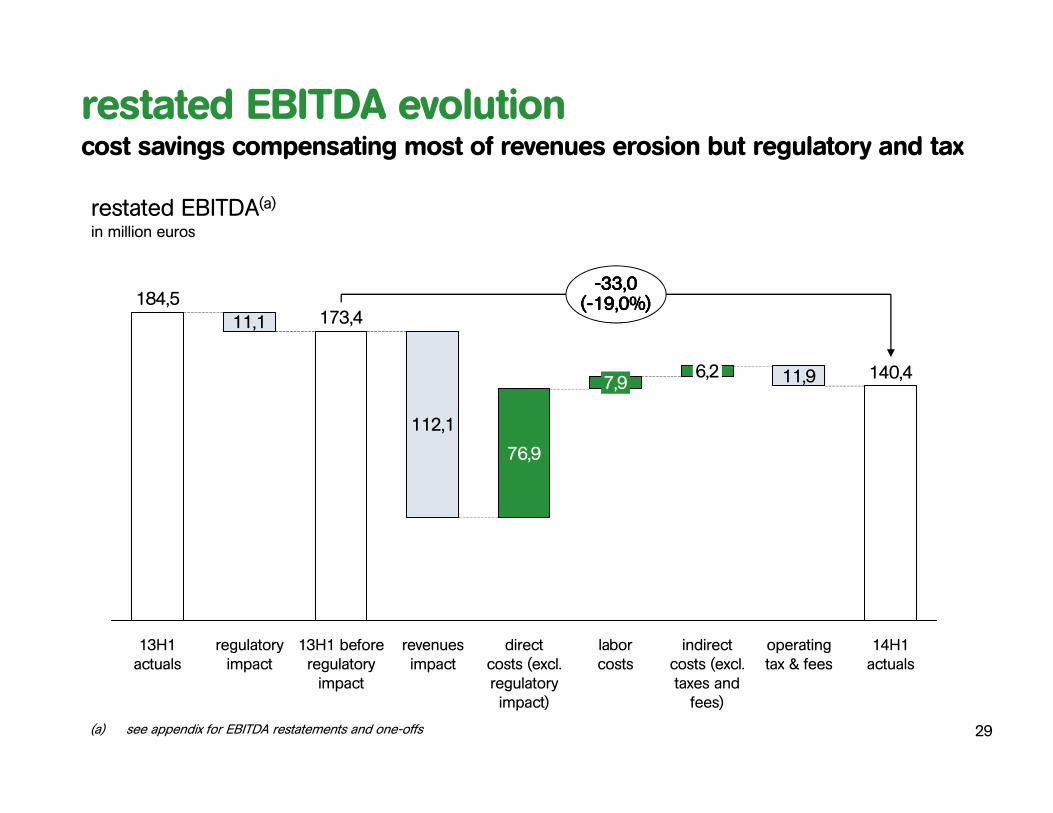
(a) see appendix for EBITDA restatements and one-offs 29
restated EBITDA evolutioncost savings compensating most of revenues erosion but regulatory and tax
----33,033,033,033,0((((----19,0%19,0%19,0%19,0%))))
14H1actuals
140,4
operating tax & fees
11,9
indirect costs (excl. taxes and fees)
6,2
laborcosts
7,9
direct costs (excl. regulatory impact)
76,9
revenues impact
112,1
13H1 before regulatory impact
173,4
regulatory impact
11,1
13H1actuals
184,5
restated EBITDA(a)in million euros
30
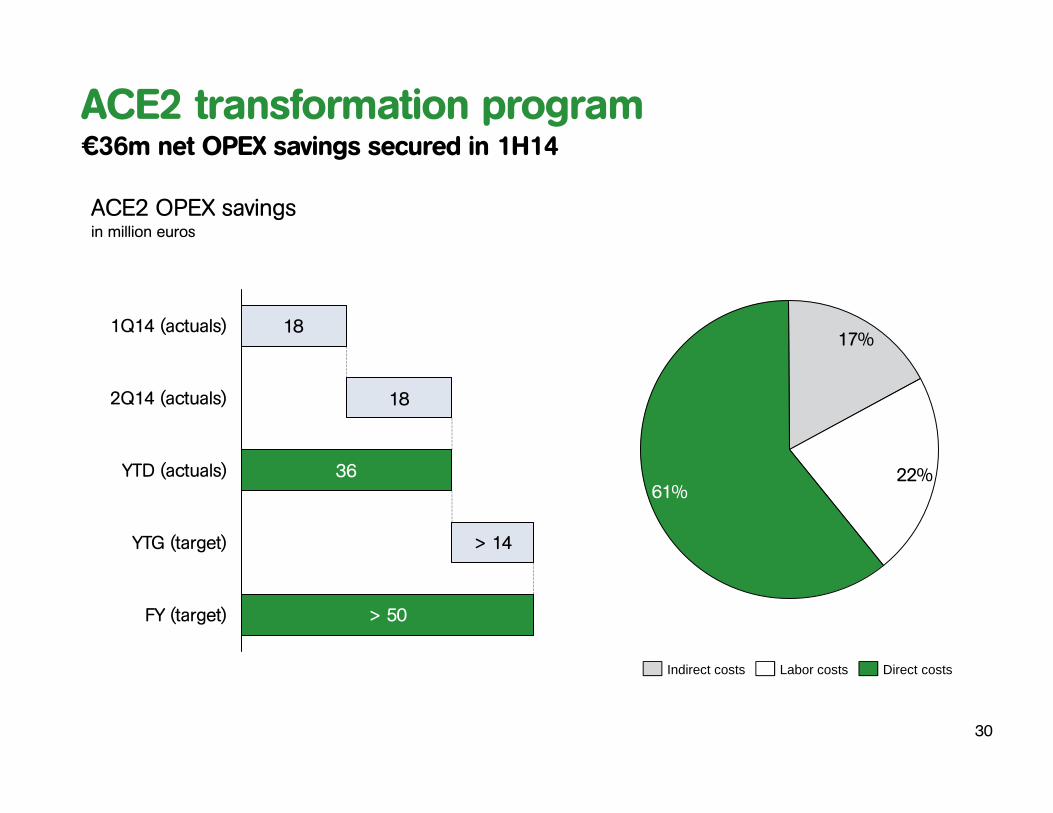
ACE2 transformation program€36m net OPEX savings secured in 1H14
ACE2 OPEX savingsin million euros
18
18
36
> 14
> 50FY (target)
YTD (actuals)
1Q14 (actuals)
2Q14 (actuals)
YTG (target)
22%61%
17%
Labor costsIndirect costs Direct costs
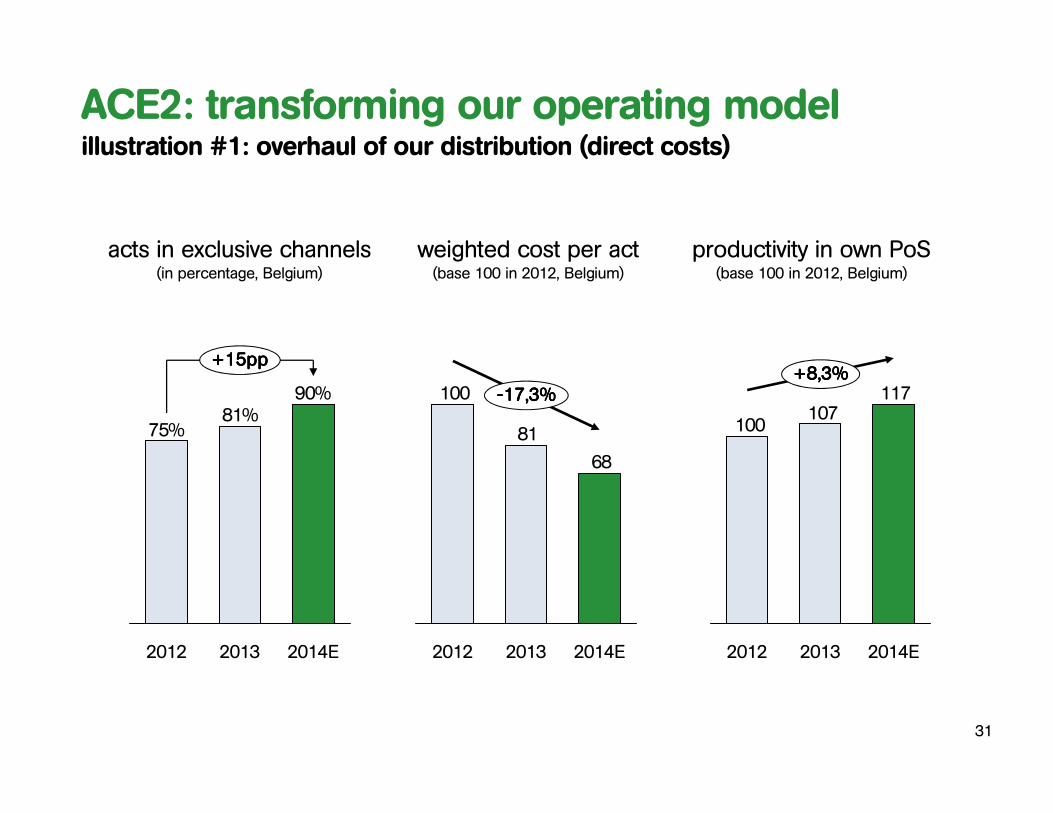
90%81%
75%
+15+15+15+15pppppppp
20132012 2014E
acts in exclusive channels(in percentage, Belgium)
productivity in own PoS(base 100 in 2012, Belgium)
weighted cost per act(base 100 in 2012, Belgium)
ACE2: transforming our operating modelillustration #1: overhaul of our distribution (direct costs)
31
68
81
100
2014E2013
----17,3%17,3%17,3%17,3%
2012
117107
100
2014E2013
+8,3%+8,3%+8,3%+8,3%
2012
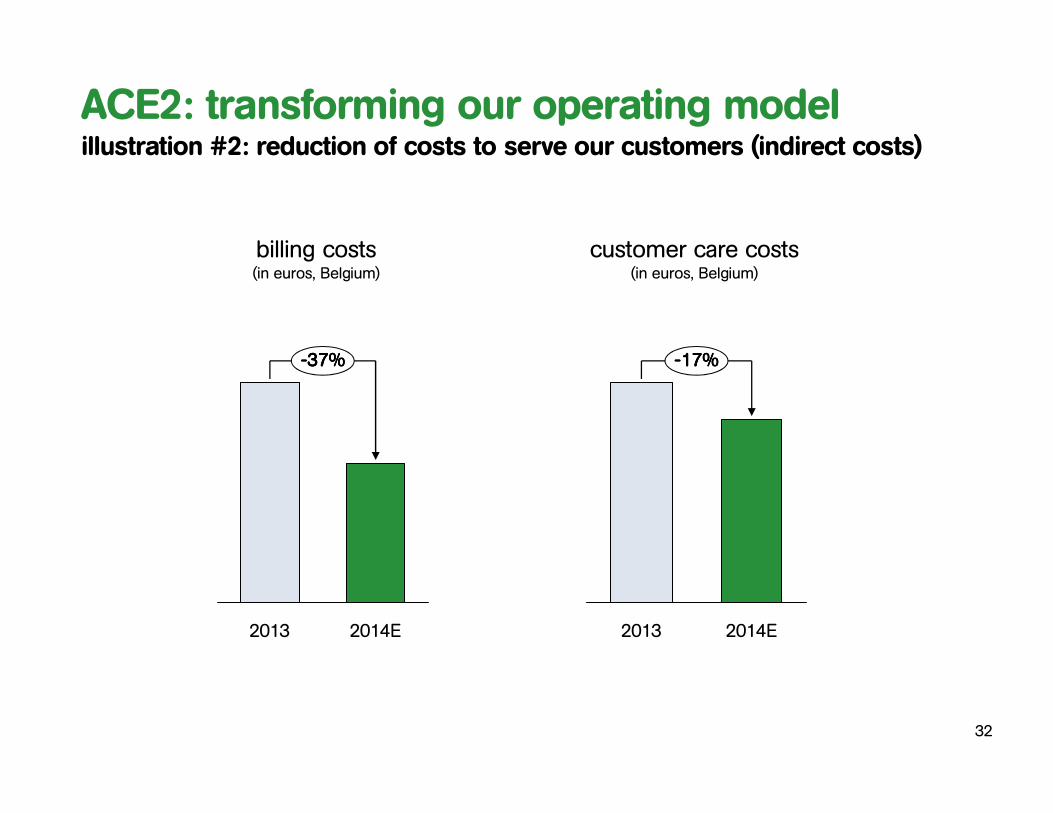
billing costs(in euros, Belgium)
ACE2: transforming our operating modelillustration #2: reduction of costs to serve our customers (indirect costs)
32
2013 2014E
----37%37%37%37%
2013 2014E
----17%17%17%17%
customer care costs(in euros, Belgium)
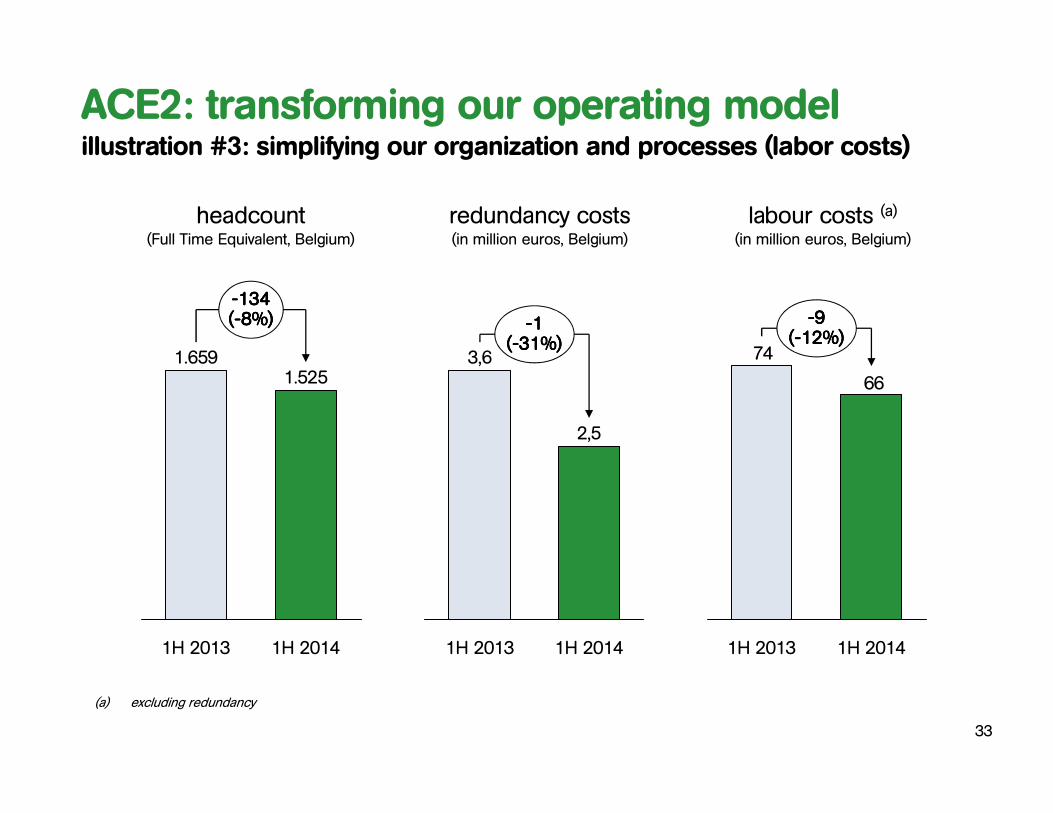
----134134134134((((----8%8%8%8%))))
1H 2014
1.659
1H 2013
1.525
headcount(Full Time Equivalent, Belgium)
labour costs (a)(in million euros, Belgium)
redundancy costs(in million euros, Belgium)
----1111((((----31%31%31%31%))))
1H 20141H 2013
2,5
3,6
ACE2: transforming our operating modelillustration #3: simplifying our organization and processes (labor costs)
(a) excluding redundancy
66
74
1H 2014
----9999((((----12%12%12%12%))))
1H 2013
33
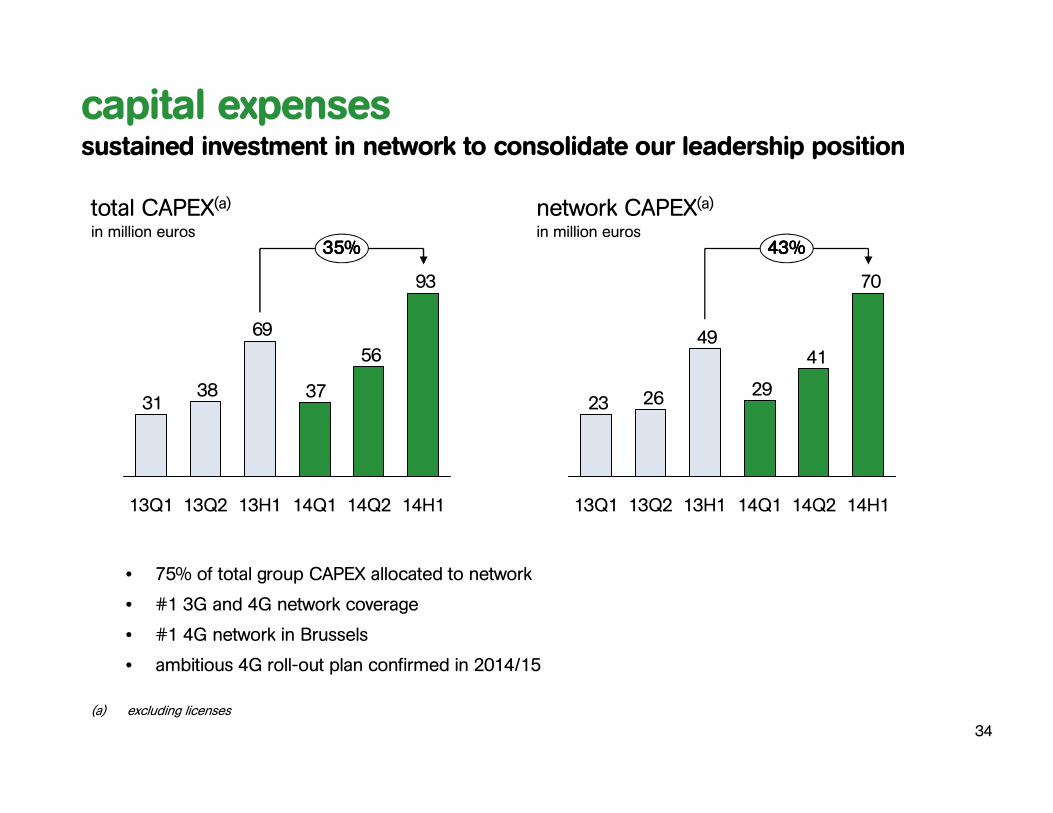
93
56
37
69
3831
35%35%35%35%
14Q214Q113H113Q213Q1 14H1
70
41
29
49
2623
14H114Q214Q113H113Q213Q1
43%43%43%43%
capital expensessustained investment in network to consolidate our leadership position
(a) excluding licenses
• 75% of total group CAPEX allocated to network
• #1 3G and 4G network coverage
• #1 4G network in Brussels
• ambitious 4G roll-out plan confirmed in 2014/15
34
total CAPEX(a)in million euros
network CAPEX(a)in million euros
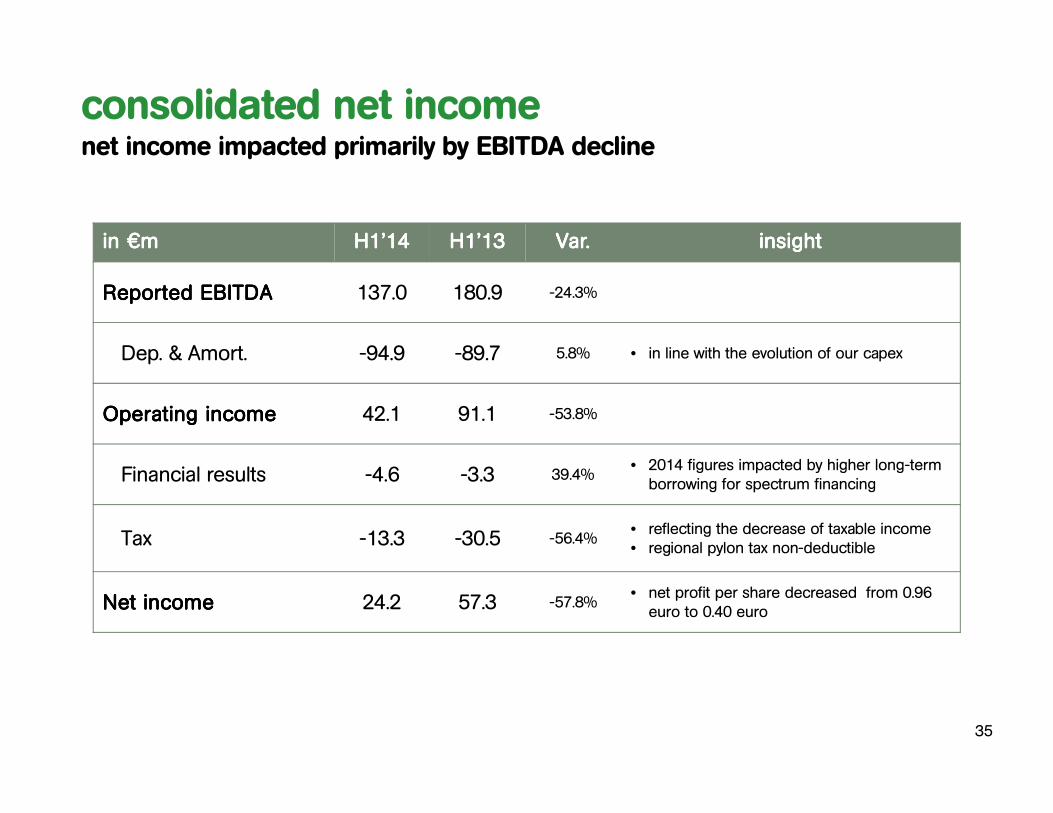
consolidated net incomenet income impacted primarily by EBITDA decline
in in in in €€€€mmmm H1’14H1’14H1’14H1’14 H1’13H1’13H1’13H1’13 Var.Var.Var.Var. insightinsightinsightinsight
Reported EBITDAReported EBITDAReported EBITDAReported EBITDA 137.0 180.9 -24.3%
Dep. & Amort. -94.9 -89.7 5.8% • in line with the evolution of our capex
Operating incomeOperating incomeOperating incomeOperating income 42.1 91.1 -53.8%
Financial results -4.6 -3.3 39.4%• 2014 figures impacted by higher long-term
borrowing for spectrum financing
Tax -13.3 -30.5 -56.4%• reflecting the decrease of taxable income• regional pylon tax non-deductible
Net incomeNet incomeNet incomeNet income 24.2 57.3 -57.8%• net profit per share decreased from 0.96
euro to 0.40 euro
35
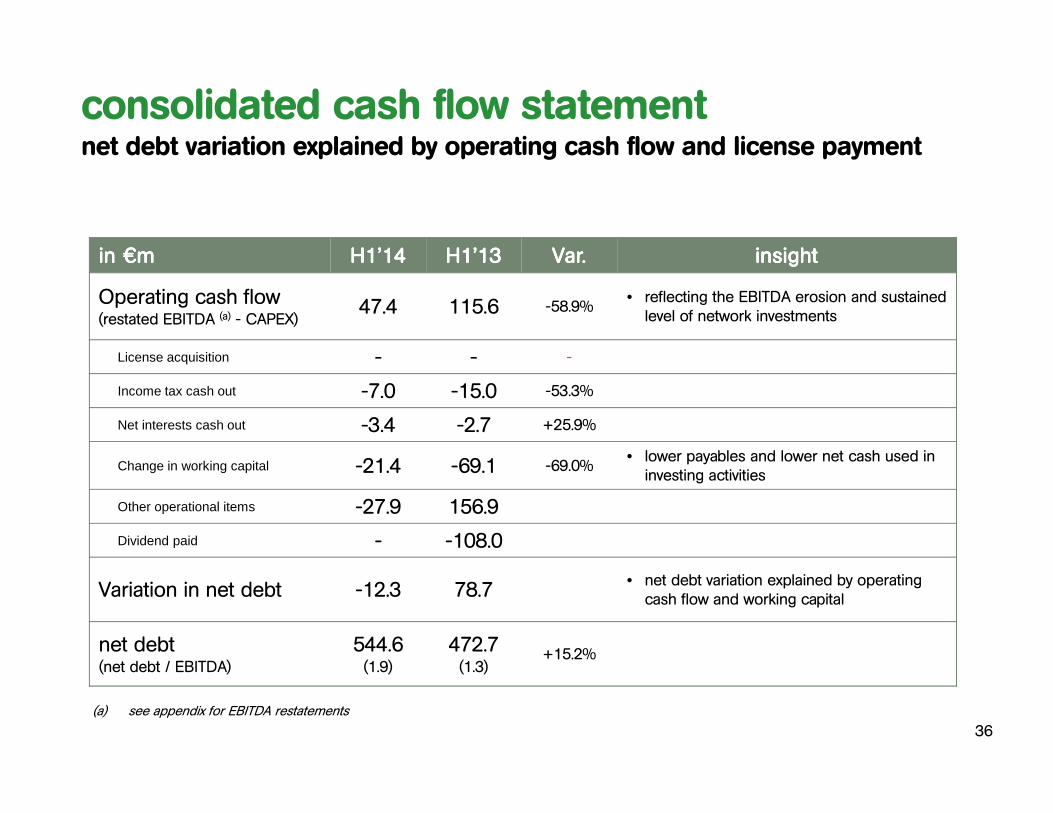
in in in in €€€€mmmm H1’14H1’14H1’14H1’14 H1’13H1’13H1’13H1’13 Var.Var.Var.Var. insightinsightinsightinsight
Operating cash flow(restated EBITDA (a) - CAPEX)
47.4 115.6 -58.9%• reflecting the EBITDA erosion and sustained
level of network investments
License acquisition - - -
Income tax cash out -7.0 -15.0 -53.3%
Net interests cash out -3.4 -2.7 +25.9%
Change in working capital -21.4 -69.1 -69.0%• lower payables and lower net cash used in
investing activities
Other operational items -27.9 156.9
Dividend paid - -108.0
Variation in net debt -12.3 78.7• net debt variation explained by operating
cash flow and working capital
net debt(net debt / EBITDA)
544.6(1.9)
472.7(1.3)
+15.2%
(a) see appendix for EBITDA restatements
consolidated cash flow statementnet debt variation explained by operating cash flow and license payment
36
‘The results of the first half of 2014 enabled Mobistar to confirm its outlook as provided in
February 2014’
Financial OutlookJean-Marc Harion
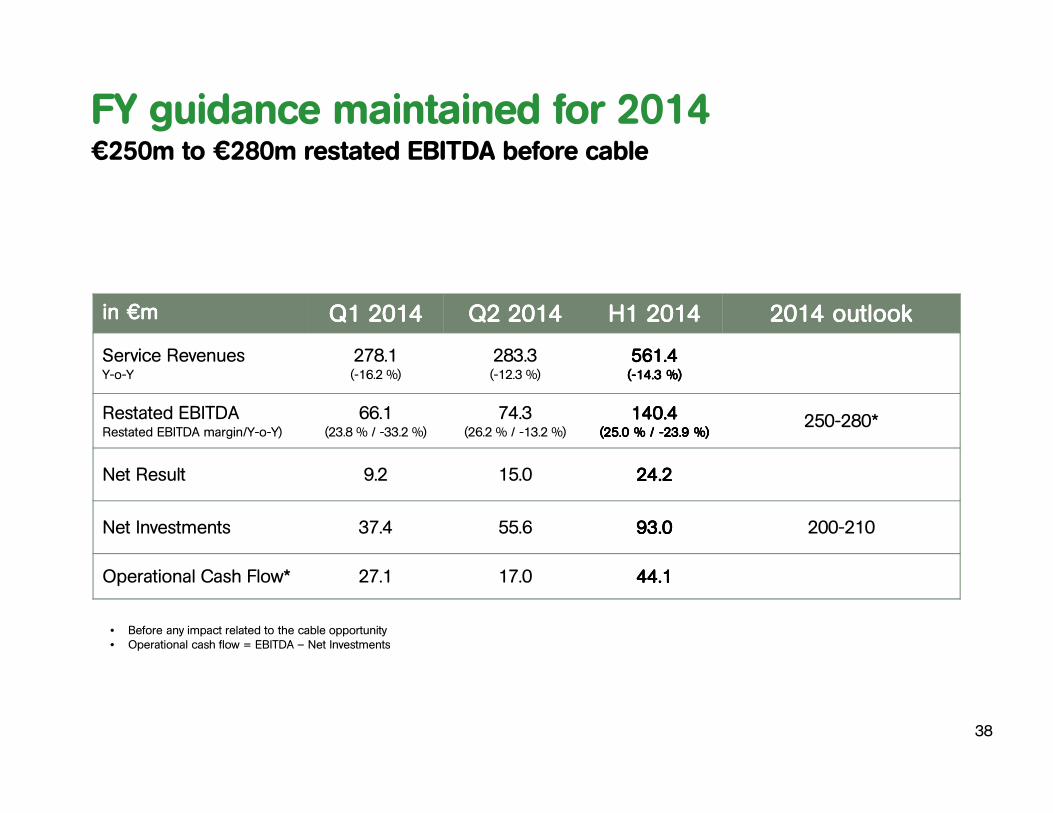
• Before any impact related to the cable opportunity• Operational cash flow = EBITDA – Net Investments
FY guidance maintained for 2014€250m to €280m restated EBITDA before cable
in in in in €€€€mmmm Q1 2014Q1 2014Q1 2014Q1 2014 Q2 2014Q2 2014Q2 2014Q2 2014 H1 2014H1 2014H1 2014H1 2014 2014 outlook2014 outlook2014 outlook2014 outlook
Service RevenuesY-o-Y
278.1(-16.2 %)
283.3(-12.3 %)
561.4561.4561.4561.4((((----14.3 14.3 14.3 14.3 %)%)%)%)
Restated EBITDARestated EBITDA margin/Y-o-Y)
66.1(23.8 % / -33.2 %)
74.3(26.2 % / -13.2 %)
140.4140.4140.4140.4(25.0 % / (25.0 % / (25.0 % / (25.0 % / ----23.9 %)23.9 %)23.9 %)23.9 %)
250-280*
Net Result 9.2 15.0 24.224.224.224.2
Net Investments 37.4 55.6 93.093.093.093.0 200-210
Operational Cash Flow* 27.1 17.0 44.144.144.144.1
38
Appendix
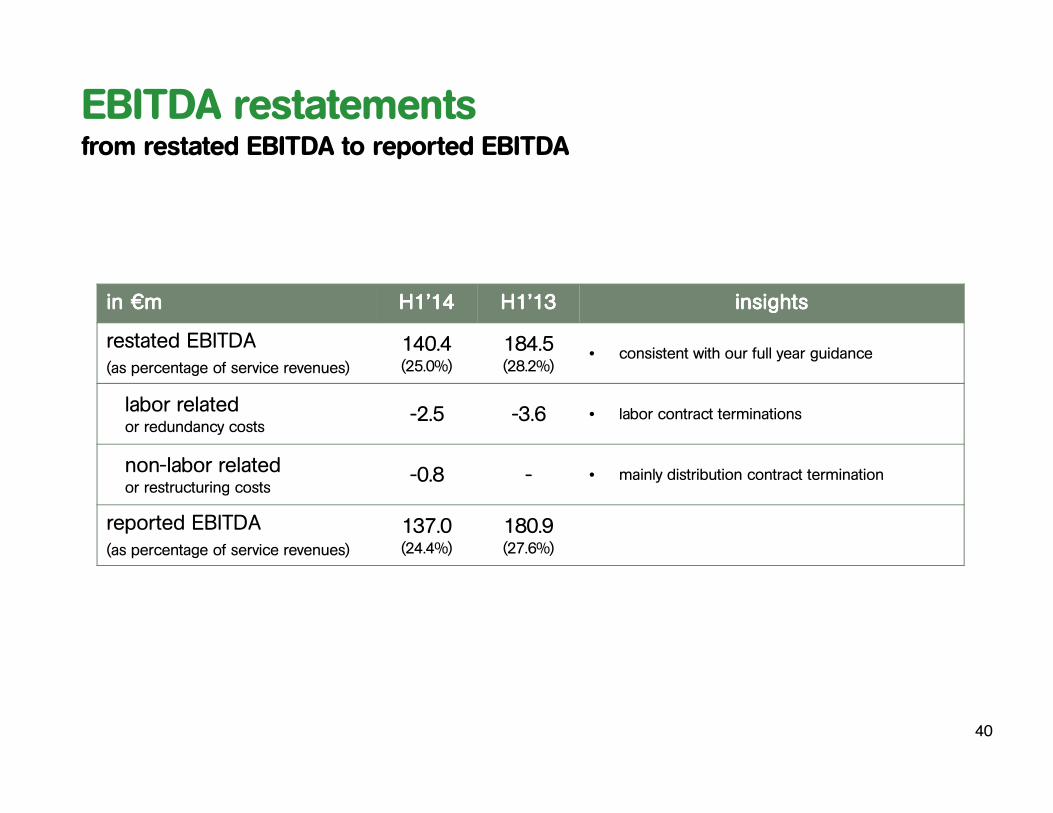
EBITDA restatementsfrom restated EBITDA to reported EBITDA
in in in in €€€€mmmm H1’14H1’14H1’14H1’14 H1’13H1’13H1’13H1’13 insightsinsightsinsightsinsights
restated EBITDA(as percentage of service revenues)
140.4(25.0%)
184.5(28.2%)
• consistent with our full year guidance
labor relatedor redundancy costs
-2.5 -3.6 • labor contract terminations
non-labor relatedor restructuring costs
-0.8 - • mainly distribution contract termination
reported EBITDA(as percentage of service revenues)
137.0(24.4%)
180.9(27.6%)
40
41
50%51%49%48%48%46%
19%18%19%18%15%
0
10
20
30
40
50
60
70
80
90
100
110
120
130
140
150
160
170
180
190
Q1 2014
122
62%
33%
4%
Q4 2013
123
63%
33%
4%
Q3 2013
127
60%
36%
4%
Q2 2013
131
63%
33%
3%
Q1 2013
129
66%
30%
4%
Q2 2014
19%
33%
62%
5%
123
SMS
Advanced data as % mobile service rev
Data as % mobile service rev
Mobile Data
MATMA
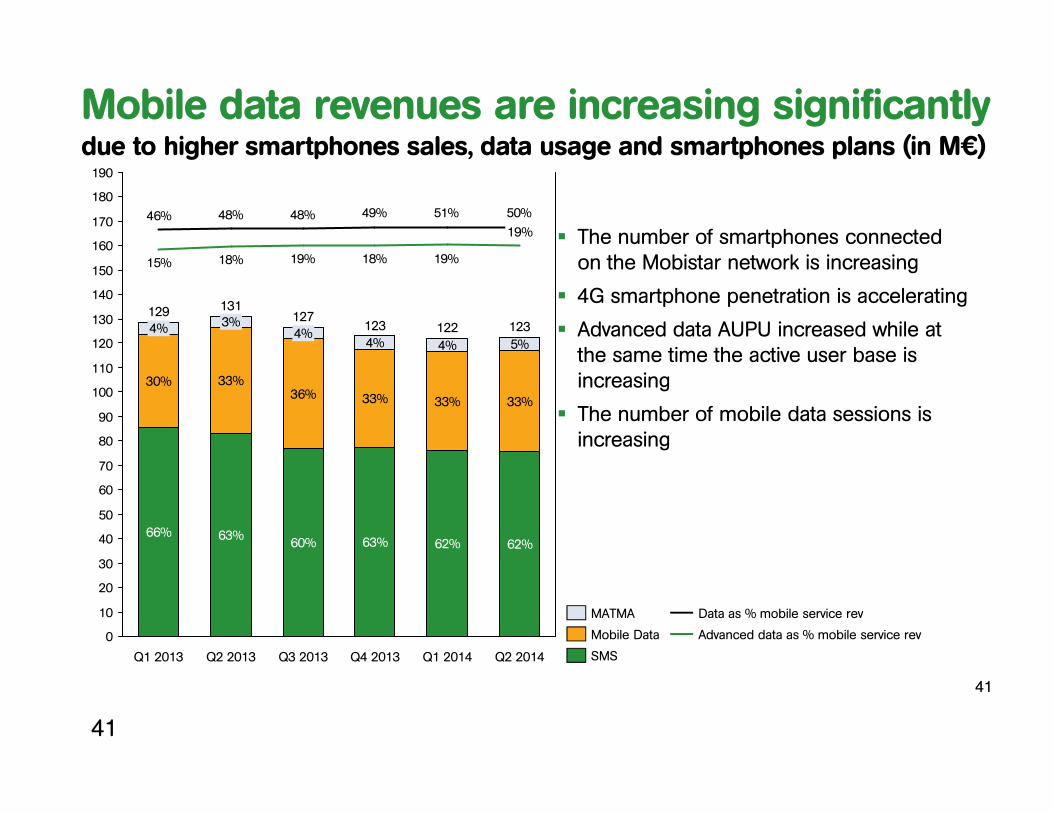
� The number of smartphones connected on the Mobistar network is increasing
� 4G smartphone penetration is accelerating
� Advanced data AUPU increased while at the same time the active user base is increasing
� The number of mobile data sessions is increasing
Mobile data revenues are increasing significantly due to higher smartphones sales, data usage and smartphones plans (in M€)
41
42
17% 17% 17% 19% 19%
13% 16% 16% 10% 12%
7% 7%
51% 51% 49% 50% 49%
4%4%4%4%4%
5%5%5%
31%
2013
1.283
1H 2014
553
3%
1% 1%
1%
2%
Q2 2014
2%
274
2%
1%
3%
2%3%
2%
Q2 2013 1H 2013
1%
1%
2%
3%2%2%
1%
3%
316 659
2%
3%2%
1%
1%
MTR SMS
Visitor Roaming
MTR Voice
Roaming Data
Roaming voice
Roaming SMS
Handsets
MVNO
M2M
Retail billed revenues
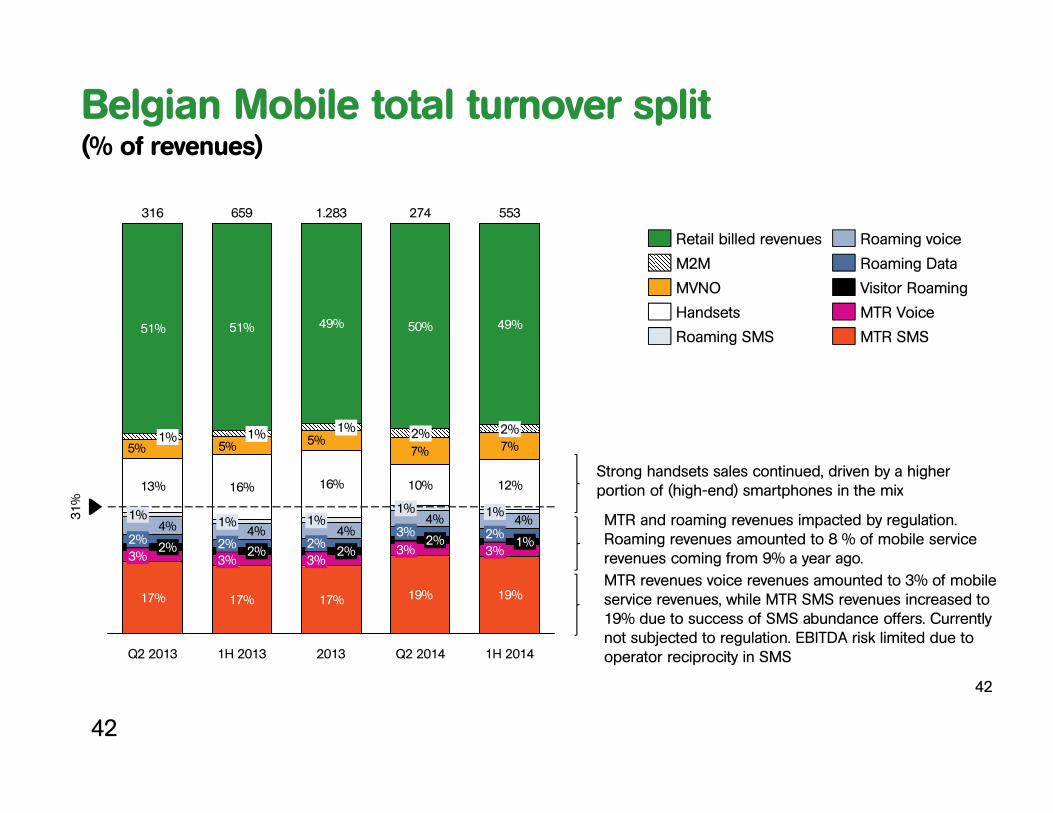
MTR revenues voice revenues amounted to 3% of mobile service revenues, while MTR SMS revenues increased to 19% due to success of SMS abundance offers. Currently not subjected to regulation. EBITDA risk limited due to operator reciprocity in SMS
MTR and roaming revenues impacted by regulation. Roaming revenues amounted to 8 % of mobile service revenues coming from 9% a year ago.
Strong handsets sales continued, driven by a higher portion of (high-end) smartphones in the mix
42
Belgian Mobile total turnover split (% of revenues)

Q&A
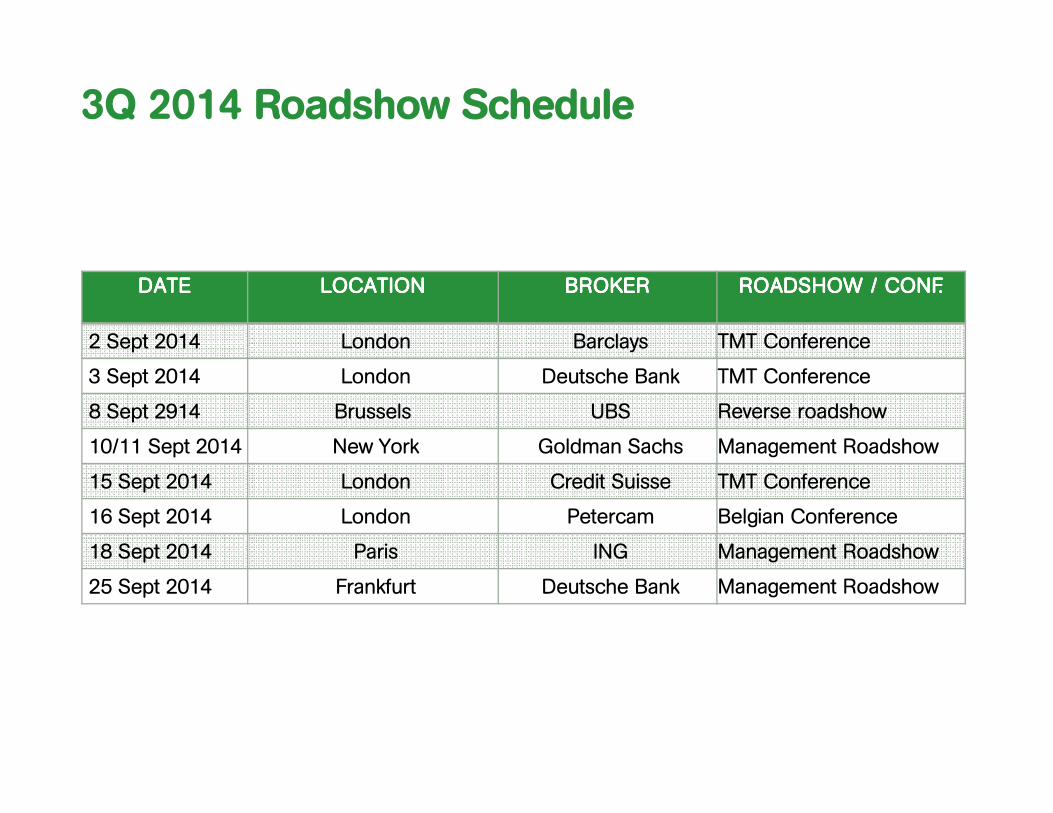
DATEDATEDATEDATE LOCATIONLOCATIONLOCATIONLOCATION BROKERBROKERBROKERBROKER ROADSHOW / ROADSHOW / ROADSHOW / ROADSHOW / CONF.CONF.CONF.CONF.
2 Sept 2014 London Barclays TMT Conference
3 Sept 2014 London Deutsche Bank TMT Conference
8 Sept 2914 Brussels UBS Reverse roadshow
10/11 Sept 2014 New York Goldman Sachs Management Roadshow
15 Sept 2014 London Credit Suisse TMT Conference
16 Sept 2014 London Petercam Belgian Conference
18 Sept 2014 Paris ING Management Roadshow
25 Sept 2014 Frankfurt Deutsche Bank Management Roadshow
3Q 2014 Roadshow Schedule
FURTHER QUESTIONS? PLEASE CONTACT THE IR DEPARTMENT
Investor RelationsPhone: +32 2 745 80 92E-mail: [email protected]
For further information please visit
www.mobistar.be
http://business.mobistar.be
http://corporate.mobistar.be