Embed Size (px)
Citation preview
Cover Page
RTA Modal Investigation Report
DRAFT - Apri l 2016
Major Intersections/Important Facilities Study Technical Memorandums 3 and 4

This page was intentionally left blank
Modal Investigation Report Final – April 2016
i
Table of Contents
Section Page #
1. Travel Forecast and Level of Service (LOS) ............................................................................ 1 1.1 No Build – Existing + Committed (E+C) Scenario ..................................................................... 1
1.2 Roadway Widening Only – CLRP Plan Scenario ...................................................................... 1
1.3. Corridor CLRP Improvement ..................................................................................................... 1
2. Mode Investigation ...................................................................................................................... 3 2.1 College Parkway ........................................................................................................................ 6
2.2 Forest Drive .............................................................................................................................. 19
2.3 MD 173/Fort Smallwood Road ................................................................................................. 29
2.4 MD 177/Mountain Road ........................................................................................................... 35
2.5 MD 214/Central Avenue ........................................................................................................... 50
2.6 MD 256/Deale Road & MD 468/Shady Side Road................................................................... 58
2.7 MD 665/Aris T. Allen Boulevard ............................................................................................... 65 2.8 Conclusion ................................................................................................................................ 72 3. Summary of Forecasts ............................................................................................................. 73
3.1 Summary of No Build and CLRP Level of Service ................................................................... 73
Appendix A (Transit Maps) Appendix B (Transit Service Descriptions) Appendix C (HCM and VISSIM Reports)
Modal Investigation Report Final – April 2016
ii
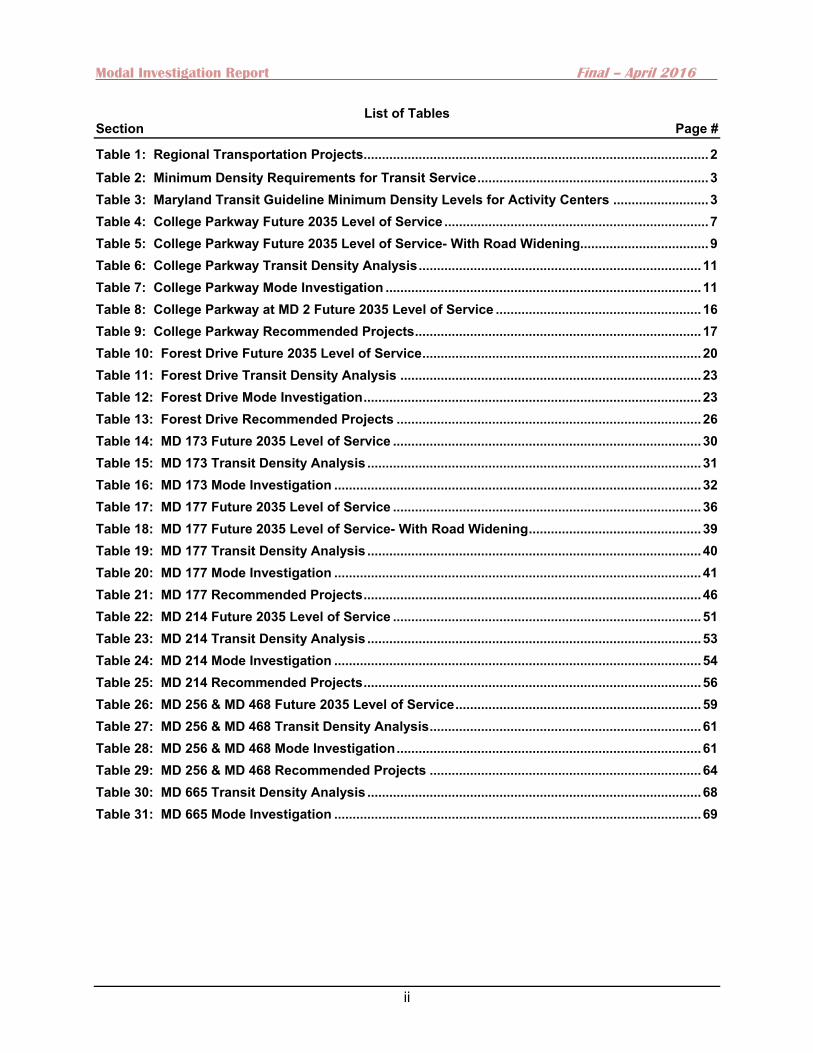
List of Tables Section Page #
Table 1: Regional Transportation Projects .............................................................................................. 2
Table 2: Minimum Density Requirements for Transit Service ............................................................... 3
Table 3: Maryland Transit Guideline Minimum Density Levels for Activity Centers .......................... 3
Table 4: College Parkway Future 2035 Level of Service ........................................................................ 7 Table 5: College Parkway Future 2035 Level of Service- With Road Widening................................... 9 Table 6: College Parkway Transit Density Analysis ............................................................................. 11
Table 7: College Parkway Mode Investigation ...................................................................................... 11
Table 8: College Parkway at MD 2 Future 2035 Level of Service ........................................................ 16
Table 9: College Parkway Recommended Projects .............................................................................. 17
Table 10: Forest Drive Future 2035 Level of Service ............................................................................ 20
Table 11: Forest Drive Transit Density Analysis .................................................................................. 23
Table 12: Forest Drive Mode Investigation ............................................................................................ 23
Table 13: Forest Drive Recommended Projects ................................................................................... 26
Table 14: MD 173 Future 2035 Level of Service .................................................................................... 30
Table 15: MD 173 Transit Density Analysis ........................................................................................... 31
Table 16: MD 173 Mode Investigation .................................................................................................... 32
Table 17: MD 177 Future 2035 Level of Service .................................................................................... 36
Table 18: MD 177 Future 2035 Level of Service- With Road Widening ............................................... 39
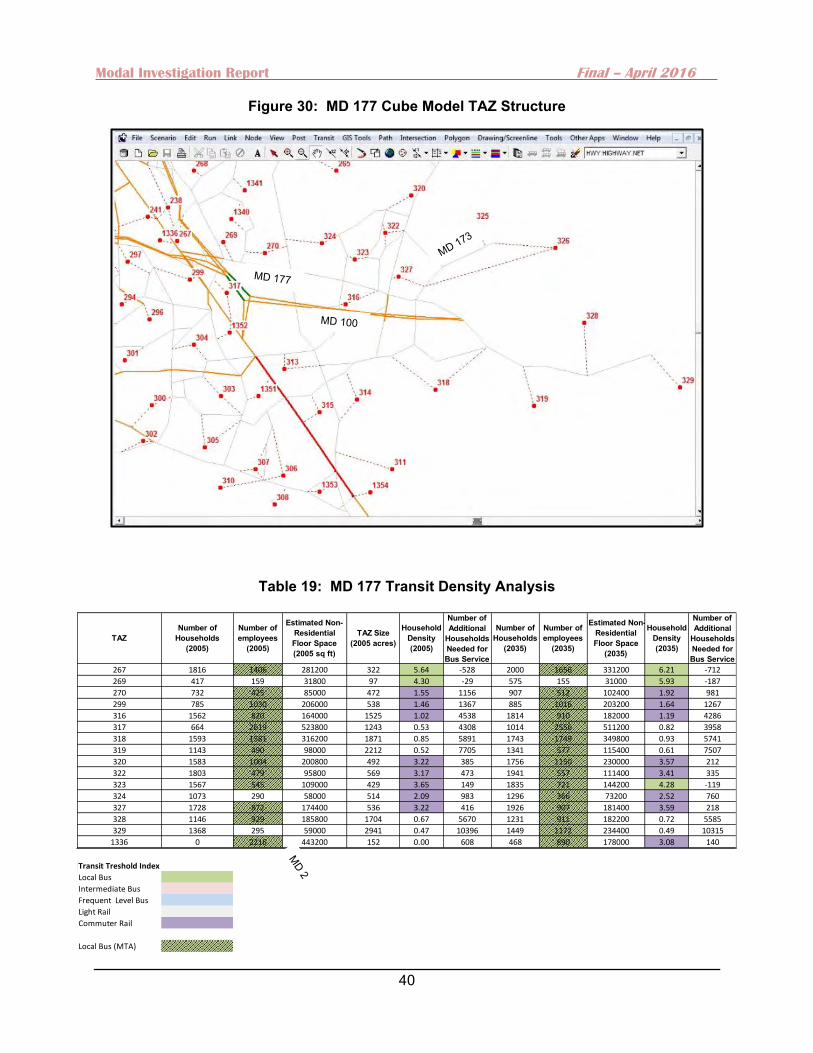
Table 19: MD 177 Transit Density Analysis ........................................................................................... 40
Table 20: MD 177 Mode Investigation .................................................................................................... 41
Table 21: MD 177 Recommended Projects ............................................................................................ 46
Table 22: MD 214 Future 2035 Level of Service .................................................................................... 51
Table 23: MD 214 Transit Density Analysis ........................................................................................... 53
Table 24: MD 214 Mode Investigation .................................................................................................... 54
Table 25: MD 214 Recommended Projects ............................................................................................ 56
Table 26: MD 256 & MD 468 Future 2035 Level of Service ................................................................... 59
Table 27: MD 256 & MD 468 Transit Density Analysis .......................................................................... 61
Table 28: MD 256 & MD 468 Mode Investigation ................................................................................... 61
Table 29: MD 256 & MD 468 Recommended Projects .......................................................................... 64
Table 30: MD 665 Transit Density Analysis ........................................................................................... 68
Table 31: MD 665 Mode Investigation .................................................................................................... 69
Modal Investigation Report Final – April 2016
iii
List of Figures
Section Page #
Figure 1: College Parkway Cube Model TAZ Structure .......................................................................... 6 Figure 2: Future College Parkway Arterial Level of Service .................................................................. 7 Figure 3: Future College Parkway Level of Service “Hot Spots” .......................................................... 8
Figure 4: Future College Parkway Corridor Level of Service- With Road Widening ........................... 9
Figure 5: College Parkway Cube Model TAZ Structure ........................................................................ 10
Figure 6: College Parkway Corridor Transit .......................................................................................... 12
Figure 7: College Parkway Corridor Zoning .......................................................................................... 13
Figure 8: Michigan Left ............................................................................................................................ 15
Figure 9: Continuous Flow Intersection ................................................................................................ 15
Figure 10: New Jersey Jug Handle ......................................................................................................... 16
Figure 11: College Parkway Corridor Recommendations ................................................................... 18
Figure 12: College Parkway Proposed Typical Cross Section ............................................................ 19
Figure 13: Future Forest Drive Corridor Level of Service .................................................................... 19
Figure 14: Future Forest Drive Level of Service “Hot Spots” ............................................................. 21
Figure 15: Forest Drive Cube Model TAZ Structure ............................................................................. 22
Figure 16: Existing Forest Drive Corridor Transit ................................................................................ 24
Figure 17: Forest Drive Corridor Zoning ............................................................................................... 25
Figure 18: Forest Drive Corridor Recommendations ........................................................................... 26 Figure 19: Forest Drive Proposed Typical Cross Section- 2 Lane ...................................................... 27
Figure 20: Forest Drive Proposed Typical Cross Section- 4 Lane ...................................................... 28
Figure 21: Forest Drive Proposed Typical Cross Section- 6 Lane ...................................................... 28
Figure 22: Future MD 173 Corridor Level of Service ............................................................................ 30
Figure 23: MD 173 Cube Model TAZ Structure ...................................................................................... 31
Figure 24: MD 173 Corridor Zoning ........................................................................................................ 32
Figure 25: MD 173 Corridor Recommendations ................................................................................... 33
Figure 26: MD 173 Typical Cross Section .............................................................................................. 34
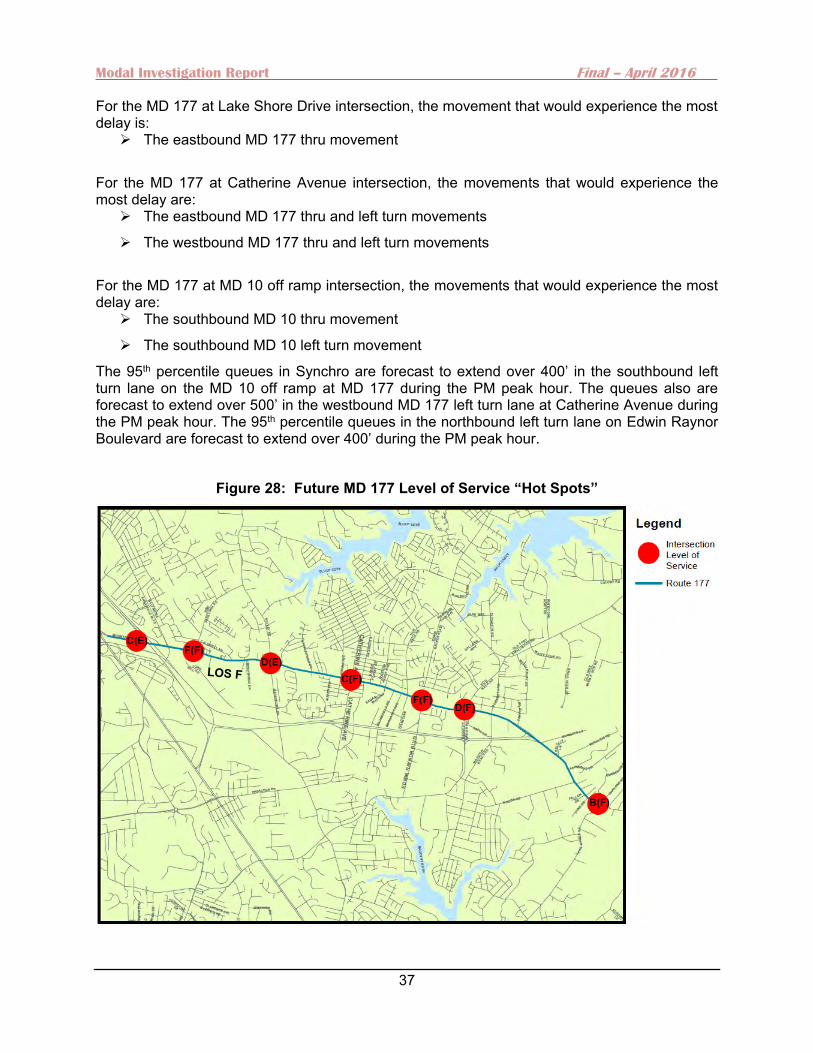
Figure 27: Future MD 177 Corridor Level of Service ............................................................................ 35
Figure 28: Future MD 177 Level of Service “Hot Spots” ...................................................................... 37
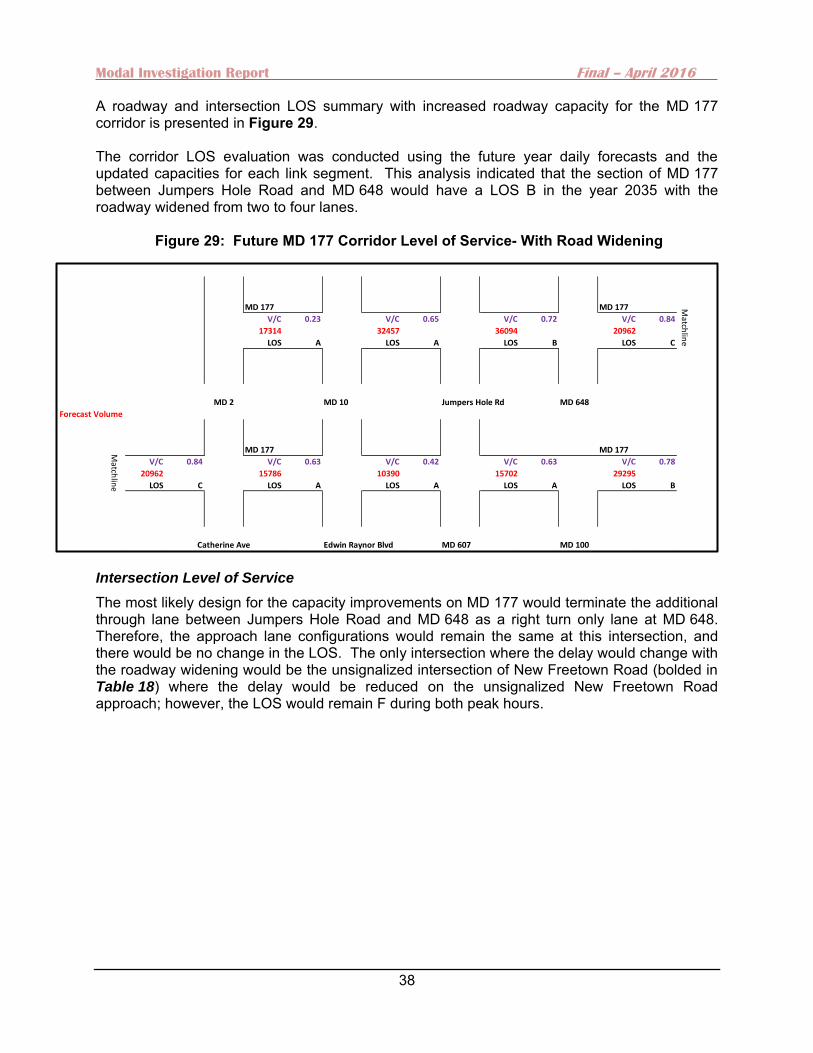
Figure 29: Future MD 177 Corridor Level of Service- With Road Widening ....................................... 38
Figure 30: MD 177 Cube Model TAZ Structure ...................................................................................... 40
Figure 31: Existing MD 177 Corridor Transit ......................................................................................... 41
Figure 32: MD 177 Corridor Zoning ........................................................................................................ 42
Figure 33: MD 177 Corridor Recommendations ................................................................................... 45
Figure 34: MD 177 Proposed Typical Cross Section ............................................................................ 47
Figure 35: MD 177 Proposed Typical Cross Section- 3 Lane .............................................................. 48
Modal Investigation Report Final – April 2016
iv
Section Page #
Figure 36: MD 177 Proposed Typical Cross Section- 2 Lane .............................................................. 49
Figure 37: MD 177 Proposed Typical Cross Section- 3 Lane .............................................................. 49
Figure 38: Future MD 214 Corridor Level of Service ............................................................................ 50
Figure 39: Future MD 214 Level of Service ............................................................................................ 52
Figure 40: MD 214 Cube Model TAZ Structure ...................................................................................... 53
Figure 41: MD 214 Corridor Transit Service .......................................................................................... 54
Figure 42: MD 214 Corridor Zoning ........................................................................................................ 55
Figure 43: MD 214 Corridor Recommendations ................................................................................... 56
Figure 44: MD 214 Proposed Typical Cross Section- 2 Lane .............................................................. 57
Figure 45: MD 214 Proposed Typical Cross Section- 4 Lane .............................................................. 57
Figure 46: Future MD 256 & MD 468 Corridor Level of Service ........................................................... 58
Figure 47: MD 256 & MD 468 Corridor Recommendations .................................................................. 59
Figure 48: MD 256 & MD 468 Cube Model TAZ Structure .................................................................... 60
Figure 49: MD 256 & MD 468 Corridor Zoning ....................................................................................... 62
Figure 50: MD 256 & MD 468 Corridor Recommendations .................................................................. 63
Figure 51: MD 256 & MD 468 Proposed Typical Cross Section ........................................................... 64
Figure 52: Future MD 665 Corridor Level of Service ............................................................................ 65
Figure 53: Future MD 665 Level of Service HCS “Hot Spots” ............................................................. 66
Figure 54: MD 665 Cube Model TAZ Structure ...................................................................................... 68
Figure 55: Existing MD 665 Corridor Transit ......................................................................................... 69
Figure 56: MD 665 Corridor Zoning ........................................................................................................ 70
Figure 57: MD 665 Existing Typical Cross Section .............................................................................. 71
Modal Investigation Report Final – April 2016
1
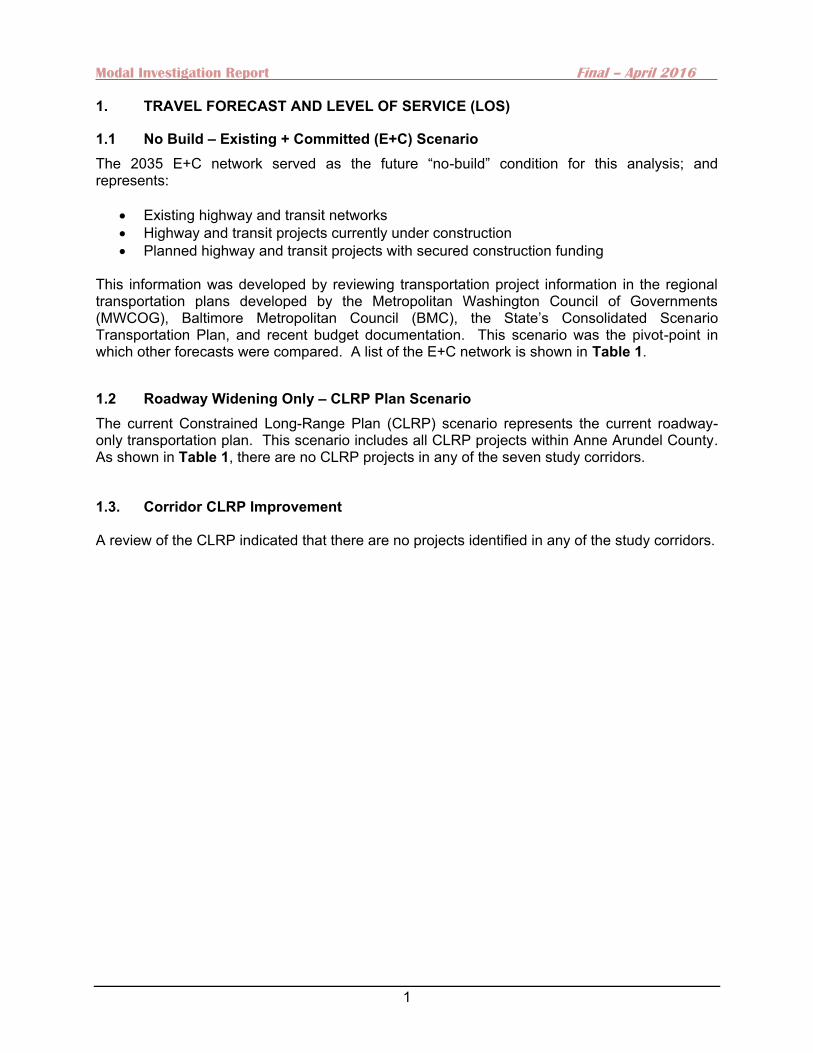
1. TRAVEL FORECAST AND LEVEL OF SERVICE (LOS)
1.1 No Build – Existing + Committed (E+C) Scenario The 2035 E+C network served as the future “no-build” condition for this analysis; and represents:
Existing highway and transit networks Highway and transit projects currently under construction Planned highway and transit projects with secured construction funding
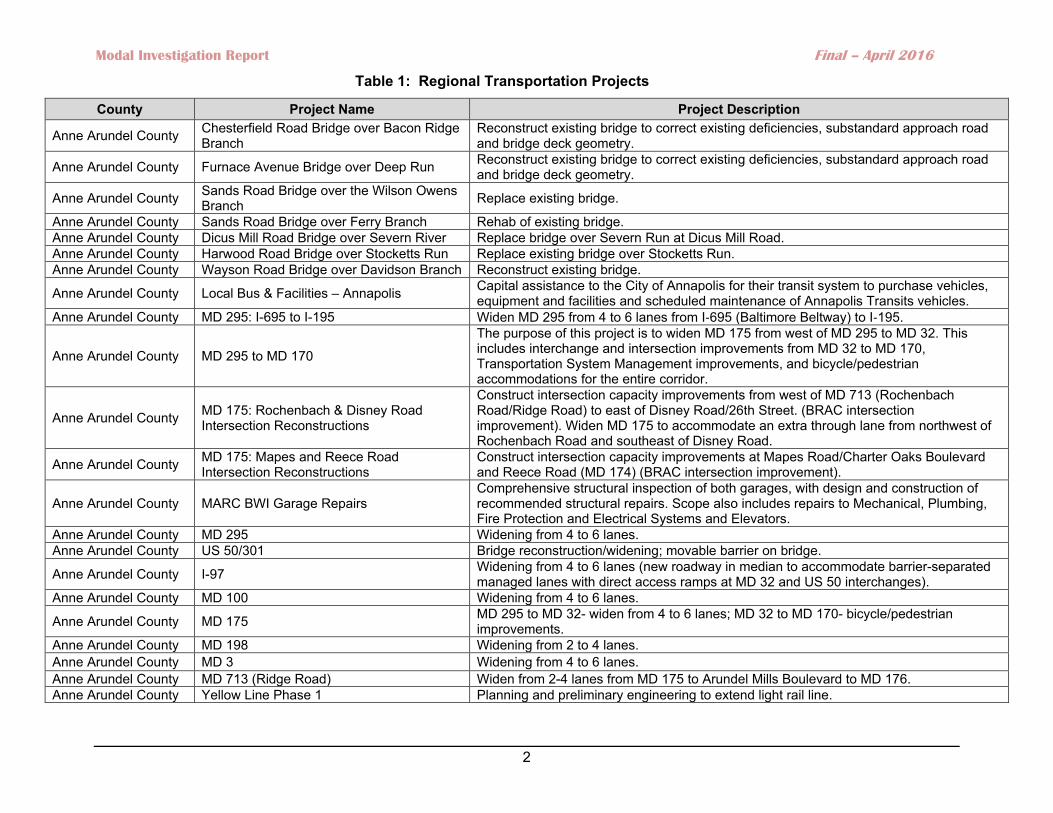
This information was developed by reviewing transportation project information in the regional transportation plans developed by the Metropolitan Washington Council of Governments (MWCOG), Baltimore Metropolitan Council (BMC), the State’s Consolidated Scenario Transportation Plan, and recent budget documentation. This scenario was the pivot-point in which other forecasts were compared. A list of the E+C network is shown in Table 1.
1.2 Roadway Widening Only – CLRP Plan Scenario The current Constrained Long-Range Plan (CLRP) scenario represents the current roadway-only transportation plan. This scenario includes all CLRP projects within Anne Arundel County. As shown in Table 1, there are no CLRP projects in any of the seven study corridors.
1.3. Corridor CLRP Improvement A review of the CLRP indicated that there are no projects identified in any of the study corridors.
Modal Investigation Report Final – April 2016
2
County Project Name Project Description
Anne Arundel County Chesterfield Road Bridge over Bacon Ridge Branch
Reconstruct existing bridge to correct existing deficiencies, substandard approach road and bridge deck geometry.
Anne Arundel County Furnace Avenue Bridge over Deep Run Reconstruct existing bridge to correct existing deficiencies, substandard approach road and bridge deck geometry.
Anne Arundel County Sands Road Bridge over the Wilson Owens Branch Replace existing bridge.
Anne Arundel County Sands Road Bridge over Ferry Branch Rehab of existing bridge. Anne Arundel County Dicus Mill Road Bridge over Severn River Replace bridge over Severn Run at Dicus Mill Road. Anne Arundel County Harwood Road Bridge over Stocketts Run Replace existing bridge over Stocketts Run. Anne Arundel County Wayson Road Bridge over Davidson Branch Reconstruct existing bridge.
Anne Arundel County Local Bus & Facilities – Annapolis Capital assistance to the City of Annapolis for their transit system to purchase vehicles, equipment and facilities and scheduled maintenance of Annapolis Transits vehicles.
Anne Arundel County MD 295: I-695 to I-195 Widen MD 295 from 4 to 6 lanes from I‐695 (Baltimore Beltway) to I‐195.
Anne Arundel County MD 295 to MD 170
The purpose of this project is to widen MD 175 from west of MD 295 to MD 32. This includes interchange and intersection improvements from MD 32 to MD 170, Transportation System Management improvements, and bicycle/pedestrian accommodations for the entire corridor.
Anne Arundel County MD 175: Rochenbach & Disney Road Intersection Reconstructions
Construct intersection capacity improvements from west of MD 713 (Rochenbach Road/Ridge Road) to east of Disney Road/26th Street. (BRAC intersection improvement). Widen MD 175 to accommodate an extra through lane from northwest of Rochenbach Road and southeast of Disney Road.
Anne Arundel County MD 175: Mapes and Reece Road Intersection Reconstructions
Construct intersection capacity improvements at Mapes Road/Charter Oaks Boulevard and Reece Road (MD 174) (BRAC intersection improvement).
Anne Arundel County MARC BWI Garage Repairs Comprehensive structural inspection of both garages, with design and construction of recommended structural repairs. Scope also includes repairs to Mechanical, Plumbing, Fire Protection and Electrical Systems and Elevators.
Anne Arundel County MD 295 Widening from 4 to 6 lanes. Anne Arundel County US 50/301 Bridge reconstruction/widening; movable barrier on bridge.
Anne Arundel County I-97 Widening from 4 to 6 lanes (new roadway in median to accommodate barrier-separated managed lanes with direct access ramps at MD 32 and US 50 interchanges).
Anne Arundel County MD 100 Widening from 4 to 6 lanes.
Anne Arundel County MD 175 MD 295 to MD 32- widen from 4 to 6 lanes; MD 32 to MD 170- bicycle/pedestrian improvements.
Anne Arundel County MD 198 Widening from 2 to 4 lanes. Anne Arundel County MD 3 Widening from 4 to 6 lanes. Anne Arundel County MD 713 (Ridge Road) Widen from 2-4 lanes from MD 175 to Arundel Mills Boulevard to MD 176. Anne Arundel County Yellow Line Phase 1 Planning and preliminary engineering to extend light rail line.
Table 1: Regional Transportation Projects
Modal Investigation Report Final – April 2016
3
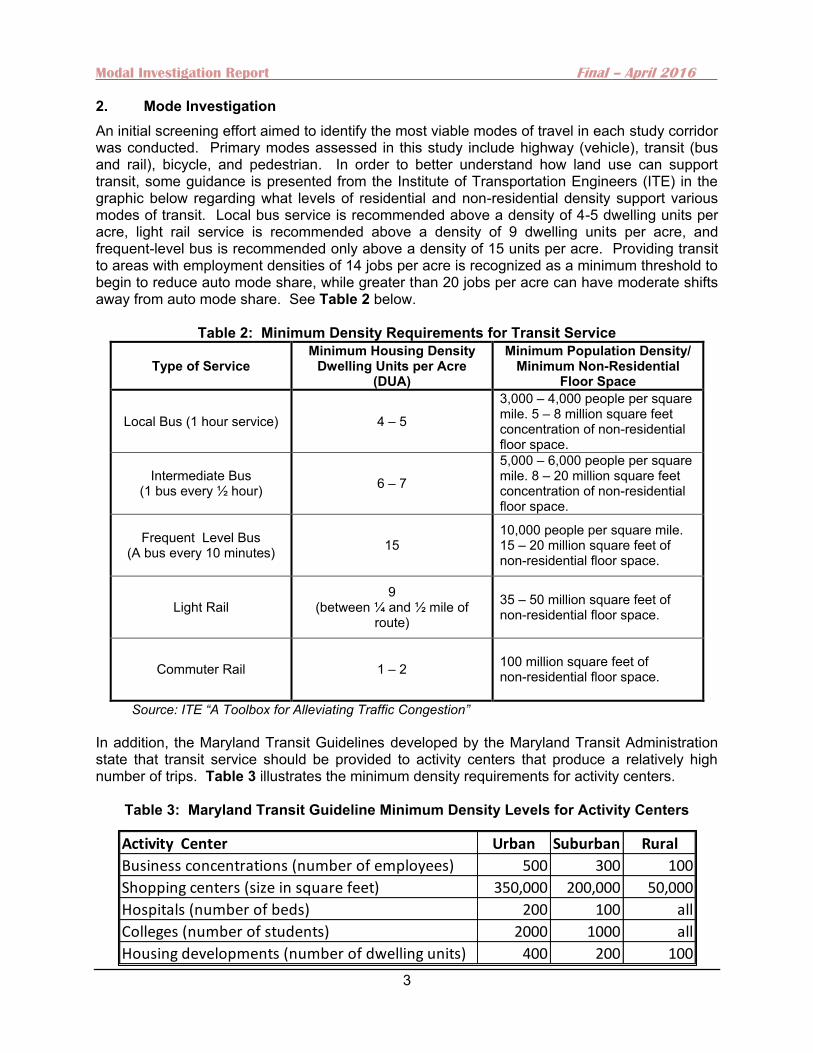
2. Mode Investigation An initial screening effort aimed to identify the most viable modes of travel in each study corridor was conducted. Primary modes assessed in this study include highway (vehicle), transit (bus and rail), bicycle, and pedestrian. In order to better understand how land use can support transit, some guidance is presented from the Institute of Transportation Engineers (ITE) in the graphic below regarding what levels of residential and non-residential density support various modes of transit. Local bus service is recommended above a density of 4-5 dwelling units per acre, light rail service is recommended above a density of 9 dwelling units per acre, and frequent-level bus is recommended only above a density of 15 units per acre. Providing transit to areas with employment densities of 14 jobs per acre is recognized as a minimum threshold to begin to reduce auto mode share, while greater than 20 jobs per acre can have moderate shifts away from auto mode share. See Table 2 below.
Table 2: Minimum Density Requirements for Transit Service
Type of Service Minimum Housing Density
Dwelling Units per Acre (DUA)
Minimum Population Density/ Minimum Non-Residential
Floor Space
Local Bus (1 hour service) 4 – 5
3,000 – 4,000 people per square mile. 5 – 8 million square feet concentration of non-residential floor space.
Intermediate Bus (1 bus every ½ hour) 6 – 7
5,000 – 6,000 people per square mile. 8 – 20 million square feet concentration of non-residential floor space.
Frequent Level Bus (A bus every 10 minutes) 15
10,000 people per square mile. 15 – 20 million square feet of non-residential floor space.
Light Rail 9
(between ¼ and ½ mile of route)
35 – 50 million square feet of non-residential floor space.
Commuter Rail 1 – 2 100 million square feet of non-residential floor space.
Source: ITE “A Toolbox for Alleviating Traffic Congestion” In addition, the Maryland Transit Guidelines developed by the Maryland Transit Administration state that transit service should be provided to activity centers that produce a relatively high number of trips. Table 3 illustrates the minimum density requirements for activity centers.
Table 3: Maryland Transit Guideline Minimum Density Levels for Activity Centers
Activity Center Urban Suburban Rural
Business concentrations (number of employees) 500 300 100
Shopping centers (size in square feet) 350,000 200,000 50,000
Hospitals (number of beds) 200 100 all
Colleges (number of students) 2000 1000 all
Housing developments (number of dwelling units) 400 200 100
Modal Investigation Report Final – April 2016
4
An analysis was performed using the County’s existing Traffic Analysis Zone (TAZ) structure. The analysis included estimating the amount of square footage per employee (the model land use input file is coded in employees), and the TAZ analysis was conducted using square footage. The household and employment densities were then calculated for each TAZ in or adjacent to the study corridors. The analysis included only those zones within ½ mile of any of the seven study corridors. A limitation of this analysis is that it does not include projects currently undergoing rezoning or any other area plans where increased density is recommended. However, the analysis for each corridor includes the additional housing units and/or number of jobs that would be required to achieve the minimum ITE thresholds for transit service. The results of this analysis are presented in each corridor modal assessment on the following pages. The land use analysis recommendations, (i.e. increased households or employment) were based on the assumption that the land use would remain consistent, i.e. households were added in existing residential areas and employment was added where land use is currently zoned for employment. The density was calculated by dividing the number of households in each study corridor TAZ by the number of acres in each corresponding TAZ. The density for each zone was then compared to both the ITE and MTA thresholds for providing transit service. While ITE lists thresholds for specific types of transit service, the MTA thresholds were developed for bus service only. The analysis indicates that in the existing and year 2035 conditions, there are some opportunities to implement and/or improve existing transit service in most of the study corridors. The fact that there are a number of zones with both the employment and residential density to support transit means that alternative modes of travel (particularly combined with increased employment density in Activity Centers such as the Annapolis Towne Center) can supplement the targeted expansion of the roadway network. Without these improvements, many residents will be forced to commute by car to work, on congested roadways for longer distances to locations both within the County and outside of the County. Without improvements to non-motorized modes of travel, short work and Home-Based-Shopping trips and Home-Based-Other trips will also rely on vehicles as the primary mode of travel. Many of the subdivisions in the study corridors were developed in typical suburban fashion with cul-de-sacs and limited connectivity between neighborhoods which leads to an over-reliance of vehicles for short trips, many of which are concentrated on primary routes such as Forest Drive and MD 177. In order to begin identifying appropriate modes of transit within each corridor, varying levels and modes of transit were considered, including heavy rail, light rail, streetcar, commuter bus, premium bus, local bus, and bus rapid transit. More detailed information on transit can be found in the Appendix A and B.. Where applicable, the regional travel modeling tool and model input files were used to identify the following key issues regarding alternative modes of travel:
If currently approved land use patterns and future travel demand support new transit service.
If additional land use density, or increased service frequency and/or speed (through priority treatments) would make transit, carpooling, or tolled lanes a viable travel choice.
If provision of alternative modes of travel would result in any measurable reduction in projected daily vehicle traffic and/or levels of congestion.
If any supporting facilities/infrastructure (park & ride facilities, priority treatments, rights-of-way) would be needed to implement a seamless network.

Modal Investigation Report Final – April 2016
5
FUTURE CONDITIONS AND LEVEL OF SERVICE ANALYSIS Future conditions analysis was conducted using the modified AATrvM travel demand model and National Cooperative Highway Research Program (NCHRP) Report 765, Analytical Travel Forecasting Approaches for Project-Level Planning and Design procedures. The daily forecasts from the travel demand model were post processed to account for the differences between observed and simulated counts in the base year. The output from the NCHRP 765 process is a refined daily link forecasts which were used with existing K and D factors for the study corridors to develop peak hour year 2035 intersection forecasts for the study intersections. As in the existing conditions analysis, the roadway capacity analysis was performed using Highway Capacity Manual (HCM) Year 2000 procedures, utilizing the Synchro 9 and VISSIM 7 traffic analysis software. VISSIM was used to conduct the analysis of the roundabout at MD 256 at MD 258, and Synchro was used to evaluate the remaining intersections. The HCM and VISSIM reports are in Appendix C. Overall, “hot spots” were identified, which are locations with traffic operations that are projected at LOS E or F at study intersections. The majority of the intersections with poor LOS in the year 2035 are the same intersections which experience LOS E and F in the existing conditions. In addition, a corridor Level of Service (LOS) analysis was conducted using the AATrvM travel demand model and Synchro. The AATRvM travel demand model results were compared to forecast roadway capacity which was used to determine the LOS at the highway link level. For locations where the link level LOS is projected be E or F in the year 2035, additional Arterial LOS analysis was conducted using Synchro where applicable to determine if signal system optimization would provide an alternative to adding additional highway capacity which can be challenging due to right-of-way and environmental constraints as well as public resistance. Revised Travel Demand Assessment by Corridor After the initial screening effort aimed to identify the most viable modes of travel in each study corridor was completed, additional travel demand model runs were conducted to determine the impacts of the proposed improvements. The primary modes assessed in this study included highway (vehicle), transit (bus and rail), bicycle, and pedestrian. Based on the analysis in the modal assessment, there were a total of two improvements that needed to be modeled. This is due to the majority of the recommendations being related to intersection, bicycle, and transit improvements which are not captured in the AATrvM travel demand model. The two modeled improvements were the widening of College Parkway from two to four lanes from west of Jones Station Road to MD 179 (Cape St. Claire Road) and the widening of MD 177 from two to four lanes from Jumpers Hole Road to MD 648 (Waterford Road). These capacity improvements were recommended based on forecast volume to capacity ratios ranging from 0.96 to over 1.3 in these segments, which is an indication that signal timing optimization and intersection improvements alone will not be sufficient to accommodate the forecast demand. The segment analysis indicates that in the year 2035 conditions, the capacity improvements would improve the Level of Service (LOS) to an acceptable level.
Public opposition can derail projects
Modal Investigation Report Final – April 2016
6
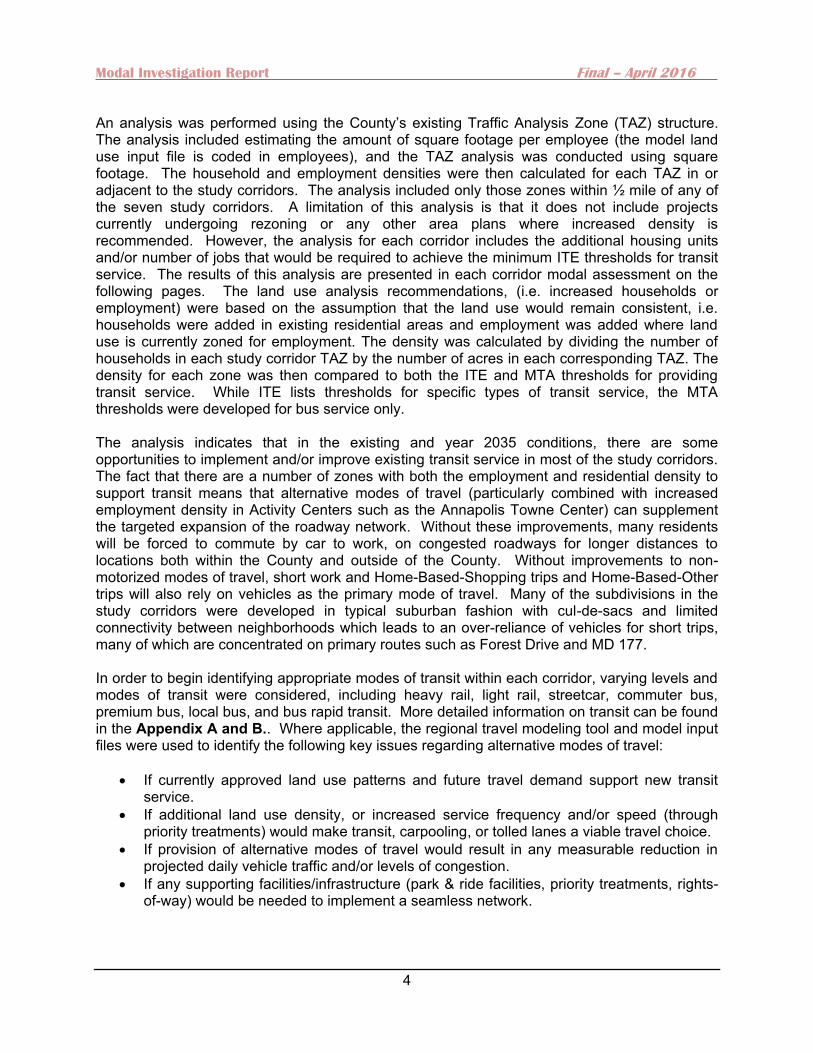
To test the effectiveness of the capacity improvements at the intersection level, additional capacity analysis was performed using Highway Capacity Manual (HCM) Year 2000 procedures utilizing the Synchro 9 traffic analysis software. A discussion for each corridor is presented in the following sections. 2.1 College Parkway Corridor Level of Service The corridor LOS evaluation was conducted using the future year daily forecasts and the capacities for each link segment (see Figure 1). This analysis was conducted to determine the proposed typical cross sections and to determine if additional roadway capacity would be needed in the future. The results of the corridor LOS analysis illustrates that the section of College Parkway between Bay Dale Drive and MD 179/Cape St. Claire Road would have a LOS E in the year 2035. The segment between Bay Dale Drive and Jones Station Road would also experience near capacity conditions as College Parkway tapers from four to two lanes west of Jones Station Road. It should be noted that the corridor LOS evaluation is purely a demand/capacity based performance measure and does not include the impacts of numerous driveways, weaving traffic, transit bus stops, and other operational-related issues which are best captured through detailed traffic micro-simulation.
Figure 1: Future College Parkway Corridor Level of Service
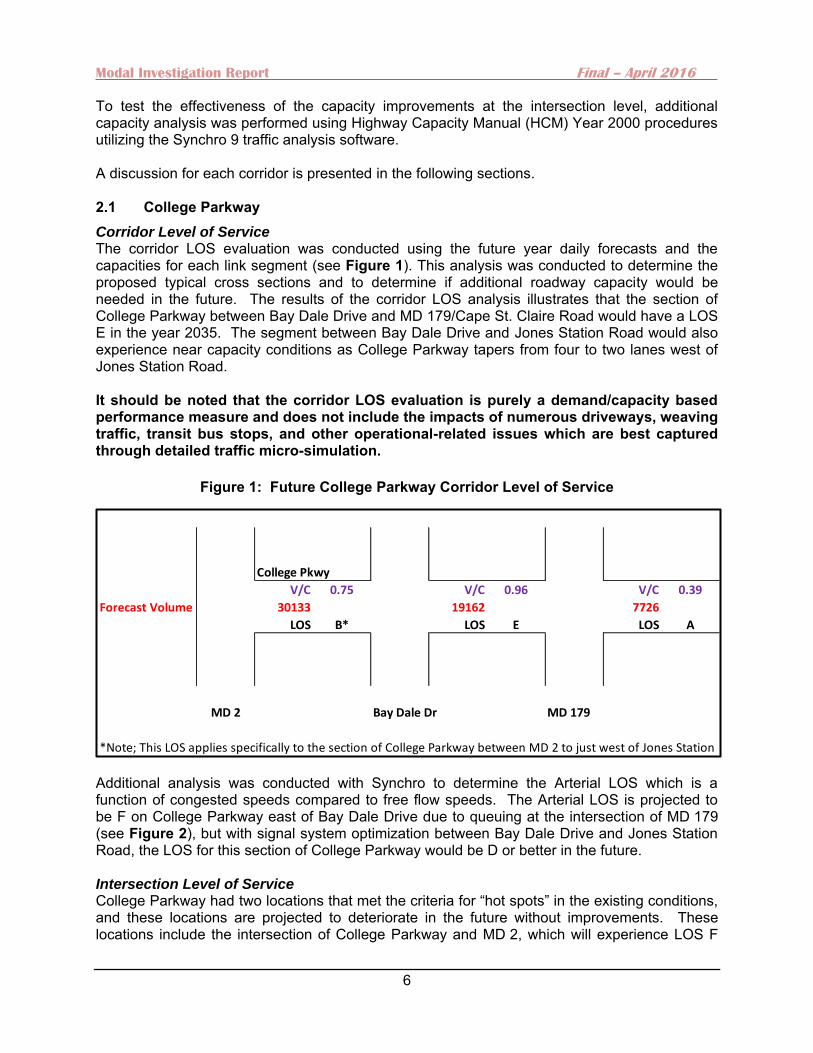
Additional analysis was conducted with Synchro to determine the Arterial LOS which is a function of congested speeds compared to free flow speeds. The Arterial LOS is projected to be F on College Parkway east of Bay Dale Drive due to queuing at the intersection of MD 179 (see Figure 2), but with signal system optimization between Bay Dale Drive and Jones Station Road, the LOS for this section of College Parkway would be D or better in the future. Intersection Level of Service College Parkway had two locations that met the criteria for “hot spots” in the existing conditions, and these locations are projected to deteriorate in the future without improvements. These locations include the intersection of College Parkway and MD 2, which will experience LOS F
College Pkwy
V/C 0.75 V/C 0.96 V/C 0.39
Forecast Volume 30133 19162 7726
LOS B* LOS E LOS A
MD 2 Bay Dale Dr MD 179
*Note; This LOS applies specifically to the section of College Parkway between MD 2 to just west of Jones Station
Modal Investigation Report Final – April 2016
7
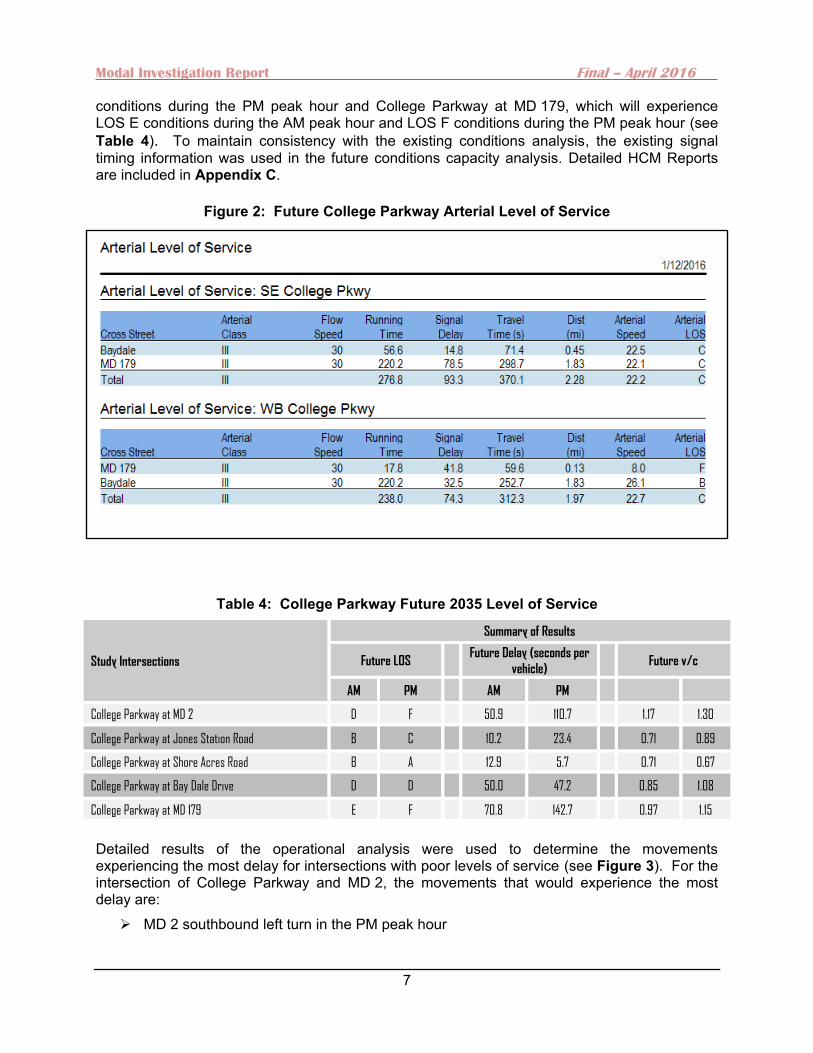
conditions during the PM peak hour and College Parkway at MD 179, which will experience LOS E conditions during the AM peak hour and LOS F conditions during the PM peak hour (see Table 4). To maintain consistency with the existing conditions analysis, the existing signal timing information was used in the future conditions capacity analysis. Detailed HCM Reports are included in Appendix C.
Figure 2: Future College Parkway Arterial Level of Service
Table 4: College Parkway Future 2035 Level of Service
Study Intersections
Summary of Results
Future LOS Future Delay (seconds per
vehicle)
Future v/c
AM PM AM PM
College Parkway at MD 2 D F 50.9 110.7 1.17 1.30
College Parkway at Jones Station Road B C 10.2 23.4 0.71 0.89
College Parkway at Shore Acres Road B A 12.9 5.7 0.71 0.67
College Parkway at Bay Dale Drive D D 50.0 47.2 0.85 1.08
College Parkway at MD 179 E F 70.8 142.7 0.97 1.15
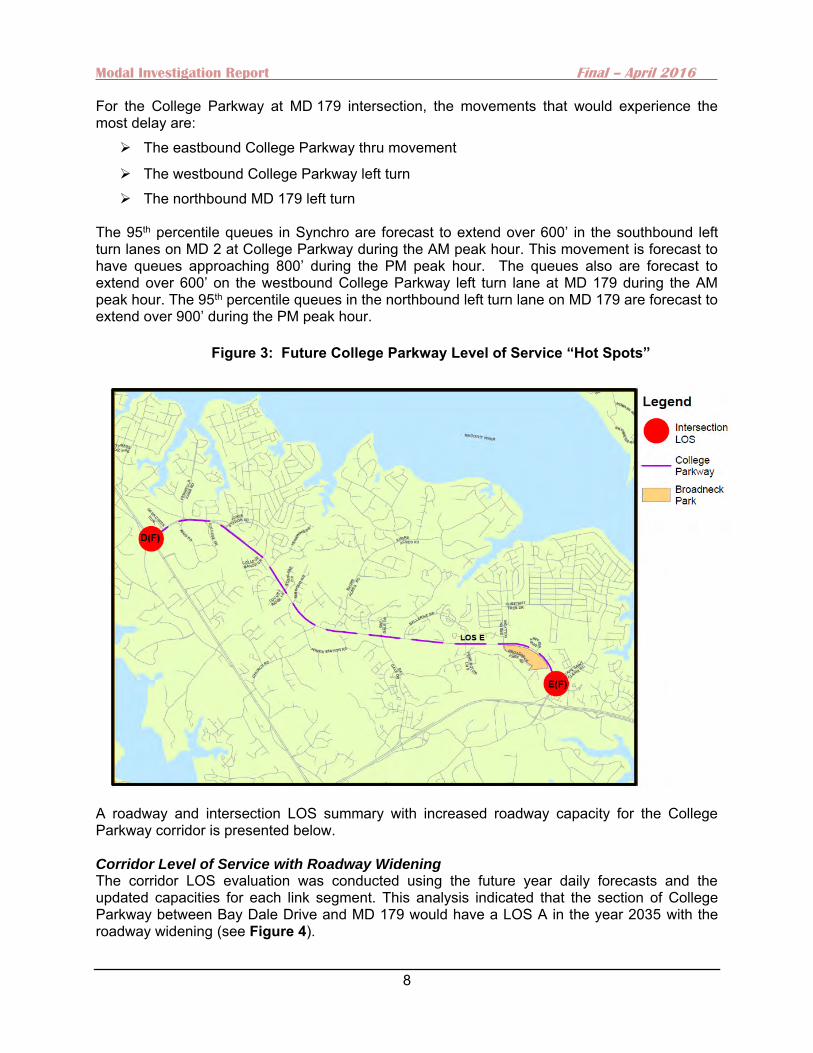
Detailed results of the operational analysis were used to determine the movements experiencing the most delay for intersections with poor levels of service (see Figure 3). For the intersection of College Parkway and MD 2, the movements that would experience the most delay are:
MD 2 southbound left turn in the PM peak hour
Modal Investigation Report Final – April 2016
8
For the College Parkway at MD 179 intersection, the movements that would experience the most delay are:
The eastbound College Parkway thru movement
The westbound College Parkway left turn The northbound MD 179 left turn
The 95th percentile queues in Synchro are forecast to extend over 600’ in the southbound left turn lanes on MD 2 at College Parkway during the AM peak hour. This movement is forecast to have queues approaching 800’ during the PM peak hour. The queues also are forecast to extend over 600’ on the westbound College Parkway left turn lane at MD 179 during the AM peak hour. The 95th percentile queues in the northbound left turn lane on MD 179 are forecast to extend over 900’ during the PM peak hour.
Figure 3: Future College Parkway Level of Service “Hot Spots”
A roadway and intersection LOS summary with increased roadway capacity for the College Parkway corridor is presented below. Corridor Level of Service with Roadway Widening The corridor LOS evaluation was conducted using the future year daily forecasts and the updated capacities for each link segment. This analysis indicated that the section of College Parkway between Bay Dale Drive and MD 179 would have a LOS A in the year 2035 with the roadway widening (see Figure 4).

Modal Investigation Report Final – April 2016
9
Figure 4: Future College Parkway Corridor Level of Service - with Road Widening
Intersection Level of Service The bolded intersections in Table 5 are the study intersections that would be impacted by the roadway widening. The roadway widening would improve the LOS to D or better at all of the impacted intersections and lower the volume to capacity ratios to levels that will allow significant flexibility for future signal timing optimization. The exception to this is the intersection at MD 179, where the v/c ratio would still exceed 1.0 with the widening in place during the PM peak hour.
Table 5: College Parkway Future 2035 Level of Service- With Road Widening
Study Intersections
Summary of Results
Future LOS Future Delay (seconds per
vehicle)
Future v/c
AM PM AM PM
College Parkway at MD 2 D F 50.9 110.7 1.17 1.30
College Parkway at Jones Station Road A B 8.0 13.9 0.38 0.54
College Parkway at Shore Acres Road A A 6.0 7.8 0.35 0.34
College Parkway at Bay Dale Drive D D 36.8 35.4 0.68 0.79
College Parkway at MD 179 D D 49.0 53.9 0.92 1.18
*Intersections Impacted by Widening The results of the revised travel demand forecasts illustrate that the proposed capacity improvements would have a positive benefit on LOS and delay for the College Parkway corridor. The construction feasibility of these improvements is summarized in Technical Memorandum 5, Corridor Footprint Assessment.
College Pkwy
V/C 0.75 V/C 0.50 V/C 0.39
Forecast Volume 30116 19897 7726
LOS B LOS A LOS A
MD 2 Bay Dale Dr MD 179

Modal Investigation Report Final – April 2016
10
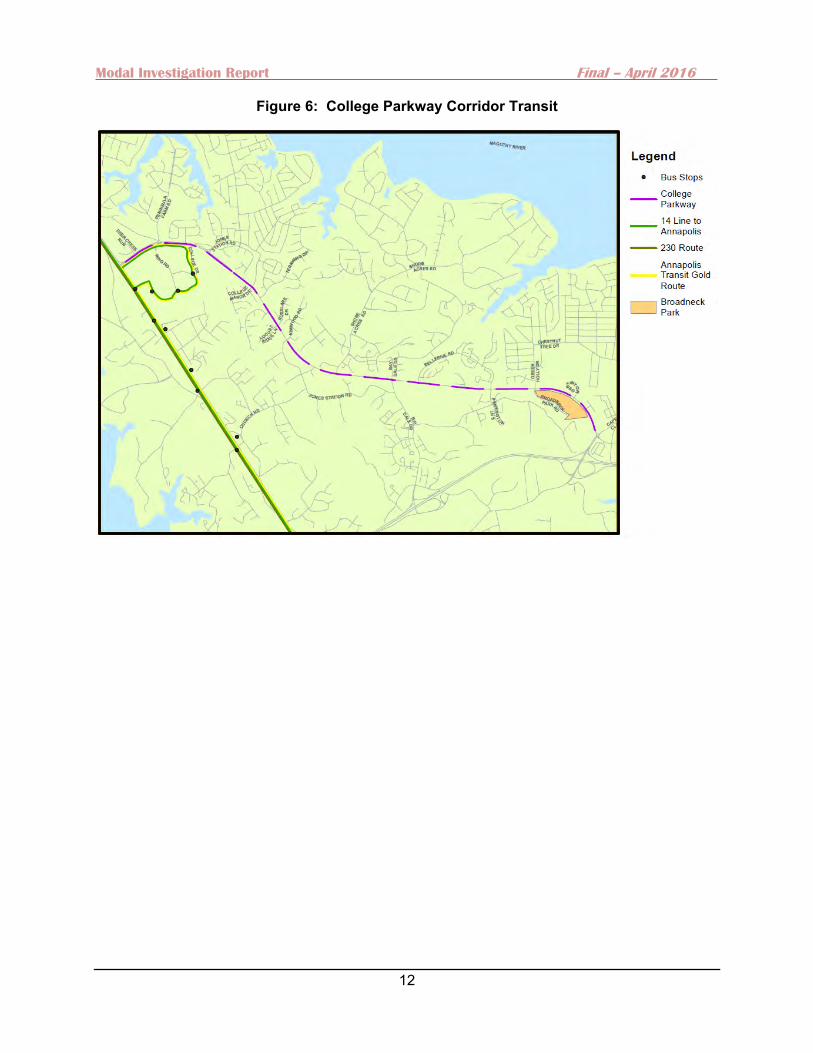
This corridor is currently served by existing Annapolis Transit bus service which runs from Edgewater to Arnold/Anne Arundel Community College (shown on Figure 6). Given that the residential and employment densities are both below the minimum thresholds for heavy and light rail transit service, and there are no significant forecast changes in density, these options were not retained for further study. As Table 6 illustrates, a number of TAZs within the College Parkway corridor meet the minimum employee thresholds for bus transit service based on MTA guidelines, though none of the zones meet the ITE density requirements for bus transit service. Given the large number of additional households that would be required to meet the ITE density requirements for local bus service, it is recommended to study extending the Annapolis Gold Route from Anne Arundel Community College to MD 179, particularly if the County changes zoning in the study corridor to allow for increased household density. Given the proximity of this corridor to the major US 50 commuting route to and from Washington, D.C., this corridor could be a part of a future alternatives analysis study for commuter rail from Annapolis to Washington, D.C. Most of the zones along the study corridor meet the density requirements for commuter rail, and potential stations could be located near US 50. Transit maps and transit service descriptions are included in Appendix A and B. Land Use Characteristics The land use surrounding the roadway includes government, commercial, low to medium density residential, and a small amount of natural features (Figure 7). Residential makes up the majority of the land use surrounding the corridor. Anne Arundel Community College is the largest employment center in the study corridor and is currently served by the Annapolis Gold Route, though the service for this line is provided on two hour headways. The density analysis reflects these characteristics as well, with several zones with less than 1 household per acre while several others have over 2 ½ households per acre.
Figure 5: College Parkway Cube Model TAZ Structure

Modal Investigation Report Final – April 2016
11
Table 6: College Parkway Transit Density Analysis
Table 7: College Parkway Mode Investigation
Existing Transit Annapolis Transit
MTA Transit along MD 2 and at the Anne Arundel Community College
Potential Improvements / Modes
Annapolis Transit Gold Route Extension
MTA Route 14 Extension/Adjustment; consider Paratransit
Sidewalks
Bicycle Lanes
Multi-use Paths
Intersection Improvements
Future Commuter Rail to Washington, D.C. (Long-term)
Potential Stations US 50 at MD 179, Anne Arundel Community College
Potential Terminals US 50 at MD 179, Anne Arundel Community College
Modal Connections MTA Bus Routes 230, 14; Paratransit service
TAZNumber of
Households (2005)
Number of employees
(2005)
Estimated Non-Residential Floor Space (2005 sq ft)
TAZ Size (2005 acres)
Household Density (2005)
Number of Additional
Households Needed for Bus Service
Number of Households
(2035)
Number of employees
(2035)
Estimated Non-Residential Floor Space
(2035)
Household Density (2035)
Number of Additional
Households Needed for Bus Service
312 635 172 34400 405 1.57 985 648 218 43600 1.60 972
374 666 1996 399200 852 0.78 2742 858 2045 409000 1.01 2550
376 1168 1123 224600 1286 0.91 3976 1619 1124 224800 1.26 3525
377 464 678 135600 350 1.33 936 549 670 134000 1.57 851
378 2299 532 106400 930 2.47 1421 2795 523 104600 3.01 925
379 1262 294 58800 1145 1.10 3318 1501 275 55000 1.31 3079
380 1842 641 128200 623 2.96 650 2298 616 123200 3.69 194
381 366 159 31800 553 0.66 1846 393 155 31000 0.71 1819
382 1597 1179 235800 771 2.07 1487 1783 1172 234400 2.31 1301
383 1534 913 182600 484 3.17 402 1669 890 178000 3.45 267
Transit Treshold Index
Local Bus
Intermediate Bus
Frequent Level Bus
Light Rail
Commuter Rail
Local Bus (MTA)
Modal Investigation Report Final – April 2016
12
Figure 6: College Parkway Corridor Transit
Modal Investigation Report Final – April 2016
13
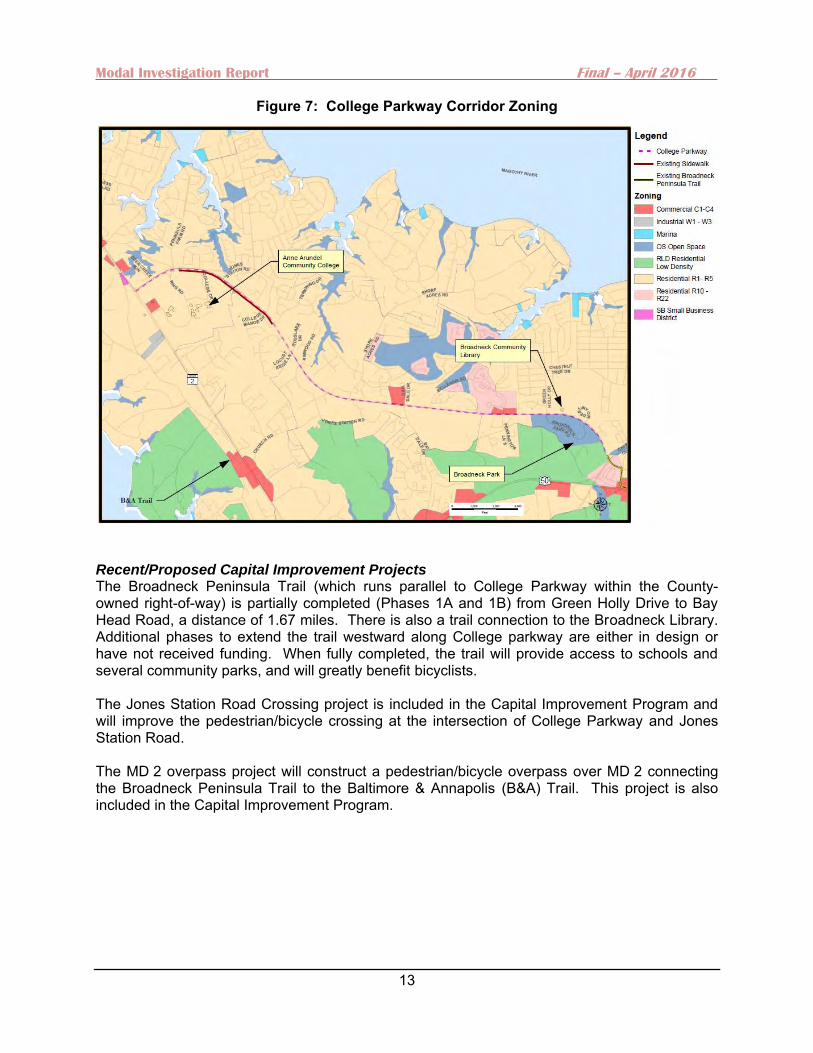
Figure 7: College Parkway Corridor Zoning
Recent/Proposed Capital Improvement Projects The Broadneck Peninsula Trail (which runs parallel to College Parkway within the County-owned right-of-way) is partially completed (Phases 1A and 1B) from Green Holly Drive to Bay Head Road, a distance of 1.67 miles. There is also a trail connection to the Broadneck Library. Additional phases to extend the trail westward along College parkway are either in design or have not received funding. When fully completed, the trail will provide access to schools and several community parks, and will greatly benefit bicyclists. The Jones Station Road Crossing project is included in the Capital Improvement Program and will improve the pedestrian/bicycle crossing at the intersection of College Parkway and Jones Station Road. The MD 2 overpass project will construct a pedestrian/bicycle overpass over MD 2 connecting the Broadneck Peninsula Trail to the Baltimore & Annapolis (B&A) Trail. This project is also included in the Capital Improvement Program.
Modal Investigation Report Final – April 2016
14
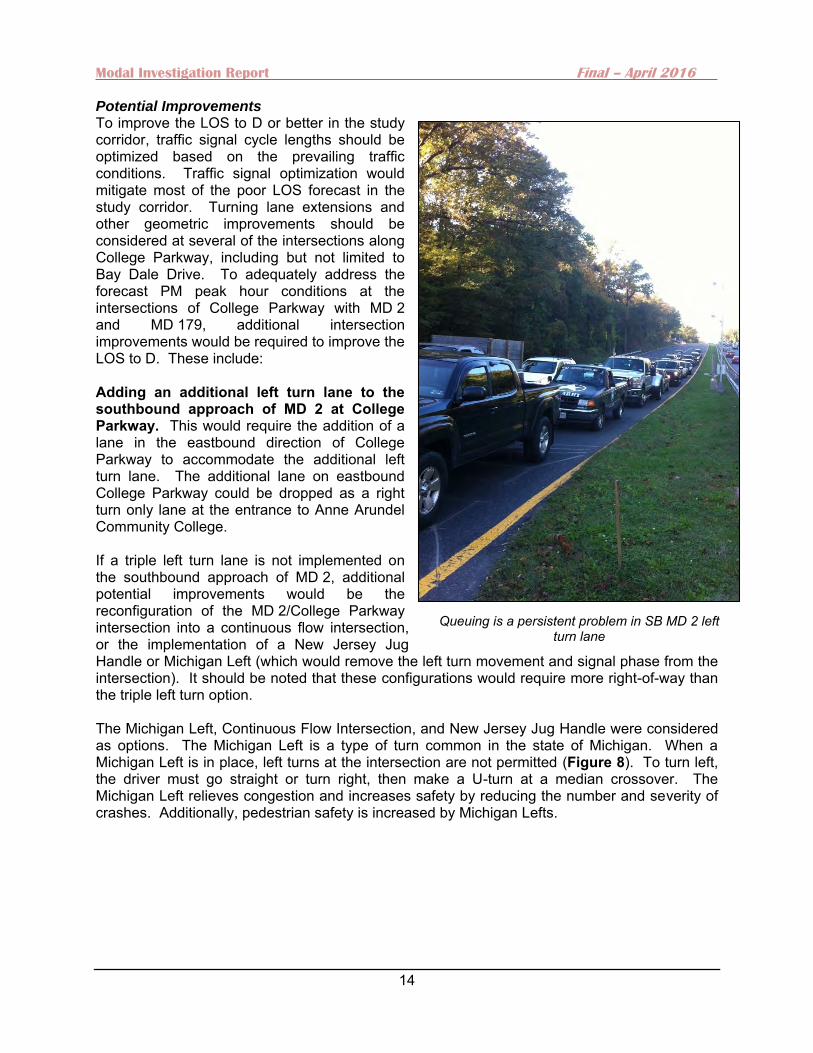
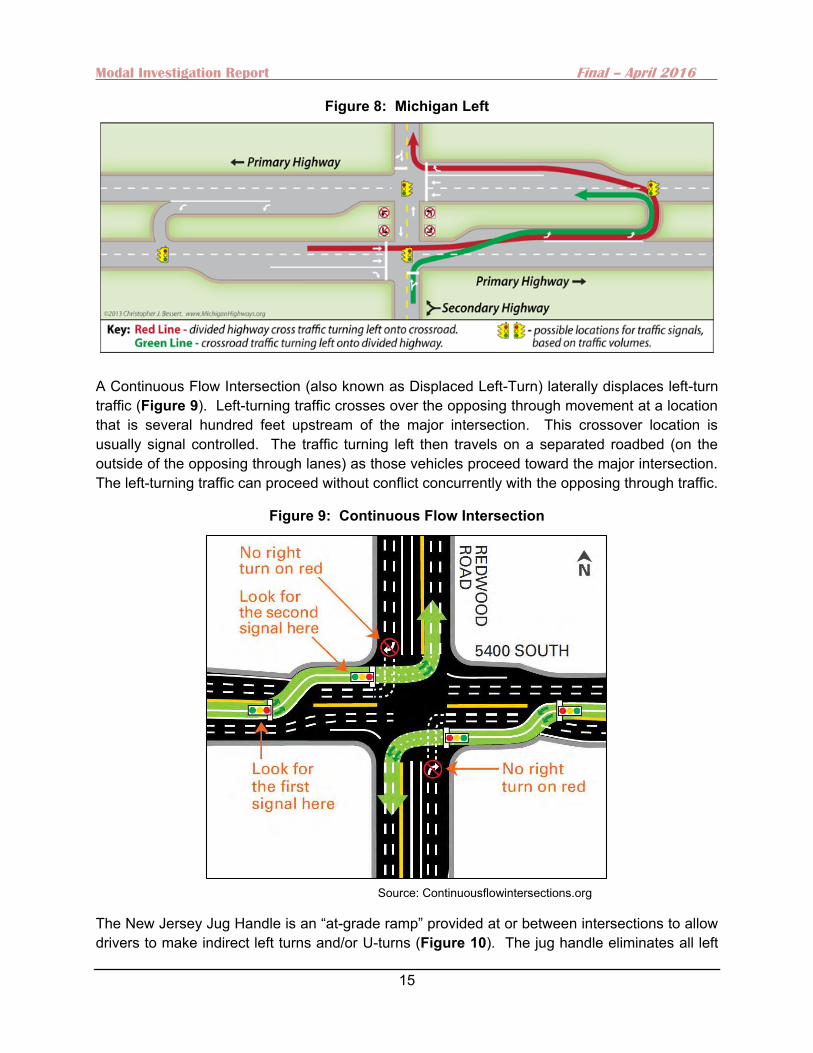
Potential Improvements To improve the LOS to D or better in the study corridor, traffic signal cycle lengths should be optimized based on the prevailing traffic conditions. Traffic signal optimization would mitigate most of the poor LOS forecast in the study corridor. Turning lane extensions and other geometric improvements should be considered at several of the intersections along College Parkway, including but not limited to Bay Dale Drive. To adequately address the forecast PM peak hour conditions at the intersections of College Parkway with MD 2 and MD 179, additional intersection improvements would be required to improve the LOS to D. These include: Adding an additional left turn lane to the southbound approach of MD 2 at College Parkway. This would require the addition of a lane in the eastbound direction of College Parkway to accommodate the additional left turn lane. The additional lane on eastbound College Parkway could be dropped as a right turn only lane at the entrance to Anne Arundel Community College. If a triple left turn lane is not implemented on the southbound approach of MD 2, additional potential improvements would be the reconfiguration of the MD 2/College Parkway intersection into a continuous flow intersection, or the implementation of a New Jersey Jug Handle or Michigan Left (which would remove the left turn movement and signal phase from the intersection). It should be noted that these configurations would require more right-of-way than the triple left turn option. The Michigan Left, Continuous Flow Intersection, and New Jersey Jug Handle were considered as options. The Michigan Left is a type of turn common in the state of Michigan. When a Michigan Left is in place, left turns at the intersection are not permitted (Figure 8). To turn left, the driver must go straight or turn right, then make a U-turn at a median crossover. The Michigan Left relieves congestion and increases safety by reducing the number and severity of crashes. Additionally, pedestrian safety is increased by Michigan Lefts.
Queuing is a persistent problem in SB MD 2 left turn lane
Modal Investigation Report Final – April 2016
15
Source: Continuousflowintersections.org
Figure 8: Michigan Left
A Continuous Flow Intersection (also known as Displaced Left-Turn) laterally displaces left-turn traffic (Figure 9). Left-turning traffic crosses over the opposing through movement at a location that is several hundred feet upstream of the major intersection. This crossover location is usually signal controlled. The traffic turning left then travels on a separated roadbed (on the outside of the opposing through lanes) as those vehicles proceed toward the major intersection. The left-turning traffic can proceed without conflict concurrently with the opposing through traffic.
Figure 9: Continuous Flow Intersection
The New Jersey Jug Handle is an “at-grade ramp” provided at or between intersections to allow drivers to make indirect left turns and/or U-turns (Figure 10). The jug handle eliminates all left

Modal Investigation Report Final – April 2016
16
turns from the major road at the intersection. This increases safety and reduces delays to the through traffic usually created by left-turning cars. The rerouted left turns from the main road cross the main road as through traffic from the minor road, and the intersection of the main and minor road is signalized.
Figure 10: New Jersey Jug Handle
The PM peak hour experiences the poorest LOS, and as such the Triple Left Turn, Continuous Flow Intersection, Michigan Left, and New Jersey Jug Handle options were evaluated for the PM peak hour. The results indicate that all of the alternatives would improve the intersection LOS to D or better. The Continuous Flow Intersection and Michigan Left options would improve the LOS to A and B, respectively.
Table 8: College Parkway at MD 2 Future 2035 Level of Service
Given the significant right-of-way impacts and potential operational issues associated with the Michigan Left (merging dual left turn lane into one right turn lane requires significant merging distances), Continuous Flow Intersection, and New Jersey Jug Handle (additional signal phase required), these options were eliminated from further evaluation in this study but could be considered in the future if volumes continue to increase in the corridor. As Table 8 illustrates, the Triple-Left Turn Lane option would also significantly improve the Level of Service with minimal right-of-way impact, and is therefore the recommended improvement at this time.
Alternative Delay Level of Service v/c
2035 No Build 110.7 F 1.30
2035 Signal Optimized 73.4 E 1.15
2035 Triple Left 40.6 D 1.02
2035 Continuous Flow Intersection 8.9 A 0.84
2035 Michigan U-Turn 11.4 B 0.82
2035 New Jersey Jughandle 37.9 D 0.96
Modal Investigation Report Final – April 2016
17
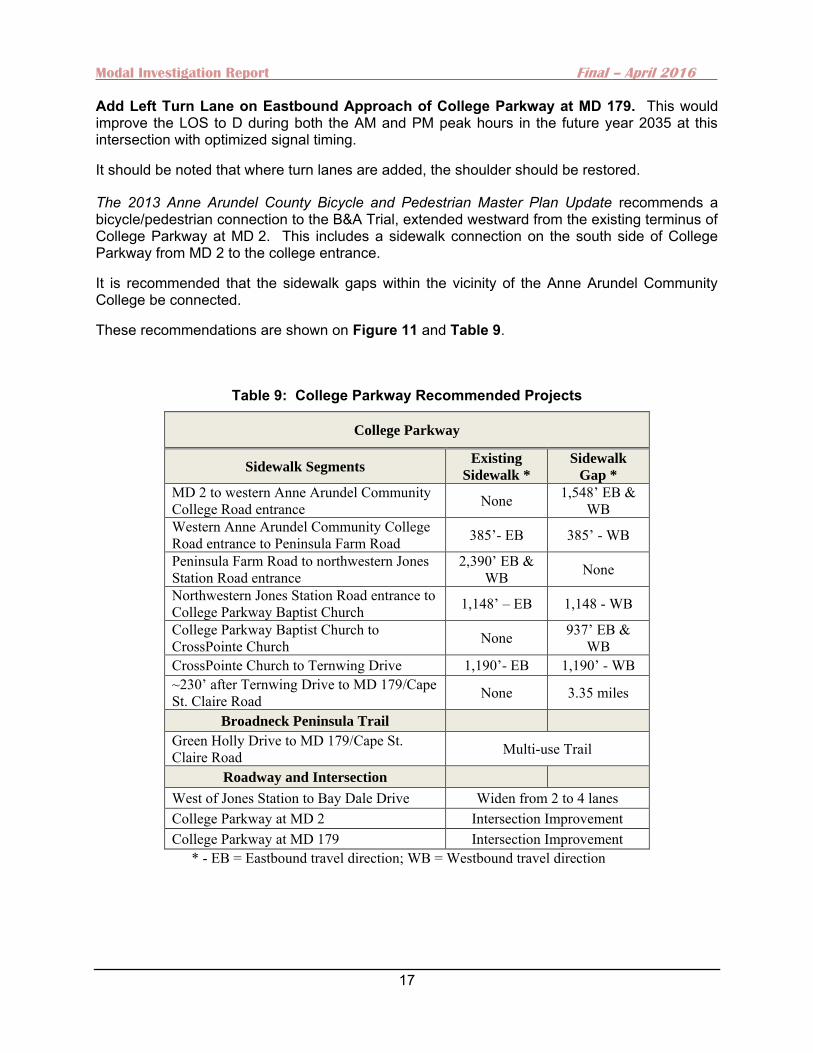
Add Left Turn Lane on Eastbound Approach of College Parkway at MD 179. This would improve the LOS to D during both the AM and PM peak hours in the future year 2035 at this intersection with optimized signal timing.
It should be noted that where turn lanes are added, the shoulder should be restored.
The 2013 Anne Arundel County Bicycle and Pedestrian Master Plan Update recommends a bicycle/pedestrian connection to the B&A Trial, extended westward from the existing terminus of College Parkway at MD 2. This includes a sidewalk connection on the south side of College Parkway from MD 2 to the college entrance.
It is recommended that the sidewalk gaps within the vicinity of the Anne Arundel Community College be connected.
These recommendations are shown on Figure 11 and Table 9.
Table 9: College Parkway Recommended Projects
College Parkway
Sidewalk Segments Existing
Sidewalk *
Sidewalk
Gap *
MD 2 to western Anne Arundel Community College Road entrance None 1,548’ EB &
WB Western Anne Arundel Community College Road entrance to Peninsula Farm Road 385’- EB 385’ - WB
Peninsula Farm Road to northwestern Jones Station Road entrance
2,390’ EB & WB None
Northwestern Jones Station Road entrance to College Parkway Baptist Church 1,148’ – EB 1,148 - WB
College Parkway Baptist Church to CrossPointe Church None 937’ EB &
WB CrossPointe Church to Ternwing Drive 1,190’- EB 1,190’ - WB ~230’ after Ternwing Drive to MD 179/Cape St. Claire Road None 3.35 miles
Broadneck Peninsula Trail
Green Holly Drive to MD 179/Cape St. Claire Road Multi-use Trail
Roadway and Intersection
West of Jones Station to Bay Dale Drive Widen from 2 to 4 lanes College Parkway at MD 2 Intersection Improvement College Parkway at MD 179 Intersection Improvement
* - EB = Eastbound travel direction; WB = Westbound travel direction
Modal Investigation Report Final – April 2016
18
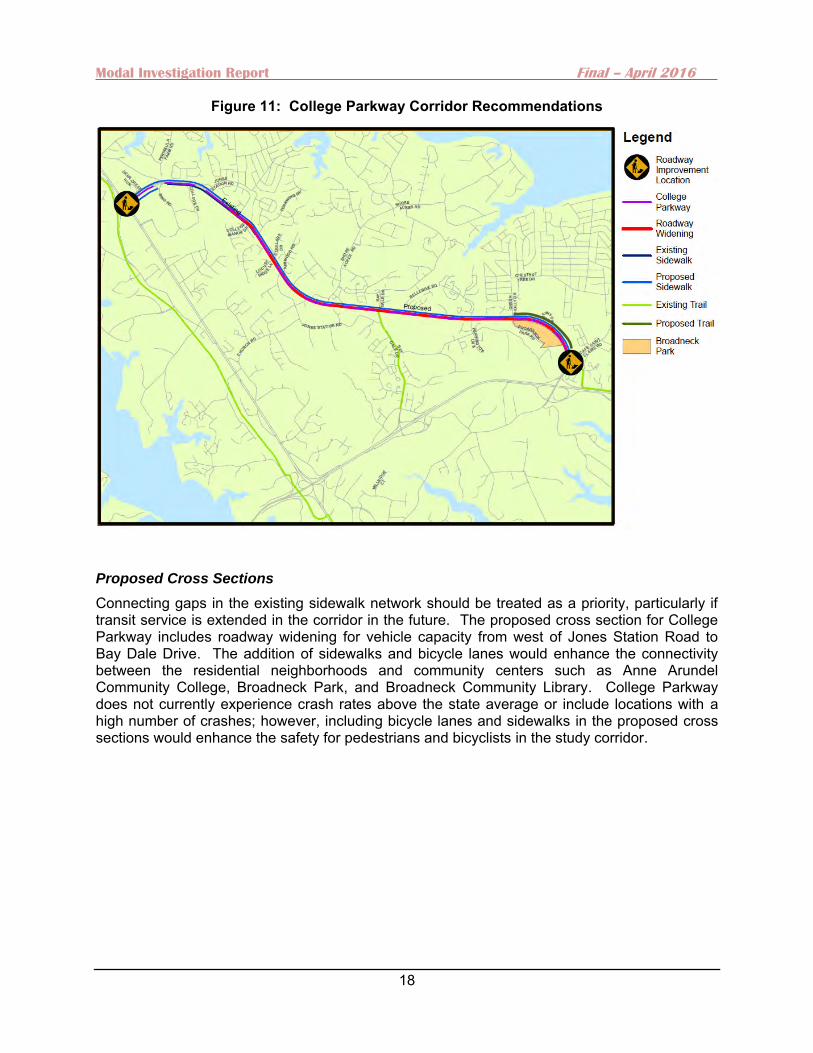
Figure 11: College Parkway Corridor Recommendations
Proposed Cross Sections
Connecting gaps in the existing sidewalk network should be treated as a priority, particularly if transit service is extended in the corridor in the future. The proposed cross section for College Parkway includes roadway widening for vehicle capacity from west of Jones Station Road to Bay Dale Drive. The addition of sidewalks and bicycle lanes would enhance the connectivity between the residential neighborhoods and community centers such as Anne Arundel Community College, Broadneck Park, and Broadneck Community Library. College Parkway does not currently experience crash rates above the state average or include locations with a high number of crashes; however, including bicycle lanes and sidewalks in the proposed cross sections would enhance the safety for pedestrians and bicyclists in the study corridor.
Modal Investigation Report Final – April 2016
19
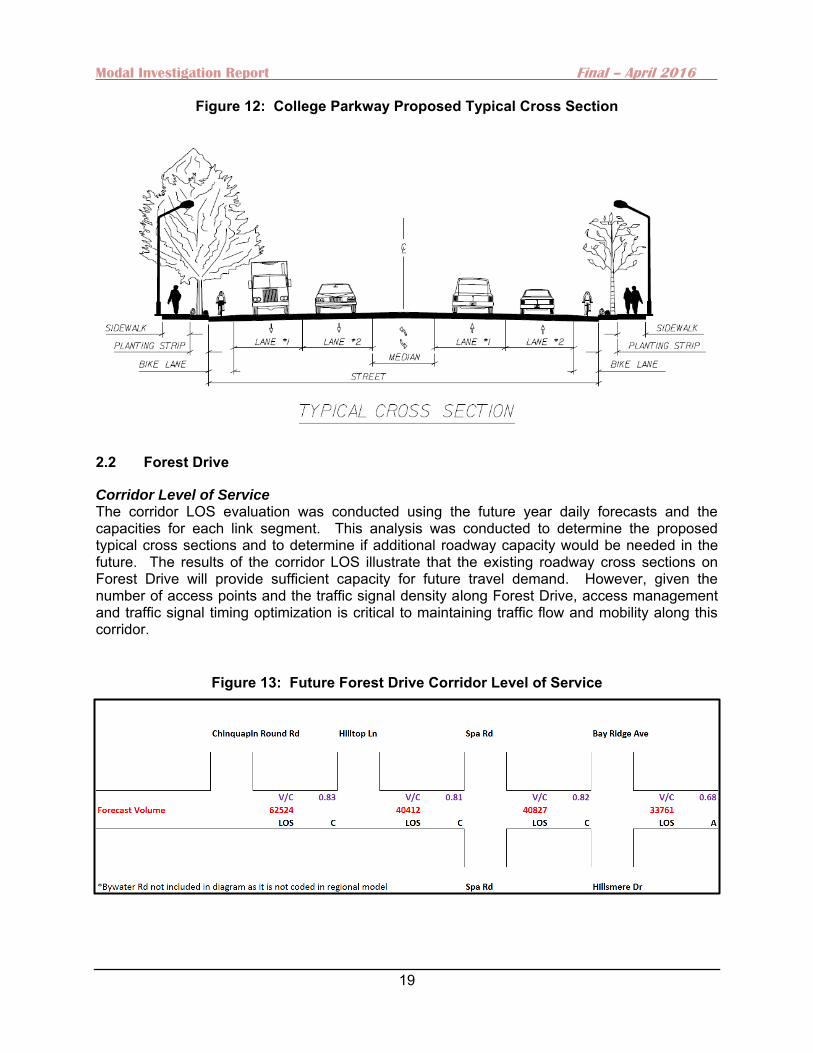
Figure 12: College Parkway Proposed Typical Cross Section
2.2 Forest Drive
Corridor Level of Service The corridor LOS evaluation was conducted using the future year daily forecasts and the capacities for each link segment. This analysis was conducted to determine the proposed typical cross sections and to determine if additional roadway capacity would be needed in the future. The results of the corridor LOS illustrate that the existing roadway cross sections on Forest Drive will provide sufficient capacity for future travel demand. However, given the number of access points and the traffic signal density along Forest Drive, access management and traffic signal timing optimization is critical to maintaining traffic flow and mobility along this corridor.
Figure 13: Future Forest Drive Corridor Level of Service
Modal Investigation Report Final – April 2016
20
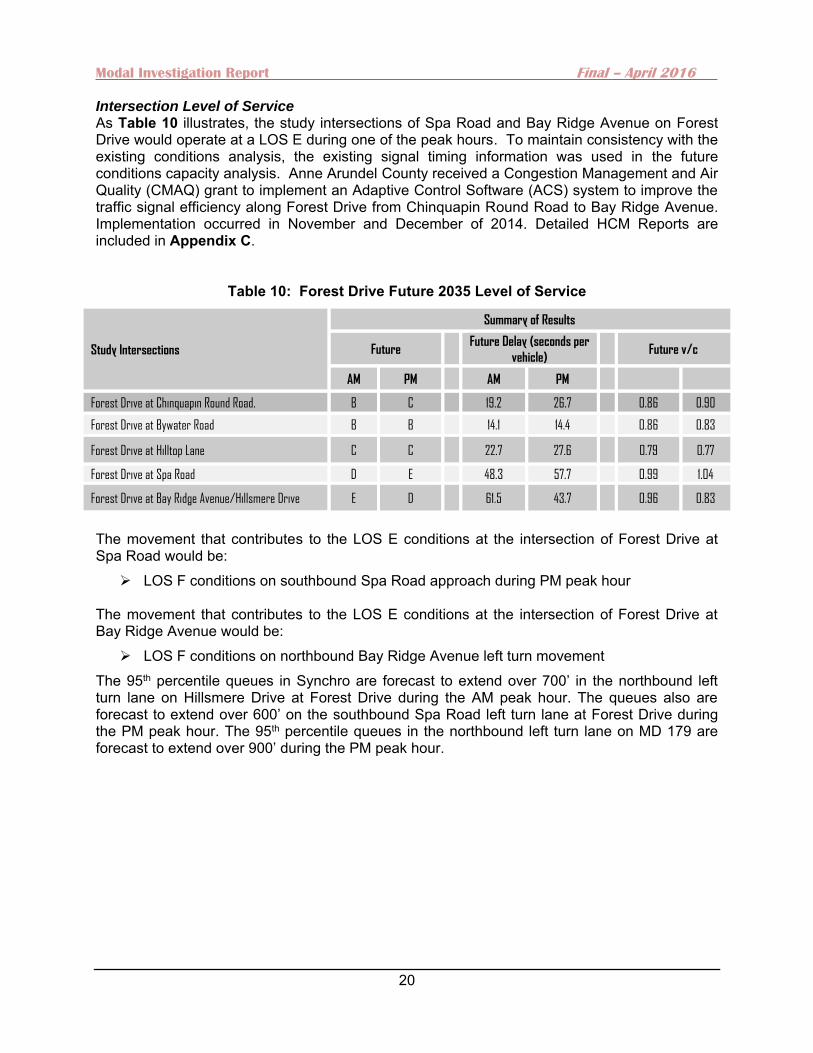
Intersection Level of Service As Table 10 illustrates, the study intersections of Spa Road and Bay Ridge Avenue on Forest Drive would operate at a LOS E during one of the peak hours. To maintain consistency with the existing conditions analysis, the existing signal timing information was used in the future conditions capacity analysis. Anne Arundel County received a Congestion Management and Air Quality (CMAQ) grant to implement an Adaptive Control Software (ACS) system to improve the traffic signal efficiency along Forest Drive from Chinquapin Round Road to Bay Ridge Avenue. Implementation occurred in November and December of 2014. Detailed HCM Reports are included in Appendix C.
Table 10: Forest Drive Future 2035 Level of Service
Study Intersections
Summary of Results
Future Future Delay (seconds per
vehicle)
Future v/c
AM PM AM PM
Forest Drive at Chinquapin Round Road. B C 19.2 26.7 0.86 0.90
Forest Drive at Bywater Road B B 14.1 14.4 0.86 0.83
Forest Drive at Hilltop Lane C C 22.7 27.6 0.79 0.77
Forest Drive at Spa Road D E 48.3 57.7 0.99 1.04
Forest Drive at Bay Ridge Avenue/Hillsmere Drive E D 61.5 43.7 0.96 0.83
The movement that contributes to the LOS E conditions at the intersection of Forest Drive at Spa Road would be:
LOS F conditions on southbound Spa Road approach during PM peak hour The movement that contributes to the LOS E conditions at the intersection of Forest Drive at Bay Ridge Avenue would be:
LOS F conditions on northbound Bay Ridge Avenue left turn movement The 95th percentile queues in Synchro are forecast to extend over 700’ in the northbound left turn lane on Hillsmere Drive at Forest Drive during the AM peak hour. The queues also are forecast to extend over 600’ on the southbound Spa Road left turn lane at Forest Drive during the PM peak hour. The 95th percentile queues in the northbound left turn lane on MD 179 are forecast to extend over 900’ during the PM peak hour.
Modal Investigation Report Final – April 2016
21
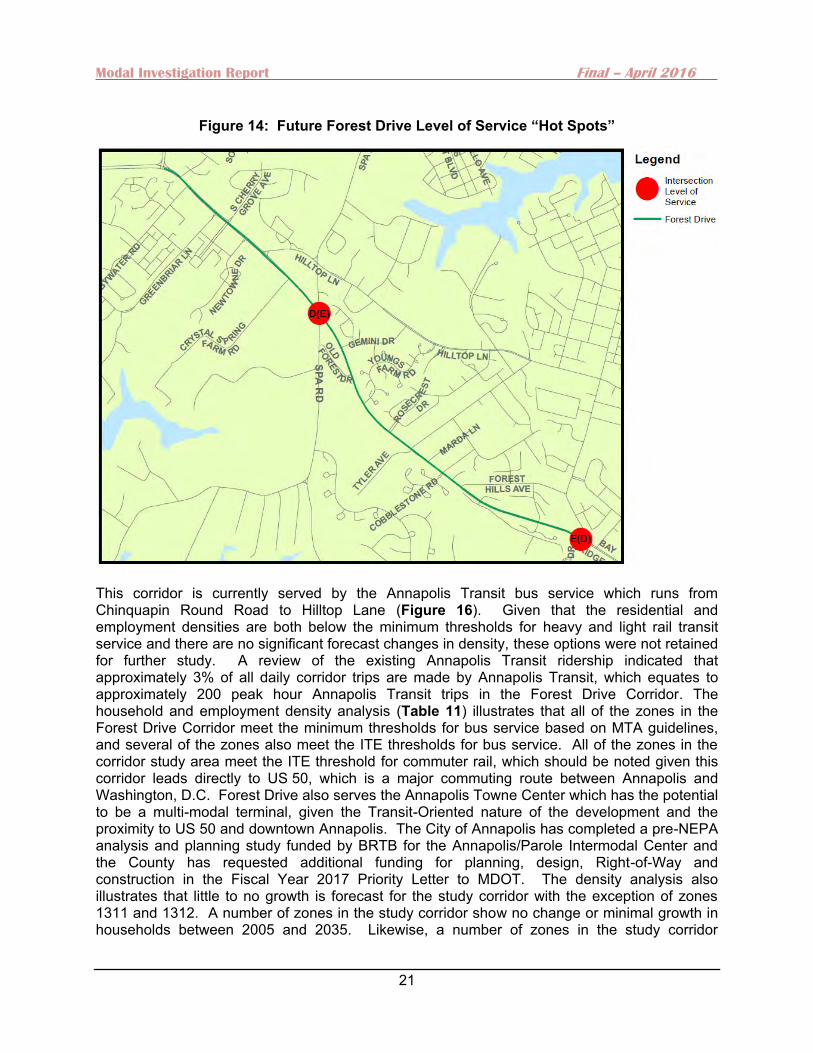
Figure 14: Future Forest Drive Level of Service “Hot Spots”
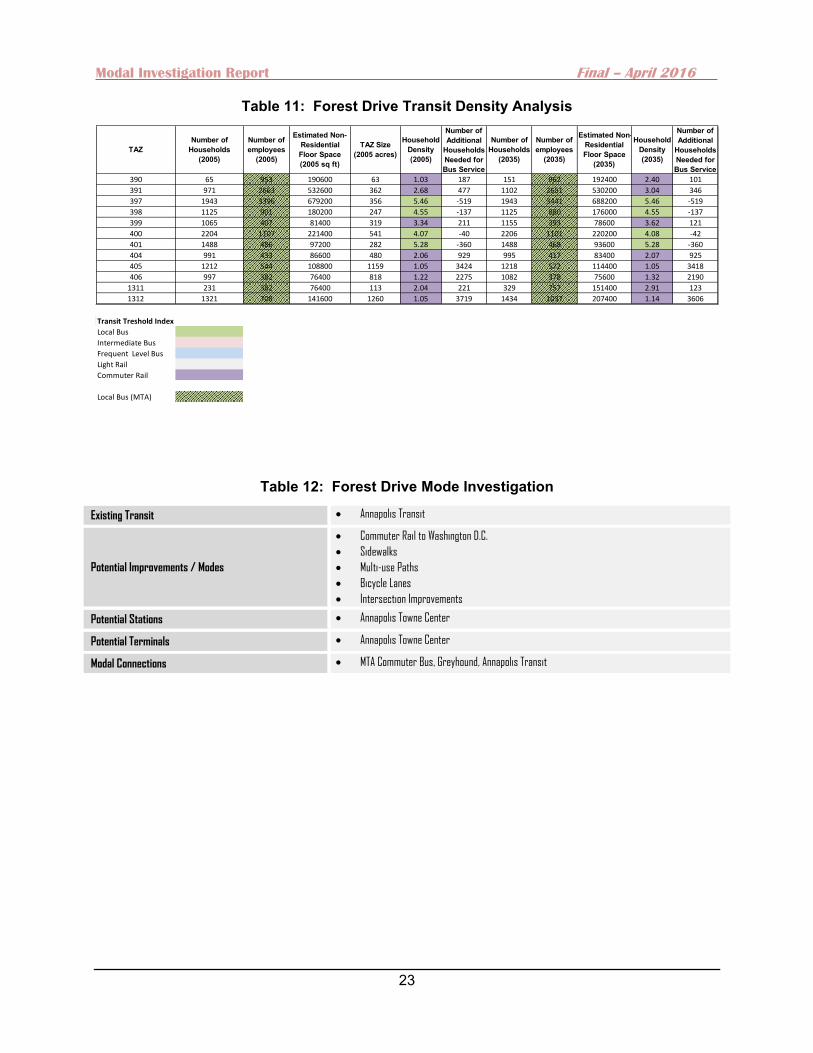
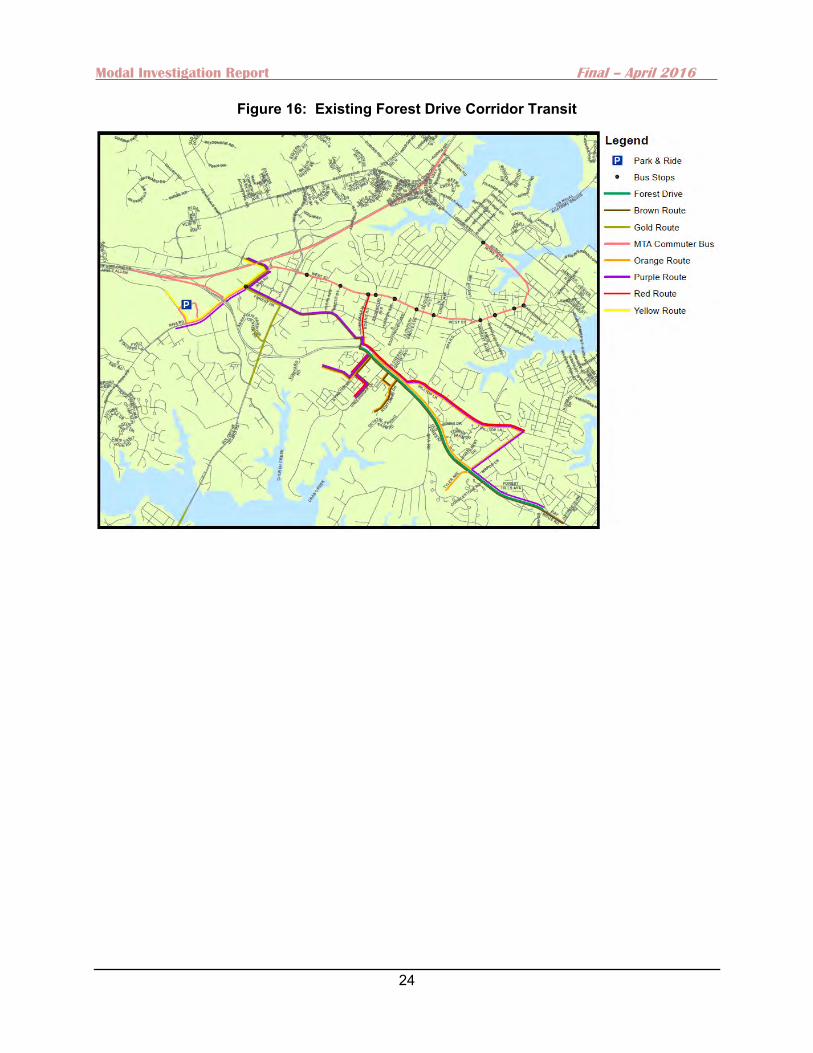
This corridor is currently served by the Annapolis Transit bus service which runs from Chinquapin Round Road to Hilltop Lane (Figure 16). Given that the residential and employment densities are both below the minimum thresholds for heavy and light rail transit service and there are no significant forecast changes in density, these options were not retained for further study. A review of the existing Annapolis Transit ridership indicated that approximately 3% of all daily corridor trips are made by Annapolis Transit, which equates to approximately 200 peak hour Annapolis Transit trips in the Forest Drive Corridor. The household and employment density analysis (Table 11) illustrates that all of the zones in the Forest Drive Corridor meet the minimum thresholds for bus service based on MTA guidelines, and several of the zones also meet the ITE thresholds for bus service. All of the zones in the corridor study area meet the ITE threshold for commuter rail, which should be noted given this corridor leads directly to US 50, which is a major commuting route between Annapolis and Washington, D.C. Forest Drive also serves the Annapolis Towne Center which has the potential to be a multi-modal terminal, given the Transit-Oriented nature of the development and the proximity to US 50 and downtown Annapolis. The City of Annapolis has completed a pre-NEPA analysis and planning study funded by BRTB for the Annapolis/Parole Intermodal Center and the County has requested additional funding for planning, design, Right-of-Way and construction in the Fiscal Year 2017 Priority Letter to MDOT. The density analysis also illustrates that little to no growth is forecast for the study corridor with the exception of zones 1311 and 1312. A number of zones in the study corridor show no change or minimal growth in households between 2005 and 2035. Likewise, a number of zones in the study corridor
Modal Investigation Report Final – April 2016
22
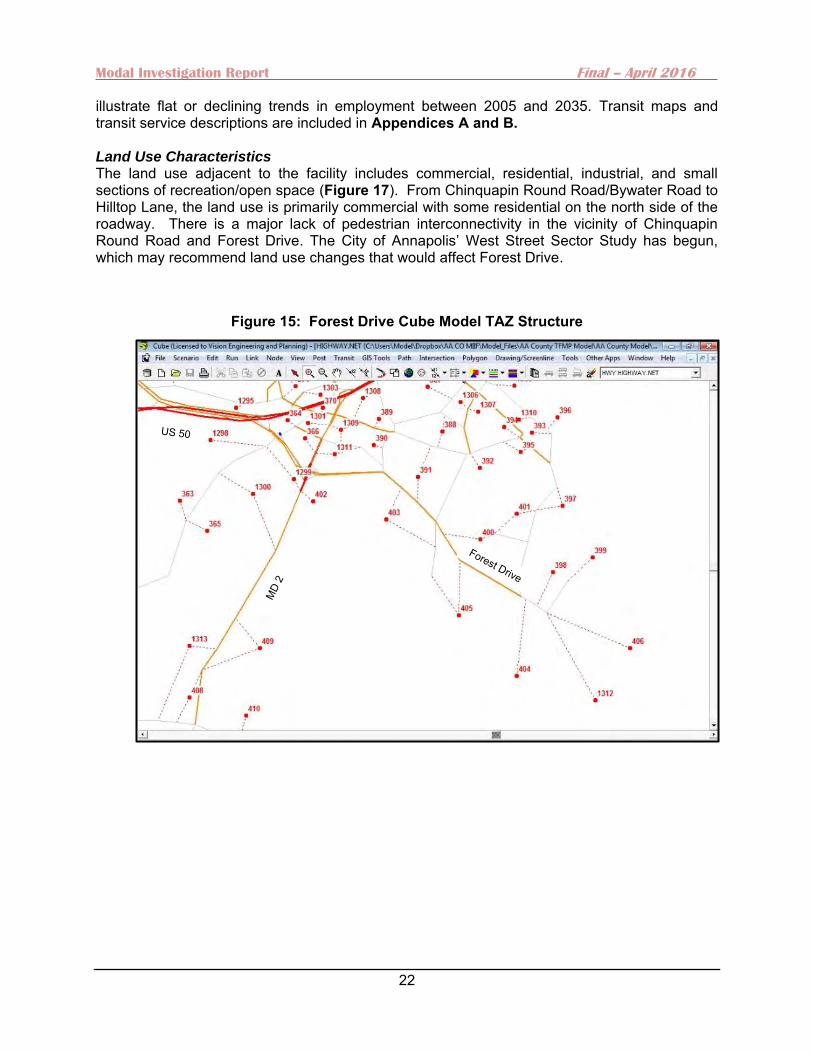
illustrate flat or declining trends in employment between 2005 and 2035. Transit maps and transit service descriptions are included in Appendices A and B. Land Use Characteristics The land use adjacent to the facility includes commercial, residential, industrial, and small sections of recreation/open space (Figure 17). From Chinquapin Round Road/Bywater Road to Hilltop Lane, the land use is primarily commercial with some residential on the north side of the roadway. There is a major lack of pedestrian interconnectivity in the vicinity of Chinquapin Round Road and Forest Drive. The City of Annapolis’ West Street Sector Study has begun, which may recommend land use changes that would affect Forest Drive.
Figure 15: Forest Drive Cube Model TAZ Structure
Modal Investigation Report Final – April 2016
23
Table 11: Forest Drive Transit Density Analysis
Table 12: Forest Drive Mode Investigation
Existing Transit Annapolis Transit
Potential Improvements / Modes
Commuter Rail to Washington D.C.
Sidewalks
Multi-use Paths
Bicycle Lanes
Intersection Improvements
Potential Stations Annapolis Towne Center
Potential Terminals Annapolis Towne Center
Modal Connections MTA Commuter Bus, Greyhound, Annapolis Transit
TAZNumber of
Households (2005)
Number of employees
(2005)
Estimated Non-Residential Floor Space (2005 sq ft)
TAZ Size (2005 acres)
Household Density (2005)
Number of Additional
Households Needed for Bus Service
Number of Households
(2035)
Number of employees
(2035)
Estimated Non-Residential Floor Space
(2035)
Household Density (2035)
Number of Additional
Households Needed for Bus Service
390 65 953 190600 63 1.03 187 151 962 192400 2.40 101
391 971 2663 532600 362 2.68 477 1102 2651 530200 3.04 346
397 1943 3396 679200 356 5.46 -519 1943 3441 688200 5.46 -519
398 1125 901 180200 247 4.55 -137 1125 880 176000 4.55 -137
399 1065 407 81400 319 3.34 211 1155 393 78600 3.62 121
400 2204 1107 221400 541 4.07 -40 2206 1101 220200 4.08 -42
401 1488 486 97200 282 5.28 -360 1488 468 93600 5.28 -360
404 991 433 86600 480 2.06 929 995 417 83400 2.07 925
405 1212 544 108800 1159 1.05 3424 1218 572 114400 1.05 3418
406 997 382 76400 818 1.22 2275 1082 378 75600 1.32 2190
1311 231 382 76400 113 2.04 221 329 757 151400 2.91 123
1312 1321 708 141600 1260 1.05 3719 1434 1037 207400 1.14 3606
Transit Treshold Index
Local Bus
Intermediate Bus
Frequent Level Bus
Light Rail
Commuter Rail
Local Bus (MTA)
Modal Investigation Report Final – April 2016
24
Figure 16: Existing Forest Drive Corridor Transit
Modal Investigation Report Final – April 2016
25
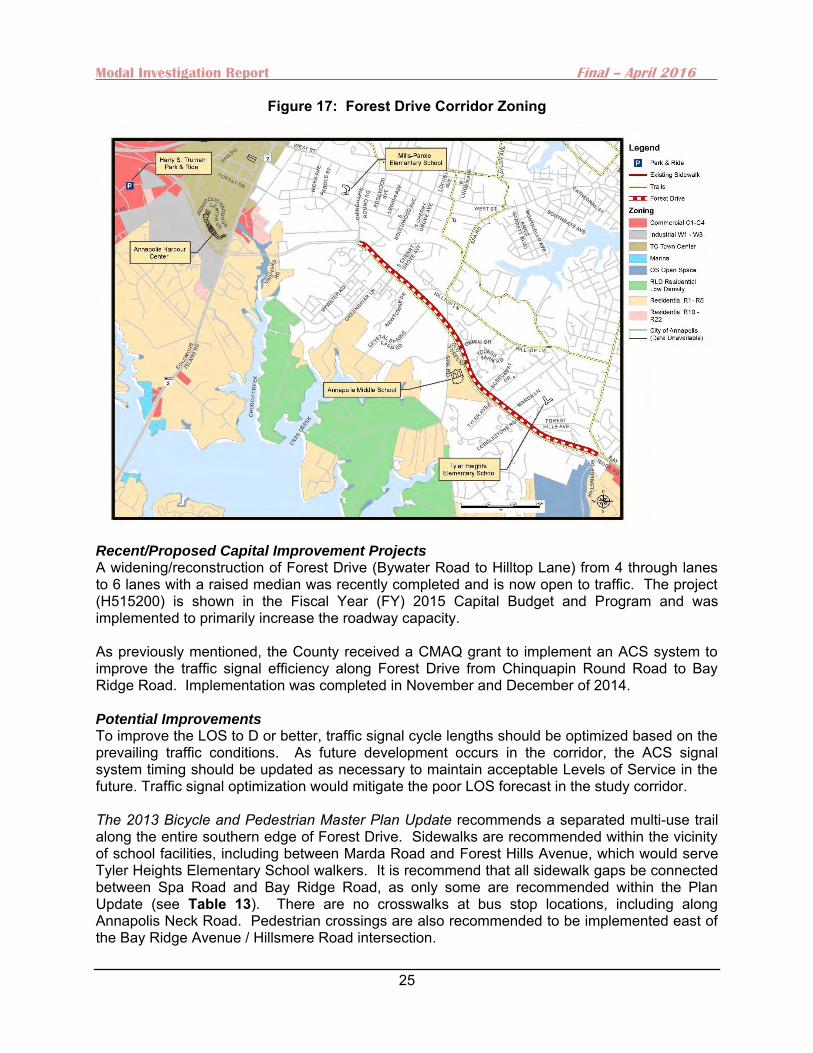
Figure 17: Forest Drive Corridor Zoning
Recent/Proposed Capital Improvement Projects A widening/reconstruction of Forest Drive (Bywater Road to Hilltop Lane) from 4 through lanes to 6 lanes with a raised median was recently completed and is now open to traffic. The project (H515200) is shown in the Fiscal Year (FY) 2015 Capital Budget and Program and was implemented to primarily increase the roadway capacity. As previously mentioned, the County received a CMAQ grant to implement an ACS system to improve the traffic signal efficiency along Forest Drive from Chinquapin Round Road to Bay Ridge Road. Implementation was completed in November and December of 2014. Potential Improvements To improve the LOS to D or better, traffic signal cycle lengths should be optimized based on the prevailing traffic conditions. As future development occurs in the corridor, the ACS signal system timing should be updated as necessary to maintain acceptable Levels of Service in the future. Traffic signal optimization would mitigate the poor LOS forecast in the study corridor. The 2013 Bicycle and Pedestrian Master Plan Update recommends a separated multi-use trail along the entire southern edge of Forest Drive. Sidewalks are recommended within the vicinity of school facilities, including between Marda Road and Forest Hills Avenue, which would serve Tyler Heights Elementary School walkers. It is recommend that all sidewalk gaps be connected between Spa Road and Bay Ridge Road, as only some are recommended within the Plan Update (see Table 13). There are no crosswalks at bus stop locations, including along Annapolis Neck Road. Pedestrian crossings are also recommended to be implemented east of the Bay Ridge Avenue / Hillsmere Road intersection.

Modal Investigation Report Final – April 2016
26
Table 13: Forest Drive Recommended Projects
Forest Drive
Sidewalk Segments Existing
Sidewalk*
Sidewalk
Gap*
Bywater Road to 250’ east of Castlegate Drive 4,690’ - EB & WB None 250’ east of Castlegate Drive to Old Forest Drive 894’ - WB 894’ - EB
Old Forest Drive to Forest Hills Avenue 3,520’ – EB & WB None Forest Hills Avenue to Martha Court 534’ - EB 534’ – WB Martha Court to Hillsmere Drive 2,386’ – EB & WB None
* - EB = Eastbound travel direction; WB = Westbound travel direction
Figure 18: Forest Drive Corridor Recommendations
Modal Investigation Report Final – April 2016
27
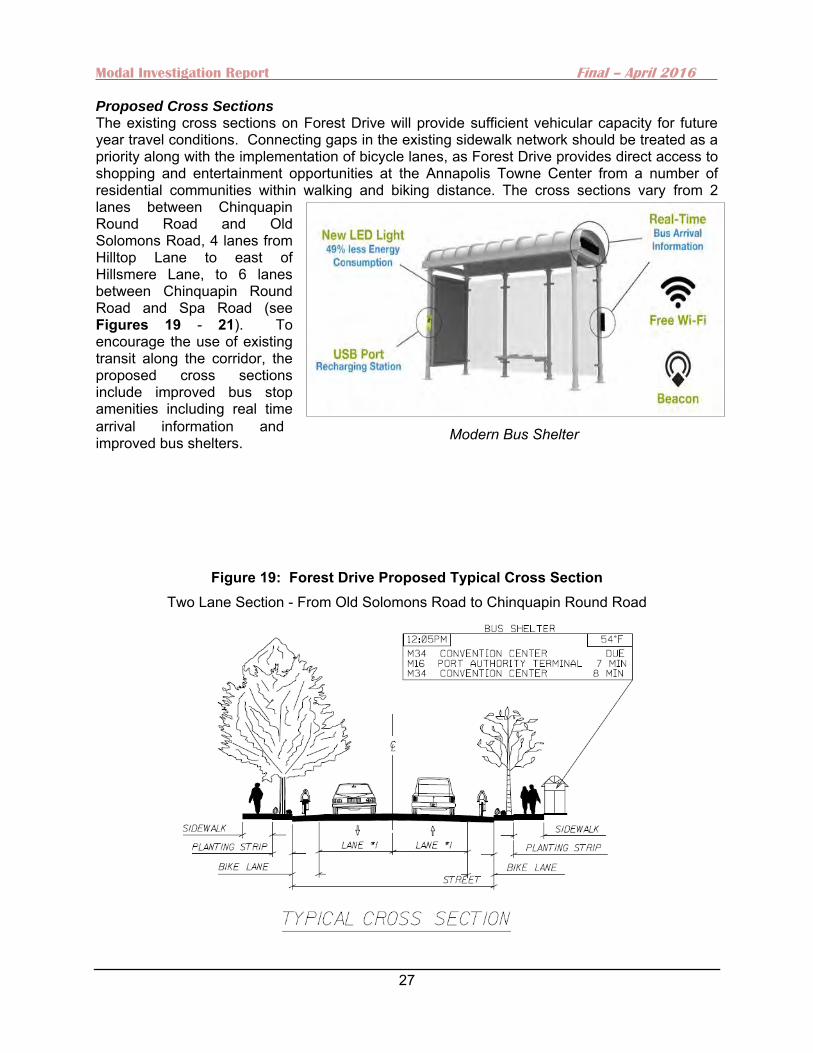
Proposed Cross Sections The existing cross sections on Forest Drive will provide sufficient vehicular capacity for future year travel conditions. Connecting gaps in the existing sidewalk network should be treated as a priority along with the implementation of bicycle lanes, as Forest Drive provides direct access to shopping and entertainment opportunities at the Annapolis Towne Center from a number of residential communities within walking and biking distance. The cross sections vary from 2 lanes between Chinquapin Round Road and Old Solomons Road, 4 lanes from Hilltop Lane to east of Hillsmere Lane, to 6 lanes between Chinquapin Round Road and Spa Road (see Figures 19 - 21). To encourage the use of existing transit along the corridor, the proposed cross sections include improved bus stop amenities including real time arrival information and improved bus shelters.
Figure 19: Forest Drive Proposed Typical Cross Section Two Lane Section - From Old Solomons Road to Chinquapin Round Road
Modern Bus Shelter
Modal Investigation Report Final – April 2016
28
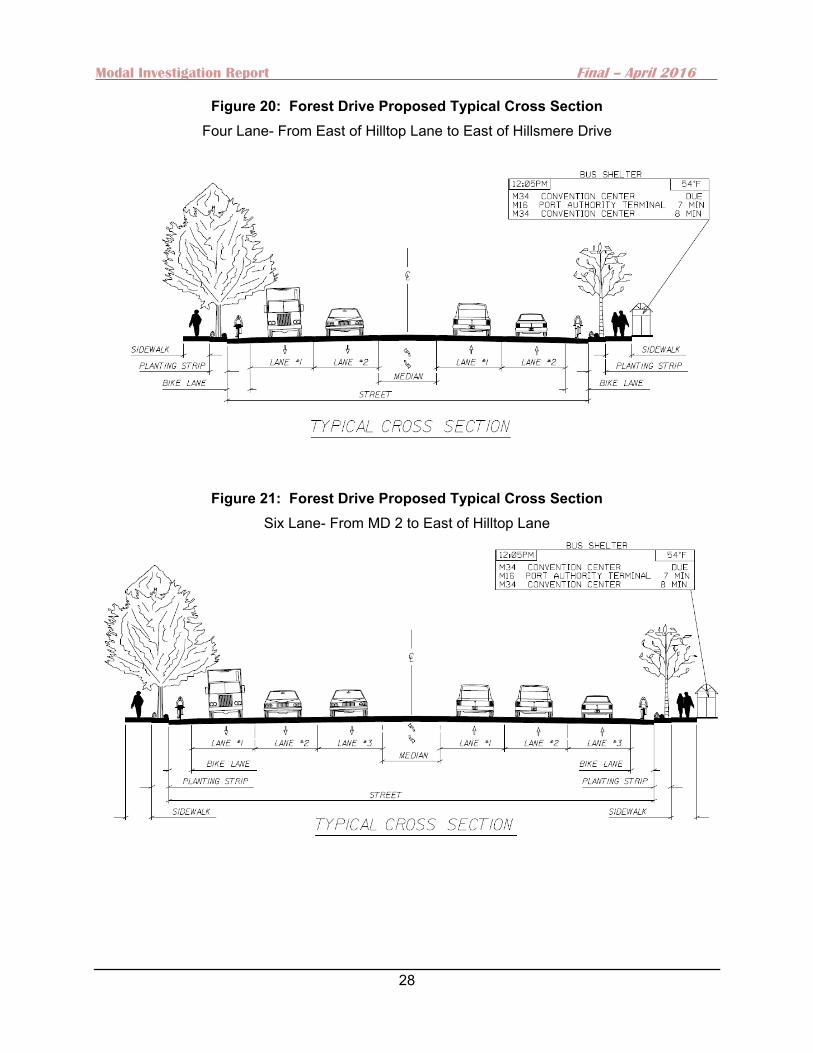
Figure 20: Forest Drive Proposed Typical Cross Section Four Lane- From East of Hilltop Lane to East of Hillsmere Drive
Figure 21: Forest Drive Proposed Typical Cross Section
Six Lane- From MD 2 to East of Hilltop Lane
Modal Investigation Report Final – April 2016
29
Example of Lane Signage and Striping
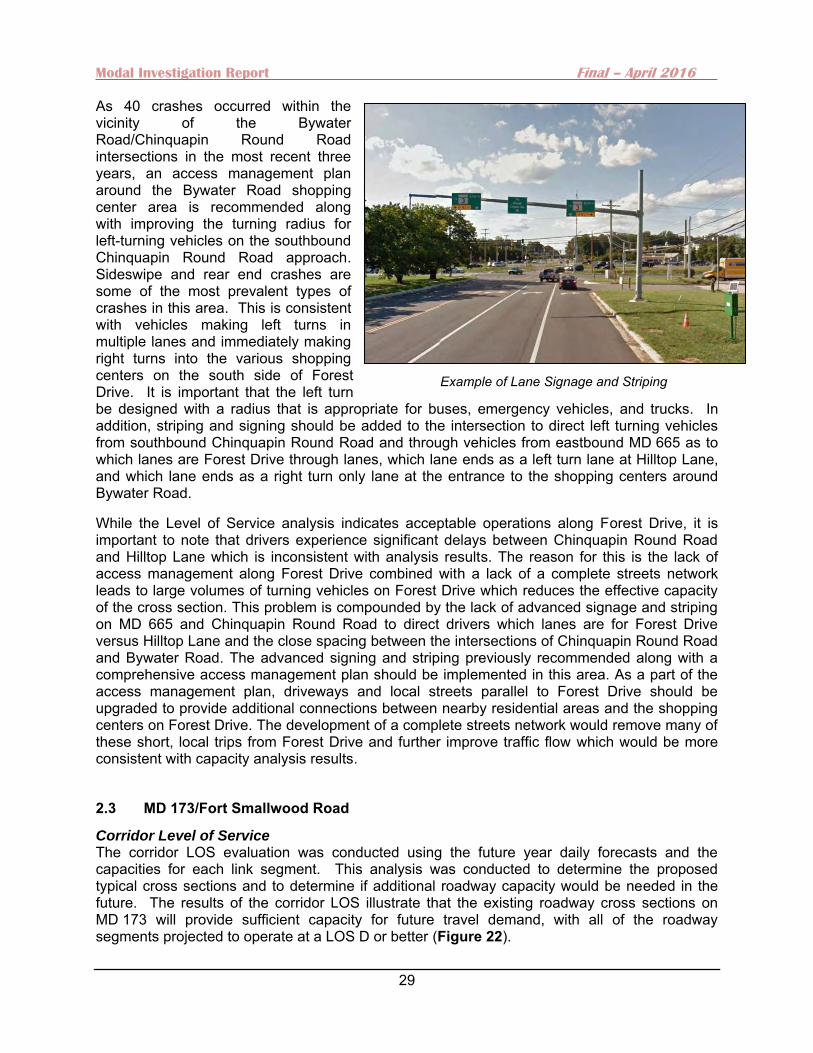
As 40 crashes occurred within the vicinity of the Bywater Road/Chinquapin Round Road intersections in the most recent three years, an access management plan around the Bywater Road shopping center area is recommended along with improving the turning radius for left-turning vehicles on the southbound Chinquapin Round Road approach. Sideswipe and rear end crashes are some of the most prevalent types of crashes in this area. This is consistent with vehicles making left turns in multiple lanes and immediately making right turns into the various shopping centers on the south side of Forest Drive. It is important that the left turn be designed with a radius that is appropriate for buses, emergency vehicles, and trucks. In addition, striping and signing should be added to the intersection to direct left turning vehicles from southbound Chinquapin Round Road and through vehicles from eastbound MD 665 as to which lanes are Forest Drive through lanes, which lane ends as a left turn lane at Hilltop Lane, and which lane ends as a right turn only lane at the entrance to the shopping centers around Bywater Road.
While the Level of Service analysis indicates acceptable operations along Forest Drive, it is important to note that drivers experience significant delays between Chinquapin Round Road and Hilltop Lane which is inconsistent with analysis results. The reason for this is the lack of access management along Forest Drive combined with a lack of a complete streets network leads to large volumes of turning vehicles on Forest Drive which reduces the effective capacity of the cross section. This problem is compounded by the lack of advanced signage and striping on MD 665 and Chinquapin Round Road to direct drivers which lanes are for Forest Drive versus Hilltop Lane and the close spacing between the intersections of Chinquapin Round Road and Bywater Road. The advanced signing and striping previously recommended along with a comprehensive access management plan should be implemented in this area. As a part of the access management plan, driveways and local streets parallel to Forest Drive should be upgraded to provide additional connections between nearby residential areas and the shopping centers on Forest Drive. The development of a complete streets network would remove many of these short, local trips from Forest Drive and further improve traffic flow which would be more consistent with capacity analysis results.
2.3 MD 173/Fort Smallwood Road
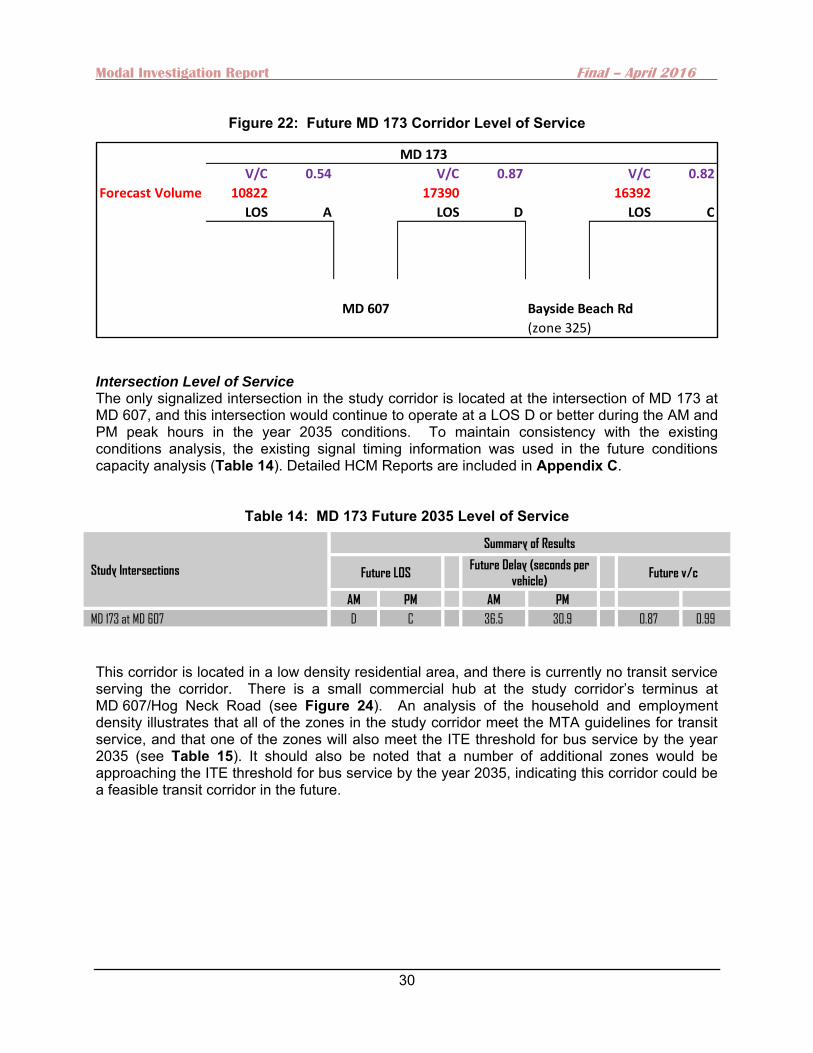
Corridor Level of Service The corridor LOS evaluation was conducted using the future year daily forecasts and the capacities for each link segment. This analysis was conducted to determine the proposed typical cross sections and to determine if additional roadway capacity would be needed in the future. The results of the corridor LOS illustrate that the existing roadway cross sections on MD 173 will provide sufficient capacity for future travel demand, with all of the roadway segments projected to operate at a LOS D or better (Figure 22).
Modal Investigation Report Final – April 2016
30
Figure 22: Future MD 173 Corridor Level of Service
Intersection Level of Service The only signalized intersection in the study corridor is located at the intersection of MD 173 at MD 607, and this intersection would continue to operate at a LOS D or better during the AM and PM peak hours in the year 2035 conditions. To maintain consistency with the existing conditions analysis, the existing signal timing information was used in the future conditions capacity analysis (Table 14). Detailed HCM Reports are included in Appendix C.
Table 14: MD 173 Future 2035 Level of Service
Study Intersections
Summary of Results
Future LOS Future Delay (seconds per
vehicle)
Future v/c
AM PM AM PM
MD 173 at MD 607 D C 36.5 30.9 0.87 0.99
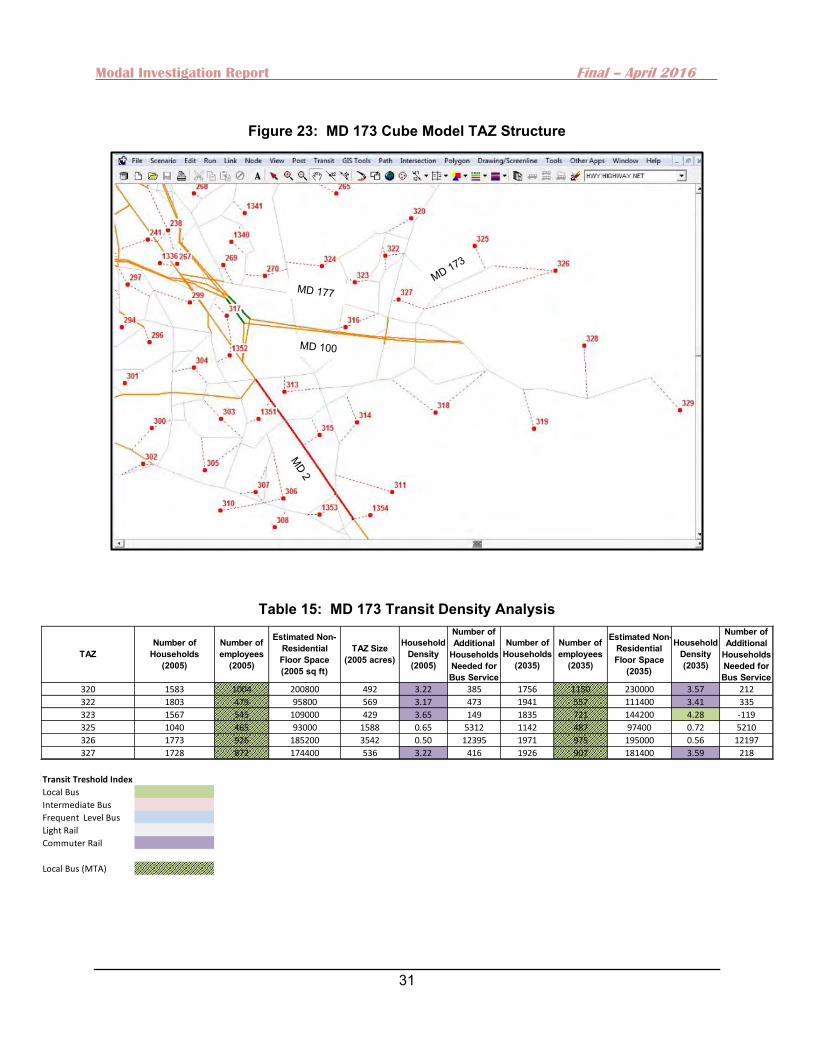
This corridor is located in a low density residential area, and there is currently no transit service serving the corridor. There is a small commercial hub at the study corridor’s terminus at MD 607/Hog Neck Road (see Figure 24). An analysis of the household and employment density illustrates that all of the zones in the study corridor meet the MTA guidelines for transit service, and that one of the zones will also meet the ITE threshold for bus service by the year 2035 (see Table 15). It should also be noted that a number of additional zones would be approaching the ITE threshold for bus service by the year 2035, indicating this corridor could be a feasible transit corridor in the future.
MD 173
V/C 0.54 V/C 0.87 V/C 0.82
Forecast Volume 10822 17390 16392
LOS A LOS D LOS C
MD 607 Bayside Beach Rd
(zone 325)
Modal Investigation Report Final – April 2016
31
Figure 23: MD 173 Cube Model TAZ Structure
Table 15: MD 173 Transit Density Analysis
TAZNumber of
Households (2005)
Number of employees
(2005)
Estimated Non-Residential Floor Space (2005 sq ft)
TAZ Size (2005 acres)
Household Density (2005)
Number of Additional
Households Needed for Bus Service
Number of Households
(2035)
Number of employees
(2035)
Estimated Non-Residential Floor Space
(2035)
Household Density (2035)
Number of Additional
Households Needed for Bus Service
320 1583 1004 200800 492 3.22 385 1756 1150 230000 3.57 212
322 1803 479 95800 569 3.17 473 1941 557 111400 3.41 335
323 1567 545 109000 429 3.65 149 1835 721 144200 4.28 -119
325 1040 465 93000 1588 0.65 5312 1142 487 97400 0.72 5210
326 1773 926 185200 3542 0.50 12395 1971 975 195000 0.56 12197
327 1728 872 174400 536 3.22 416 1926 907 181400 3.59 218
Transit Treshold Index
Local Bus
Intermediate Bus
Frequent Level Bus
Light Rail
Commuter Rail
Local Bus (MTA)
Modal Investigation Report Final – April 2016
32
Table 16: MD 173 Mode Investigation
Existing Transit None
Potential Improvements / Modes
Future Local Bus Service
Sidewalks
Multi-use Paths
Bicycle Lanes
Potential Stations None
Potential Terminals None
Modal Connections Dependent on bus route selected
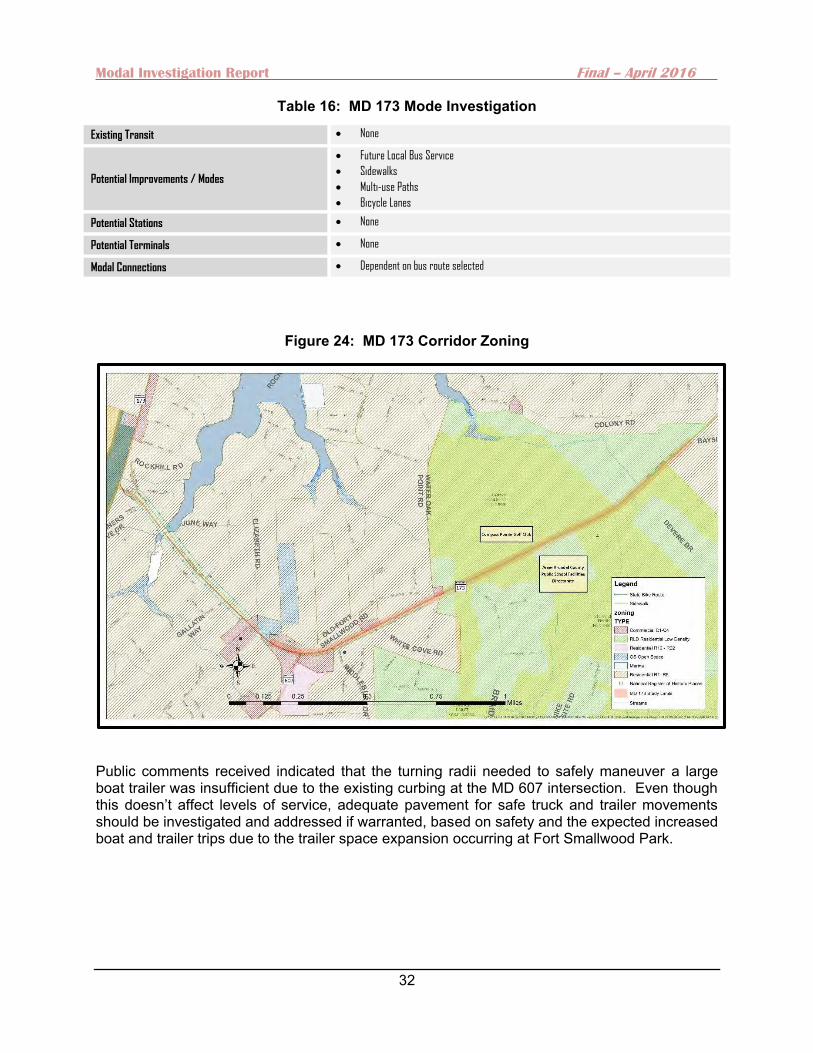
Figure 24: MD 173 Corridor Zoning
Public comments received indicated that the turning radii needed to safely maneuver a large boat trailer was insufficient due to the existing curbing at the MD 607 intersection. Even though this doesn’t affect levels of service, adequate pavement for safe truck and trailer movements should be investigated and addressed if warranted, based on safety and the expected increased boat and trailer trips due to the trailer space expansion occurring at Fort Smallwood Park.
Modal Investigation Report Final – April 2016
33
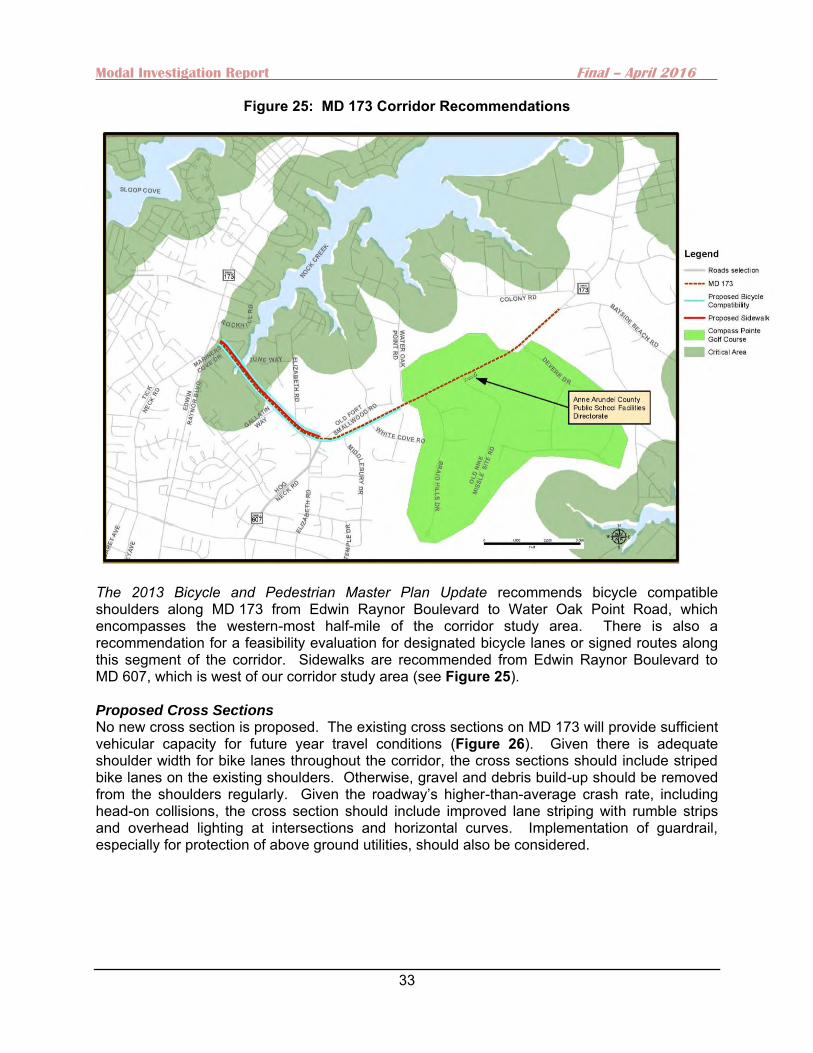
Figure 25: MD 173 Corridor Recommendations
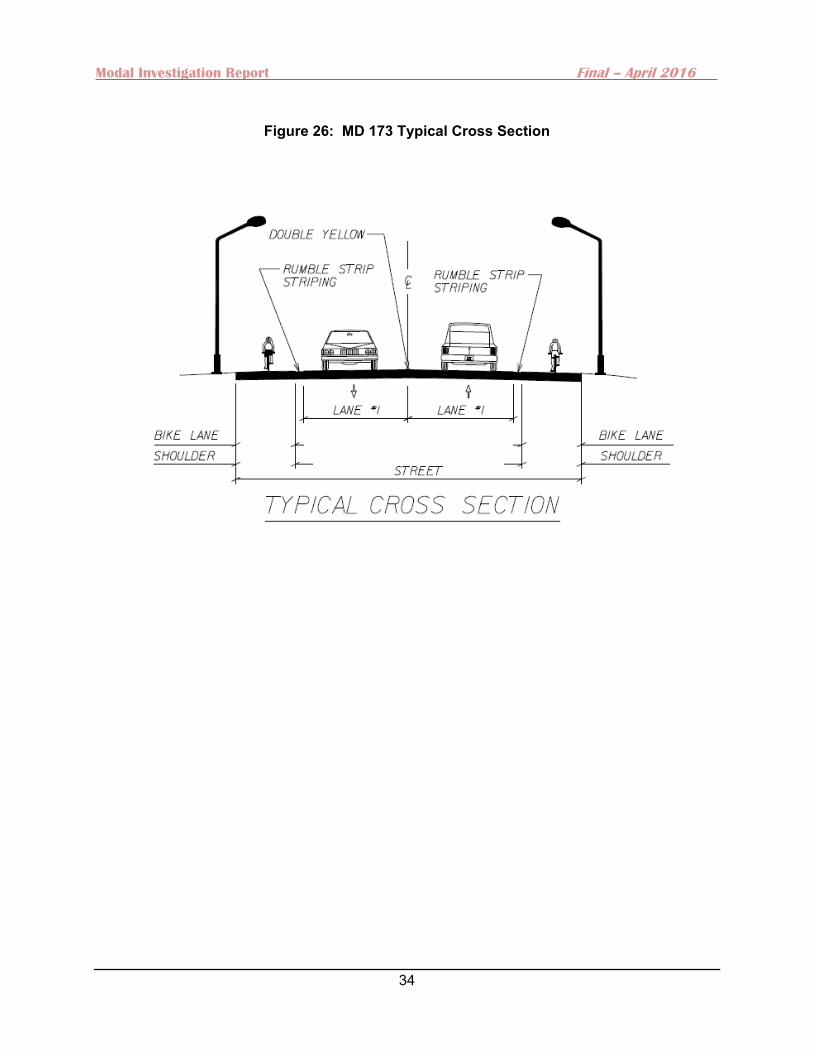
The 2013 Bicycle and Pedestrian Master Plan Update recommends bicycle compatible shoulders along MD 173 from Edwin Raynor Boulevard to Water Oak Point Road, which encompasses the western-most half-mile of the corridor study area. There is also a recommendation for a feasibility evaluation for designated bicycle lanes or signed routes along this segment of the corridor. Sidewalks are recommended from Edwin Raynor Boulevard to MD 607, which is west of our corridor study area (see Figure 25). Proposed Cross Sections No new cross section is proposed. The existing cross sections on MD 173 will provide sufficient vehicular capacity for future year travel conditions (Figure 26). Given there is adequate shoulder width for bike lanes throughout the corridor, the cross sections should include striped bike lanes on the existing shoulders. Otherwise, gravel and debris build-up should be removed from the shoulders regularly. Given the roadway’s higher-than-average crash rate, including head-on collisions, the cross section should include improved lane striping with rumble strips and overhead lighting at intersections and horizontal curves. Implementation of guardrail, especially for protection of above ground utilities, should also be considered.
Modal Investigation Report Final – April 2016
34
Figure 26: MD 173 Typical Cross Section
Modal Investigation Report Final – April 2016
35
2.4 MD 177/Mountain Road
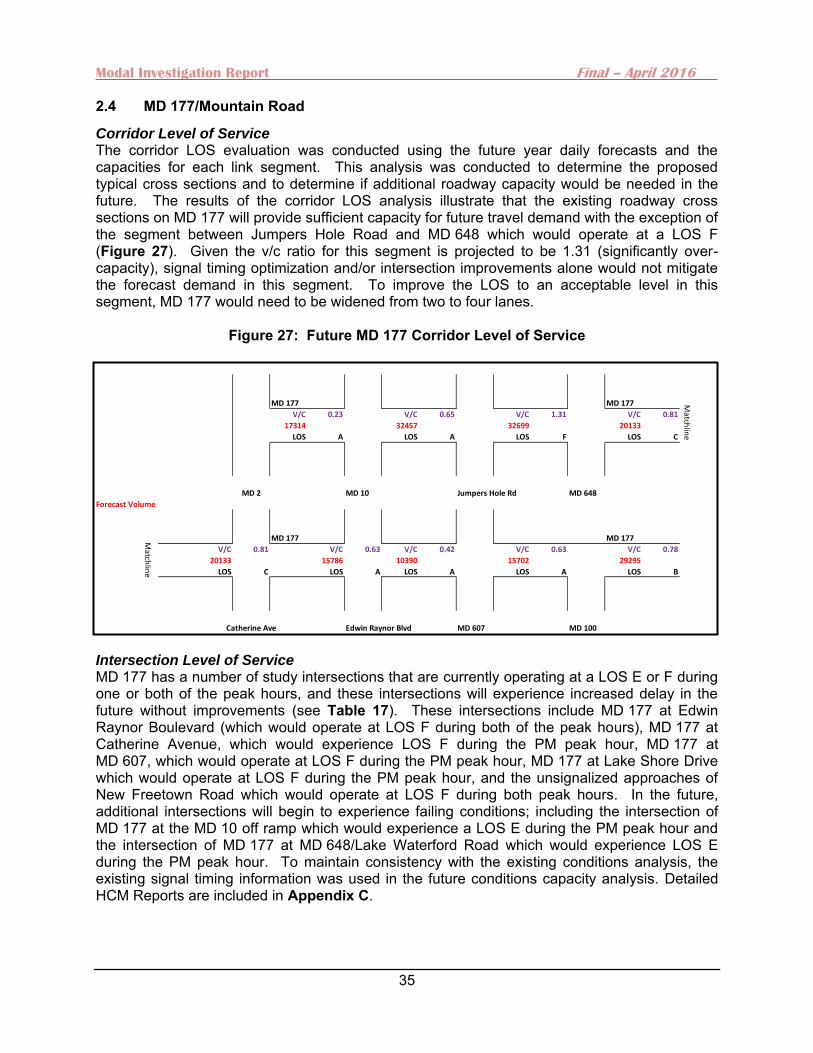
Corridor Level of Service The corridor LOS evaluation was conducted using the future year daily forecasts and the capacities for each link segment. This analysis was conducted to determine the proposed typical cross sections and to determine if additional roadway capacity would be needed in the future. The results of the corridor LOS analysis illustrate that the existing roadway cross sections on MD 177 will provide sufficient capacity for future travel demand with the exception of the segment between Jumpers Hole Road and MD 648 which would operate at a LOS F (Figure 27). Given the v/c ratio for this segment is projected to be 1.31 (significantly over-capacity), signal timing optimization and/or intersection improvements alone would not mitigate the forecast demand in this segment. To improve the LOS to an acceptable level in this segment, MD 177 would need to be widened from two to four lanes.
Figure 27: Future MD 177 Corridor Level of Service
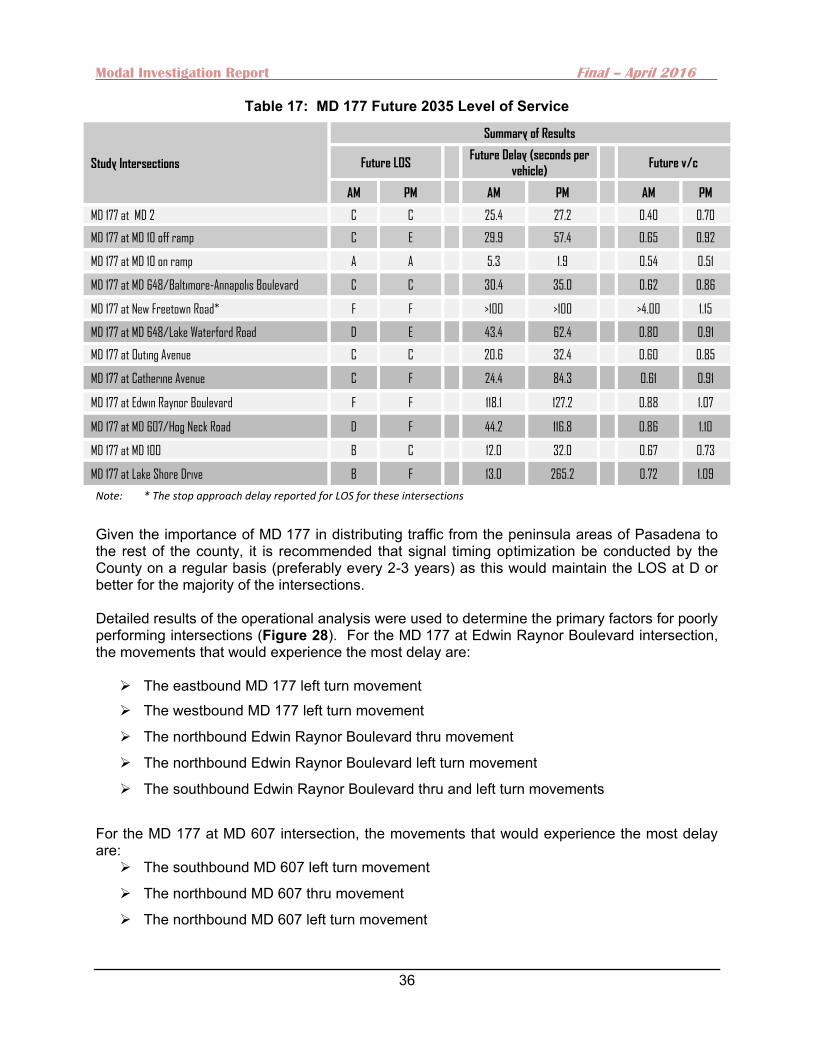
Intersection Level of Service MD 177 has a number of study intersections that are currently operating at a LOS E or F during one or both of the peak hours, and these intersections will experience increased delay in the future without improvements (see Table 17). These intersections include MD 177 at Edwin Raynor Boulevard (which would operate at LOS F during both of the peak hours), MD 177 at Catherine Avenue, which would experience LOS F during the PM peak hour, MD 177 at MD 607, which would operate at LOS F during the PM peak hour, MD 177 at Lake Shore Drive which would operate at LOS F during the PM peak hour, and the unsignalized approaches of New Freetown Road which would operate at LOS F during both peak hours. In the future, additional intersections will begin to experience failing conditions; including the intersection of MD 177 at the MD 10 off ramp which would experience a LOS E during the PM peak hour and the intersection of MD 177 at MD 648/Lake Waterford Road which would experience LOS E during the PM peak hour. To maintain consistency with the existing conditions analysis, the existing signal timing information was used in the future conditions capacity analysis. Detailed HCM Reports are included in Appendix C.
MD 177 MD 177
V/C 0.23 V/C 0.65 V/C 1.31 V/C 0.81
17314 32457 32699 20133
LOS A LOS A LOS F LOS C
MD 2 MD 10 Jumpers Hole Rd MD 648
Forecast Volume
MD 177 MD 177
V/C 0.81 V/C 0.63 V/C 0.42 V/C 0.63 V/C 0.78
20133 15786 10390 15702 29295
LOS C LOS A LOS A LOS A LOS B
Catherine Ave Edwin Raynor Blvd MD 607 MD 100
Match
line
Match
line
Modal Investigation Report Final – April 2016
36
Table 17: MD 177 Future 2035 Level of Service
Study Intersections
Summary of Results
Future LOS Future Delay (seconds per
vehicle)
Future v/c
AM PM AM PM AM PM
MD 177 at MD 2 C C 25.4 27.2 0.40 0.70
MD 177 at MD 10 off ramp C E 29.9 57.4 0.65 0.92
MD 177 at MD 10 on ramp A A 5.3 1.9 0.54 0.51
MD 177 at MD 648/Baltimore-Annapolis Boulevard C C 30.4 35.0 0.62 0.86
MD 177 at New Freetown Road* F F >100 >100 >4.00 1.15
MD 177 at MD 648/Lake Waterford Road D E 43.4 62.4 0.80 0.91
MD 177 at Outing Avenue C C 20.6 32.4 0.60 0.85
MD 177 at Catherine Avenue C F 24.4 84.3 0.61 0.91
MD 177 at Edwin Raynor Boulevard F F 118.1 127.2 0.88 1.07
MD 177 at MD 607/Hog Neck Road D F 44.2 116.8 0.86 1.10
MD 177 at MD 100 B C 12.0 32.0 0.67 0.73
MD 177 at Lake Shore Drive B F 13.0 265.2 0.72 1.09
Note: * The stop approach delay reported for LOS for these intersections
Given the importance of MD 177 in distributing traffic from the peninsula areas of Pasadena to the rest of the county, it is recommended that signal timing optimization be conducted by the County on a regular basis (preferably every 2-3 years) as this would maintain the LOS at D or better for the majority of the intersections. Detailed results of the operational analysis were used to determine the primary factors for poorly performing intersections (Figure 28). For the MD 177 at Edwin Raynor Boulevard intersection, the movements that would experience the most delay are:
The eastbound MD 177 left turn movement The westbound MD 177 left turn movement
The northbound Edwin Raynor Boulevard thru movement
The northbound Edwin Raynor Boulevard left turn movement
The southbound Edwin Raynor Boulevard thru and left turn movements
For the MD 177 at MD 607 intersection, the movements that would experience the most delay are:
The southbound MD 607 left turn movement
The northbound MD 607 thru movement
The northbound MD 607 left turn movement
Modal Investigation Report Final – April 2016
37
For the MD 177 at Lake Shore Drive intersection, the movement that would experience the most delay is:
The eastbound MD 177 thru movement
For the MD 177 at Catherine Avenue intersection, the movements that would experience the most delay are:
The eastbound MD 177 thru and left turn movements
The westbound MD 177 thru and left turn movements
For the MD 177 at MD 10 off ramp intersection, the movements that would experience the most delay are:
The southbound MD 10 thru movement
The southbound MD 10 left turn movement
The 95th percentile queues in Synchro are forecast to extend over 400’ in the southbound left turn lane on the MD 10 off ramp at MD 177 during the PM peak hour. The queues also are forecast to extend over 500’ in the westbound MD 177 left turn lane at Catherine Avenue during the PM peak hour. The 95th percentile queues in the northbound left turn lane on Edwin Raynor Boulevard are forecast to extend over 400’ during the PM peak hour.
Figure 28: Future MD 177 Level of Service “Hot Spots”
Modal Investigation Report Final – April 2016
38
A roadway and intersection LOS summary with increased roadway capacity for the MD 177 corridor is presented in Figure 29. The corridor LOS evaluation was conducted using the future year daily forecasts and the updated capacities for each link segment. This analysis indicated that the section of MD 177 between Jumpers Hole Road and MD 648 would have a LOS B in the year 2035 with the roadway widened from two to four lanes.
Figure 29: Future MD 177 Corridor Level of Service- With Road Widening
Intersection Level of Service
The most likely design for the capacity improvements on MD 177 would terminate the additional through lane between Jumpers Hole Road and MD 648 as a right turn only lane at MD 648. Therefore, the approach lane configurations would remain the same at this intersection, and there would be no change in the LOS. The only intersection where the delay would change with the roadway widening would be the unsignalized intersection of New Freetown Road (bolded in Table 18) where the delay would be reduced on the unsignalized New Freetown Road approach; however, the LOS would remain F during both peak hours.
MD 177 MD 177
V/C 0.23 V/C 0.65 V/C 0.72 V/C 0.84
17314 32457 36094 20962
LOS A LOS A LOS B LOS C
MD 2 MD 10 Jumpers Hole Rd MD 648
Forecast Volume
MD 177 MD 177
V/C 0.84 V/C 0.63 V/C 0.42 V/C 0.63 V/C 0.78
20962 15786 10390 15702 29295
LOS C LOS A LOS A LOS A LOS B
Catherine Ave Edwin Raynor Blvd MD 607 MD 100
Match
line
Match
line
Modal Investigation Report Final – April 2016
39
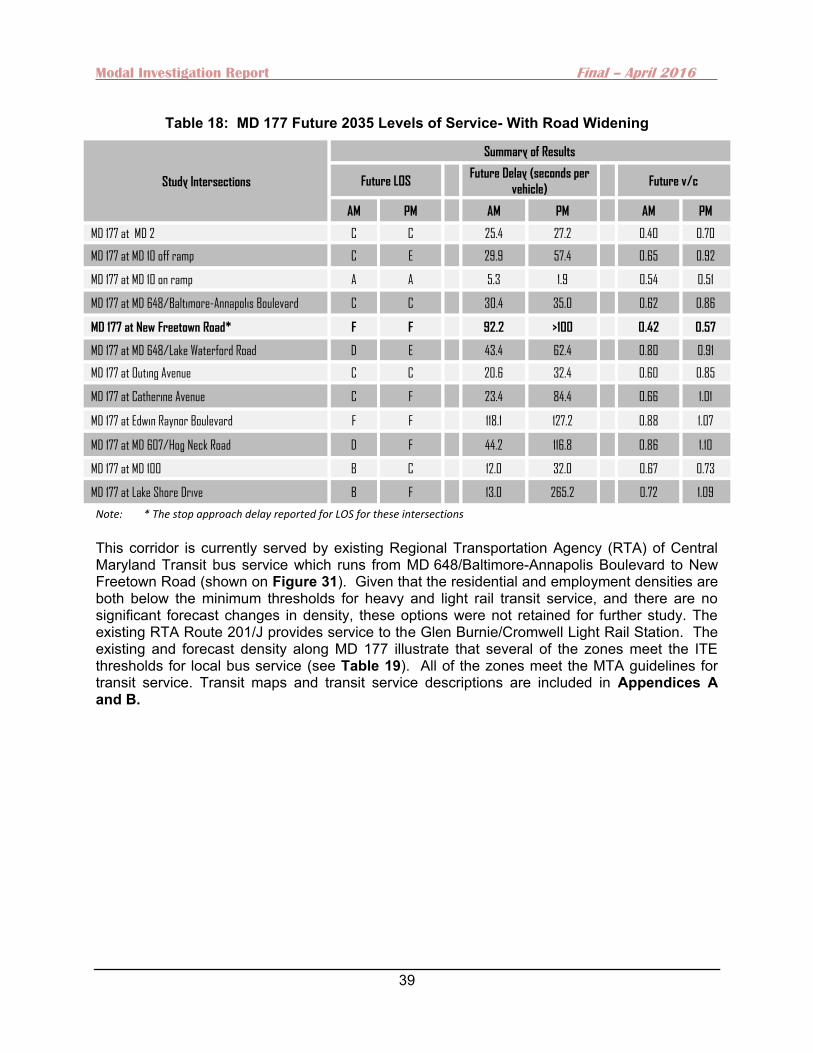
Table 18: MD 177 Future 2035 Levels of Service- With Road Widening
Note: * The stop approach delay reported for LOS for these intersections
This corridor is currently served by existing Regional Transportation Agency (RTA) of Central Maryland Transit bus service which runs from MD 648/Baltimore-Annapolis Boulevard to New Freetown Road (shown on Figure 31). Given that the residential and employment densities are both below the minimum thresholds for heavy and light rail transit service, and there are no significant forecast changes in density, these options were not retained for further study. The existing RTA Route 201/J provides service to the Glen Burnie/Cromwell Light Rail Station. The existing and forecast density along MD 177 illustrate that several of the zones meet the ITE thresholds for local bus service (see Table 19). All of the zones meet the MTA guidelines for transit service. Transit maps and transit service descriptions are included in Appendices A and B.
Study Intersections
Summary of Results
Future LOS Future Delay (seconds per
vehicle)
Future v/c
AM PM AM PM AM PM
MD 177 at MD 2 C C 25.4 27.2 0.40 0.70
MD 177 at MD 10 off ramp C E 29.9 57.4 0.65 0.92
MD 177 at MD 10 on ramp A A 5.3 1.9 0.54 0.51
MD 177 at MD 648/Baltimore-Annapolis Boulevard C C 30.4 35.0 0.62 0.86
MD 177 at New Freetown Road* F F 92.2 >100 0.42 0.57
MD 177 at MD 648/Lake Waterford Road D E 43.4 62.4 0.80 0.91
MD 177 at Outing Avenue C C 20.6 32.4 0.60 0.85
MD 177 at Catherine Avenue C F 23.4 84.4 0.66 1.01
MD 177 at Edwin Raynor Boulevard F F 118.1 127.2 0.88 1.07
MD 177 at MD 607/Hog Neck Road D F 44.2 116.8 0.86 1.10
MD 177 at MD 100 B C 12.0 32.0 0.67 0.73
MD 177 at Lake Shore Drive B F 13.0 265.2 0.72 1.09
Modal Investigation Report Final – April 2016
40
Figure 30: MD 177 Cube Model TAZ Structure
Table 19: MD 177 Transit Density Analysis
TAZNumber of
Households (2005)
Number of employees
(2005)
Estimated Non-Residential Floor Space (2005 sq ft)
TAZ Size (2005 acres)
Household Density (2005)
Number of Additional
Households Needed for Bus Service
Number of Households
(2035)
Number of employees
(2035)
Estimated Non-Residential Floor Space
(2035)
Household Density (2035)
Number of Additional
Households Needed for Bus Service
267 1816 1406 281200 322 5.64 -528 2000 1656 331200 6.21 -712
269 417 159 31800 97 4.30 -29 575 155 31000 5.93 -187
270 732 425 85000 472 1.55 1156 907 512 102400 1.92 981
299 785 1030 206000 538 1.46 1367 885 1016 203200 1.64 1267
316 1562 820 164000 1525 1.02 4538 1814 910 182000 1.19 4286
317 664 2619 523800 1243 0.53 4308 1014 2556 511200 0.82 3958
318 1593 1581 316200 1871 0.85 5891 1743 1749 349800 0.93 5741
319 1143 490 98000 2212 0.52 7705 1341 577 115400 0.61 7507
320 1583 1004 200800 492 3.22 385 1756 1150 230000 3.57 212
322 1803 479 95800 569 3.17 473 1941 557 111400 3.41 335
323 1567 545 109000 429 3.65 149 1835 721 144200 4.28 -119
324 1073 290 58000 514 2.09 983 1296 366 73200 2.52 760
327 1728 872 174400 536 3.22 416 1926 907 181400 3.59 218
328 1146 929 185800 1704 0.67 5670 1231 911 182200 0.72 5585
329 1368 295 59000 2941 0.47 10396 1449 1172 234400 0.49 10315
1336 0 2216 443200 152 0.00 608 468 890 178000 3.08 140
Transit Treshold Index
Local Bus
Intermediate Bus
Frequent Level Bus
Light Rail
Commuter Rail
Local Bus (MTA)
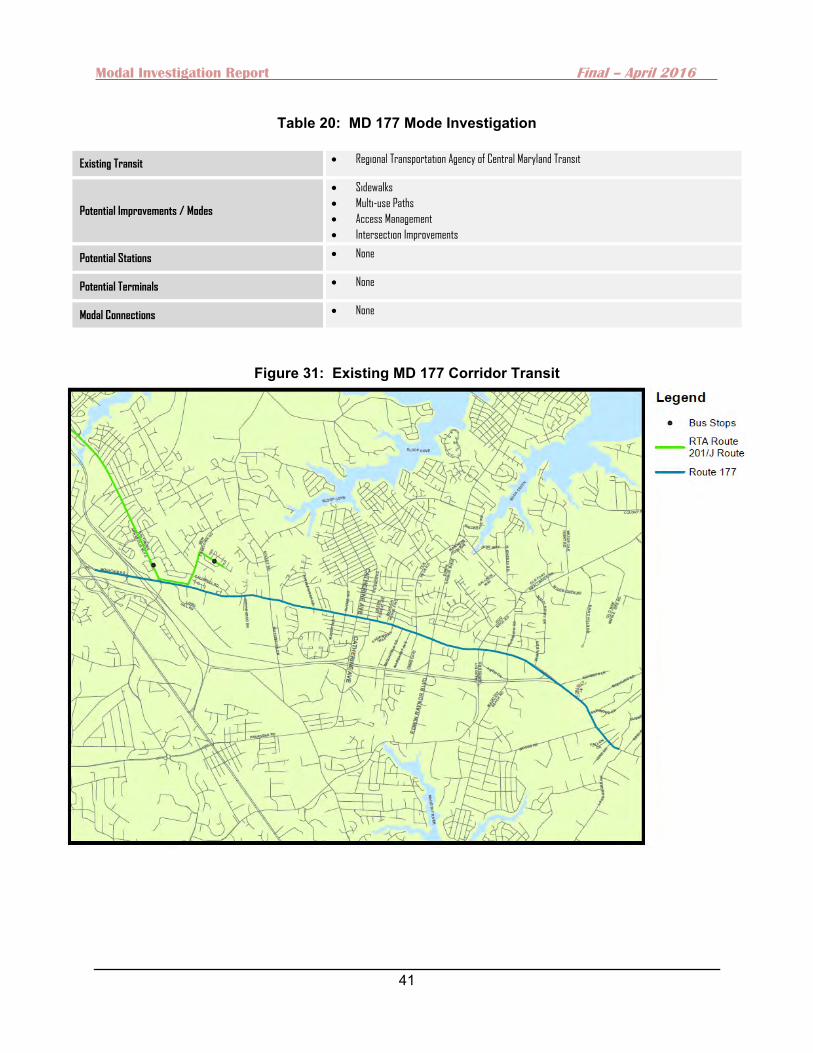
Modal Investigation Report Final – April 2016
41
Table 20: MD 177 Mode Investigation
Existing Transit Regional Transportation Agency of Central Maryland Transit
Potential Improvements / Modes
Sidewalks
Multi-use Paths
Access Management
Intersection Improvements
Potential Stations None
Potential Terminals None
Modal Connections None
Figure 31: Existing MD 177 Corridor Transit
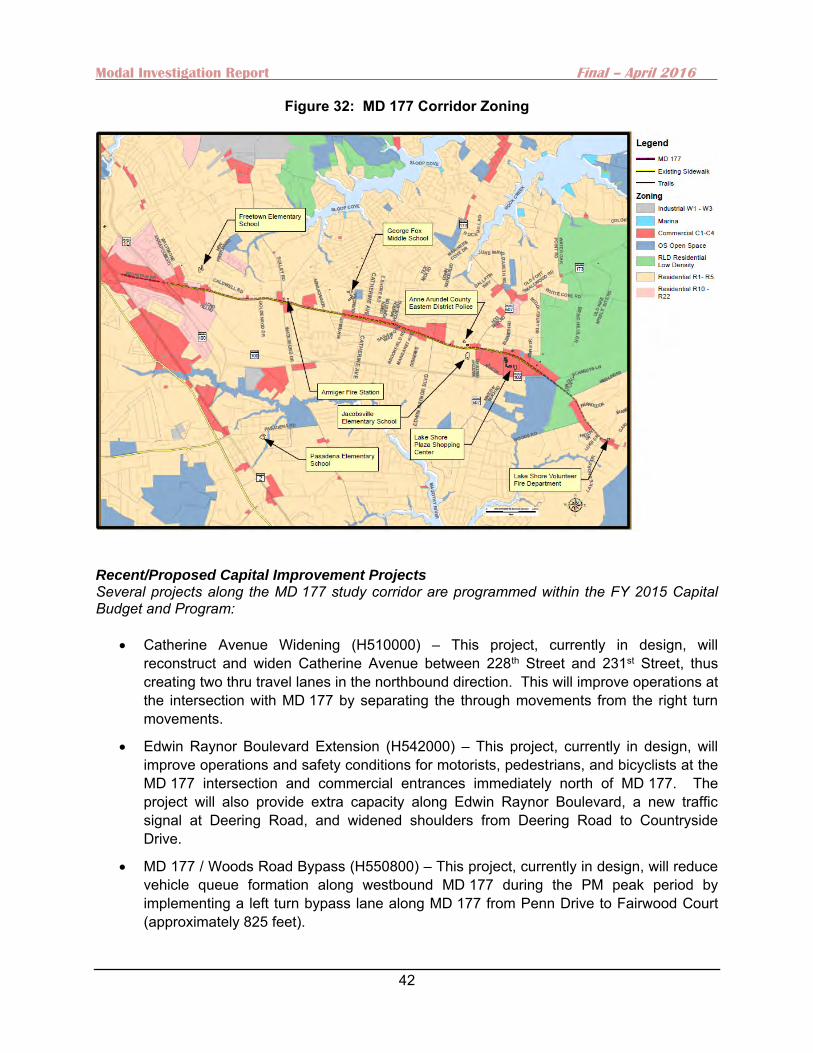
Modal Investigation Report Final – April 2016
42
Figure 32: MD 177 Corridor Zoning
Recent/Proposed Capital Improvement Projects Several projects along the MD 177 study corridor are programmed within the FY 2015 Capital Budget and Program:
Catherine Avenue Widening (H510000) – This project, currently in design, will reconstruct and widen Catherine Avenue between 228th Street and 231st Street, thus creating two thru travel lanes in the northbound direction. This will improve operations at the intersection with MD 177 by separating the through movements from the right turn movements.
Edwin Raynor Boulevard Extension (H542000) – This project, currently in design, will improve operations and safety conditions for motorists, pedestrians, and bicyclists at the MD 177 intersection and commercial entrances immediately north of MD 177. The project will also provide extra capacity along Edwin Raynor Boulevard, a new traffic signal at Deering Road, and widened shoulders from Deering Road to Countryside Drive.
MD 177 / Woods Road Bypass (H550800) – This project, currently in design, will reduce vehicle queue formation along westbound MD 177 during the PM peak period by implementing a left turn bypass lane along MD 177 from Penn Drive to Fairwood Court (approximately 825 feet).
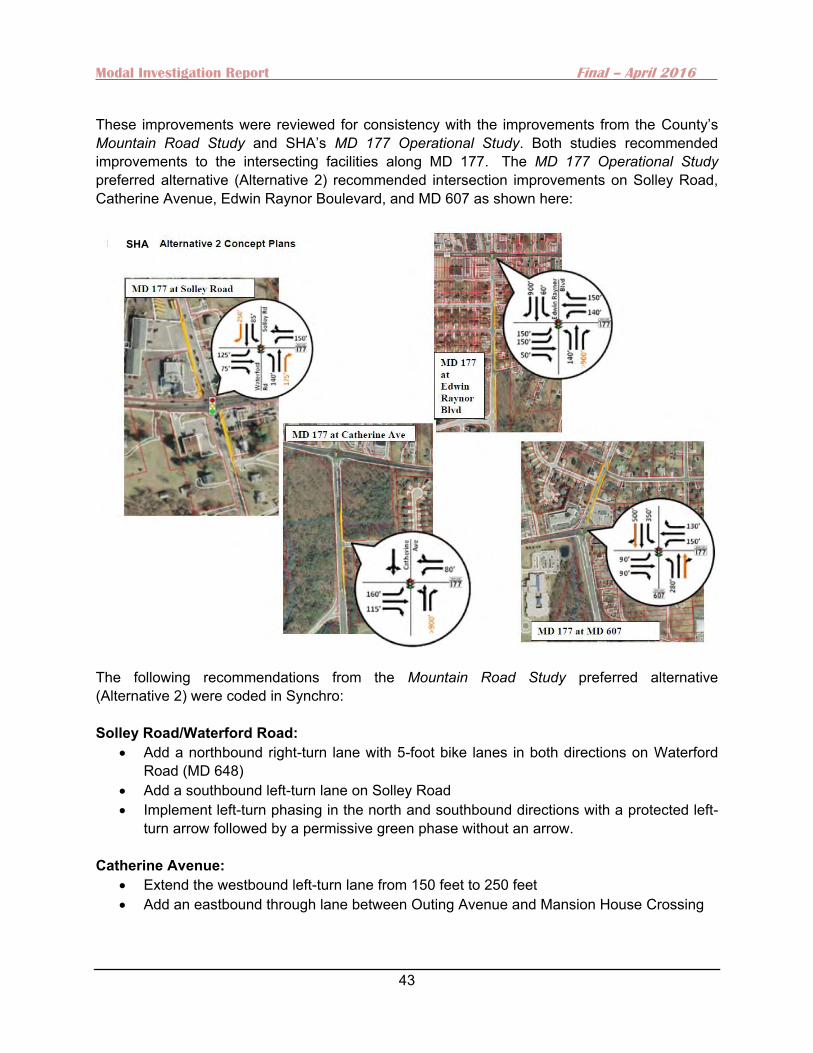
Modal Investigation Report Final – April 2016
43
These improvements were reviewed for consistency with the improvements from the County’s Mountain Road Study and SHA’s MD 177 Operational Study. Both studies recommended improvements to the intersecting facilities along MD 177. The MD 177 Operational Study preferred alternative (Alternative 2) recommended intersection improvements on Solley Road, Catherine Avenue, Edwin Raynor Boulevard, and MD 607 as shown here:
The following recommendations from the Mountain Road Study preferred alternative (Alternative 2) were coded in Synchro: Solley Road/Waterford Road:
Add a northbound right-turn lane with 5-foot bike lanes in both directions on Waterford Road (MD 648)
Add a southbound left-turn lane on Solley Road Implement left-turn phasing in the north and southbound directions with a protected left-
turn arrow followed by a permissive green phase without an arrow. Catherine Avenue:
Extend the westbound left-turn lane from 150 feet to 250 feet Add an eastbound through lane between Outing Avenue and Mansion House Crossing
SHA
Modal Investigation Report Final – April 2016
44
Edwin Raynor Boulevard: Add a northbound through lane between Deering Road and Old Crown Drive
Potential Improvements The County’s programmed capacity improvements would improve the LOS to D or better at the intersections of MD 177 at Catherine Avenue and MD 177 at Edwin Raynor Boulevard. Additional improvements beyond signal timing optimization are recommended to improve the LOS to D or better for all of the study intersections. These improvements include:
Widen MD 177 from two to four lanes from Jumpers Hole to MD 648/Lake Waterford Conduct Traffic Signal Warrant Assessment at intersection of MD 177 at New Freetown
Road and install traffic signal if warranted Analyze the potential horizontal sight distance issue at the MD 177/MD 100 intersection
due to the median plantings. The 2013 Bicycle and Pedestrian Master Plan Update recommends sidewalk connections along the entire corridor which would operate in a safer and more efficient manner with access management implemented. MD 177 has a significant number of access points as there are numerous small businesses with driveway access on MD 177. Given that MD 177 is two lanes in these sections, (primarily between Jumpers Hole and MD 100) turning vehicles significantly impact traffic flow and safety along the corridor which makes this corridor a prime candidate for the development of an access management plan. As a part of the access management plan, driveways and local streets parallel to MD 177 should be upgraded to provide additional connections between nearby residential areas and the retail opportunities on MD 177. The development of a complete streets network would remove many of these short, local trips from MD 177 and further improve traffic flow. These recommendations are shown on Figure 33 and Table 21.
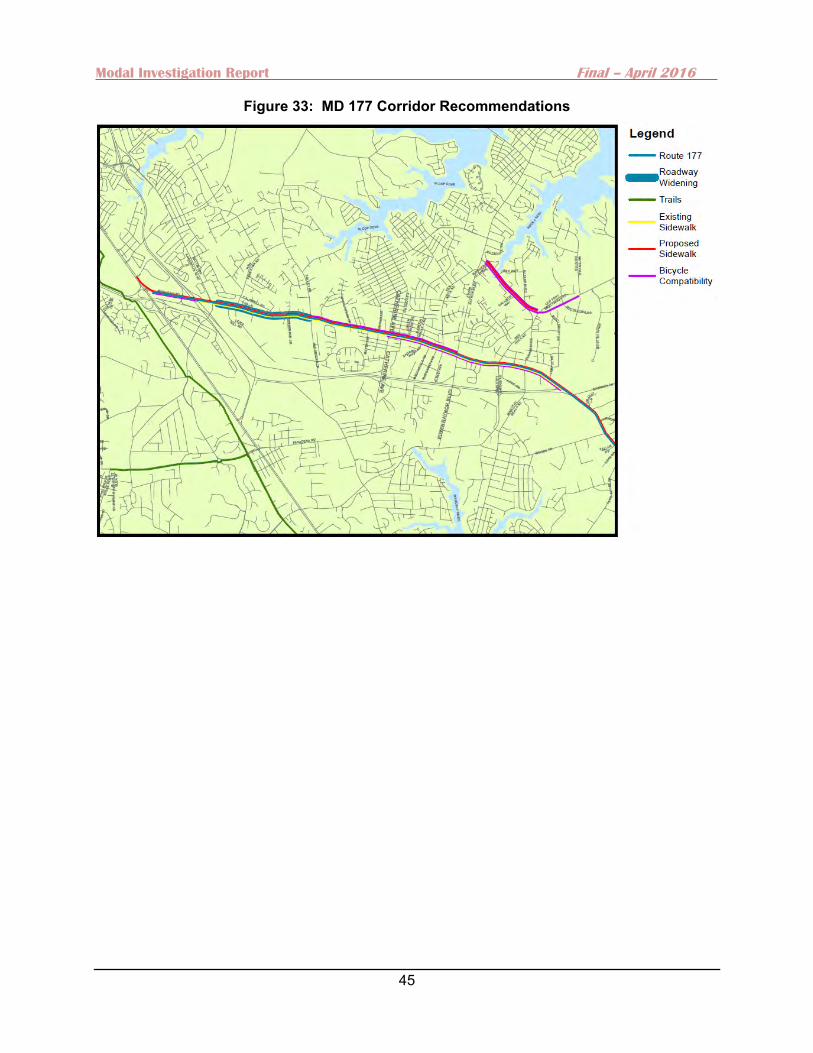
Modal Investigation Report Final – April 2016
45
Figure 33: MD 177 Corridor Recommendations
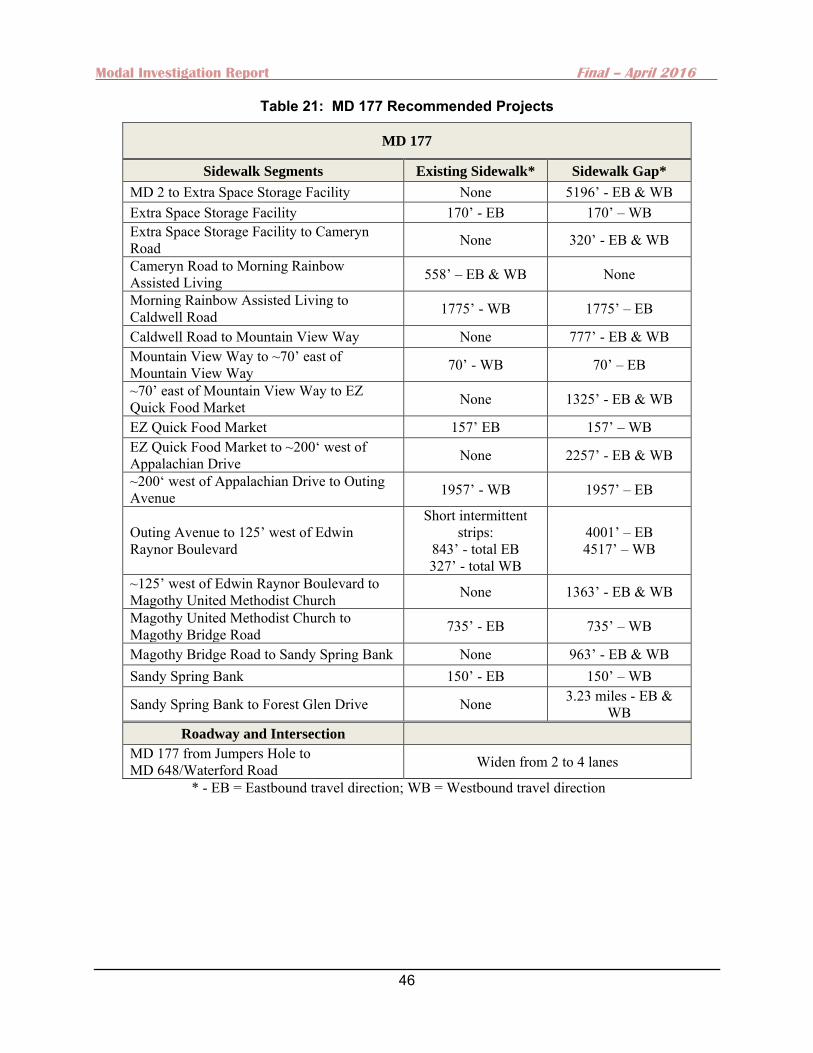
Modal Investigation Report Final – April 2016
46
Table 21: MD 177 Recommended Projects
MD 177
Sidewalk Segments Existing Sidewalk* Sidewalk Gap*
MD 2 to Extra Space Storage Facility None 5196’ - EB & WB Extra Space Storage Facility 170’ - EB 170’ – WB Extra Space Storage Facility to Cameryn Road None 320’ - EB & WB
Cameryn Road to Morning Rainbow Assisted Living 558’ – EB & WB None
Morning Rainbow Assisted Living to Caldwell Road 1775’ - WB 1775’ – EB
Caldwell Road to Mountain View Way None 777’ - EB & WB Mountain View Way to ~70’ east of Mountain View Way 70’ - WB 70’ – EB
~70’ east of Mountain View Way to EZ Quick Food Market None 1325’ - EB & WB
EZ Quick Food Market 157’ EB 157’ – WB EZ Quick Food Market to ~200‘ west of Appalachian Drive None 2257’ - EB & WB
~200‘ west of Appalachian Drive to Outing Avenue 1957’ - WB 1957’ – EB
Outing Avenue to 125’ west of Edwin Raynor Boulevard
Short intermittent strips:
843’ - total EB 327’ - total WB
4001’ – EB 4517’ – WB
~125’ west of Edwin Raynor Boulevard to Magothy United Methodist Church None 1363’ - EB & WB
Magothy United Methodist Church to Magothy Bridge Road 735’ - EB 735’ – WB
Magothy Bridge Road to Sandy Spring Bank None 963’ - EB & WB Sandy Spring Bank 150’ - EB 150’ – WB
Sandy Spring Bank to Forest Glen Drive None 3.23 miles - EB & WB
Roadway and Intersection
MD 177 from Jumpers Hole to MD 648/Waterford Road Widen from 2 to 4 lanes
* - EB = Eastbound travel direction; WB = Westbound travel direction
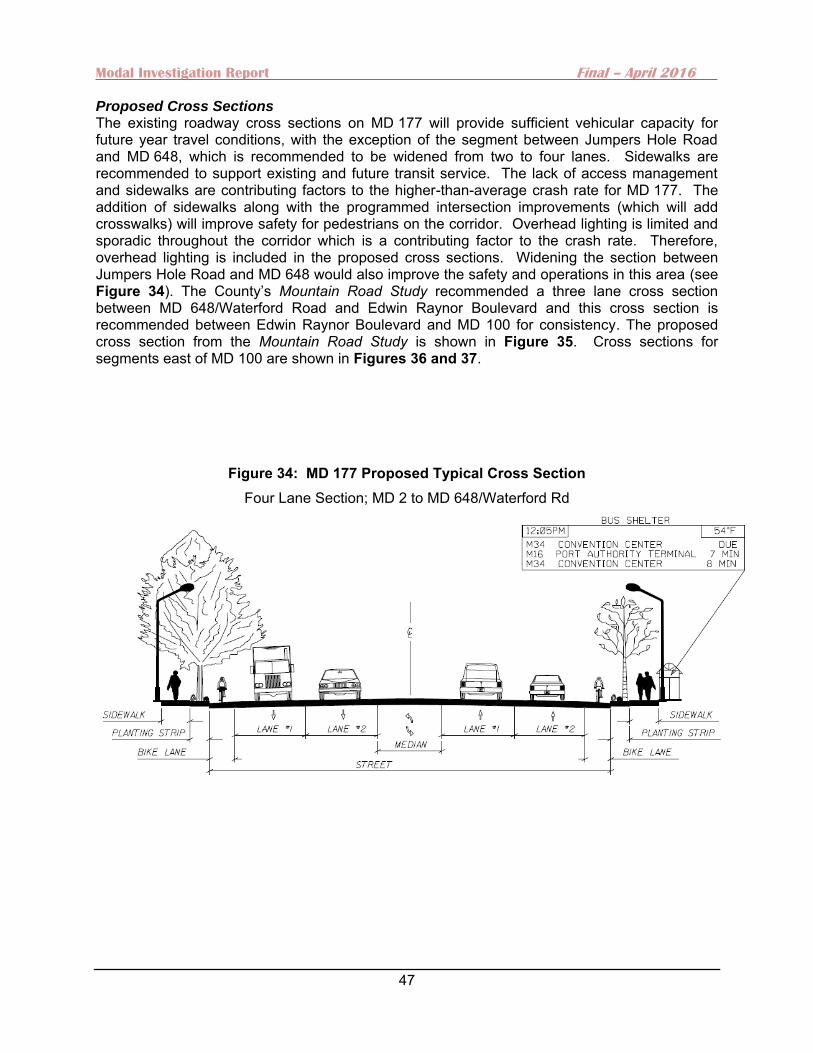
Modal Investigation Report Final – April 2016
47
Proposed Cross Sections The existing roadway cross sections on MD 177 will provide sufficient vehicular capacity for future year travel conditions, with the exception of the segment between Jumpers Hole Road and MD 648, which is recommended to be widened from two to four lanes. Sidewalks are recommended to support existing and future transit service. The lack of access management and sidewalks are contributing factors to the higher-than-average crash rate for MD 177. The addition of sidewalks along with the programmed intersection improvements (which will add crosswalks) will improve safety for pedestrians on the corridor. Overhead lighting is limited and sporadic throughout the corridor which is a contributing factor to the crash rate. Therefore, overhead lighting is included in the proposed cross sections. Widening the section between Jumpers Hole Road and MD 648 would also improve the safety and operations in this area (see Figure 34). The County’s Mountain Road Study recommended a three lane cross section between MD 648/Waterford Road and Edwin Raynor Boulevard and this cross section is recommended between Edwin Raynor Boulevard and MD 100 for consistency. The proposed cross section from the Mountain Road Study is shown in Figure 35. Cross sections for segments east of MD 100 are shown in Figures 36 and 37.
Figure 34: MD 177 Proposed Typical Cross Section Four Lane Section; MD 2 to MD 648/Waterford Rd
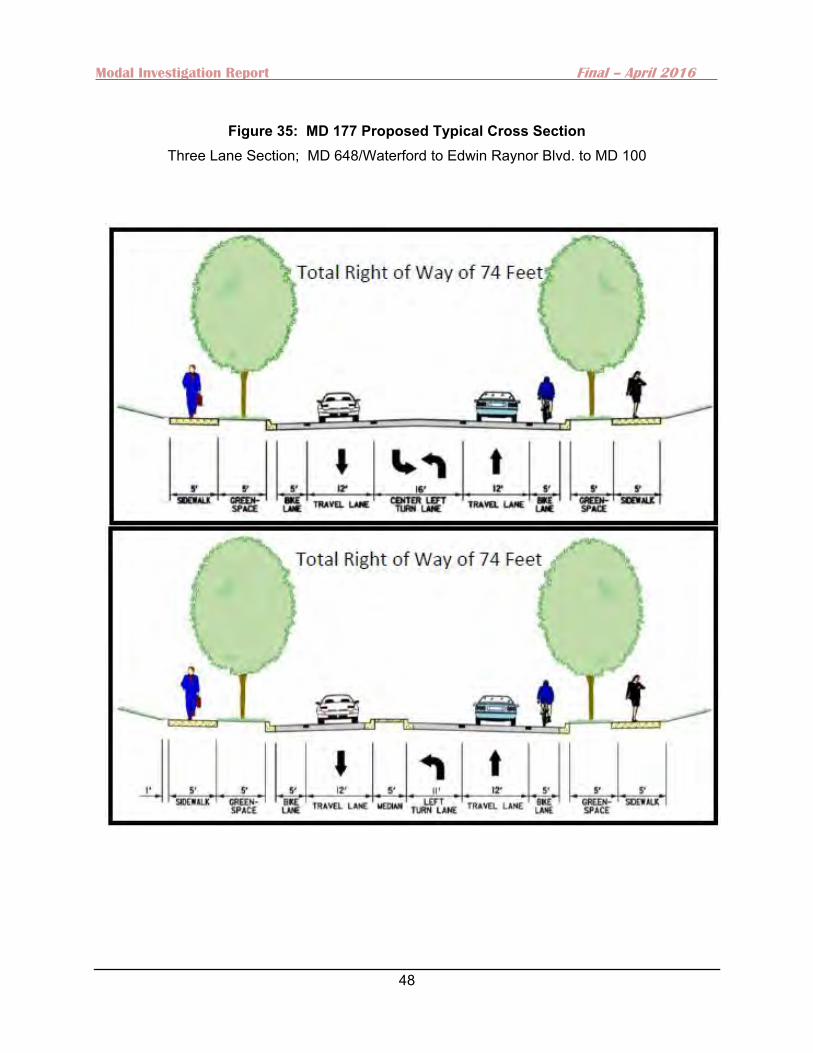
Modal Investigation Report Final – April 2016
48
Figure 35: MD 177 Proposed Typical Cross Section
Three Lane Section; MD 648/Waterford to Edwin Raynor Blvd. to MD 100
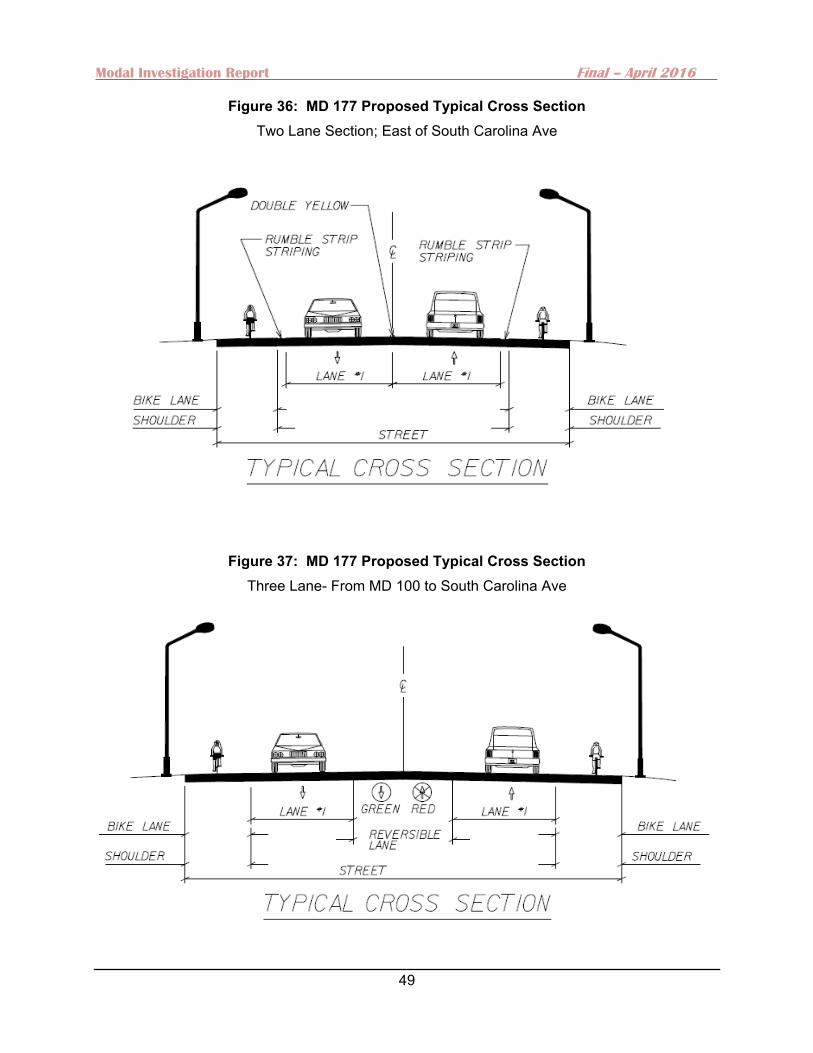
Modal Investigation Report Final – April 2016
49
Figure 36: MD 177 Proposed Typical Cross Section Two Lane Section; East of South Carolina Ave
Figure 37: MD 177 Proposed Typical Cross Section Three Lane- From MD 100 to South Carolina Ave
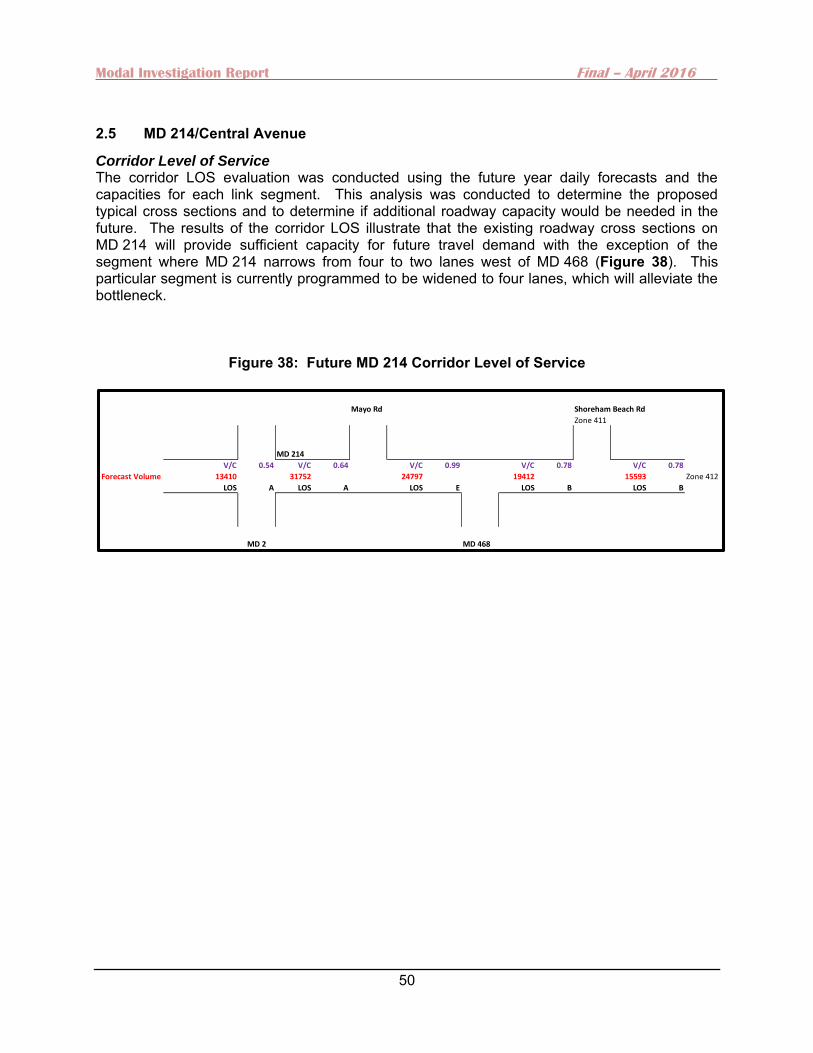
Modal Investigation Report Final – April 2016
50
2.5 MD 214/Central Avenue
Corridor Level of Service The corridor LOS evaluation was conducted using the future year daily forecasts and the capacities for each link segment. This analysis was conducted to determine the proposed typical cross sections and to determine if additional roadway capacity would be needed in the future. The results of the corridor LOS illustrate that the existing roadway cross sections on MD 214 will provide sufficient capacity for future travel demand with the exception of the segment where MD 214 narrows from four to two lanes west of MD 468 (Figure 38). This particular segment is currently programmed to be widened to four lanes, which will alleviate the bottleneck.
Figure 38: Future MD 214 Corridor Level of Service
Mayo Rd Shoreham Beach Rd
Zone 411
MD 214
V/C 0.54 V/C 0.64 V/C 0.99 V/C 0.78 V/C 0.78
Forecast Volume 13410 31752 24797 19412 15593 Zone 412
LOS A LOS A LOS E LOS B LOS B
MD 2 MD 468

Modal Investigation Report Final – April 2016
51
Intersection Level of Service The intersection of MD 214 at MD 468 would operate at a LOS F during the AM and PM peak hours in the year 2035 (see Table 22). To maintain consistency with the existing conditions analysis, the existing signal timing information was used in the future conditions capacity analysis. Detailed HCM Reports are included in Appendix C.
Table 22: MD 214 Future 2035 Level of Service
Study Intersections
Summary of Results
Existing Existing Delay (seconds
per vehicle)
Existing v/c
AM PM AM PM
MD 214 at MD 424 D D 37.3 43.2 0.88 0.92
MD 214 at Riva Road* F F 61.4 > 100 0.17 0.19
MD 214 at MD 2 D D 43.7 49.7 0.93 1.02
MD 214 at Stepneys Lane* F F > 100 > 100 0.92 3.15
MD 214 at MD 468 B A 10.1 8.0 0.59 0.54
Note: * The stop approach delay reported for LOS for these intersections
Detailed results of the operational analysis were used to determine the movements with the poorest LOS and highest delays (see Figure 39). For the MD 214 at Riva Road intersection, the movements and geometric conditions contributing to the poor LOS are:
The northbound gas station driveway exit
The southbound Riva Road approach
For the MD 214 at Stepneys Lane intersection, the movements and geometric conditions contributing to the poor LOS are:
The southbound Stepneys Lane approach
The 95th percentile queues in Synchro are forecast to extend over 400’ in the southbound left turn lane on MD 424 at MD 214 during the PM peak hour.
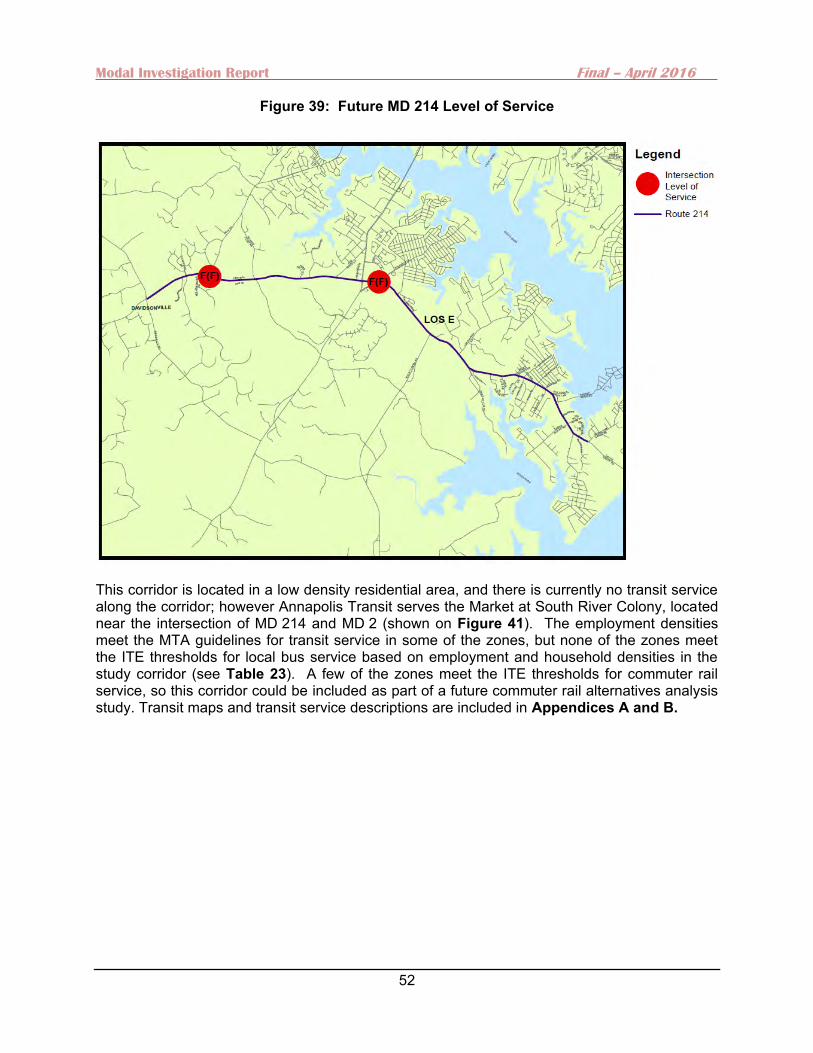
Modal Investigation Report Final – April 2016
52
Figure 39: Future MD 214 Level of Service
This corridor is located in a low density residential area, and there is currently no transit service along the corridor; however Annapolis Transit serves the Market at South River Colony, located near the intersection of MD 214 and MD 2 (shown on Figure 41). The employment densities meet the MTA guidelines for transit service in some of the zones, but none of the zones meet the ITE thresholds for local bus service based on employment and household densities in the study corridor (see Table 23). A few of the zones meet the ITE thresholds for commuter rail service, so this corridor could be included as part of a future commuter rail alternatives analysis study. Transit maps and transit service descriptions are included in Appendices A and B.

Modal Investigation Report Final – April 2016
53
Figure 40: MD 214 Cube Model TAZ Structure
Table 23: MD 214 Transit Density Analysis
TAZNumber of
Households (2005)
Number of employees
(2005)
Estimated Non-Residential Floor Space (2005 sq ft)
TAZ Size (2005 acres)
Household Density (2005)
Number of Additional
Households Needed for Bus Service
Number of Households
(2035)
Number of employees
(2035)
Estimated Non-Residential Floor Space
(2035)
Household Density (2035)
Number of Additional
Households Needed for Bus Service
408 61 366 73200 98 0.62 331 73 828 165600 0.74 319
409 1741 1413 282600 742 2.35 1227 1778 1558 311600 2.40 1190
410 1329 1157 231400 513 2.59 723 1329 1231 246200 2.59 723
411 887 292 58400 1604 0.55 5529 1012 316 63200 0.63 5404
412 2102 698 139600 2123 0.99 6390 2353 688 137600 1.11 6139
1313 447 444 88800 579 0.77 1869 536 1007 201400 0.93 1780
1315 45 78 15600 717 0.06 2823 51 74 14800 0.07 2817
Transit Treshold Index
Local Bus
Intermediate Bus
Frequent Level Bus
Light Rail
Commuter Rail
Local Bus (MTA)

Modal Investigation Report Final – April 2016
54
Table 24: MD 214 Mode Investigation
Existing Transit None
Potential Improvements / Modes
Potential Commuter Rail to Washington D.C.
Sidewalks
Multi-use Paths
Bicycle Lanes
Intersection Improvements
Potential Stations MD 2 at MD 214
Potential Terminals MD 2 at MD 214
Modal Connections Pedestrian connections to Mayo Elementary School and South River High School (crosswalk)
Figure 41: MD 214 Corridor Transit Service
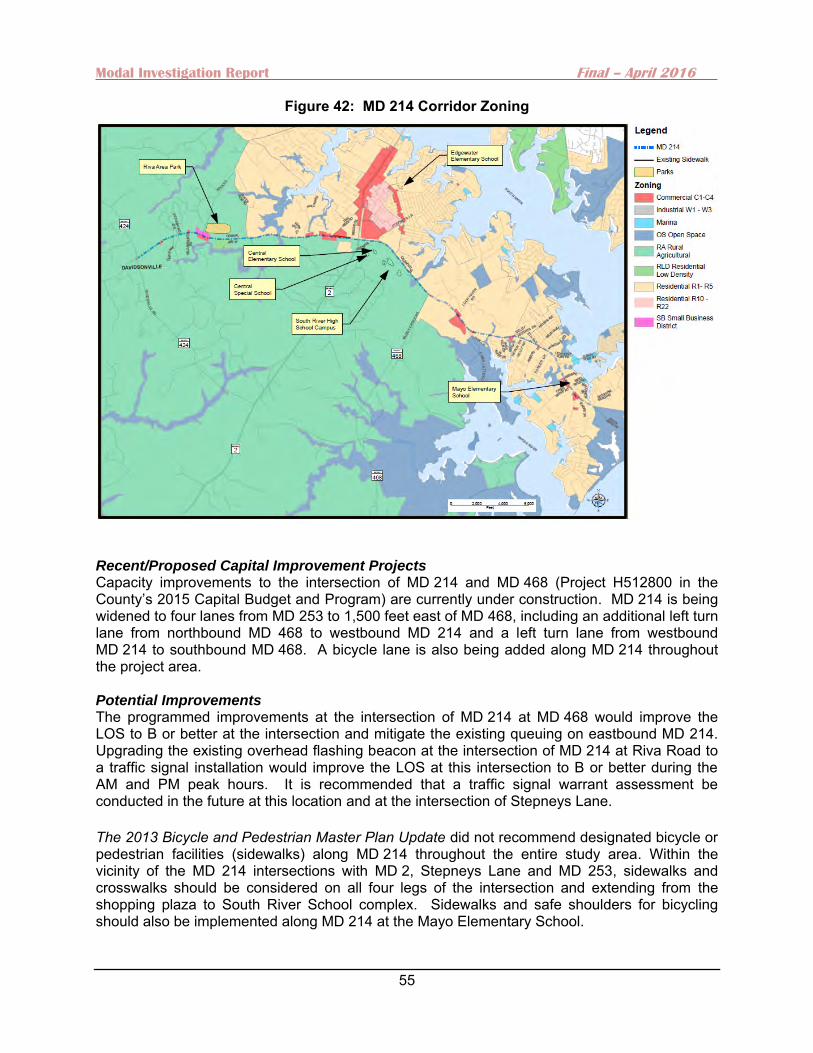
Modal Investigation Report Final – April 2016
55
Figure 42: MD 214 Corridor Zoning
Recent/Proposed Capital Improvement Projects Capacity improvements to the intersection of MD 214 and MD 468 (Project H512800 in the County’s 2015 Capital Budget and Program) are currently under construction. MD 214 is being widened to four lanes from MD 253 to 1,500 feet east of MD 468, including an additional left turn lane from northbound MD 468 to westbound MD 214 and a left turn lane from westbound MD 214 to southbound MD 468. A bicycle lane is also being added along MD 214 throughout the project area. Potential Improvements The programmed improvements at the intersection of MD 214 at MD 468 would improve the LOS to B or better at the intersection and mitigate the existing queuing on eastbound MD 214. Upgrading the existing overhead flashing beacon at the intersection of MD 214 at Riva Road to a traffic signal installation would improve the LOS at this intersection to B or better during the AM and PM peak hours. It is recommended that a traffic signal warrant assessment be conducted in the future at this location and at the intersection of Stepneys Lane. The 2013 Bicycle and Pedestrian Master Plan Update did not recommend designated bicycle or pedestrian facilities (sidewalks) along MD 214 throughout the entire study area. Within the vicinity of the MD 214 intersections with MD 2, Stepneys Lane and MD 253, sidewalks and crosswalks should be considered on all four legs of the intersection and extending from the shopping plaza to South River School complex. Sidewalks and safe shoulders for bicycling should also be implemented along MD 214 at the Mayo Elementary School.
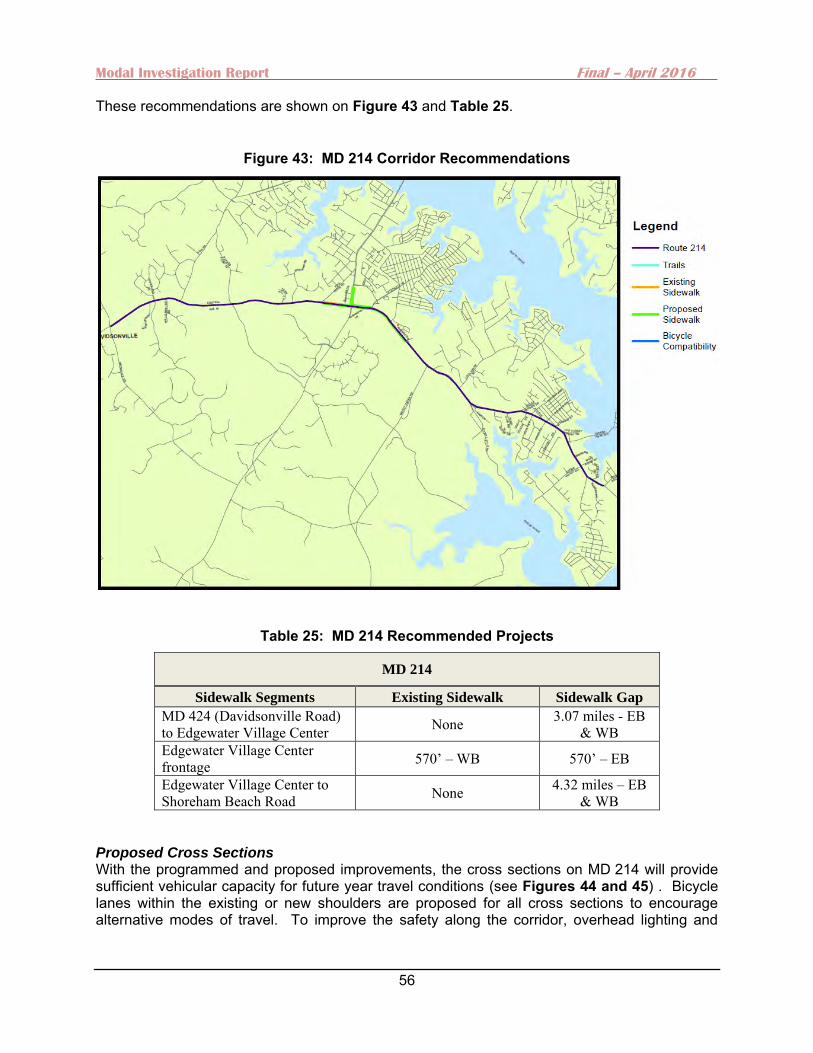
Modal Investigation Report Final – April 2016
56
These recommendations are shown on Figure 43 and Table 25.
Figure 43: MD 214 Corridor Recommendations
Table 25: MD 214 Recommended Projects
MD 214
Sidewalk Segments Existing Sidewalk Sidewalk Gap
MD 424 (Davidsonville Road) to Edgewater Village Center None 3.07 miles - EB
& WB Edgewater Village Center frontage 570’ – WB 570’ – EB
Edgewater Village Center to Shoreham Beach Road None 4.32 miles – EB
& WB Proposed Cross Sections With the programmed and proposed improvements, the cross sections on MD 214 will provide sufficient vehicular capacity for future year travel conditions (see Figures 44 and 45) . Bicycle lanes within the existing or new shoulders are proposed for all cross sections to encourage alternative modes of travel. To improve the safety along the corridor, overhead lighting and
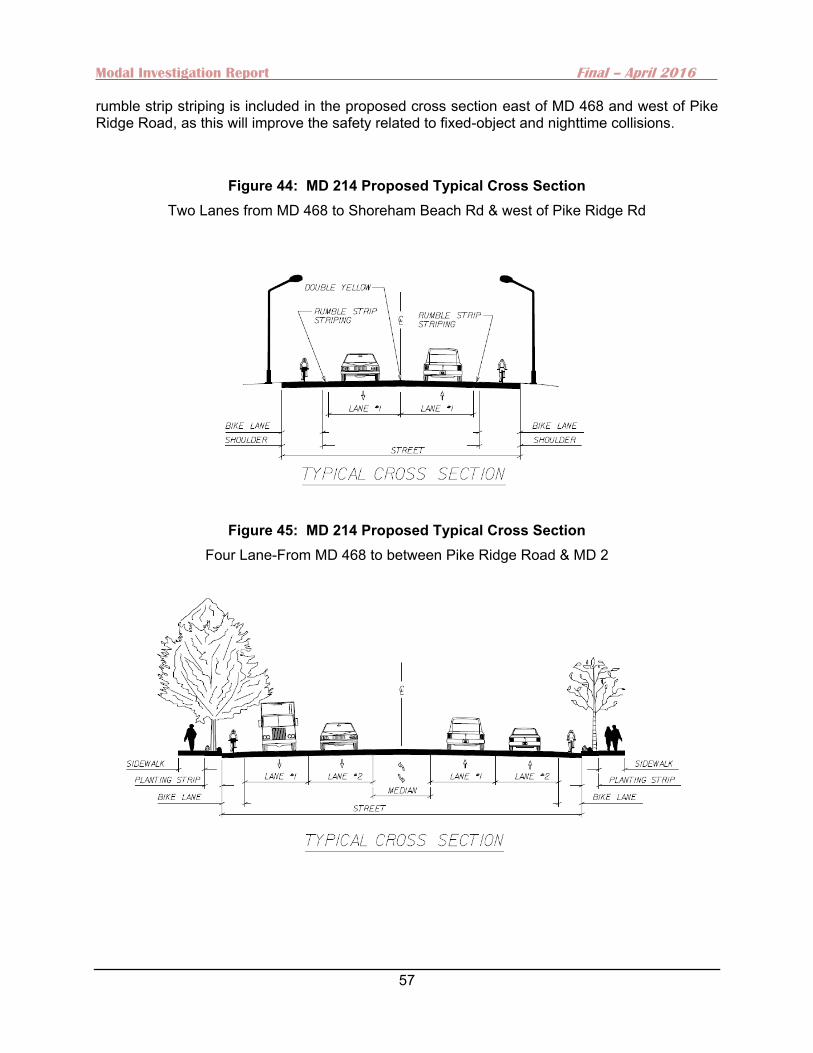
Modal Investigation Report Final – April 2016
57
rumble strip striping is included in the proposed cross section east of MD 468 and west of Pike Ridge Road, as this will improve the safety related to fixed-object and nighttime collisions.
Figure 44: MD 214 Proposed Typical Cross Section Two Lanes from MD 468 to Shoreham Beach Rd & west of Pike Ridge Rd
Figure 45: MD 214 Proposed Typical Cross Section Four Lane-From MD 468 to between Pike Ridge Road & MD 2

Modal Investigation Report Final – April 2016
58
2.6 MD 256/Deale Road & MD 468/Shady Side Road Corridor Level of Service The corridor LOS evaluation was conducted using the future year daily forecasts and the capacities for each link segment. This analysis was conducted to determine the proposed typical cross sections and to determine if additional roadway capacity would be needed in the future. The results of the corridor LOS illustrate that the existing roadway cross sections on MD 256 and MD 468 will provide sufficient capacity for future travel demand with all of the segments forecast to operate at LOS A (Figure 46).
Figure 46: Future MD 256 & MD 468 Corridor Level of Service
Intersection Level of Service There are currently two intersections in the corridor that are experiencing LOS E conditions during the PM peak hour; the intersection of MD 256 at MD 2, and MD 256 at MD 468 (see Table 26). These intersections would deteriorate to LOS F in the year 2035 without improvements. To maintain consistency with the existing conditions analysis, the existing signal timing information was used in the future conditions capacity analysis (Figure 47 illustrates failing intersection locations). Detailed HCM Reports are included in Appendix C.)
Rockhold Creek Rd MD 258
MD 256 MD 256
V/C 0.20 V/C 0.14 V/C 0.14 V/C 0.49
3956 2881 2881 9730
LOS A LOS A LOS A LOS A
MD 2 Franklin Gibson Rd
Forecast Volume MD 468
MD 256 MD 468
V/C 0.49 V/C 0.68 V/C 0.53 V/C 0.60 V/C 0.60
9730 13588 10531 12026 12026
LOS A LOS A LOS A LOS A LOS A
Franklin Manor Rd Columbia Beach Rd Snug Harbor Rd
Match
line

Modal Investigation Report Final – April 2016
59
Table 26: MD 256 & MD 468 Future 2035 Level of Service
Study Intersections
Summary of Results
Future LOS Future Delay (seconds per
vehicle)
Future v/c
AM PM AM PM AM PM
MD 256 at MD 2* C F 21.9 60.2 0.20 0.75
MD 256 at MD 258 A A 2.9 6.7 0.59 0.81
MD 256 at Franklin Manor Road A D 8.8 35.6 0.44 1.24
MD 256 at MD 468 F F 97.2 96.8 0.67 0.74
Note: * The stop approach delay reported for LOS for these intersections
Detailed results of the operational analysis were used to determine the movements with the poorest LOS for poorly performing intersections. For the MD 256 at MD 2 intersection, the movements with the poorest LOS would be:
LOS F conditions on the unsignalized westbound MD 256 approach
The movement that contributes to the LOS F conditions at the intersection of MD 256 at MD 468 would be:
LOS F conditions on the northbound MD 256 movement
Figure 47: Future MD 256 & MD 468 Level of Service
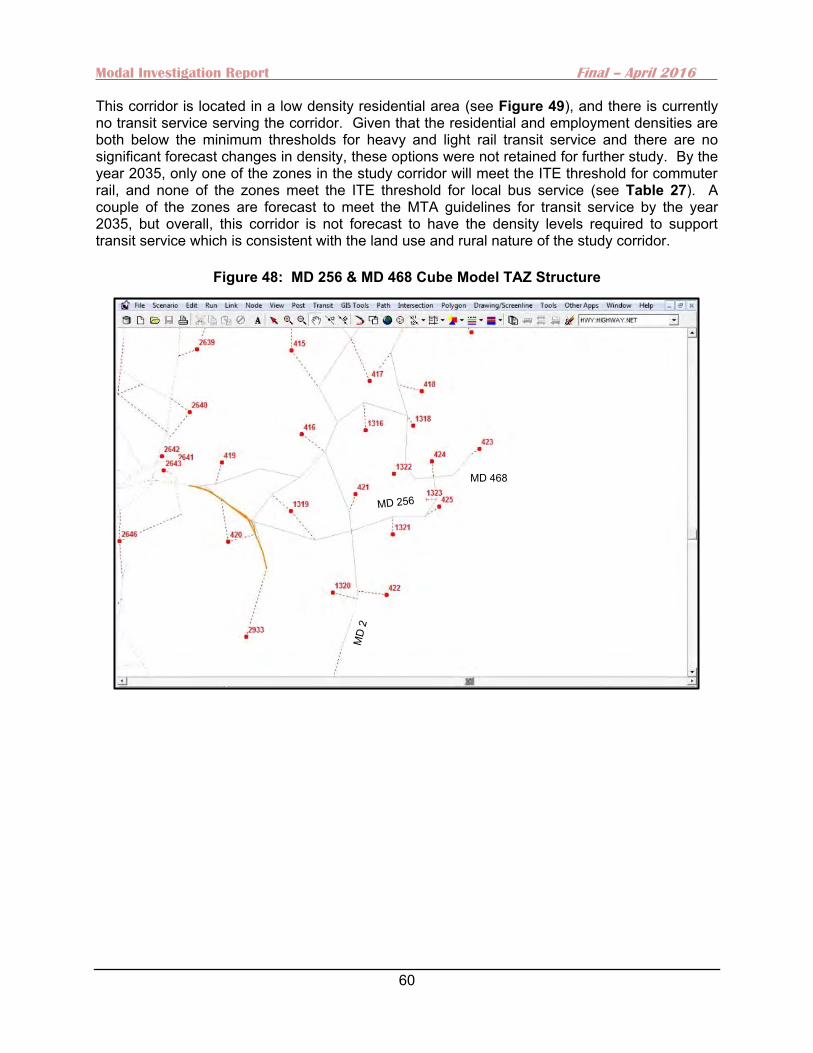
Modal Investigation Report Final – April 2016
60
This corridor is located in a low density residential area (see Figure 49), and there is currently no transit service serving the corridor. Given that the residential and employment densities are both below the minimum thresholds for heavy and light rail transit service and there are no significant forecast changes in density, these options were not retained for further study. By the year 2035, only one of the zones in the study corridor will meet the ITE threshold for commuter rail, and none of the zones meet the ITE threshold for local bus service (see Table 27). A couple of the zones are forecast to meet the MTA guidelines for transit service by the year 2035, but overall, this corridor is not forecast to have the density levels required to support transit service which is consistent with the land use and rural nature of the study corridor.
Figure 48: MD 256 & MD 468 Cube Model TAZ Structure
MD 468
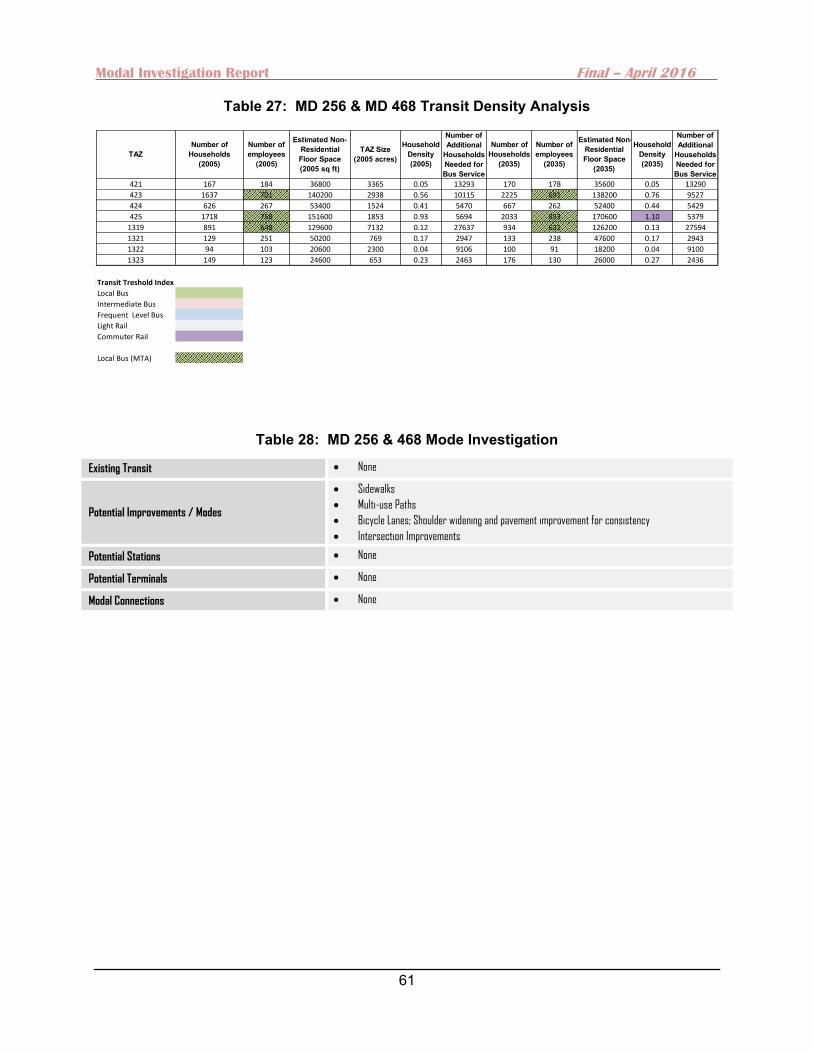
Modal Investigation Report Final – April 2016
61
Table 27: MD 256 & MD 468 Transit Density Analysis
Table 28: MD 256 & 468 Mode Investigation
Existing Transit None
Potential Improvements / Modes
Sidewalks
Multi-use Paths
Bicycle Lanes; Shoulder widening and pavement improvement for consistency
Intersection Improvements
Potential Stations None
Potential Terminals None
Modal Connections None
TAZNumber of
Households (2005)
Number of employees
(2005)
Estimated Non-Residential Floor Space (2005 sq ft)
TAZ Size (2005 acres)
Household Density (2005)
Number of Additional
Households Needed for Bus Service
Number of Households
(2035)
Number of employees
(2035)
Estimated Non-Residential Floor Space
(2035)
Household Density (2035)
Number of Additional
Households Needed for Bus Service
421 167 184 36800 3365 0.05 13293 170 178 35600 0.05 13290
423 1637 701 140200 2938 0.56 10115 2225 691 138200 0.76 9527
424 626 267 53400 1524 0.41 5470 667 262 52400 0.44 5429
425 1718 758 151600 1853 0.93 5694 2033 853 170600 1.10 5379
1319 891 648 129600 7132 0.12 27637 934 631 126200 0.13 27594
1321 129 251 50200 769 0.17 2947 133 238 47600 0.17 2943
1322 94 103 20600 2300 0.04 9106 100 91 18200 0.04 9100
1323 149 123 24600 653 0.23 2463 176 130 26000 0.27 2436
Transit Treshold Index
Local Bus
Intermediate Bus
Frequent Level Bus
Light Rail
Commuter Rail
Local Bus (MTA)
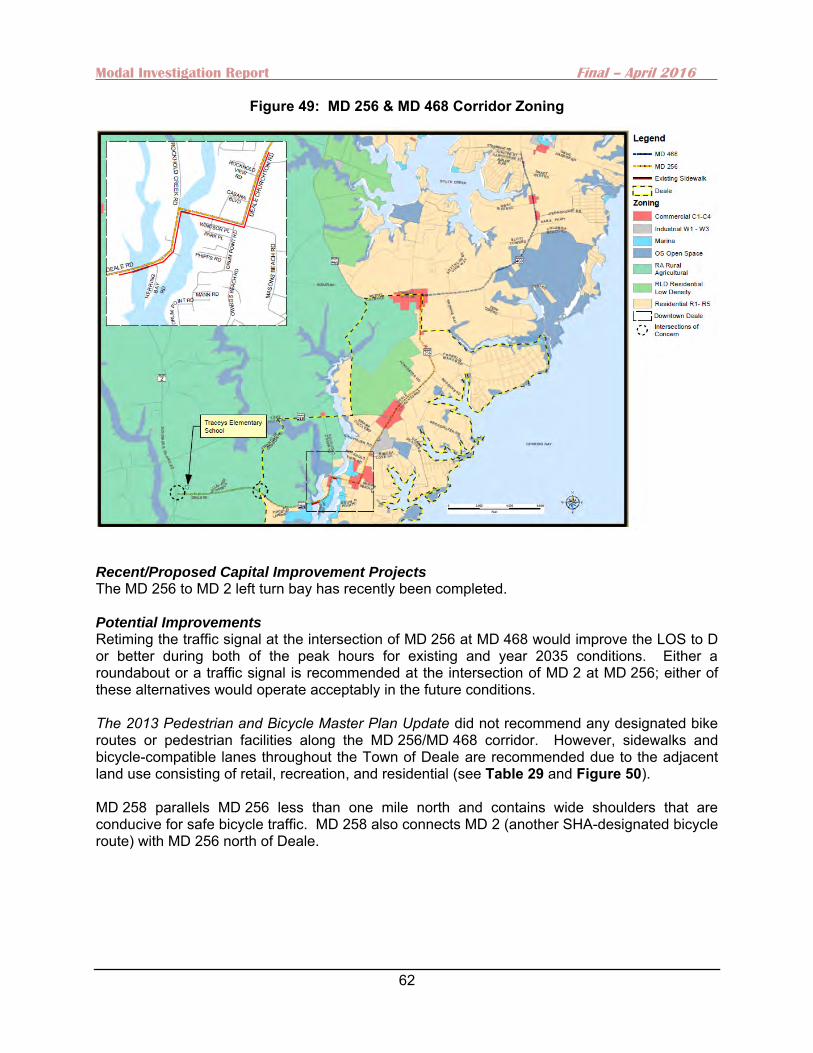
Modal Investigation Report Final – April 2016
62
Figure 49: MD 256 & MD 468 Corridor Zoning
Recent/Proposed Capital Improvement Projects The MD 256 to MD 2 left turn bay has recently been completed. Potential Improvements Retiming the traffic signal at the intersection of MD 256 at MD 468 would improve the LOS to D or better during both of the peak hours for existing and year 2035 conditions. Either a roundabout or a traffic signal is recommended at the intersection of MD 2 at MD 256; either of these alternatives would operate acceptably in the future conditions. The 2013 Pedestrian and Bicycle Master Plan Update did not recommend any designated bike routes or pedestrian facilities along the MD 256/MD 468 corridor. However, sidewalks and bicycle-compatible lanes throughout the Town of Deale are recommended due to the adjacent land use consisting of retail, recreation, and residential (see Table 29 and Figure 50). MD 258 parallels MD 256 less than one mile north and contains wide shoulders that are conducive for safe bicycle traffic. MD 258 also connects MD 2 (another SHA-designated bicycle route) with MD 256 north of Deale.
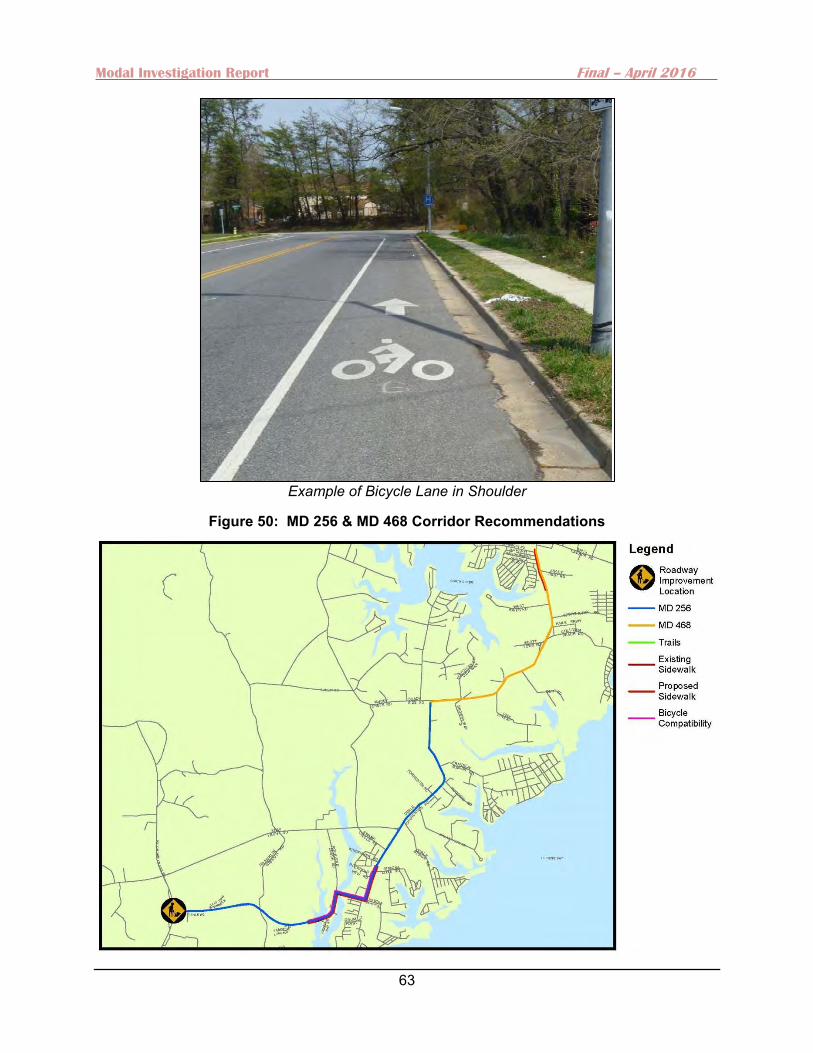
Modal Investigation Report Final – April 2016
63
Example of Bicycle Lane in Shoulder
Figure 50: MD 256 & MD 468 Corridor Recommendations
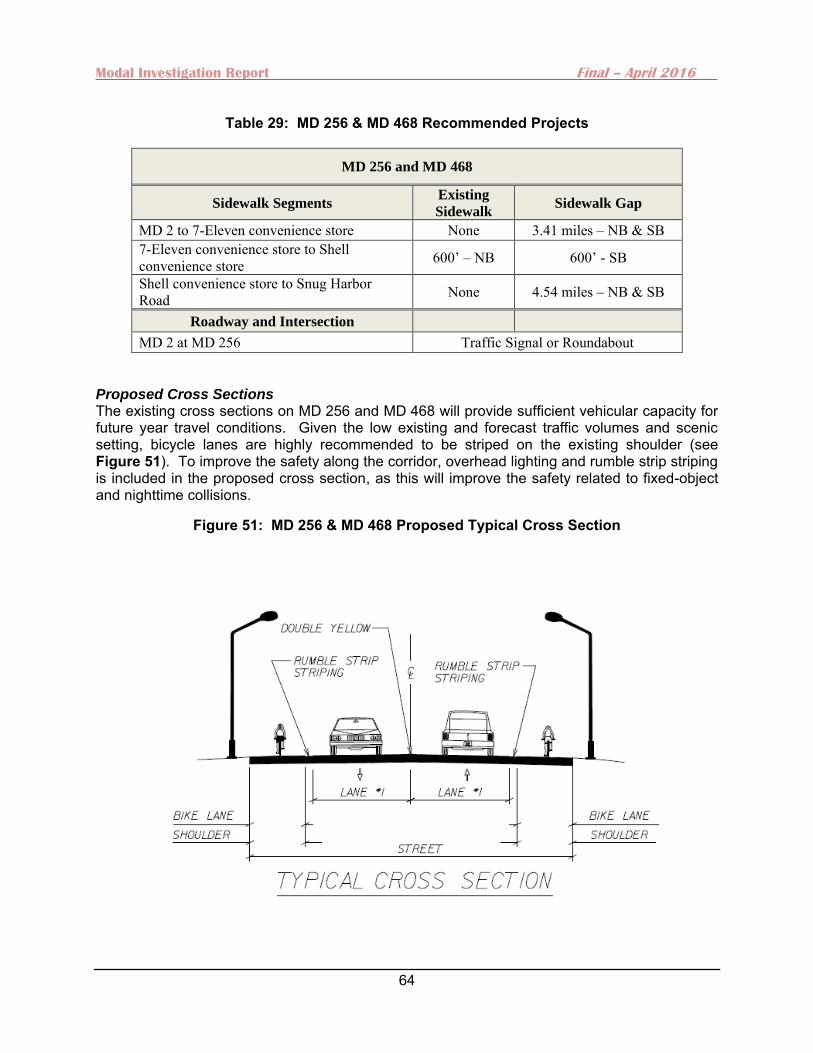
Modal Investigation Report Final – April 2016
64
Table 29: MD 256 & MD 468 Recommended Projects
MD 256 and MD 468
Sidewalk Segments Existing
Sidewalk Sidewalk Gap
MD 2 to 7-Eleven convenience store None 3.41 miles – NB & SB 7-Eleven convenience store to Shell convenience store 600’ – NB 600’ - SB
Shell convenience store to Snug Harbor Road None 4.54 miles – NB & SB
Roadway and Intersection
MD 2 at MD 256 Traffic Signal or Roundabout
Proposed Cross Sections The existing cross sections on MD 256 and MD 468 will provide sufficient vehicular capacity for future year travel conditions. Given the low existing and forecast traffic volumes and scenic setting, bicycle lanes are highly recommended to be striped on the existing shoulder (see Figure 51). To improve the safety along the corridor, overhead lighting and rumble strip striping is included in the proposed cross section, as this will improve the safety related to fixed-object and nighttime collisions.
Figure 51: MD 256 & MD 468 Proposed Typical Cross Section
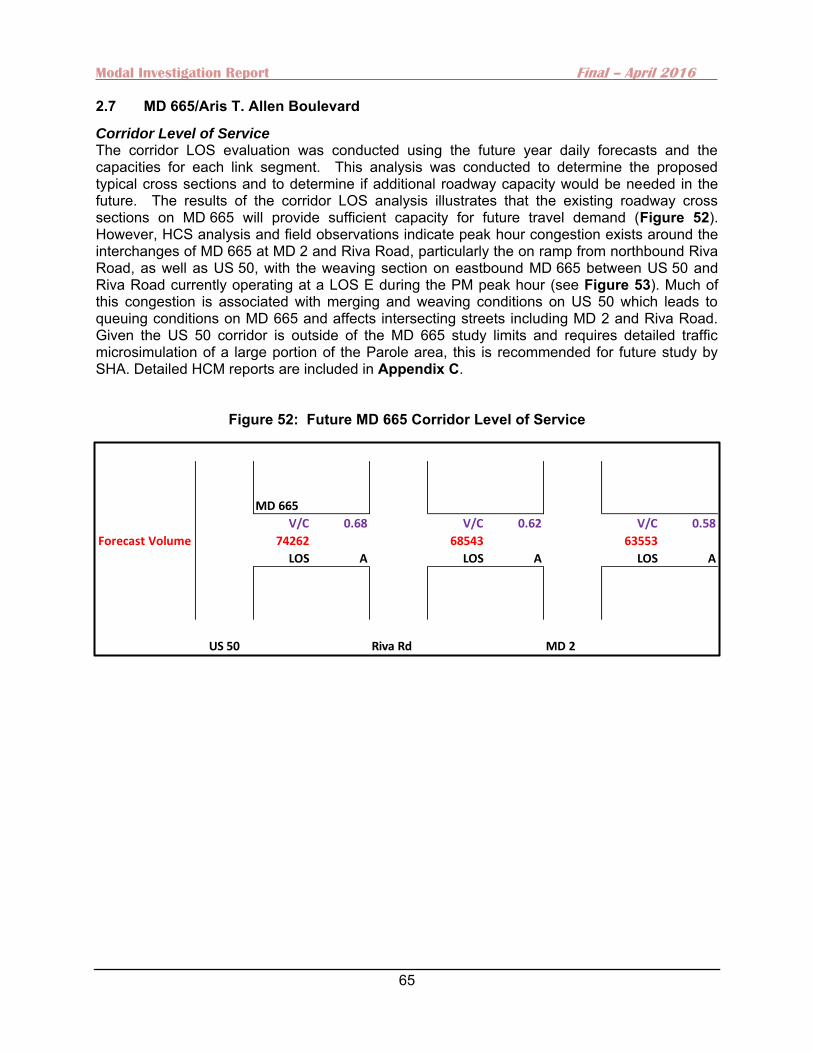
Modal Investigation Report Final – April 2016
65
2.7 MD 665/Aris T. Allen Boulevard
Corridor Level of Service The corridor LOS evaluation was conducted using the future year daily forecasts and the capacities for each link segment. This analysis was conducted to determine the proposed typical cross sections and to determine if additional roadway capacity would be needed in the future. The results of the corridor LOS analysis illustrates that the existing roadway cross sections on MD 665 will provide sufficient capacity for future travel demand (Figure 52). However, HCS analysis and field observations indicate peak hour congestion exists around the interchanges of MD 665 at MD 2 and Riva Road, particularly the on ramp from northbound Riva Road, as well as US 50, with the weaving section on eastbound MD 665 between US 50 and Riva Road currently operating at a LOS E during the PM peak hour (see Figure 53). Much of this congestion is associated with merging and weaving conditions on US 50 which leads to queuing conditions on MD 665 and affects intersecting streets including MD 2 and Riva Road. Given the US 50 corridor is outside of the MD 665 study limits and requires detailed traffic microsimulation of a large portion of the Parole area, this is recommended for future study by SHA. Detailed HCM reports are included in Appendix C.
Figure 52: Future MD 665 Corridor Level of Service
MD 665
V/C 0.68 V/C 0.62 V/C 0.58
Forecast Volume 74262 68543 63553
LOS A LOS A LOS A
US 50 Riva Rd MD 2
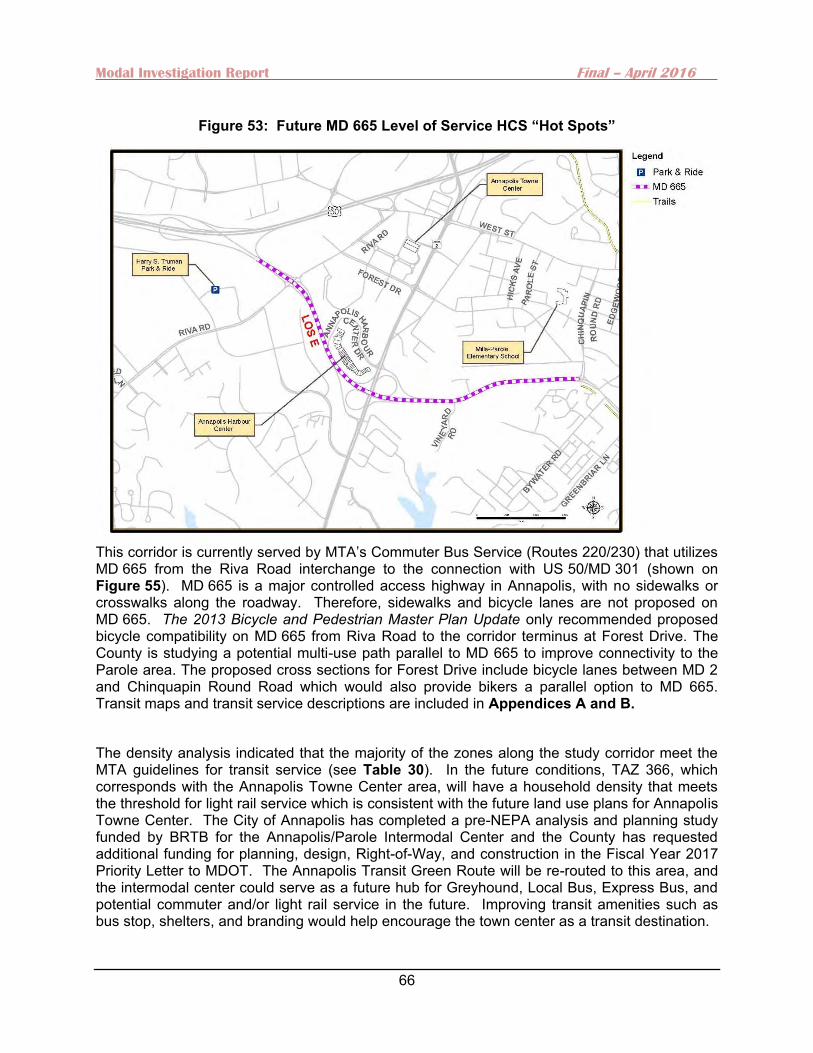
Modal Investigation Report Final – April 2016
66
Figure 53: Future MD 665 Level of Service HCS “Hot Spots”
This corridor is currently served by MTA’s Commuter Bus Service (Routes 220/230) that utilizes MD 665 from the Riva Road interchange to the connection with US 50/MD 301 (shown on Figure 55). MD 665 is a major controlled access highway in Annapolis, with no sidewalks or crosswalks along the roadway. Therefore, sidewalks and bicycle lanes are not proposed on MD 665. The 2013 Bicycle and Pedestrian Master Plan Update only recommended proposed bicycle compatibility on MD 665 from Riva Road to the corridor terminus at Forest Drive. The County is studying a potential multi-use path parallel to MD 665 to improve connectivity to the Parole area. The proposed cross sections for Forest Drive include bicycle lanes between MD 2 and Chinquapin Round Road which would also provide bikers a parallel option to MD 665. Transit maps and transit service descriptions are included in Appendices A and B.
The density analysis indicated that the majority of the zones along the study corridor meet the MTA guidelines for transit service (see Table 30). In the future conditions, TAZ 366, which corresponds with the Annapolis Towne Center area, will have a household density that meets the threshold for light rail service which is consistent with the future land use plans for Annapolis Towne Center. The City of Annapolis has completed a pre-NEPA analysis and planning study funded by BRTB for the Annapolis/Parole Intermodal Center and the County has requested additional funding for planning, design, Right-of-Way, and construction in the Fiscal Year 2017 Priority Letter to MDOT. The Annapolis Transit Green Route will be re-routed to this area, and the intermodal center could serve as a future hub for Greyhound, Local Bus, Express Bus, and potential commuter and/or light rail service in the future. Improving transit amenities such as bus stop, shelters, and branding would help encourage the town center as a transit destination.
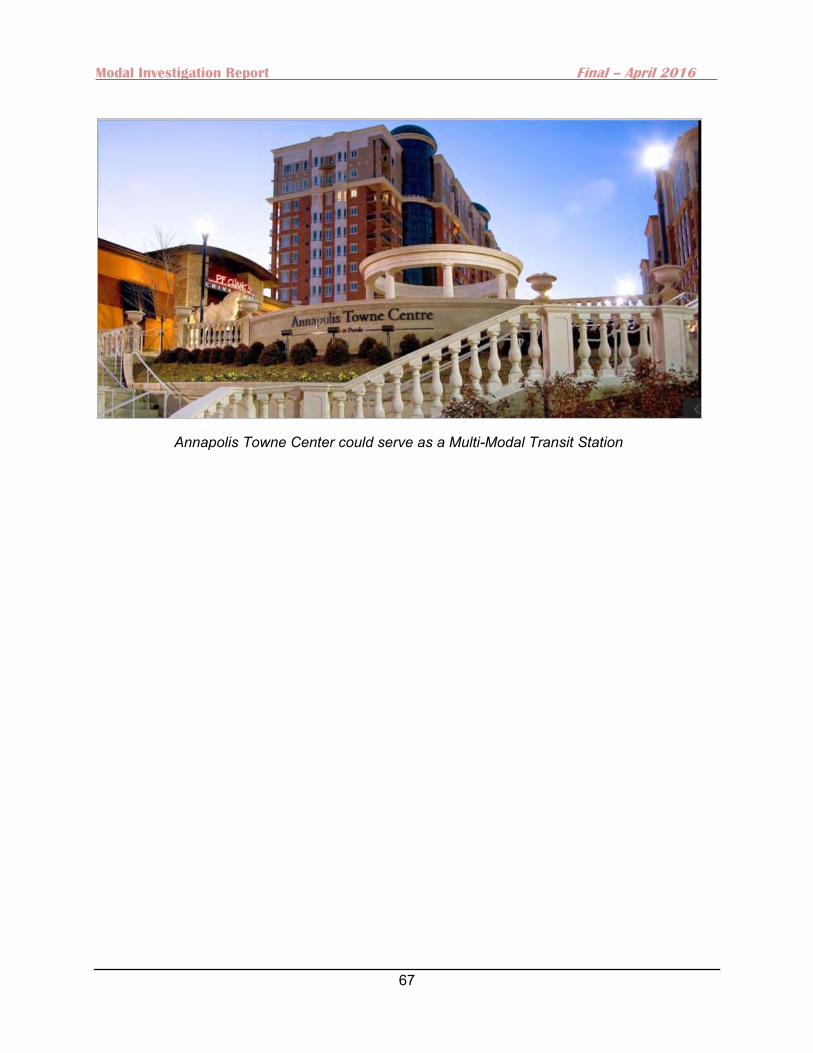
Modal Investigation Report Final – April 2016
67
Annapolis Towne Center could serve as a Multi-Modal Transit Station
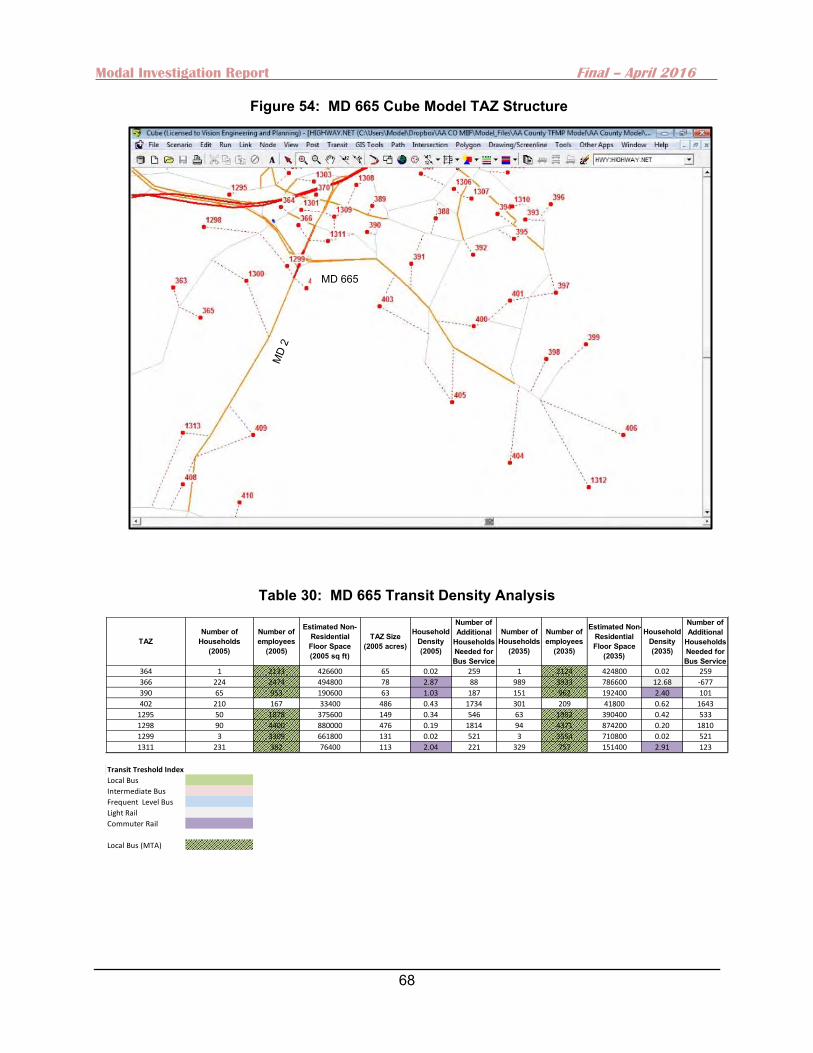
Modal Investigation Report Final – April 2016
68
Figure 54: MD 665 Cube Model TAZ Structure
Table 30: MD 665 Transit Density Analysis
MD 665
TAZNumber of
Households (2005)
Number of employees
(2005)
Estimated Non-Residential Floor Space (2005 sq ft)
TAZ Size (2005 acres)
Household Density (2005)
Number of Additional
Households Needed for Bus Service
Number of Households
(2035)
Number of employees
(2035)
Estimated Non-Residential Floor Space
(2035)
Household Density (2035)
Number of Additional
Households Needed for Bus Service
364 1 2133 426600 65 0.02 259 1 2124 424800 0.02 259
366 224 2474 494800 78 2.87 88 989 3933 786600 12.68 -677
390 65 953 190600 63 1.03 187 151 962 192400 2.40 101
402 210 167 33400 486 0.43 1734 301 209 41800 0.62 1643
1295 50 1878 375600 149 0.34 546 63 1952 390400 0.42 533
1298 90 4400 880000 476 0.19 1814 94 4371 874200 0.20 1810
1299 3 3309 661800 131 0.02 521 3 3554 710800 0.02 521
1311 231 382 76400 113 2.04 221 329 757 151400 2.91 123
Transit Treshold Index
Local Bus
Intermediate Bus
Frequent Level Bus
Light Rail
Commuter Rail
Local Bus (MTA)
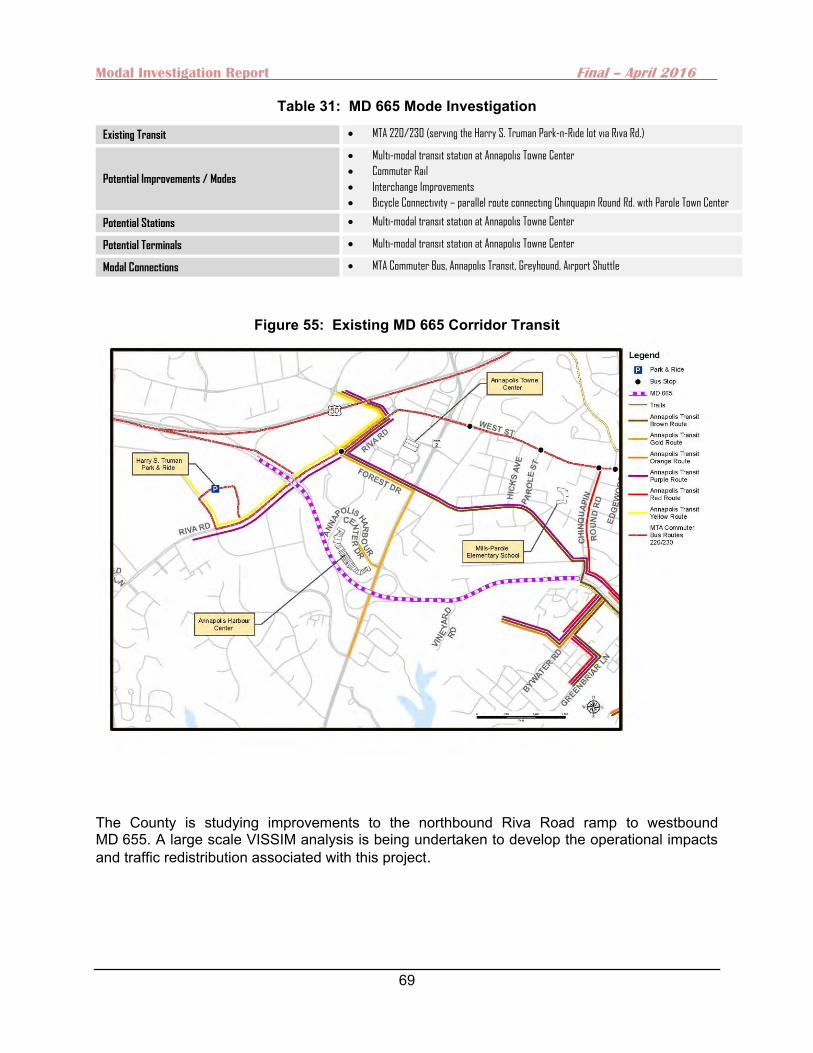
Modal Investigation Report Final – April 2016
69
Table 31: MD 665 Mode Investigation
Existing Transit MTA 220/230 (serving the Harry S. Truman Park-n-Ride lot via Riva Rd.)
Potential Improvements / Modes
Multi-modal transit station at Annapolis Towne Center
Commuter Rail
Interchange Improvements
Bicycle Connectivity – parallel route connecting Chinquapin Round Rd. with Parole Town Center
Potential Stations Multi-modal transit station at Annapolis Towne Center
Potential Terminals Multi-modal transit station at Annapolis Towne Center
Modal Connections MTA Commuter Bus, Annapolis Transit, Greyhound, Airport Shuttle
Figure 55: Existing MD 665 Corridor Transit
The County is studying improvements to the northbound Riva Road ramp to westbound MD 655. A large scale VISSIM analysis is being undertaken to develop the operational impacts and traffic redistribution associated with this project.
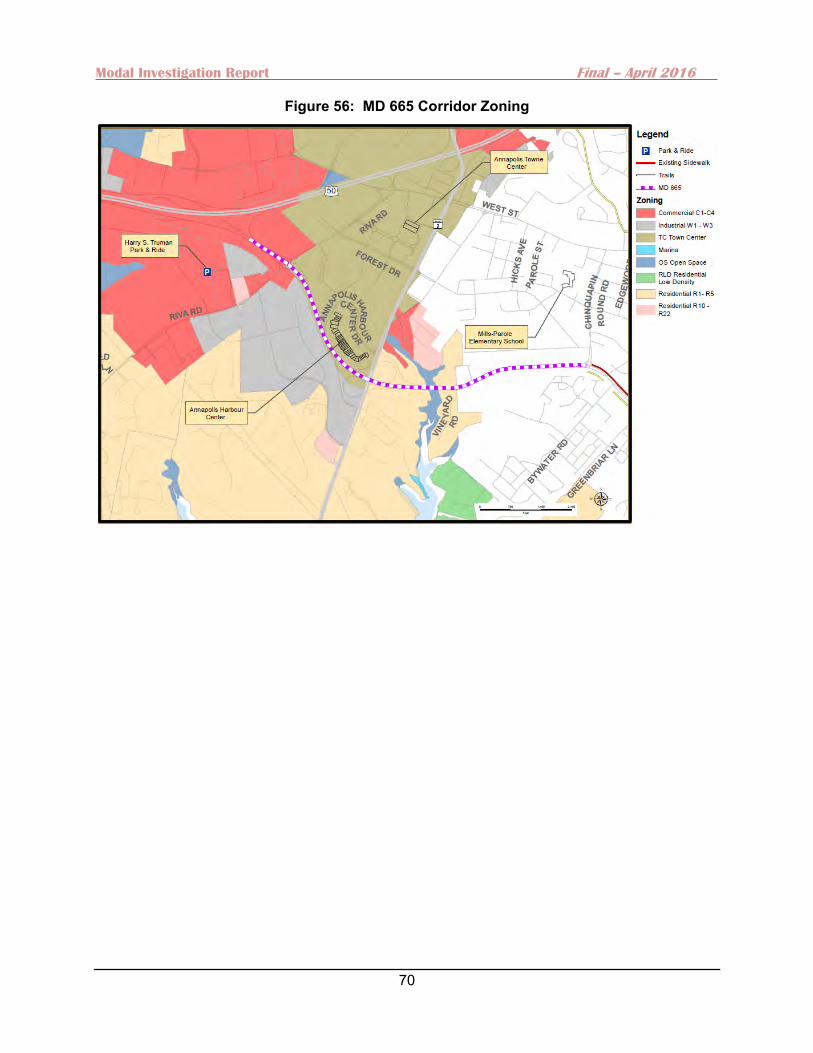
Modal Investigation Report Final – April 2016
70
Figure 56: MD 665 Corridor Zoning

Modal Investigation Report Final – April 2016
71
Proposed Cross Sections No new cross section is proposed. The existing cross section on MD 665 will provide sufficient vehicular capacity for future year travel conditions, and no changes are recommended to the typical existing cross section.
Figure 57: MD 665 Existing Typical Cross Section
2.8 Conclusion The County’s land use patterns represent a suburban jurisdiction located between the two major urban centers of Washington, D.C. and Baltimore, MD, with identified town centers (e.g. Glen Burnie, Odenton, Parole), activity centers (e.g. Arundel Mills, BWI airport), job centers (e.g. Ft. Meade/NSA), government centers (Annapolis), institutions, extended commercial districts along its major arterial highways, and low density residential uses in other areas. Previous transportation investments in both roadway and bus and rail transit have been made to support travel between those urban job centers and between major town, activity, and employment centers through the county. The Major Intersections/Important Facilities (MIIF) study corridors serve important functions in the county to provide direct access from peninsula areas of the county to major arterials and freeways such as US 50 and MD 2. The land use in the peninsula areas of the county is rural or low density residential in nature, but has some potential to support transit service. An additional important consideration with regards to providing transit service is household income. Household income is one of the leading predictors of transit ridership (particularly bus transit). As household income increases, the probability of transit usage declines independent of density. The exception to this is when other factors such as acute traffic congestion and/or high parking costs prevail, which is not the case for the MIIF study corridors. Given the household income of the study corridors are well above the U.S. median household income, this has to be considered when providing transit service, as lower ridership will increase the amount of subsidy required to pay for the transit service. This study reflects both current and future travel demand through, into, within, and out of the county, as well as the impact of roadway widening and introduction of other modes of travel in each of these corridors. In addition, as the MIIF study corridors tie into Corridor Growth
Modal Investigation Report Final – April 2016
72
Management Plan (CGMP) study corridors such as MD 2, US 50, and MD 100, the improvements and recommendations from those studies are incorporated into the MIIF recommendations. Overall, traffic signal timing optimization is a key mitigation strategy to maintaining and improving mobility in the study corridors. Given the low cost nature of traffic signal improvements, all signal controllers should be upgraded to 2070 controllers or the equivalent to allow for Advanced Traffic Management Systems (ATMS) to be implemented in the corridors. ATMS and improved vehicle detection and actuation schemes would improve both the peak and off peak travel times and delays in the study corridors. The impact of proposed roadway and/ or transit improvements on adjacent land uses in terms of density and activities, right-of-way availability, connectivity to existing transit/bicycle and pedestrian facilities, and supporting infrastructure (park & ride lots, transit stations) is considered and evaluated in both County and regional contexts.

Modal Investigation Report Final – April 2016
73
3. Summary of Forecasts During the analysis of the results of the No Build (E+C) and Roadway (CLRP) sensitivity runs, the following findings were derived:
The network coding for E+C and CLRP were the same for the seven study corridors. The year 2035 forecasts were statistically identical for the E+C and CLRP scenarios.
3.1 Summary of No Build and CLRP Level of Service The daily forecasts from the travel demand model were post processed to account for the differences between observed and simulated counts in the base year. The output from the NCHRP 765 process is refined daily link forecasts, which were used with existing K and D factors for the study corridors to develop peak hour year 2035 intersection forecasts for the study intersections. As in the existing conditions analysis, the roadway capacity analysis was performed using Highway Capacity Manual (HCM) Year 2000 procedures utilizing the Synchro 9 and VISSIM 7 traffic analysis software. Overall, “hot spots” were identified, which are locations with traffic operations that are projected at LOS E or F at study intersections. The majority of the intersections with poor LOS in the year 2035 are the same intersections which experience LOS E and F in the existing conditions. These locations include:
College Parkway and MD 2 College Parkway and Bay Dale Drive College Parkway and MD 179 Forest Drive at Chinquapin Round Road Forest Drive at Hilltop Lane Forest Drive at Spa Road Forest Drive at Bay Ridge Avenue MD 177 at Edwin Raynor Road MD 177 at MD 607 MD 177 at MD 100 MD 177 at Lake Shore Drive MD 177 at Catherine Avenue MD 177 at MD 10 on-ramp MD 177 at MD 10 off-ramp MD 214 at MD 468 MD 214 at MD 424 MD 256 at MD 2
As the list indicates, a number of intersections along the seven study corridors will experience failing conditions in the year 2035. However, re-timing the traffic signals mitigated the poor LOS at most of the intersections, and given that signal timing adjustments are quickly implemented in the field at a low cost, this should be a priority for the County Maintenance and Public Works Department. The remaining intersections would require additional turn lanes or other geometric improvements as documented.