Embed Size (px)
Citation preview
RESEARCH ARTICLES
Mode of Inheritance of Primary Metabolic Traits in Tomato W OA
Nicolas Schauer,a,1,2 Yaniv Semel,b,1 Ilse Balbo,a Matthias Steinfath,a,c Dirk Repsilber,a,d Joachim Selbig,a,c
Tzili Pleban,b Dani Zamir,b and Alisdair R. Ferniea,3
a Max-Planck Institute for Molecular Plant Physiology, 14476 Potsdam-Golm, Germanyb Institute of Plant Sciences and Genetics and Otto Warburg Centre for Biotechnology, Faculty of Agriculture, Hebrew University
of Jerusalem, Rehovot 76100, Israelc University of Potsdam, Institute for Biochemistry and Biology, Department of Bioinformatics, D-14476 Potsdam, Germanyd Research Institute of the Biology of Farm Animals, D-18196 Dummerstorf, Germany
To evaluate components of fruit metabolic composition, we have previously metabolically phenotyped tomato (Solanum
lycopersicum) introgression lines containing segmental substitutions of wild species chromosome in the genetic back-
ground of a cultivated variety. Here, we studied the hereditability of the fruit metabolome by analyzing an additional year’s
harvest and evaluating the metabolite profiles of lines heterozygous for the introgression (ILHs), allowing the evaluation of
putative quantitative trait locus (QTL) mode of inheritance. These studies revealed that most of the metabolic QTL (174 of
332) were dominantly inherited, with relatively high proportions of additively (61 of 332) or recessively (80 of 332) inherited
QTL and a negligible number displaying the characteristics of overdominant inheritance. Comparison of the mode of
inheritance of QTL revealed that several metabolite pairs displayed a similar mode of inheritance of QTL at the same
chromosomal loci. Evaluation of the association between morphological and metabolic traits in the ILHs revealed that this
correlation was far less prominent, due to a reduced variance in the harvest index within this population. These data are
discussed in the context of genomics-assisted breeding for crop improvement, with particular focus on the exploitation of
wide biodiversity.
INTRODUCTION
During the last decade, an impressive number of advances in
genetics and genomics have greatly enhanced our understand-
ing of the structural and functional aspects of plant genomes.
These advances have also given us ever more powerful tools to
aid in the identification of the genetic bases underlying pheno-
types identified in forward genetic screens (McCallum et al.,
2000; Jansen and Nap, 2001; Wesley et al., 2001; Alonso et al.,
2003; Borevitz et al., 2003; Varshney et al., 2005). The adoption of
quantitative trait locus (QTL) analysis of natural variation in
segregating populations has become an increasingly popular
approach (Frary et al., 2000; Paran and Zamir, 2003; Borevitz and
Chory, 2004; Koornneef et al., 2004; Ashikari et al., 2005; Salvi
and Tuberosa, 2005; Kusano et al., 2007).
Given the availability of a full genome sequence and a wide
range of genetic and analytic tools, Arabidopsis thaliana is firmly
established as a model system for quantitative genetics and
development (Meyerowitz, 2002; Somerville and Koornneef,
2002). It has furthermore proved a very successful choice for
unraveling the genetic factors underlying a range of important
biological processes, including, but not limited to, seed dor-
mancy and germination, flowering time variation, responses to
light quality variation and novel atmospheres, and biotic and
abiotic stress responses (for review, see Tonsor et al., 2005), as
well as in the evolution of gene function (Mitchell-Olds and
Schmitt, 2006). However, there are a large number of biological
and societal questions that cannot be directly addressed in
Arabidopsis, one of which is crop compositional quality, in
particular fruit quality. Here, we examine the hereditability of
metabolic traits that play an important role in tomato (Solanum
lycopersicum) fruit quality by examining the levels of >70
primary metabolites in two populations of tomato resulting
from an interspecific cross between S. lycopersicum and Sola-
num pennellii.
The improvement of crop species has been a fundamental
human pursuit since cultivation began. As a result of genetic
bottlenecks imposed during early domestication and modern
breeding activities, cultivated varieties contain only a fraction
of the variation present in the gene pool (McCouch, 2004;
Doebley, 2006; Fernie et al., 2006). Because wild ancestors of
most plants can still be found in their natural habitats or in
germplasm centers that have been established to collect and
conserve these resources (Tanksley and McCouch, 1997), the
utility of these wild ancestors in future breeding strategies will be
paramount. Current crop improvement strategies are focused
not only on the traditional areas of yield enhancement and
disease resistance but, driven by recent medical research, also
1 These authors contributed equally to this work.2 Current address: De Ruiter Seeds, Leeuwenhoekweg 52, 2661CZBergschenhoek, The Netherlands.3 Address correspondence to [email protected] author responsible for distribution of materials integral to thefindings presented in this article in accordance with the policy describedin the Instructions for Authors (www.plantcell.org) is: Alisdair R. Fernie([email protected]).W Online version contains Web-only data.OA Open Access articles can be viewed online without a subscription.www.plantcell.org/cgi/doi/10.1105/tpc.107.056523
The Plant Cell, Vol. 20: 509–523, March 2008, www.plantcell.org ª 2008 American Society of Plant Biologists
on crop compositional quality for human health (Fernie et al.,
2006; Harrigan et al., 2007a).
Genetic determinants of nutritional quality have long been
studied. However, it is only recently that these studies have
largely focused on single, or at most, a handful, of metabolites,
such as carotenoid content in tomato (Liu et al., 2003a), protein
content in maize (Zea mays) (Moose et al., 2004), starch content
in potato (Solanum tuberosum) and rice (Oryza sativa) (Fernie and
Willmitzer, 2004), and tocopherol levels in Arabidopsis (Gilliland
et al., 2006). Over the last few years, however, pathway-based
approaches have began to be adopted. Such studies have
included detailed dissection of the pathways of glucosinolate
biosynthesis (Heidel et al., 2006), seed oil synthesis (Hobbs et al.,
2004), and seed-soluble oligosaccharide metabolism (Bentsink
et al., 2000) in Arabidopsis as well as flavonoid biosynthesis in
Populus (Morreel et al., 2006). Furthermore, within the last year,
several studies have been performed at the metabolomic level in
Arabidopsis, tomato, and wheat (Triticum aestivum) (Keurentjes
et al., 2006; Schauer et al., 2006; Harrigan et al., 2007b; Meyer
et al., 2007).
The above-mentioned studies on Arabidopsis were based on
two independent recombinant inbred line populations and dem-
onstrated wide natural variation in both primary (Meyer et al.,
2007) and secondary (Keurentjes et al., 2006) metabolism. The
study focused on primary metabolites interestingly revealed a
metabolic signature related to biomass accumulation (Meyer
et al., 2007), whereas the study focused on secondary metab-
olites suggested that this approach has far greater potential for
dissecting the genetic control of biochemical pathways (and
even the structure of the pathways themselves) than has been
utilized to date (Keurentjes et al., 2006). These studies, however,
being focused on Arabidopsis, made no attempt to account for
the effects of environment on the metabolite content. Indeed,
very few studies concerned with broad metabolite profiling of
natural variance have considered this factor to date. One ex-
ception is the recent study of Harrigan et al. (2007b), who
evaluated the levels of a wide range of compositional traits,
including protein and oil content as well as fatty acid, amino acid,
and organic acid content, in two independent maize hybrids
grown at three separate locations.
As part of an ongoing project aimed at understanding the
genetic basis of compositional quality in the tomato fruit, we
previously demonstrated the presence of 889 QTL covering 74
metabolites in replicate harvests of interspecific (S. pennellii 3 S.
lycopersicum) introgression lines (ILs). Subsequent studies have
reported yet further QTL, both for the same metabolite (Stevens
et al., 2007) and for additional metabolites (Rousseaux et al.,
2005). However, it is important to note that despite finding many
QTL for enhanced metabolite content in the ILs, we observed
that the vast majority of cases in which metabolite content was
increased were associated with a yield penalty (Schauer et al.,
2006).
In this study, fruit metabolite levels were evaluated in an
additional year’s harvest, and the analysis was extended to lines
heterozygous for the introgression of chromosomal segments
from the S. pennellii genome. In doing so, it was possible to
evaluate both the stability and the hereditability of the QTL that
have been identified previously. Furthermore, we were able to
determine their mode of inheritance, a highly important charac-
teristic to study but one that has been overlooked in all but a
handful of metabolic studies (Dhaubhadel et al., 2003; O’Reilly-
Wapstra et al., 2005). We also evaluated the consequences of
mode of inheritance with respect to the breeding of specific
traits. Given that tomato has been demonstrated to be an ideal
system in which to explore the genetic basis of heterosis (Gur
and Zamir, 2004), the data set was evaluated to determine
whether there was any indication of heterosis at the metabolite
level. While there was little indication of heterosis at the me-
tabolite level, these studies revealed that the strong negative
association between yield and metabolite content we had char-
acterized previously in lines homozygous for the S. pennellii
introgressions (Schauer et al., 2006) was not apparent in lines
heterozygous for the introgressions. The combined results are
discussed within the context of the genetic regulation of primary
metabolism and their impact on discussions concerning ge-
nomics-assisted crop breeding.
RESULTS
Assessment of the Hereditability of Metabolite Traits by
Analysis of the Metabolite Profiles Obtained in Different
Harvests of the Interspecific ILs of Tomato
We previously reported 889 single-trait QTL for metabolite ac-
cumulation following a gas chromatography–mass spectrometry
(GC-MS)–based survey of a tomato IL population in which
marker-defined regions of the wild species S. pennellii were
replaced with homologous intervals of the cultivated variety S.
lycopersicum M82 (Eshed and Zamir, 1995). This study was
based on the evaluation of fruit pericarp material harvested from
two independent harvests (2001 and 2003).
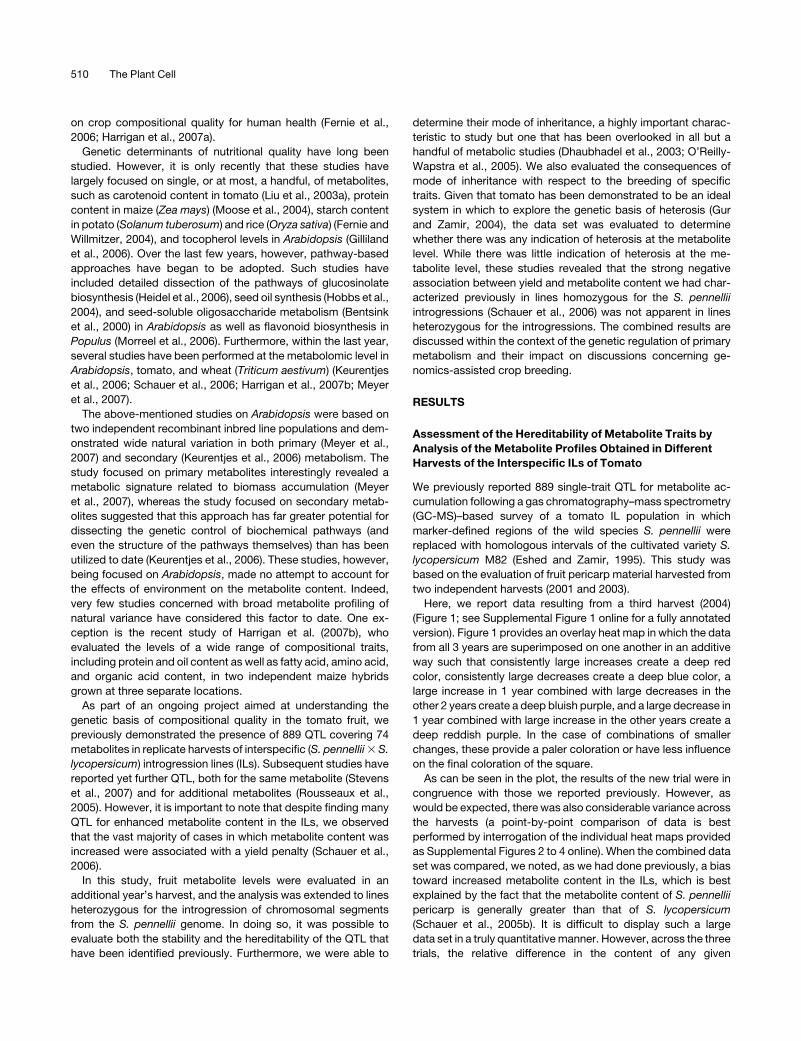
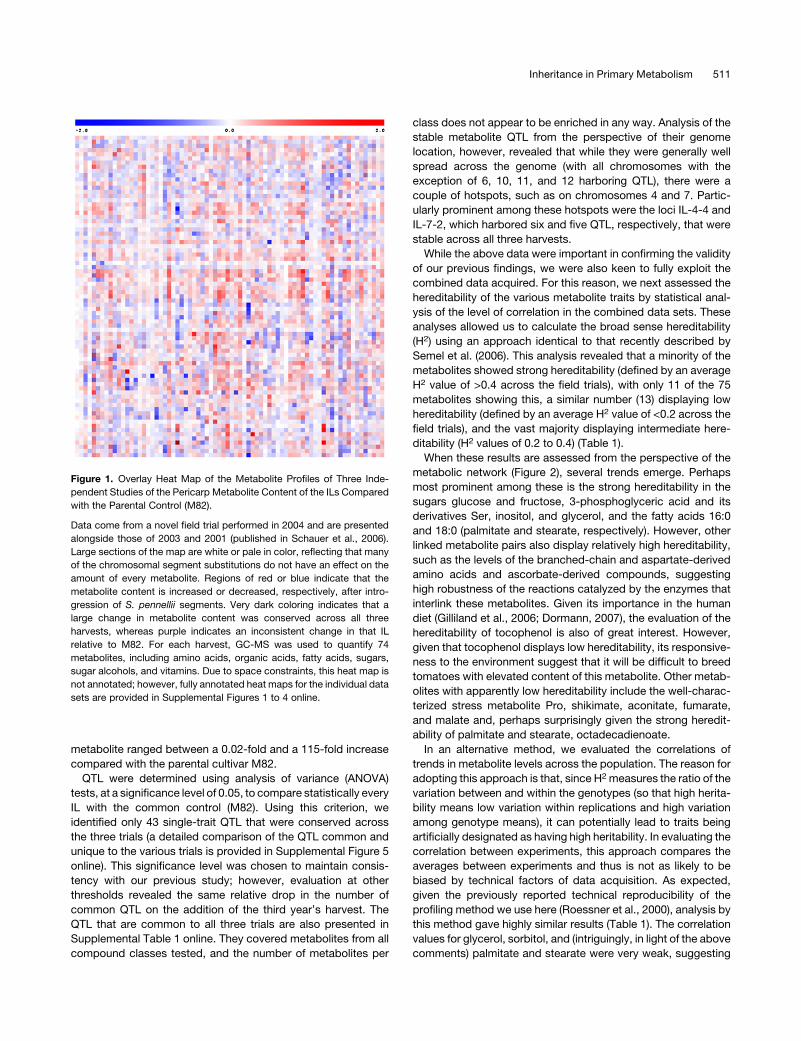
Here, we report data resulting from a third harvest (2004)
(Figure 1; see Supplemental Figure 1 online for a fully annotated
version). Figure 1 provides an overlay heat map in which the data
from all 3 years are superimposed on one another in an additive
way such that consistently large increases create a deep red
color, consistently large decreases create a deep blue color, a
large increase in 1 year combined with large decreases in the
other 2 years create a deep bluish purple, and a large decrease in
1 year combined with large increase in the other years create a
deep reddish purple. In the case of combinations of smaller
changes, these provide a paler coloration or have less influence
on the final coloration of the square.
As can be seen in the plot, the results of the new trial were in
congruence with those we reported previously. However, as
would be expected, there was also considerable variance across
the harvests (a point-by-point comparison of data is best
performed by interrogation of the individual heat maps provided
as Supplemental Figures 2 to 4 online). When the combined data
set was compared, we noted, as we had done previously, a bias
toward increased metabolite content in the ILs, which is best
explained by the fact that the metabolite content of S. pennellii
pericarp is generally greater than that of S. lycopersicum
(Schauer et al., 2005b). It is difficult to display such a large
data set in a truly quantitative manner. However, across the three
trials, the relative difference in the content of any given
510 The Plant Cell
metabolite ranged between a 0.02-fold and a 115-fold increase
compared with the parental cultivar M82.
QTL were determined using analysis of variance (ANOVA)
tests, at a significance level of 0.05, to compare statistically every
IL with the common control (M82). Using this criterion, we
identified only 43 single-trait QTL that were conserved across
the three trials (a detailed comparison of the QTL common and
unique to the various trials is provided in Supplemental Figure 5
online). This significance level was chosen to maintain consis-
tency with our previous study; however, evaluation at other
thresholds revealed the same relative drop in the number of
common QTL on the addition of the third year’s harvest. The
QTL that are common to all three trials are also presented in
Supplemental Table 1 online. They covered metabolites from all
compound classes tested, and the number of metabolites per
class does not appear to be enriched in any way. Analysis of the
stable metabolite QTL from the perspective of their genome
location, however, revealed that while they were generally well
spread across the genome (with all chromosomes with the
exception of 6, 10, 11, and 12 harboring QTL), there were a
couple of hotspots, such as on chromosomes 4 and 7. Partic-
ularly prominent among these hotspots were the loci IL-4-4 and
IL-7-2, which harbored six and five QTL, respectively, that were
stable across all three harvests.
While the above data were important in confirming the validity
of our previous findings, we were also keen to fully exploit the
combined data acquired. For this reason, we next assessed the
hereditability of the various metabolite traits by statistical anal-
ysis of the level of correlation in the combined data sets. These
analyses allowed us to calculate the broad sense hereditability
(H2) using an approach identical to that recently described by
Semel et al. (2006). This analysis revealed that a minority of the
metabolites showed strong hereditability (defined by an average
H2 value of >0.4 across the field trials), with only 11 of the 75
metabolites showing this, a similar number (13) displaying low
hereditability (defined by an average H2 value of <0.2 across the
field trials), and the vast majority displaying intermediate here-
ditability (H2 values of 0.2 to 0.4) (Table 1).
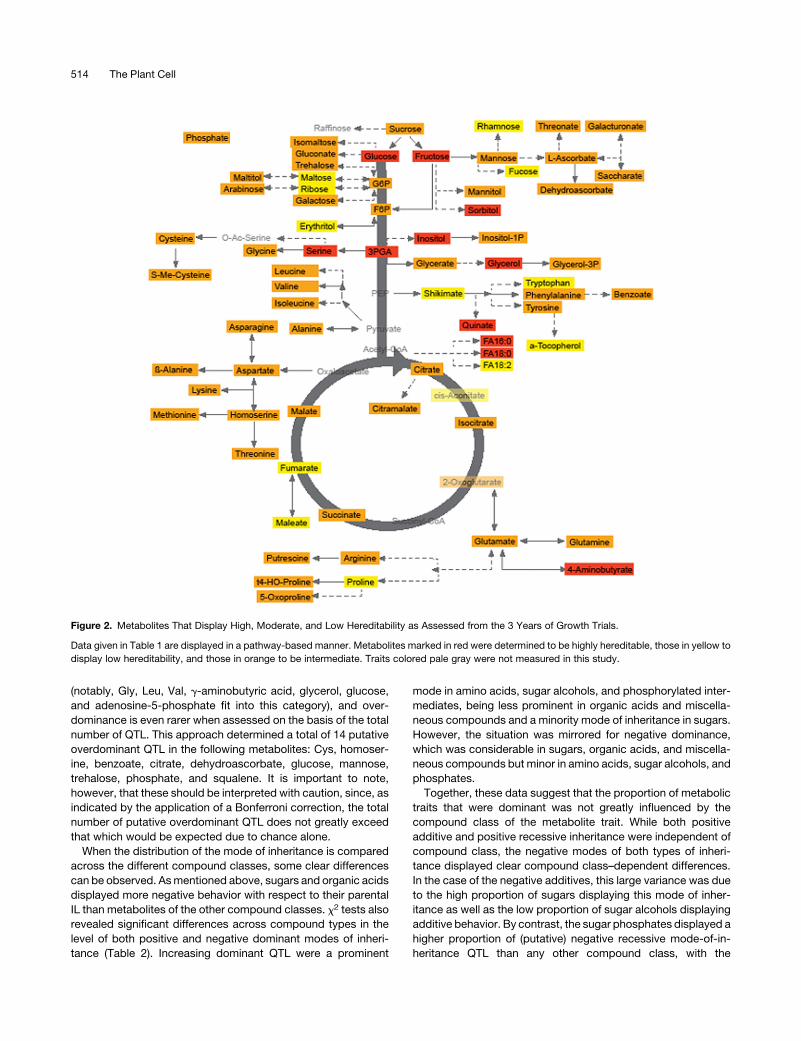
When these results are assessed from the perspective of the
metabolic network (Figure 2), several trends emerge. Perhaps
most prominent among these is the strong hereditability in the
sugars glucose and fructose, 3-phosphoglyceric acid and its
derivatives Ser, inositol, and glycerol, and the fatty acids 16:0
and 18:0 (palmitate and stearate, respectively). However, other
linked metabolite pairs also display relatively high hereditability,
such as the levels of the branched-chain and aspartate-derived
amino acids and ascorbate-derived compounds, suggesting
high robustness of the reactions catalyzed by the enzymes that
interlink these metabolites. Given its importance in the human
diet (Gilliland et al., 2006; Dormann, 2007), the evaluation of the
hereditability of tocophenol is also of great interest. However,
given that tocophenol displays low hereditability, its responsive-
ness to the environment suggest that it will be difficult to breed
tomatoes with elevated content of this metabolite. Other metab-
olites with apparently low hereditability include the well-charac-
terized stress metabolite Pro, shikimate, aconitate, fumarate,
and malate and, perhaps surprisingly given the strong heredit-
ability of palmitate and stearate, octadecadienoate.
In an alternative method, we evaluated the correlations of
trends in metabolite levels across the population. The reason for
adopting this approach is that, since H2 measures the ratio of the
variation between and within the genotypes (so that high herita-
bility means low variation within replications and high variation
among genotype means), it can potentially lead to traits being
artificially designated as having high heritability. In evaluating the
correlation between experiments, this approach compares the
averages between experiments and thus is not as likely to be
biased by technical factors of data acquisition. As expected,
given the previously reported technical reproducibility of the
profiling method we use here (Roessner et al., 2000), analysis by
this method gave highly similar results (Table 1). The correlation
values for glycerol, sorbitol, and (intriguingly, in light of the above
comments) palmitate and stearate were very weak, suggesting
Figure 1. Overlay Heat Map of the Metabolite Profiles of Three Inde-
pendent Studies of the Pericarp Metabolite Content of the ILs Compared
with the Parental Control (M82).
Data come from a novel field trial performed in 2004 and are presented
alongside those of 2003 and 2001 (published in Schauer et al., 2006).
Large sections of the map are white or pale in color, reflecting that many
of the chromosomal segment substitutions do not have an effect on the
amount of every metabolite. Regions of red or blue indicate that the
metabolite content is increased or decreased, respectively, after intro-
gression of S. pennellii segments. Very dark coloring indicates that a
large change in metabolite content was conserved across all three
harvests, whereas purple indicates an inconsistent change in that IL
relative to M82. For each harvest, GC-MS was used to quantify 74
metabolites, including amino acids, organic acids, fatty acids, sugars,
sugar alcohols, and vitamins. Due to space constraints, this heat map is
not annotated; however, fully annotated heat maps for the individual data
sets are provided in Supplemental Figures 1 to 4 online.
Inheritance in Primary Metabolism 511
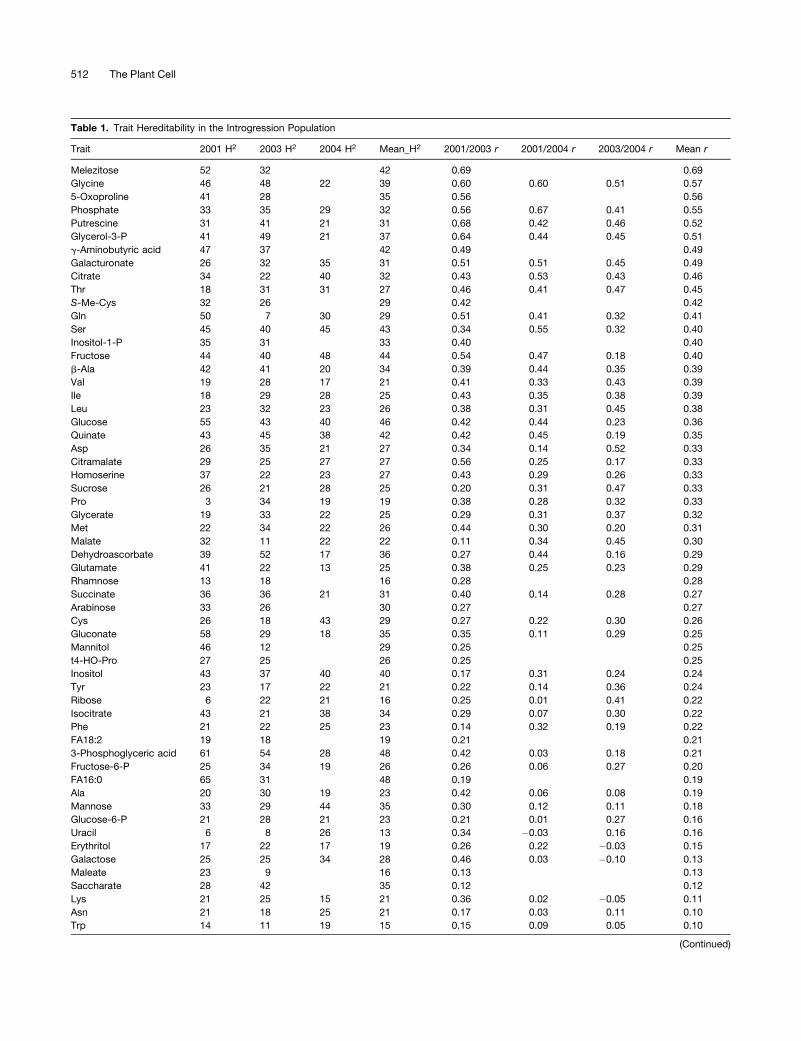
Table 1. Trait Hereditability in the Introgression Population
Trait 2001 H2 2003 H2 2004 H2 Mean_H2 2001/2003 r 2001/2004 r 2003/2004 r Mean r
Melezitose 52 32 42 0.69 0.69
Glycine 46 48 22 39 0.60 0.60 0.51 0.57
5-Oxoproline 41 28 35 0.56 0.56
Phosphate 33 35 29 32 0.56 0.67 0.41 0.55
Putrescine 31 41 21 31 0.68 0.42 0.46 0.52
Glycerol-3-P 41 49 21 37 0.64 0.44 0.45 0.51
g-Aminobutyric acid 47 37 42 0.49 0.49
Galacturonate 26 32 35 31 0.51 0.51 0.45 0.49
Citrate 34 22 40 32 0.43 0.53 0.43 0.46
Thr 18 31 31 27 0.46 0.41 0.47 0.45
S-Me-Cys 32 26 29 0.42 0.42
Gln 50 7 30 29 0.51 0.41 0.32 0.41
Ser 45 40 45 43 0.34 0.55 0.32 0.40
Inositol-1-P 35 31 33 0.40 0.40
Fructose 44 40 48 44 0.54 0.47 0.18 0.40
b-Ala 42 41 20 34 0.39 0.44 0.35 0.39
Val 19 28 17 21 0.41 0.33 0.43 0.39
Ile 18 29 28 25 0.43 0.35 0.38 0.39
Leu 23 32 23 26 0.38 0.31 0.45 0.38
Glucose 55 43 40 46 0.42 0.44 0.23 0.36
Quinate 43 45 38 42 0.42 0.45 0.19 0.35
Asp 26 35 21 27 0.34 0.14 0.52 0.33
Citramalate 29 25 27 27 0.56 0.25 0.17 0.33
Homoserine 37 22 23 27 0.43 0.29 0.26 0.33
Sucrose 26 21 28 25 0.20 0.31 0.47 0.33
Pro 3 34 19 19 0.38 0.28 0.32 0.33
Glycerate 19 33 22 25 0.29 0.31 0.37 0.32
Met 22 34 22 26 0.44 0.30 0.20 0.31
Malate 32 11 22 22 0.11 0.34 0.45 0.30
Dehydroascorbate 39 52 17 36 0.27 0.44 0.16 0.29
Glutamate 41 22 13 25 0.38 0.25 0.23 0.29
Rhamnose 13 18 16 0.28 0.28
Succinate 36 36 21 31 0.40 0.14 0.28 0.27
Arabinose 33 26 30 0.27 0.27
Cys 26 18 43 29 0.27 0.22 0.30 0.26
Gluconate 58 29 18 35 0.35 0.11 0.29 0.25
Mannitol 46 12 29 0.25 0.25
t4-HO-Pro 27 25 26 0.25 0.25
Inositol 43 37 40 40 0.17 0.31 0.24 0.24
Tyr 23 17 22 21 0.22 0.14 0.36 0.24
Ribose 6 22 21 16 0.25 0.01 0.41 0.22
Isocitrate 43 21 38 34 0.29 0.07 0.30 0.22
Phe 21 22 25 23 0.14 0.32 0.19 0.22
FA18:2 19 18 19 0.21 0.21
3-Phosphoglyceric acid 61 54 28 48 0.42 0.03 0.18 0.21
Fructose-6-P 25 34 19 26 0.26 0.06 0.27 0.20
FA16:0 65 31 48 0.19 0.19
Ala 20 30 19 23 0.42 0.06 0.08 0.19
Mannose 33 29 44 35 0.30 0.12 0.11 0.18
Glucose-6-P 21 28 21 23 0.21 0.01 0.27 0.16
Uracil 6 8 26 13 0.34 �0.03 0.16 0.16
Erythritol 17 22 17 19 0.26 0.22 �0.03 0.15
Galactose 25 25 34 28 0.46 0.03 �0.10 0.13
Maleate 23 9 16 0.13 0.13
Saccharate 28 42 35 0.12 0.12
Lys 21 25 15 21 0.36 0.02 �0.05 0.11
Asn 21 18 25 21 0.17 0.03 0.11 0.10
Trp 14 11 19 15 0.15 0.09 0.05 0.10
(Continued)
512 The Plant Cell
that caution should be taken with respect to their annotations as
highly hereditable. By contrast, correlation analysis of the me-
tabolites that were identified by H2 to be poorly hereditable
served to confirm these diagnoses.
Analysis of Metabolite Contents in a Population
Heterozygous for the S. pennellii Introgression
Given that the previous experiments highlighted the important
genetic influence underlying the majority of the metabolite QTL,
we next analyzed the metabolite content of the fruit pericarp in
the standard 76 homozygous IL lines and in hybrids between ILs
and M82 (ILHs; described in Semel et al., 2006) using material
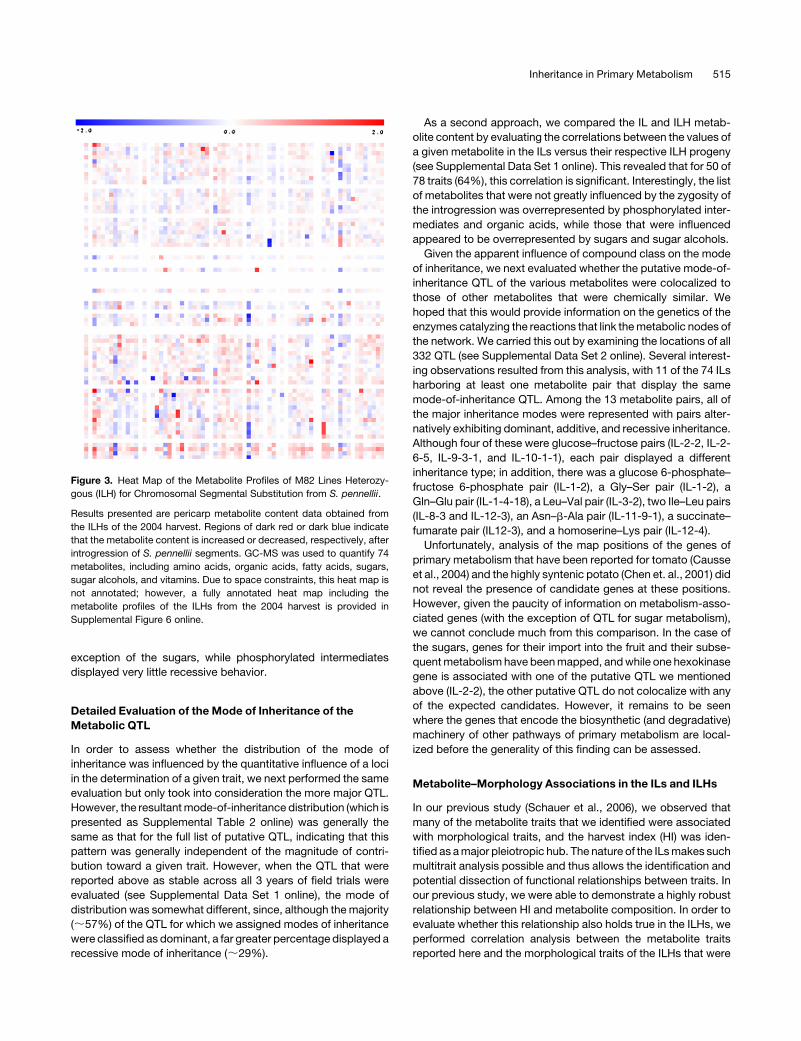
from the same harvest. A heat map of the metabolite profiling
results of the ILHs is presented in Figure 3 (with the full data sets
available in Supplemental Figures 1 to 4 online). At first glance at
the entire data set, it is clear that some of the changes in
metabolites are conserved in the ILs and ILHs, while others are
not. Moreover, there are clear quantitative differences in those
traits that are conserved. Some metabolites are present at
approximately the same level in the ILH as in its parent IL, others
are present at lower levels, and some are present at even higher
levels.
In order to assess whether these changes are associated with
a particular mode of inheritance, we subjected the combined
data set to a QTL analysis in which each IL and ILH was com-
pared with the common M82 control. If one of the lines had a
significant effect (at the 1% level), it was considered as harboring
a QTL. We chose a higher threshold here than in the previous
analyses for two reasons. First, given that we only had data from
a single harvest, it was appropriate to use a more stringent
threshold, and second, for the sake of comparison with the study
of Semel et al. (2006). Utilizing this approach, we resolved a total
of 332 putative QTL under these conditions of statistical strin-
gency. It is important to note that this is different from the number
of QTL presented above (and in Supplemental Figure 5 online),
since the current analysis is based on the 2004 data alone and
combines data obtained from both the IL and ILH populations.
Assessment of the Mode of Inheritance of the
Metabolic QTL
As well as allowing point-by-point analysis, the inclusion of ILHs
in the analysis enables us to classify each putative wild species
QTL into the following mode-of-inheritance categories: reces-
sive, additive, dominant, or overdominant (for detailed explana-
tion of the classification, see Semel et al. [2006]). In brief, this
classification reflects a mode of inheritance in which the S.
pennellii allele is compared with the M82 allele. For example, a
QTL classified as dominant means that both the IL (homozygous
for the S. pennellii allele) and the ILH (heterozygous) are very
similar to each other and significantly different from M82. A
recessive QTL is defined as one in which only the IL is signifi-
cantly different from the wild type, whereas the ILH is similar to
the wild type. Additivity reflects a situation in which the ILH is
between its parents, which are significantly different from each
other, and overdominance is inferred in situations in which the
ILH is significantly higher or lower than both its parents.
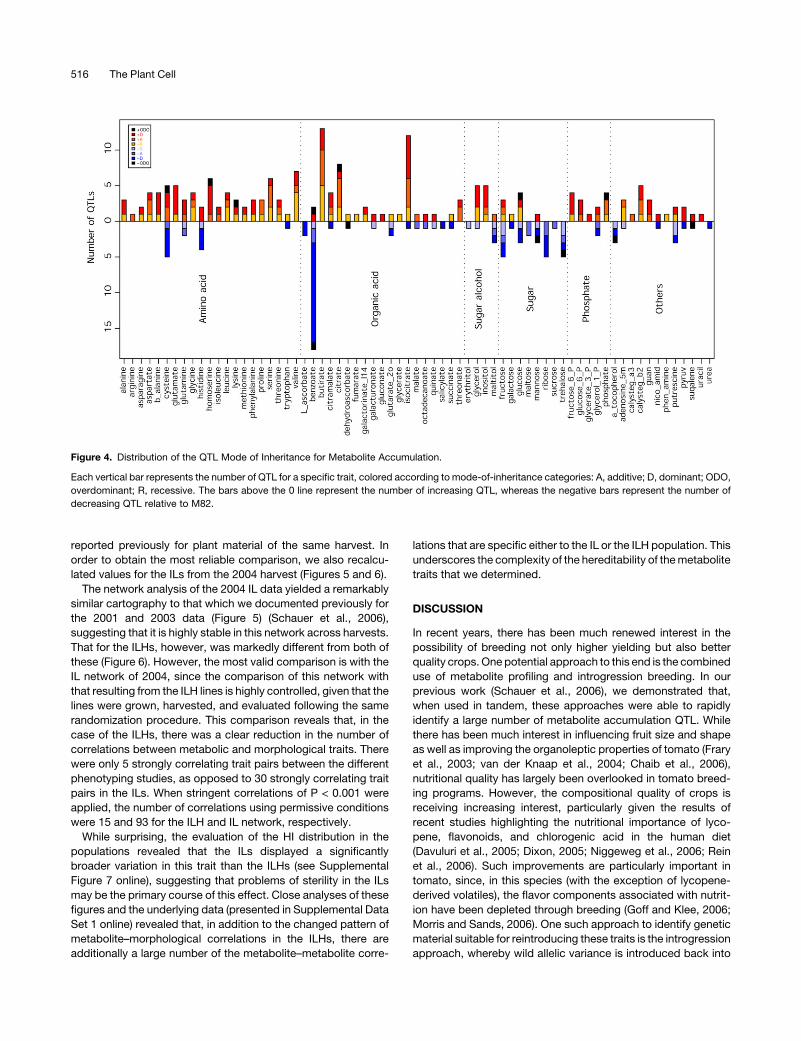
Evaluation of the results of this classification, presented in
Figure 4, reveals that the vast majority of the putative wild
species QTL have an increasing effect on metabolite content.
However, there are a number of clear exceptions to this state-
ment. The populations harbor slightly more decreasing than
increasing QTL for His and many more decreasing than increas-
ing QTL for benzoate, sugars, and a-tocopherol. When assessed
in this way, the majority of QTL can be seen to exhibit either
dominant or additive modes of inheritance. Only a minority of
metabolites exhibit a considerable proportion of recessive QTL
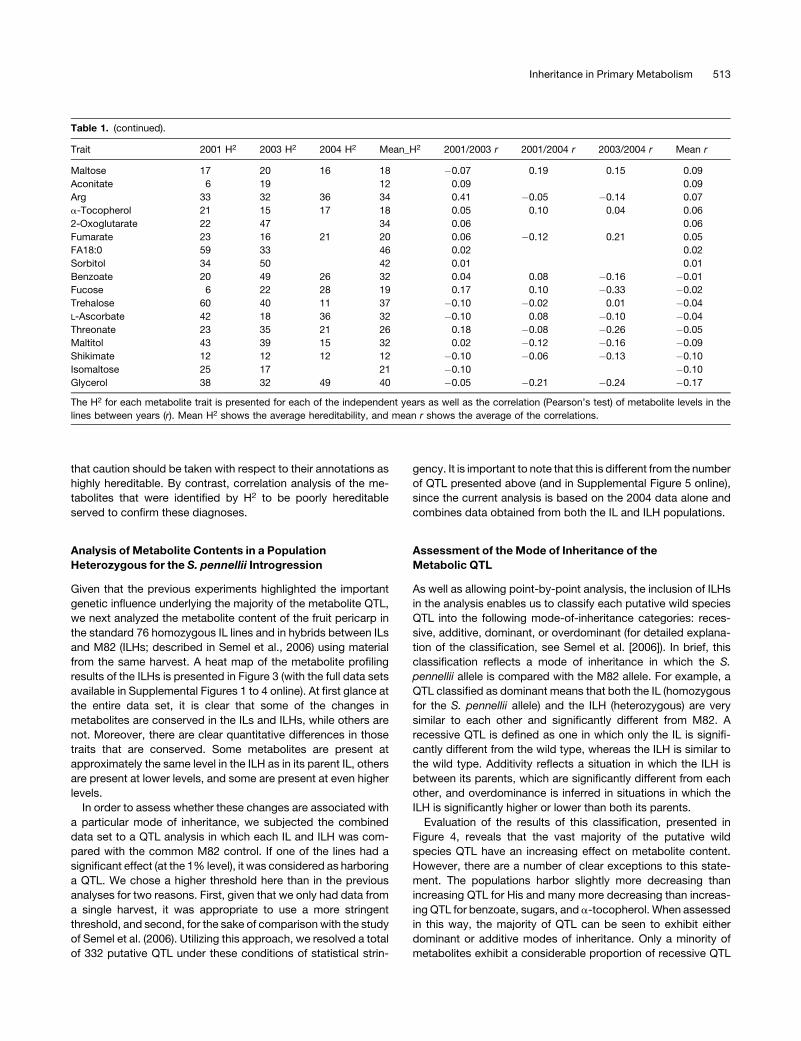
Table 1. (continued).
Trait 2001 H2 2003 H2 2004 H2 Mean_H2 2001/2003 r 2001/2004 r 2003/2004 r Mean r
Maltose 17 20 16 18 �0.07 0.19 0.15 0.09
Aconitate 6 19 12 0.09 0.09
Arg 33 32 36 34 0.41 �0.05 �0.14 0.07
a-Tocopherol 21 15 17 18 0.05 0.10 0.04 0.06
2-Oxoglutarate 22 47 34 0.06 0.06
Fumarate 23 16 21 20 0.06 �0.12 0.21 0.05
FA18:0 59 33 46 0.02 0.02
Sorbitol 34 50 42 0.01 0.01
Benzoate 20 49 26 32 0.04 0.08 �0.16 �0.01
Fucose 6 22 28 19 0.17 0.10 �0.33 �0.02
Trehalose 60 40 11 37 �0.10 �0.02 0.01 �0.04
L-Ascorbate 42 18 36 32 �0.10 0.08 �0.10 �0.04
Threonate 23 35 21 26 0.18 �0.08 �0.26 �0.05
Maltitol 43 39 15 32 0.02 �0.12 �0.16 �0.09
Shikimate 12 12 12 12 �0.10 �0.06 �0.13 �0.10
Isomaltose 25 17 21 �0.10 �0.10
Glycerol 38 32 49 40 �0.05 �0.21 �0.24 �0.17
The H2 for each metabolite trait is presented for each of the independent years as well as the correlation (Pearson’s test) of metabolite levels in the
lines between years (r). Mean H2 shows the average hereditability, and mean r shows the average of the correlations.
Inheritance in Primary Metabolism 513
(notably, Gly, Leu, Val, g-aminobutyric acid, glycerol, glucose,
and adenosine-5-phosphate fit into this category), and over-
dominance is even rarer when assessed on the basis of the total
number of QTL. This approach determined a total of 14 putative
overdominant QTL in the following metabolites: Cys, homoser-
ine, benzoate, citrate, dehydroascorbate, glucose, mannose,
trehalose, phosphate, and squalene. It is important to note,
however, that these should be interpreted with caution, since, as
indicated by the application of a Bonferroni correction, the total
number of putative overdominant QTL does not greatly exceed
that which would be expected due to chance alone.
When the distribution of the mode of inheritance is compared
across the different compound classes, some clear differences
can be observed. As mentioned above, sugars and organic acids
displayed more negative behavior with respect to their parental
IL than metabolites of the other compound classes. x2 tests also
revealed significant differences across compound types in the
level of both positive and negative dominant modes of inheri-
tance (Table 2). Increasing dominant QTL were a prominent
mode in amino acids, sugar alcohols, and phosphorylated inter-
mediates, being less prominent in organic acids and miscella-
neous compounds and a minority mode of inheritance in sugars.
However, the situation was mirrored for negative dominance,
which was considerable in sugars, organic acids, and miscella-
neous compounds but minor in amino acids, sugar alcohols, and
phosphates.
Together, these data suggest that the proportion of metabolic
traits that were dominant was not greatly influenced by the
compound class of the metabolite trait. While both positive
additive and positive recessive inheritance were independent of
compound class, the negative modes of both types of inheri-
tance displayed clear compound class–dependent differences.
In the case of the negative additives, this large variance was due
to the high proportion of sugars displaying this mode of inher-
itance as well as the low proportion of sugar alcohols displaying
additive behavior. By contrast, the sugar phosphates displayed a
higher proportion of (putative) negative recessive mode-of-in-
heritance QTL than any other compound class, with the
Figure 2. Metabolites That Display High, Moderate, and Low Hereditability as Assessed from the 3 Years of Growth Trials.
Data given in Table 1 are displayed in a pathway-based manner. Metabolites marked in red were determined to be highly hereditable, those in yellow to
display low hereditability, and those in orange to be intermediate. Traits colored pale gray were not measured in this study.
514 The Plant Cell
exception of the sugars, while phosphorylated intermediates
displayed very little recessive behavior.
Detailed Evaluation of the Mode of Inheritance of the
Metabolic QTL
In order to assess whether the distribution of the mode of
inheritance was influenced by the quantitative influence of a loci
in the determination of a given trait, we next performed the same
evaluation but only took into consideration the more major QTL.
However, the resultant mode-of-inheritance distribution (which is
presented as Supplemental Table 2 online) was generally the
same as that for the full list of putative QTL, indicating that this
pattern was generally independent of the magnitude of contri-
bution toward a given trait. However, when the QTL that were
reported above as stable across all 3 years of field trials were
evaluated (see Supplemental Data Set 1 online), the mode of
distribution was somewhat different, since, although the majority
(;57%) of the QTL for which we assigned modes of inheritance
were classified as dominant, a far greater percentage displayed a
recessive mode of inheritance (;29%).
As a second approach, we compared the IL and ILH metab-
olite content by evaluating the correlations between the values of
a given metabolite in the ILs versus their respective ILH progeny
(see Supplemental Data Set 1 online). This revealed that for 50 of
78 traits (64%), this correlation is significant. Interestingly, the list
of metabolites that were not greatly influenced by the zygosity of
the introgression was overrepresented by phosphorylated inter-
mediates and organic acids, while those that were influenced
appeared to be overrepresented by sugars and sugar alcohols.
Given the apparent influence of compound class on the mode
of inheritance, we next evaluated whether the putative mode-of-
inheritance QTL of the various metabolites were colocalized to
those of other metabolites that were chemically similar. We
hoped that this would provide information on the genetics of the
enzymes catalyzing the reactions that link the metabolic nodes of
the network. We carried this out by examining the locations of all
332 QTL (see Supplemental Data Set 2 online). Several interest-
ing observations resulted from this analysis, with 11 of the 74 ILs
harboring at least one metabolite pair that display the same
mode-of-inheritance QTL. Among the 13 metabolite pairs, all of
the major inheritance modes were represented with pairs alter-
natively exhibiting dominant, additive, and recessive inheritance.
Although four of these were glucose–fructose pairs (IL-2-2, IL-2-
6-5, IL-9-3-1, and IL-10-1-1), each pair displayed a different
inheritance type; in addition, there was a glucose 6-phosphate–
fructose 6-phosphate pair (IL-1-2), a Gly–Ser pair (IL-1-2), a
Gln–Glu pair (IL-1-4-18), a Leu–Val pair (IL-3-2), two Ile–Leu pairs
(IL-8-3 and IL-12-3), an Asn–b-Ala pair (IL-11-9-1), a succinate–
fumarate pair (IL12-3), and a homoserine–Lys pair (IL-12-4).
Unfortunately, analysis of the map positions of the genes of
primary metabolism that have been reported for tomato (Causse
et al., 2004) and the highly syntenic potato (Chen et. al., 2001) did
not reveal the presence of candidate genes at these positions.
However, given the paucity of information on metabolism-asso-
ciated genes (with the exception of QTL for sugar metabolism),
we cannot conclude much from this comparison. In the case of
the sugars, genes for their import into the fruit and their subse-
quent metabolism have been mapped, and while one hexokinase
gene is associated with one of the putative QTL we mentioned
above (IL-2-2), the other putative QTL do not colocalize with any
of the expected candidates. However, it remains to be seen
where the genes that encode the biosynthetic (and degradative)
machinery of other pathways of primary metabolism are local-
ized before the generality of this finding can be assessed.
Metabolite–Morphology Associations in the ILs and ILHs
In our previous study (Schauer et al., 2006), we observed that
many of the metabolite traits that we identified were associated
with morphological traits, and the harvest index (HI) was iden-
tified as a major pleiotropic hub. The nature of the ILs makes such
multitrait analysis possible and thus allows the identification and
potential dissection of functional relationships between traits. In
our previous study, we were able to demonstrate a highly robust
relationship between HI and metabolite composition. In order to
evaluate whether this relationship also holds true in the ILHs, we
performed correlation analysis between the metabolite traits
reported here and the morphological traits of the ILHs that were
Figure 3. Heat Map of the Metabolite Profiles of M82 Lines Heterozy-
gous (ILH) for Chromosomal Segmental Substitution from S. pennellii.
Results presented are pericarp metabolite content data obtained from
the ILHs of the 2004 harvest. Regions of dark red or dark blue indicate
that the metabolite content is increased or decreased, respectively, after
introgression of S. pennellii segments. GC-MS was used to quantify 74
metabolites, including amino acids, organic acids, fatty acids, sugars,
sugar alcohols, and vitamins. Due to space constraints, this heat map is
not annotated; however, a fully annotated heat map including the
metabolite profiles of the ILHs from the 2004 harvest is provided in
Supplemental Figure 6 online.
Inheritance in Primary Metabolism 515
reported previously for plant material of the same harvest. In
order to obtain the most reliable comparison, we also recalcu-
lated values for the ILs from the 2004 harvest (Figures 5 and 6).
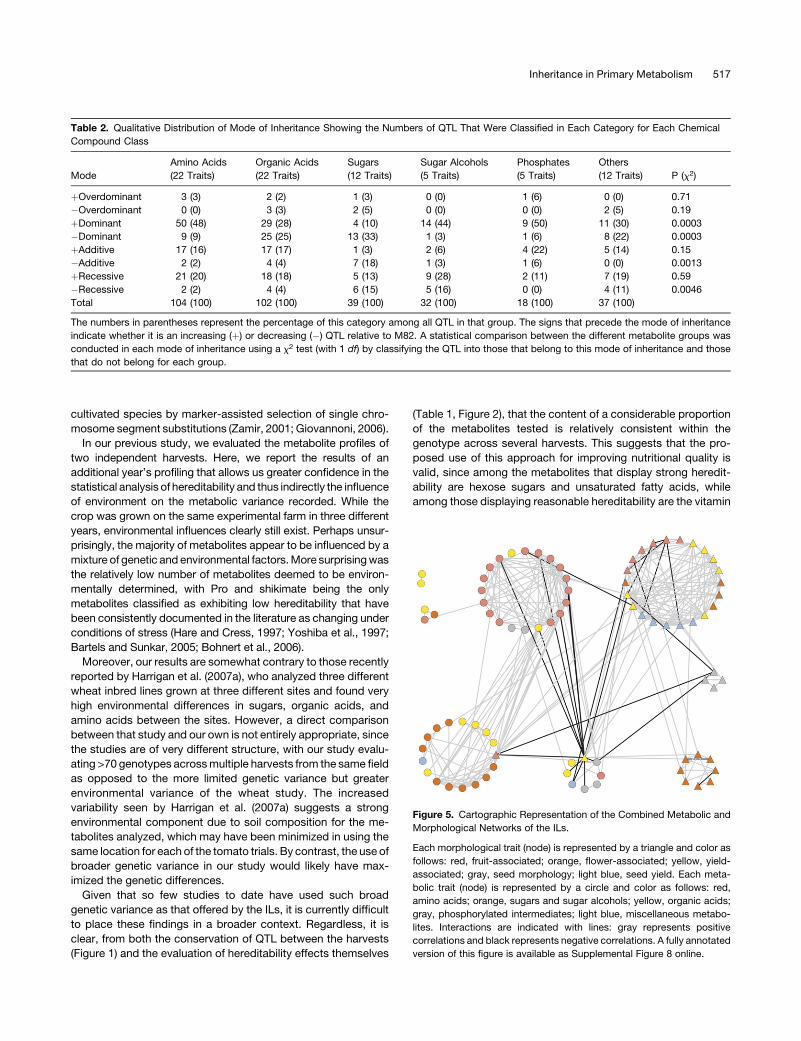
The network analysis of the 2004 IL data yielded a remarkably
similar cartography to that which we documented previously for
the 2001 and 2003 data (Figure 5) (Schauer et al., 2006),
suggesting that it is highly stable in this network across harvests.
That for the ILHs, however, was markedly different from both of
these (Figure 6). However, the most valid comparison is with the
IL network of 2004, since the comparison of this network with
that resulting from the ILH lines is highly controlled, given that the
lines were grown, harvested, and evaluated following the same
randomization procedure. This comparison reveals that, in the
case of the ILHs, there was a clear reduction in the number of
correlations between metabolic and morphological traits. There
were only 5 strongly correlating trait pairs between the different
phenotyping studies, as opposed to 30 strongly correlating trait
pairs in the ILs. When stringent correlations of P < 0.001 were
applied, the number of correlations using permissive conditions
were 15 and 93 for the ILH and IL network, respectively.
While surprising, the evaluation of the HI distribution in the
populations revealed that the ILs displayed a significantly
broader variation in this trait than the ILHs (see Supplemental
Figure 7 online), suggesting that problems of sterility in the ILs
may be the primary course of this effect. Close analyses of these
figures and the underlying data (presented in Supplemental Data
Set 1 online) revealed that, in addition to the changed pattern of
metabolite–morphological correlations in the ILHs, there are
additionally a large number of the metabolite–metabolite corre-
lations that are specific either to the IL or the ILH population. This
underscores the complexity of the hereditability of the metabolite
traits that we determined.
DISCUSSION
In recent years, there has been much renewed interest in the
possibility of breeding not only higher yielding but also better
quality crops. One potential approach to this end is the combined
use of metabolite profiling and introgression breeding. In our
previous work (Schauer et al., 2006), we demonstrated that,
when used in tandem, these approaches were able to rapidly
identify a large number of metabolite accumulation QTL. While
there has been much interest in influencing fruit size and shape
as well as improving the organoleptic properties of tomato (Frary
et al., 2003; van der Knaap et al., 2004; Chaib et al., 2006),
nutritional quality has largely been overlooked in tomato breed-
ing programs. However, the compositional quality of crops is
receiving increasing interest, particularly given the results of
recent studies highlighting the nutritional importance of lyco-
pene, flavonoids, and chlorogenic acid in the human diet
(Davuluri et al., 2005; Dixon, 2005; Niggeweg et al., 2006; Rein
et al., 2006). Such improvements are particularly important in
tomato, since, in this species (with the exception of lycopene-
derived volatiles), the flavor components associated with nutrit-
ion have been depleted through breeding (Goff and Klee, 2006;
Morris and Sands, 2006). One such approach to identify genetic
material suitable for reintroducing these traits is the introgression
approach, whereby wild allelic variance is introduced back into
Figure 4. Distribution of the QTL Mode of Inheritance for Metabolite Accumulation.
Each vertical bar represents the number of QTL for a specific trait, colored according to mode-of-inheritance categories: A, additive; D, dominant; ODO,
overdominant; R, recessive. The bars above the 0 line represent the number of increasing QTL, whereas the negative bars represent the number of
decreasing QTL relative to M82.
516 The Plant Cell
cultivated species by marker-assisted selection of single chro-
mosome segment substitutions (Zamir, 2001; Giovannoni, 2006).
In our previous study, we evaluated the metabolite profiles of
two independent harvests. Here, we report the results of an
additional year’s profiling that allows us greater confidence in the
statistical analysis of hereditability and thus indirectly the influence
of environment on the metabolic variance recorded. While the
crop was grown on the same experimental farm in three different
years, environmental influences clearly still exist. Perhaps unsur-
prisingly, the majority of metabolites appear to be influenced by a
mixture of genetic and environmental factors. More surprising was
the relatively low number of metabolites deemed to be environ-
mentally determined, with Pro and shikimate being the only
metabolites classified as exhibiting low hereditability that have
been consistently documented in the literature as changing under
conditions of stress (Hare and Cress, 1997; Yoshiba et al., 1997;
Bartels and Sunkar, 2005; Bohnert et al., 2006).
Moreover, our results are somewhat contrary to those recently
reported by Harrigan et al. (2007a), who analyzed three different
wheat inbred lines grown at three different sites and found very
high environmental differences in sugars, organic acids, and
amino acids between the sites. However, a direct comparison
between that study and our own is not entirely appropriate, since
the studies are of very different structure, with our study evalu-
ating >70 genotypes across multiple harvests from the same field
as opposed to the more limited genetic variance but greater
environmental variance of the wheat study. The increased
variability seen by Harrigan et al. (2007a) suggests a strong
environmental component due to soil composition for the me-
tabolites analyzed, which may have been minimized in using the
same location for each of the tomato trials. By contrast, the use of
broader genetic variance in our study would likely have max-
imized the genetic differences.
Given that so few studies to date have used such broad
genetic variance as that offered by the ILs, it is currently difficult
to place these findings in a broader context. Regardless, it is
clear, from both the conservation of QTL between the harvests
(Figure 1) and the evaluation of hereditability effects themselves
(Table 1, Figure 2), that the content of a considerable proportion
of the metabolites tested is relatively consistent within the
genotype across several harvests. This suggests that the pro-
posed use of this approach for improving nutritional quality is
valid, since among the metabolites that display strong heredit-
ability are hexose sugars and unsaturated fatty acids, while
among those displaying reasonable hereditability are the vitamin
Table 2. Qualitative Distribution of Mode of Inheritance Showing the Numbers of QTL That Were Classified in Each Category for Each Chemical
Compound Class
Mode
Amino Acids
(22 Traits)
Organic Acids
(22 Traits)
Sugars
(12 Traits)
Sugar Alcohols
(5 Traits)
Phosphates
(5 Traits)
Others
(12 Traits) P (x2)
þOverdominant 3 (3) 2 (2) 1 (3) 0 (0) 1 (6) 0 (0) 0.71
�Overdominant 0 (0) 3 (3) 2 (5) 0 (0) 0 (0) 2 (5) 0.19
þDominant 50 (48) 29 (28) 4 (10) 14 (44) 9 (50) 11 (30) 0.0003
�Dominant 9 (9) 25 (25) 13 (33) 1 (3) 1 (6) 8 (22) 0.0003
þAdditive 17 (16) 17 (17) 1 (3) 2 (6) 4 (22) 5 (14) 0.15
�Additive 2 (2) 4 (4) 7 (18) 1 (3) 1 (6) 0 (0) 0.0013
þRecessive 21 (20) 18 (18) 5 (13) 9 (28) 2 (11) 7 (19) 0.59
�Recessive 2 (2) 4 (4) 6 (15) 5 (16) 0 (0) 4 (11) 0.0046
Total 104 (100) 102 (100) 39 (100) 32 (100) 18 (100) 37 (100)
The numbers in parentheses represent the percentage of this category among all QTL in that group. The signs that precede the mode of inheritance
indicate whether it is an increasing (þ) or decreasing (�) QTL relative to M82. A statistical comparison between the different metabolite groups was
conducted in each mode of inheritance using a x2 test (with 1 df) by classifying the QTL into those that belong to this mode of inheritance and those
that do not belong for each group.
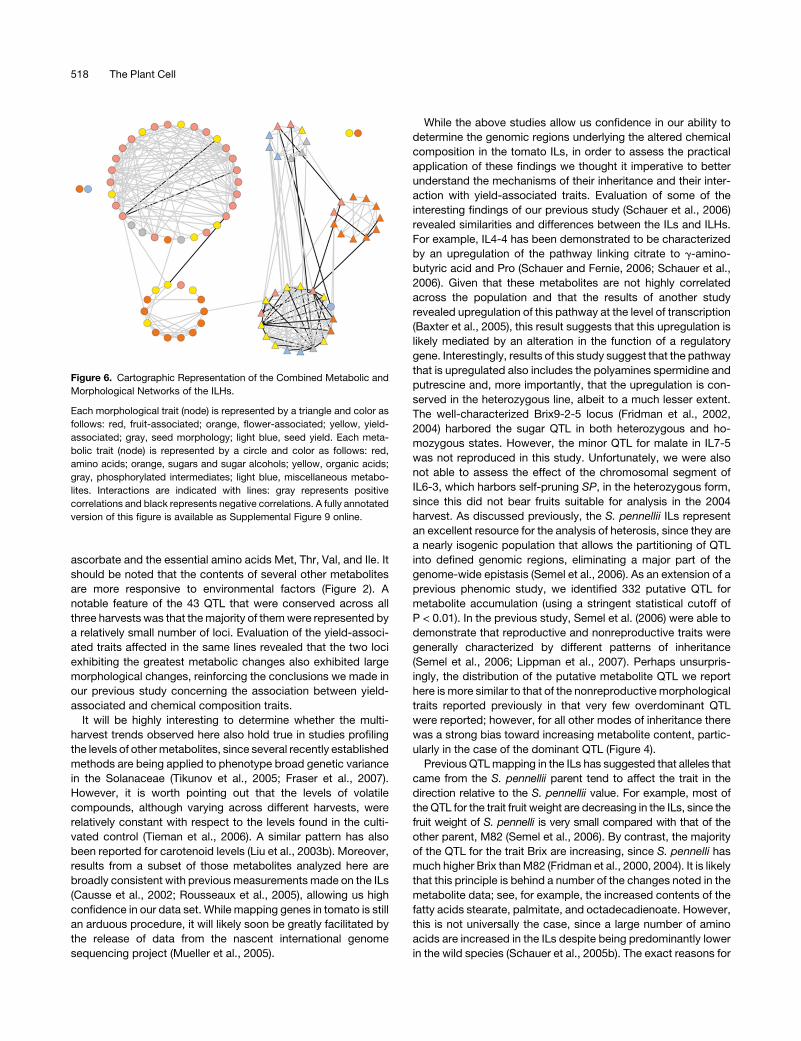
Figure 5. Cartographic Representation of the Combined Metabolic and
Morphological Networks of the ILs.
Each morphological trait (node) is represented by a triangle and color as
follows: red, fruit-associated; orange, flower-associated; yellow, yield-
associated; gray, seed morphology; light blue, seed yield. Each meta-
bolic trait (node) is represented by a circle and color as follows: red,
amino acids; orange, sugars and sugar alcohols; yellow, organic acids;
gray, phosphorylated intermediates; light blue, miscellaneous metabo-
lites. Interactions are indicated with lines: gray represents positive
correlations and black represents negative correlations. A fully annotated
version of this figure is available as Supplemental Figure 8 online.
Inheritance in Primary Metabolism 517
ascorbate and the essential amino acids Met, Thr, Val, and Ile. It
should be noted that the contents of several other metabolites
are more responsive to environmental factors (Figure 2). A
notable feature of the 43 QTL that were conserved across all
three harvests was that the majority of them were represented by
a relatively small number of loci. Evaluation of the yield-associ-
ated traits affected in the same lines revealed that the two loci
exhibiting the greatest metabolic changes also exhibited large
morphological changes, reinforcing the conclusions we made in
our previous study concerning the association between yield-
associated and chemical composition traits.
It will be highly interesting to determine whether the multi-
harvest trends observed here also hold true in studies profiling
the levels of other metabolites, since several recently established
methods are being applied to phenotype broad genetic variance
in the Solanaceae (Tikunov et al., 2005; Fraser et al., 2007).
However, it is worth pointing out that the levels of volatile
compounds, although varying across different harvests, were
relatively constant with respect to the levels found in the culti-
vated control (Tieman et al., 2006). A similar pattern has also
been reported for carotenoid levels (Liu et al., 2003b). Moreover,
results from a subset of those metabolites analyzed here are
broadly consistent with previous measurements made on the ILs
(Causse et al., 2002; Rousseaux et al., 2005), allowing us high
confidence in our data set. While mapping genes in tomato is still
an arduous procedure, it will likely soon be greatly facilitated by
the release of data from the nascent international genome
sequencing project (Mueller et al., 2005).
While the above studies allow us confidence in our ability to
determine the genomic regions underlying the altered chemical
composition in the tomato ILs, in order to assess the practical
application of these findings we thought it imperative to better
understand the mechanisms of their inheritance and their inter-
action with yield-associated traits. Evaluation of some of the
interesting findings of our previous study (Schauer et al., 2006)
revealed similarities and differences between the ILs and ILHs.
For example, IL4-4 has been demonstrated to be characterized
by an upregulation of the pathway linking citrate to g-amino-
butyric acid and Pro (Schauer and Fernie, 2006; Schauer et al.,
2006). Given that these metabolites are not highly correlated
across the population and that the results of another study
revealed upregulation of this pathway at the level of transcription
(Baxter et al., 2005), this result suggests that this upregulation is
likely mediated by an alteration in the function of a regulatory
gene. Interestingly, results of this study suggest that the pathway
that is upregulated also includes the polyamines spermidine and
putrescine and, more importantly, that the upregulation is con-
served in the heterozygous line, albeit to a much lesser extent.
The well-characterized Brix9-2-5 locus (Fridman et al., 2002,
2004) harbored the sugar QTL in both heterozygous and ho-
mozygous states. However, the minor QTL for malate in IL7-5
was not reproduced in this study. Unfortunately, we were also
not able to assess the effect of the chromosomal segment of
IL6-3, which harbors self-pruning SP, in the heterozygous form,
since this did not bear fruits suitable for analysis in the 2004
harvest. As discussed previously, the S. pennellii ILs represent
an excellent resource for the analysis of heterosis, since they are
a nearly isogenic population that allows the partitioning of QTL
into defined genomic regions, eliminating a major part of the
genome-wide epistasis (Semel et al., 2006). As an extension of a
previous phenomic study, we identified 332 putative QTL for
metabolite accumulation (using a stringent statistical cutoff of
P < 0.01). In the previous study, Semel et al. (2006) were able to
demonstrate that reproductive and nonreproductive traits were
generally characterized by different patterns of inheritance
(Semel et al., 2006; Lippman et al., 2007). Perhaps unsurpris-
ingly, the distribution of the putative metabolite QTL we report
here is more similar to that of the nonreproductive morphological
traits reported previously in that very few overdominant QTL
were reported; however, for all other modes of inheritance there
was a strong bias toward increasing metabolite content, partic-
ularly in the case of the dominant QTL (Figure 4).
Previous QTL mapping in the ILs has suggested that alleles that
came from the S. pennellii parent tend to affect the trait in the
direction relative to the S. pennellii value. For example, most of
the QTL for the trait fruit weight are decreasing in the ILs, since the
fruit weight of S. pennelli is very small compared with that of the
other parent, M82 (Semel et al., 2006). By contrast, the majority
of the QTL for the trait Brix are increasing, since S. pennelli has
much higher Brix than M82 (Fridman et al., 2000, 2004). It is likely
that this principle is behind a number of the changes noted in the
metabolite data; see, for example, the increased contents of the
fatty acids stearate, palmitate, and octadecadienoate. However,
this is not universally the case, since a large number of amino
acids are increased in the ILs despite being predominantly lower
in the wild species (Schauer et al., 2005b). The exact reasons for
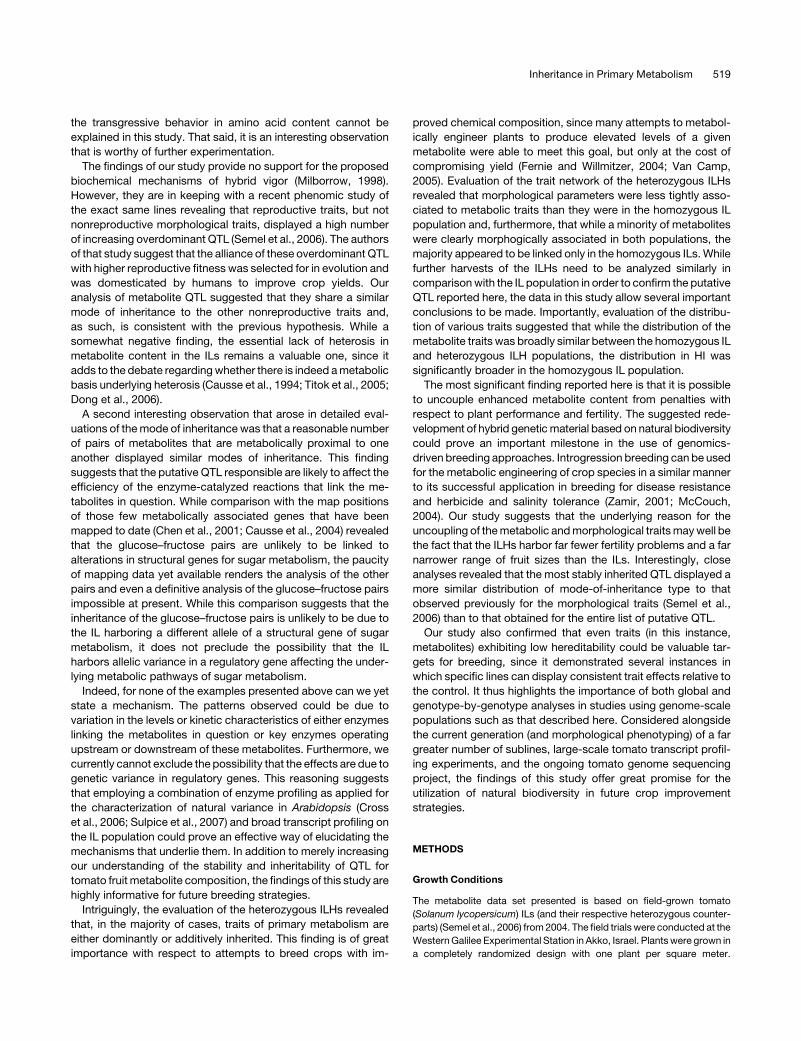
Figure 6. Cartographic Representation of the Combined Metabolic and
Morphological Networks of the ILHs.
Each morphological trait (node) is represented by a triangle and color as
follows: red, fruit-associated; orange, flower-associated; yellow, yield-
associated; gray, seed morphology; light blue, seed yield. Each meta-
bolic trait (node) is represented by a circle and color as follows: red,
amino acids; orange, sugars and sugar alcohols; yellow, organic acids;
gray, phosphorylated intermediates; light blue, miscellaneous metabo-
lites. Interactions are indicated with lines: gray represents positive
correlations and black represents negative correlations. A fully annotated
version of this figure is available as Supplemental Figure 9 online.
518 The Plant Cell
the transgressive behavior in amino acid content cannot be
explained in this study. That said, it is an interesting observation
that is worthy of further experimentation.
The findings of our study provide no support for the proposed
biochemical mechanisms of hybrid vigor (Milborrow, 1998).
However, they are in keeping with a recent phenomic study of
the exact same lines revealing that reproductive traits, but not
nonreproductive morphological traits, displayed a high number
of increasing overdominant QTL (Semel et al., 2006). The authors
of that study suggest that the alliance of these overdominant QTL
with higher reproductive fitness was selected for in evolution and
was domesticated by humans to improve crop yields. Our
analysis of metabolite QTL suggested that they share a similar
mode of inheritance to the other nonreproductive traits and,
as such, is consistent with the previous hypothesis. While a
somewhat negative finding, the essential lack of heterosis in
metabolite content in the ILs remains a valuable one, since it
adds to the debate regarding whether there is indeed a metabolic
basis underlying heterosis (Causse et al., 1994; Titok et al., 2005;
Dong et al., 2006).
A second interesting observation that arose in detailed eval-
uations of the mode of inheritance was that a reasonable number
of pairs of metabolites that are metabolically proximal to one
another displayed similar modes of inheritance. This finding
suggests that the putative QTL responsible are likely to affect the
efficiency of the enzyme-catalyzed reactions that link the me-
tabolites in question. While comparison with the map positions
of those few metabolically associated genes that have been
mapped to date (Chen et al., 2001; Causse et al., 2004) revealed
that the glucose–fructose pairs are unlikely to be linked to
alterations in structural genes for sugar metabolism, the paucity
of mapping data yet available renders the analysis of the other
pairs and even a definitive analysis of the glucose–fructose pairs
impossible at present. While this comparison suggests that the
inheritance of the glucose–fructose pairs is unlikely to be due to
the IL harboring a different allele of a structural gene of sugar
metabolism, it does not preclude the possibility that the IL
harbors allelic variance in a regulatory gene affecting the under-
lying metabolic pathways of sugar metabolism.
Indeed, for none of the examples presented above can we yet
state a mechanism. The patterns observed could be due to
variation in the levels or kinetic characteristics of either enzymes
linking the metabolites in question or key enzymes operating
upstream or downstream of these metabolites. Furthermore, we
currently cannot exclude the possibility that the effects are due to
genetic variance in regulatory genes. This reasoning suggests
that employing a combination of enzyme profiling as applied for
the characterization of natural variance in Arabidopsis (Cross
et al., 2006; Sulpice et al., 2007) and broad transcript profiling on
the IL population could prove an effective way of elucidating the
mechanisms that underlie them. In addition to merely increasing
our understanding of the stability and inheritability of QTL for
tomato fruit metabolite composition, the findings of this study are
highly informative for future breeding strategies.
Intriguingly, the evaluation of the heterozygous ILHs revealed
that, in the majority of cases, traits of primary metabolism are
either dominantly or additively inherited. This finding is of great
importance with respect to attempts to breed crops with im-
proved chemical composition, since many attempts to metabol-
ically engineer plants to produce elevated levels of a given
metabolite were able to meet this goal, but only at the cost of
compromising yield (Fernie and Willmitzer, 2004; Van Camp,
2005). Evaluation of the trait network of the heterozygous ILHs
revealed that morphological parameters were less tightly asso-
ciated to metabolic traits than they were in the homozygous IL
population and, furthermore, that while a minority of metabolites
were clearly morphogically associated in both populations, the
majority appeared to be linked only in the homozygous ILs. While
further harvests of the ILHs need to be analyzed similarly in
comparison with the IL population in order to confirm the putative
QTL reported here, the data in this study allow several important
conclusions to be made. Importantly, evaluation of the distribu-
tion of various traits suggested that while the distribution of the
metabolite traits was broadly similar between the homozygous IL
and heterozygous ILH populations, the distribution in HI was
significantly broader in the homozygous IL population.
The most significant finding reported here is that it is possible
to uncouple enhanced metabolite content from penalties with
respect to plant performance and fertility. The suggested rede-
velopment of hybrid genetic material based on natural biodiversity
could prove an important milestone in the use of genomics-
driven breeding approaches. Introgression breeding can be used
for the metabolic engineering of crop species in a similar manner
to its successful application in breeding for disease resistance
and herbicide and salinity tolerance (Zamir, 2001; McCouch,
2004). Our study suggests that the underlying reason for the
uncoupling of the metabolic and morphological traits may well be
the fact that the ILHs harbor far fewer fertility problems and a far
narrower range of fruit sizes than the ILs. Interestingly, close
analyses revealed that the most stably inherited QTL displayed a
more similar distribution of mode-of-inheritance type to that
observed previously for the morphological traits (Semel et al.,
2006) than to that obtained for the entire list of putative QTL.
Our study also confirmed that even traits (in this instance,
metabolites) exhibiting low hereditability could be valuable tar-
gets for breeding, since it demonstrated several instances in
which specific lines can display consistent trait effects relative to
the control. It thus highlights the importance of both global and
genotype-by-genotype analyses in studies using genome-scale
populations such as that described here. Considered alongside
the current generation (and morphological phenotyping) of a far
greater number of sublines, large-scale tomato transcript profil-
ing experiments, and the ongoing tomato genome sequencing
project, the findings of this study offer great promise for the
utilization of natural biodiversity in future crop improvement
strategies.
METHODS
Growth Conditions
The metabolite data set presented is based on field-grown tomato
(Solanum lycopersicum) ILs (and their respective heterozygous counter-
parts) (Semel et al., 2006) from 2004. The field trials were conducted at the
Western Galilee Experimental Station in Akko, Israel. Plants were grown in
a completely randomized design with one plant per square meter.
Inheritance in Primary Metabolism 519
Seedlings were grown in greenhouses for 35 to 40 d and then transferred
to the field. Twelve seedlings of each homozygous IL and heterozygous
ILH (IL 3 M82) were transplanted as well as 70 seedlings of M82. Eight ILs
were not included in the analysis because of poor germination (ILH2-4,
IL3-1, ILH3-4, ILH6-2, ILH6-2-2, ILH6-4, ILH7-2, and ILH9-3-2). Fruit was
harvested when 80 to 100% of the tomatoes were red (Eshed and Zamir,
1995). The field was irrigated with 320 m3 of water per 1000 m2 of field
area throughout the season. Morphological and reproductive traits have
been described previously for this harvest (Semel et al., 2006). Data
obtained were compared with those published previously for metabolite
content and morphological parameters from material harvested in Akko in
the 2001 and 2003 seasons (Schauer et al., 2006).
Metabolite Profiling
Relative metabolite contents were determined using an established GC-
MS protocol allowing the quantification, in methanol extracts, of sugars,
sugar alcohols, organic and amino acids, and the vitamins tocopherol and
ascorbate essentially as described previously (Roessner et al., 2001;
Lisec et al., 2006). The only modifications to these procedures were that
they were optimized for tomato fruit as described by Roessner-Tunali
et al. (2003) and that we utilized mass-spectral libraries (Schauer et al.,
2005a; Kopka et al., 2005) for peak identification. Use of these libraries
allowed us to detect a slightly larger number of metabolites than in our
previous study (Schauer et al., 2006).
Statistics
Statistical analyses were performed using the JMP IN 5.1 software
package (SAS Institute), R statistical software (www.r-project.org), or
Microsoft Excel 7.0. Using these programs, we performed ANOVA tests
as well as x2 tests and determined Pearson’s correlation coefficients. The
distribution of metabolic changes was calculated using a Gaussian
distribution with a ratio of 0.95.
IL Mapping
To map the metabolites, a two-way ANOVA was used to partition
metabolic variation into genotype, environment, and genotype 3 envi-
ronmental interaction effects, regarding the possibility of all three effects
as random for the purpose of this analysis. The ANOVA method has been
commonly applied to transcriptional analysis and shows excellent ro-
bustness (Schauer et al., 2006). Effects were assigned only when data
were available for a parameter in all 3 years with at least four replicates of
each determination within a year. As an additional criterion, we estimated
the P value both for the combined effect and for the independent effects
exerted by environment and genotype independently.
H2 (s2G/s2
GþE) was calculated for each trait for which the genotype was
identified as a factor with a random effect, and the genetic variation was
calculated as the percentage of the total variation (genetic 3 environ-
mental). For the QTL mapping, each IL or ILH was compared (by t test)
with M82 as well as with each other. If either of them was significantly
different (at the 1% level) from the reference genotype M82, the intro-
gression was considered as harboring a QTL. Correlation analysis was
additionally performed across the entire population by means of the
Pearson correlation coefficient in order to determine possible technical
artifacts.
Heat Maps
Heat maps were calculated using the heat map module of the statistical
software environment R, version 1.9. False-color imaging was performed
on the log10-transformed metabolite data. We scaled data internally on a
column basis to have a mean of 0 and a SD of 1. Metabolite data were
taken only in instances in which metabolite content was determined in all
six replicates of an IL (in any given harvest).
Mode-of-Inheritance Classification
The phenotypic effect of a QTL was considered to be the effect of the
significant line (IL or ILH) and was presented as a percentage of M82.
Positive values are used for increasing QTL in which the introgression was
higher than in M82, and negative values are used for decreasing QTL. If
both the IL and the ILH had significant effects in the same direction, the
higher value was considered the QTL phenotypic effect. If both the IL and
ILH were significant but in opposite directions relative to M82, the
introgression was considered as harboring two QTL: one increasing
and the other decreasing.
The mode of inheritance of a QTL was determined according to a
decision tree (Semel et al., 2006). In cases in which the IL was significantly
different from M82 and the ILH phenotype was between the IL and M82,
there were three possibilities: (1) if the ILH was significantly different from
the IL but not from M82, it was considered recessive; (2) if the ILH differed
from both parents or did not differ from either of them, it was considered
additive; and (3) if the ILH differed from M82 but not from the IL, the QTL
was assigned as dominant. The last possibility is that the ILH was
significantly higher or lower than both its parents, in which case it was
considered overdominant.
Network Analysis
Network analysis was performed exactly as described by Schauer et al.
(2006). In brief, correlation between all trait (metabolite plus morpholog-
ical) pairs was tested using IL or ILH mean values (n¼ 76 lines). Because
the 83 traits yield 3403 pairs, we choose strict significance levels (0.0001).
The pairs that resulted were considered as a network in which a vertex
corresponds to a trait and a link between two vertices corresponds to
significant correlations between these two traits. This network was then
subjected to the same cartography algorithm used in our previous study
(Schauer et al., 2006). Essentially, this algorithm divides the network into
modules or groups of vertices that are more connected between them-
selves than to nodes from other modules, yielding a cartographic repre-
sentation of a complex network. In implementing this algorithm, negative
correlations were considered to be equal to positive correlations.
Supplemental Data
The following materials are available in the online version of this article.
Supplemental Figure 1. Annotated Overlay Heat Map of the Metab-
olite Profiles of the ILs in Comparison with That of the Parental Control
(M82) from the Individual Data Sets of 2001, 2003, and 2004.
Supplemental Figure 2. Annotated Heat Map of the Metabolite
Profiles of the ILs in Comparison with That of the Parental Control
(M82) from the Individual Data Set of 2001.
Supplemental Figure 3. Annotated Heat Map of the Metabolite
Profiles of the ILs in Comparison with That of the Parental Control
(M82) from the Individual Data Set of 2003.
Supplemental Figure 4. Annotated Heat Map of the Metabolite
Profiles of the ILs in Comparison with That of the Parental Control
(M82) from the Individual Data Set of 2004.
Supplemental Figure 5. Venn Diagram Illustrating the Number of
Shared QTL in the 2001, 2003, and 2004 Trials.
Supplemental Figure 6. Annotated Heat Map of the Metabolite
Profiles of S. lycopersicum Lines Homozygous (IL) or Heterozygous
(ILH) for Chromosomal Segmental Substitution from S. pennellii.
520 The Plant Cell
Supplemental Figure 7. HI Comparison between Homozygous and
Heterozygous ILs.
Supplemental Figure 8. Cartographic Representation of the Com-
bined Metabolic and Morphological Networks of the ILs.
Supplemental Figure 9. Cartographic Representation of the Com-
bined Metabolic and Morphological Networks of the ILHs.
Supplemental Table 1. QTL Conserved across the Field Trials from
All 3 Years.
Supplemental Table 2. Qualitative Distribution of Mode of Inheri-
tance Showing the Numbers of Major QTL That Were Classified in
Each Category for Each Chemical Compound Class.
Supplemental Data Set 1. Correlation Analyses of IL and ILH Data
Sets.
Supplemental Data Set 2. QTL Detected at a Stringency of 1%,
Sorted by IL.
ACKNOWLEDGMENTS
This research was supported in part by a grant from the German–Israeli
Cooperation Project and in part by the European Union SOL Integrated
Project FOOD-CT-2006-016214.
Received October 26, 2007; revised January 24, 2008; accepted March
10, 2008; published March 25, 2008.
REFERENCES
Alonso, J.M., Stepanova, A.N., Solano, R., Wisman, E., Ferrari, S.,
Ausubel, F.M., and Ecker, J.R. (2003). Five components of the
ethylene-response pathway identified in a screen for weak ethylene-
insensitive mutants in Arabidopsis. Proc. Natl. Acad. Sci. USA 100:
2992–2997.
Ashikari, M., Sakakibara, H., Lin, S.Y., Yamamoto, T., Takashi, T.,
Nishimura, A., Angeles, E.R., Qian, Q., Kitano, H., and Matsuoka,
M. (2005). Cytokinin oxidase regulates rice grain production. Science
309: 741–745.
Bartels, D., and Sunkar, R. (2005). Drought and salt tolerance in plants.
Review. Crit. Rev. Plant Sci. 24: 23–58.
Baxter, C.J., Sabar, M., Quick, W.P., and Sweetlove, L.J. (2005).
Comparison of changes in fruit gene expression in tomato introgres-
sion lines provides evidence of genome-wide transcriptional changes
and reveals links to mapped QTLs and described traits. J. Exp. Bot.
56: 1591–1604.
Bentsink, L., Alonso-Blanco, C., Vreugdenhil, D., Tesnier, K., Groot,
S.P., and Koornneef, M. (2000). Genetic analysis of seed-soluble
oligosaccharides in relation to seed storability of Arabidopsis. Plant
Physiol. 124: 1595–1604.
Bohnert, H.J., Gong, Q., Li, P., and Ma, S. (2006). Unraveling abiotic
stress tolerance mechanisms—Getting genomics going. Curr. Opin.
Plant Biol. 9: 180–188.
Borevitz, J.O., and Chory, J. (2004). Genomics tools for QTL analysis
and gene discovery. Curr. Opin. Plant Biol. 7: 132–136.
Borevitz, J.O., Liang, D., Plouffe, D., Chang, H.S., Zhu, T., Weigel, D.,
Berry, C.C., Winzeler, E., and Chory, J. (2003). Large-scale identi-
fication of single-feature polymorphisms in complex genomes. Ge-
nome Res. 13: 513–523.
Causse, M., Duffe, P., Gomez, M.C., Buret, M., Damidaux, R., Zamir,
D., Gur, A., Chevalier, C., Lemaire-Chamley, M., and Rothan, C.
(2004). A genetic map of candidate genes and QTLs involved in
tomato fruit size and composition. J. Exp. Bot. 55: 1671–1685.
Causse, M., Saliba-Colombani, V., Lecomte, L., Duffe, P., Rousselle,
P., and Buret, M. (2002). QTL analysis of fruit quality in fresh market
tomato: A few chromosome regions control the variation of sensory
and instrumental traits. J. Exp. Bot. 53: 2089–2098.
Causse, M.A., et al. (1994). Saturated molecular map of the rice
genome based on an interspecific backcross population. Genetics
138: 1251–1274.
Chaib, J., Lecomte, L., Buret, M., and Causse, M. (2006). Stability
over genetic backgrounds, generations and years of quantitative trait
locus (QTLs) for organoleptic quality in tomato. Theor. Appl. Genet.
112: 934–944.
Chen, X., Salamini, F., and Gebhardt, C. (2001). A potato molecular-
function map for carbohydrate metabolism and transport. Theor.
Appl. Genet. 102: 284–295.
Cross, J.M., von Korff, M., Altmann, T., Bartzetko, L., Sulpice, R.,
Gibon, Y., Palacios, N., and Stitt, M. (2006). Variation of enzyme
activities and metabolite levels in 24 Arabidopsis accessions growing
in carbon-limited conditions. Plant Physiol. 142: 1574–1588.
Davuluri, G.R., et al. (2005). Fruit-specific RNAi-mediated suppression
of DET1 enhances carotenoid and flavonoid content in tomatoes. Nat.
Biotechnol. 23: 890–895.
Dhaubhadel, S., McGarvey, B.D., Williams, R., and Gijzen, M. (2003).
Isoflavonoid biosynthesis and accumulation in developing soybean
seeds. Plant Mol. Biol. 53: 733–743.
Dixon, R.A. (2005). Engineering of plant natural product pathways. Curr.
Opin. Plant Biol. 8: 329–336.
Doebley, J. (2006). Plant science. Unfallen grains: How ancient farmers
turned weeds into crops. Science 312: 1318–1319.
Dong, J., Wu, F.B., Jin, Z.Q., and Huang, Y.Q. (2006). Heterosis for
yield and some physiological traits in hybrid cotton Cikangzal.
Euphytica 151: 71–77.
Dormann, P. (2007). Functional diversity of tocochromanols in plants.
Planta 225: 269–276.
Eshed, Y., and Zamir, D. (1995). An introgression line population of
Lycopersicon pennellii in the cultivated tomato enables the identifi-
cation and fine mapping of yield-associated QTL. Genetics 141:
1147–1162.
Fernie, A.R., Tadmor, Y., and Zamir, D. (2006). Natural genetic
variation for improving crop quality. Curr. Opin. Plant Biol. 9: 196–202.
Fernie, A.R., and Willmitzer, L. (2004). Carbohydrate metabolism. In
The Handbook of Plant Biotechnology, P. Christou and H.K. Klee, eds
(Chichester, UK: Wiley), pp. 1230–1262.
Frary, A., Doganlar, S., Frampton, A., Fulton, T., Uhlig, J., Yates, H.,
and Tanksley, S. (2003). Fine mapping of quantitative trait loci for
improved fruit characteristics from Lycopersicon chmielewskii chro-
mosome 1. Genome 46: 235–243.
Frary, A., Nesbitt, T.C., Grandillo, S., Knaap, E., Cong, B., Liu, J.,
Meller, J., Elber, R., Alpert, K.B., and Tanksley, S.D. (2000). fw2.2:
A quantitative trait locus key to the evolution of tomato fruit size.
Science 289: 85–88.
Fraser, P.D., Enfissi, E.M., Goodfellow, M., Eguchi, T., and Bramley,
P.M. (2007). Metabolite profiling of plant carotenoids using the matrix-
assisted laser desorption ionization time-of-flight mass spectrometry.
Plant J. 49: 552–564.
Fridman, E., Carrari, F., Liu, Y.S., Fernie, A.R., and Zamir, D. (2004).
Zooming in on a quantitative trait for tomato yield using interspecific
introgressions. Science 305: 1786–1789.
Fridman, E., Liu, Y.S., Carmel-Goren, L., Gur, A., Shoresh, M.,
Pleban, T., Eshed, Y., and Zamir, D. (2002). Two tightly linked
QTLs modify tomato sugar content via different physiological path-
ways. Mol. Genet. Genomics 266: 821–826.
Inheritance in Primary Metabolism 521
Fridman, E., Pleban, T., and Zamir, D. (2000). A recombination hotspot
delimits a wild-species quantitative trait locus for tomato sugar
content to 484 bp within an invertase gene. Proc. Natl. Acad. Sci.
USA 97: 4718–4723.
Gilliland, L.U., Magallanes-Lundback, M., Hemming, C., Supplee, A.,
Koornneef, M., Bentsink, L., and Dellapenna, D. (2006). Genetic
basis for natural variation in seed vitamin E levels in Arabidopsis
thaliana. Proc. Natl. Acad. Sci. USA 103: 18834–18841.
Giovannoni, J.J. (2006). Breeding new life into plant metabolism. Nat.
Biotechnol. 24: 418–419.
Goff, S.A., and Klee, H.J. (2006). Plant volatile compounds: Sensory
cues for health and nutritional value? Science 311: 815–819.
Gur, A., and Zamir, D. (2004). Unused natural variation can lift yield
barriers in plant breeding. PLoS Biol. 2: 1610–1615.
Hare, P.D., and Cress, W.A. (1997). Metabolic implications of stress-
induced proline accumulation in plants. Plant Growth Regul. 21: 79–102.
Harrigan, G.G., et al. (2007a). Impact of genetics and environment on
nutritional and metabolite components of maize grain. J. Agric. Food
Chem. 55: 6177–6185.
Harrigan, G.G., et al. (2007b). Metabolite analyses of grain from maize
hybrids grown in the United States under drought and watered
conditions during the 2002 field season. J. Agric. Food Chem. 55:
6169–6176.
Heidel, A.J., Clauss, M.J., Kroymann, J., Savolainen, O., and Mitchell-
Olds, T. (2006). Natural variation in MAM within and between popu-
lations of Arabidopsis lyrata determines glucosinolate phenotype.
Genetics 173: 1629–1636.
Hobbs, D.H., Flintham, J.E., and Hills, M.J. (2004). Genetic control of
storage oil synthesis in seeds of Arabidopsis. Plant Physiol. 136:
3341–3349.
Jansen, R.C., and Nap, J.P. (2001). Genetical genomics: The added
value from segregation. Trends Genet. 17: 388–391.
Keurentjes, J.J., Fu, J., de Vos, C.H., Lommen, A., Hall, R.D., Bino,
R.J., van der Plas, L.H., Jansen, R.C., Vreugdenhil, D., and
Koornneef, M. (2006). The genetics of plant metabolism. Nat. Genet.
38: 842–849.
Koornneef, M., Alonso-Blanco, C., and Vreugdenhil, D. (2004). Nat-
urally occurring genetic variation in Arabidopsis thaliana. Annu. Rev.
Plant Biol. 55: 141–172.
Kopka, J., et al. (2005). [email protected]: The Golm Metabolome Data-
base. Bioinformatics 21: 1635–1638.
Kusano, M., Fukushima, A., Kobayashi, M., Hayashi, N., Jonsson, P.,
Moritz, T., Ebana, K., and Saito, K. (2007). Application of a meta-
bolomic method combining one-dimensional and two-dimensional
gas chromatography-time-of-flight/mass spectrometry to metabolic
phenotyping of natural variants in rice. J. Chromatogr. B Analyt. Technol.
Biomed. Life Sci. 855: 71–79.
Lippman, Z.B., Semel, Y., and Zamir, D. (2007). An integrated view of
quantitative trait variation using tomato interspecific introgression
lines. Curr. Opin. Genet. Dev. 17: 545–552.
Lisec, J., Schauer, N., Kopka, J., Willmitzer, L., and Fernie, A.R.
(2006). Gas chromatography mass spectrometry-based metabolite
profiling in plants. Nat. Protocols 1: 387–396.
Liu, J., Cong, B., and Tanksley, S.D. (2003a). Generation and analysis
of an artificial gene dosage series in tomato to study the mechanisms
by which the cloned quantitative trait locus fw2.2 controls fruit size.
Plant Physiol. 132: 292–299.
Liu, Y.S., Gur, A., Ronen, G., Causse, M., Damidaux, R., Buret, M.,
Hirschberg, J., and Zamir, D. (2003b). There is more to tomato fruit
colour than candidate carotenoid genes. Plant Biotechnol. J. 1: 195–207.
McCallum, C.M., Comai, L., Greene, E.A., and Henikoff, S. (2000).
Targeting induced local lesions in genomes (TILLING) for plant func-
tional genomics. Plant Physiol. 123: 439–442.
McCouch, S. (2004). Diversifying selection in plant breeding. PLoS Biol.
2: 1507–1512.
Meyer, R.C., Steinfath, M., Lisec, J., Becher, M., Witucka-Wall, H.,
Torjek, O., Fiehn, O., Eckardt, A., Willmitzer, L., Selbig, J., and
Altmann, T. (2007). The metabolic signature related to high plant
growth rate in Arabidopsis thaliana. Proc. Natl. Acad. Sci. USA 104:
4759–4764.
Meyerowitz, E.M. (2002). Plants compared to animals: The broadest
comparative study of development. Science 295: 1482–1485.
Milborrow, B.V. (1998). A biochemical mechanism for hybrid vigour.
J. Exp. Bot. 49: 1063–1071.
Mitchell-Olds, T., and Schmitt, J. (2006). Genetic mechanisms and
evolutionary significance of natural variation in Arabidopsis. Nature
441: 947–952.
Moose, S.P., Dudley, J.W., and Rocheford, T.R. (2004). Maize selec-
tion passes the century mark: A unique resource for 21st century
genomics. Trends Plant Sci. 9: 358–364.
Morreel, K., Goeminne, G., Storme, V., Sterck, L., Ralph, J., Coppieters,
W., Breyne, P., Steenackers, M., Georges, M., Messens, E., and
Boerjan, W. (2006). Genetical metabolomics of flavonoid biosynthesis
in Populus: A case study. Plant J. 47: 224–237.
Morris, C.E., and Sands, D.C. (2006). The breeder’s dilemma—Yield or
nutrition? Nat. Biotechnol. 24: 1078–1080.
Mueller, L.A., et al. (2005). The SOL genomics network. A comparative
resource for Solanaceae biology and beyond. Plant Physiol. 138:
1310–1317.
Niggeweg, R., Kocher, T., Gentzel, M., Buscaino, A., Taipale, M.,
Akhtar, A., and Wilm, M. (2006). A general precursor ion-like scan-
ning mode on quadrupole-TOF instruments compatible with chro-
matographic separation. Proteomics 6: 41–53.
O’Reilly-Wapstra, J.M., Potts, B.M., McArthur, C., Davies, N.W., and
Tilyard, P. (2005). Inheritance of resistance to mammalian herbivores
and of plant defensive chemistry in an Eucalyptus species. J. Chem.
Ecol. 31: 357–375.
Paran, I., and Zamir, D. (2003). Quantitative traits in plants: Beyond the
QTL. Trends Genet. 19: 303–306.
Rein, D., Schijlen, E., Kooistra, T., Herbers, K., Verschuren, L., Hall,
R., Sonnewald, U., Bovy, A., and Kleemann, R. (2006). Transgenic
flavonoid tomato intake reduces C-reactive protein in human
C-reactive protein transgenic mice more than wild-type tomato.
J. Nutr. 136: 2331–2337.
Roessner, U., Luedemann, A., Brust, D., Fiehn, O., Linke, T., Willmitzer,
L., and Fernie, A. (2001). Metabolic profiling allows comprehensive
phenotyping of genetically or environmentally modified plant systems.
Plant Cell 13: 11–29.
Roessner, U., Wagner, C., Kopka, J., Trethewey, R.N., and
Willmitzer, L. (2000). Simultaneous analysis of metabolites in
potato tuber by gas chromatography mass spectrometry. Plant J. 23:
131–142.
Roessner-Tunali, U., Hegemann, B., Lytovchenko, A., Carrari, F.,
Bruedigam, C., Granot, D., and Fernie, A.R. (2003). Metabolic
profiling of transgenic tomato plants overexpressing hexokinase
reveals that the influence of hexose phosphorylation diminishes
during fruit development. Plant Physiol. 133: 84–99.
Rousseaux, M.C., Jones, C.M., Adams, D., Chetelat, R., Bennett, A.,
and Powell, A. (2005). QTL analysis of fruit antioxidants in tomato
using Lycopersicon pennellii introgression lines. Theor. Appl. Genet.
111: 1396–1408.
Salvi, S., and Tuberosa, R. (2005). To clone or not to clone plant QTLs:
Present and future challenges. Trends Plant Sci. 10: 297–304.
Schauer, N., and Fernie, A.R. (2006). Plant metabolomics: Towards
biological function and mechanism. Trends Plant Sci. 11: 508–516.
Schauer, N., et al. (2006). Comprehensive metabolic profiling and
522 The Plant Cell
phenotyping of interspecific introgression lines for tomato improve-
ment. Nat. Biotechnol. 24: 447–454.
Schauer, N., Steinhauser, D., Strelkov, S., Schomburg, D., Allison,
G., Moritz, T., Lundgren, K., Roessner-Tunali, U., Forbes, M.G.,
Willmitzer, L., Fernie, A.R., and Kopka, J. (2005a). GC-MS libraries
for the rapid identification of metabolites in complex biological sam-
ples. FEBS Lett. 579: 1332–1337.
Schauer, N., Zamir, D., and Fernie, A.R. (2005b). Metabolic profiling of
leaves and fruit of wild species tomato: A survey of the Solanum
lycopersicum complex. J. Exp. Bot. 56: 297–307.
Semel, Y., Nissenbaum, J., Menda, N., Zinder, M., Krieger, U.,
Issman, N., Pleban, T., Lippman, Z., Gur, A., and Zamir, D. (2006).
Overdominant quantitative trait loci for yield and fitness in tomato.
Proc. Natl. Acad. Sci. USA 103: 12981–12986.
Somerville, C., and Koornneef, M. (2002). A fortunate choice: The
history of Arabidopsis as a model plant. Nat. Rev. Genet. 3: 883–889.
Stevens, R., Buret, M., Duffe, P., Garchery, C., Baldet, P., Rothan, C.,
and Causse, M. (2007). Candidate genes and quantitative trait loci
affecting fruit ascorbic acid content in three tomato populations. Plant
Physiol. 143: 1943–1953.
Sulpice, R., Tschoep, H., Von Korff, M., Bussis, D., Usadel, B.,
Hohne, M., Witucka-Wall, H., Altmann, T., Stitt, M., and Gibon, Y.
(2007). Description and applications of a rapid and sensitive non-
radioactive microplate-based assay for maximum and initial activity of
D-ribulose-1,5-bisphosphate carboxylase/oxygenase. Plant Cell En-
viron. 30: 1163–1175.
Tanksley, S.D., and McCouch, S.R. (1997). Seed banks and molecular
maps: Unlocking genetic potential from the wild. Science 277: 1063–
1066.
Tieman, D.M., Zeigler, M., Schmelz, E.A., Taylor, M.G., Bliss, P.,
Kirst, M., and Klee, H.J. (2006). Identification of loci affecting flavour
volatile emissions in tomato fruits. J. Exp. Bot. 57: 887–896.
Tikunov, Y., Lommen, A., de Vos, C.H.R., Verhoeven, H.A., Bino,
R.J., Hall, R.D., and Bovy, A.G. (2005). A novel approach for
nontargeted data analysis for metabolomics. Large-scale profiling of
tomato fruit volatiles. Plant Physiol. 139: 1125–1137.
Titok, V.V., Yurenkova, S.I., Titok, M.V., and Khotyljova, L.V. (2005).
Characterisation of energy metabolism during ontogenesis of fibre
flax in heterosis. Russ. J. Genet. 41: 539–544.
Tonsor, S.J., Alonso-Blanco, C., and Koornneef, M. (2005). Gene
function beyond the single trait: Natural variation, gene effects, and
evolutionary ecology in Arabidopsis thaliana. Review. Plant Cell En-
viron. 28: 2–20.
Van Camp, W. (2005). Yield enhancement genes: Seeds for growth.
Curr. Opin. Biotechnol. 16: 147–153.
van der Knaap, E., Sanyal, A., Jackson, S.A., and Tanksley, S.D.
(2004). High-resolution fine mapping and fluorescence in situ hybrid-
ization analysis of sun, a locus controlling tomato fruit shape, reveals a
region of the tomato genome prone to DNA rearrangements. Genetics
168: 2127–2140.
Varshney, R.K., Graner, A., and Sorrells, M.E. (2005). Genomics-
assisted breeding for crop improvement. Trends Plant Sci. 10:
621–630.
Wesley, S.V., et al. (2001). Construct design for efficient, effective and
high-throughput gene silencing in plants. Plant J. 27: 581–590.
Yoshiba, Y., Kiyosue, T., Nakashima, K., Yamaguchi-Shinozaki, K.,
and Shinozaki, K. (1997). Regulation of levels of proline as an osmo-
lyte in plants under water stress. Plant Cell Physiol. 38: 1095–1102.
Zamir, D. (2001). Improving plant breeding with exotic genetic libraries.
Nat. Rev. Genet. 2: 983–989.
Inheritance in Primary Metabolism 523
DOI 10.1105/tpc.107.056523; originally published online March 25, 2008; 2008;20;509-523Plant Cell
Pleban, Dani Zamir and Alisdair R. FernieNicolas Schauer, Yaniv Semel, Ilse Balbo, Matthias Steinfath, Dirk Repsilber, Joachim Selbig, Tzili
Mode of Inheritance of Primary Metabolic Traits in Tomato
This information is current as of August 31, 2018
Supplemental Data /content/suppl/2008/03/25/tpc.107.056523.DC1.html
References /content/20/3/509.full.html#ref-list-1
This article cites 84 articles, 27 of which can be accessed free at:
Permissions https://www.copyright.com/ccc/openurl.do?sid=pd_hw1532298X&issn=1532298X&WT.mc_id=pd_hw1532298X
eTOCs http://www.plantcell.org/cgi/alerts/ctmain
Sign up for eTOCs at:
CiteTrack Alerts http://www.plantcell.org/cgi/alerts/ctmain
Sign up for CiteTrack Alerts at:
Subscription Information http://www.aspb.org/publications/subscriptions.cfm
is available at:Plant Physiology and The Plant CellSubscription Information for
ADVANCING THE SCIENCE OF PLANT BIOLOGY © American Society of Plant Biologists