Embed Size (px)
Citation preview


MODEL 8405A VECTOR VOLTMETER
APPLICATION NOTE 91
HOW VECTOR MEASUREMENTS EXPAND
DESIGN CAPABILITIES -1 to 1,000 MHz
JANUARY 1968
TABLE OF CONTENTS
PAGE
Introduction
Feedback Amplifiers . . 2
Transmission Line Electrical Length 4
Matching Cable Electrical Length 6
Group Delay . 8
Resonance 12
Automatically Tuned Voltmeter 14
Amplitude Modulation Measurement 151 to 1000 MHz
Appendix I . . . . 17
Appendix II 18

MODEL 8405A VECTOR VOLTMETER
FREQ RANGE
Tunes over octave bands automatically.PHASE RANGE SWITCH
±6° full scale
APC UNLOCKED
Light goes out when 8405A is "locked1 PHASE FINDER
Returns PHASE RANGE to ±180° and METEROFFSET to 0° for direct readout of phase regard-less of the position of these controls.
CHANNEL SELECTOR SWITCH
4. AMPLITUDE RANGE SWITCH100 /j.volts full scale sensitivity90 dB range
8. PHASE METER OFFSET±180° in 10° steps
HIGH IMPEDANCE PROBES
IF OUTPUTReconstructs RF to 20 kHz for analysis with low-frequency instruments.

Introduction
Vector measurements can add a new dimension to de-sign information. "Vector" refers to the capability ofdefining two voltages not only by their magnitude butby the phase difference between them. Presented insimple graphical form (Figure 1), these parameters aremagnitudes "A" and "B" and the angle "SAB" betweenthem.
This note presents a variety of commonly encounteredsituations where vector measurements can provide im-portant insight into device and circuit behavior.
The techniques for making these vector measurementsinvolve the use of the Hewlett-Packard 8405A VectorVoltmeter, a two-channel RF millivoltmeter/phasemetercovering the 1- to 1,000-MHz frequency range. Theinstrument uses phase-locked coherent sampling totranslate the RF signals to 20-kHz signals that retainthe same wave shapes and the same amplitude andphase relationships as the original RF. Thus, the vectorvoltmeter can be considered much like an RF receiver,and the resultant performance characteristics are relatedto those you might find in a precision laboratory receiver.The various applications presented in this note drawupon the receiver-like properties of the vector volt-meter; for this reason, the salient characteristics of theinstrument will be discussed briefly.
•*• A
Figure 1. Measurement of voltage ratios are, in reality,"vector" measurements since a phase angle always existsin addition to magnitude information.
Wide Frequency Coverage. The frequency range of thevector voltmeter is 1 to 1,000 MHz, a part of the spec-trum where vector information is often required yethistorically has been difficult to obtain. Signal tuningof the instrument is simple and noncritical because the8405A phase-locks itself to the fundamental of the in-coming signal with only a coarse front-panel adjustmentcovering octave or greater spans. It can then followslowly drifting signals automatically.
High Sensitivity. Like a receiver, the vector voltmeteris a sensitive instrument, measuring down to 100 pVfull scale (residual noise is less than 10 /tV), and maxi-mum input is 10 V full scale with a 10:1 divider. Thus,readings can be taken over a 90- to 100-dB range —useful for measuring filters in both pass and rejectionbands as well as other high loss or high gain devices.
High Selectivity. Although the sampling system em-ployed in the 8405A results in wide frequency coverage,the actual measurement bandwidth in the 20-kHz IFpreceding the voltage and phase measuring sections isonly about 1 kHz, affording high selectivity. As a result,measurements are free from errors that might be en-countered with a wideband system if signal harmonicsor other spurious outputs were present. The illustrationopposite page 1 shows the 8405A Vector Voltmeterwith the major operating controls described.
In addition to the applications presented in this note,the vector voltmeter has proven to be immensely usefulfor measuring variables such as transistor parameters1,frequency drift2, complex impedance3, RF leakage, an-tenna characteristics4, and many other applications.
1 HP Application Note 77-1, Transistor ParameterMeasurements.
2 HP Application Note 77-2, Precision Frequency Com-parison.
3 HP Application Note 77-3, Complex ImpedanceMeasurements, 1 to 1,000 MHz.
4 "The RF Vector Voltmeter — An Important NewInstrument For Amplitude and Phase Measurementsfrom 1 MHz to 1,000 MHz." HP Journal, May 1966,pages 2-12. (Copies of these are available, at nocharge, from your local HP Sales Office or fromHewlett-Packard, Palo Alto.)
Page 1

Feedback Amplifiers
Feedback has considerable effect on the characteristicsof an amplifier. For example, when ft times the outputof an amplifier is fed back into the input of an amplifierwith gain G, the overall amplifier gain, K, becomesK = G/(l + /3G). See Figure 2a.
The open-loop gain, /?G, however, is frequency-sensitiveand varies in both phase and magnitude with changesin frequency. When [3G has unity magnitude (0 dB) anda phase angle of —180 degrees, the amplifier becomesunstable and starts to oscillate.
GAIN AND PHASE MARGINAn indication of the stability of a feedback amplifieris given by the phase margin and gain margin. Phasemargin is the difference between 180 degrees and thephase of /?G at the frequency for which the open-loopgain is 0 dB. Gain margin is the open-loop gain at thefrequency where the phase of /3G is—180 degrees. Typi-cal gain and phase margins are 10 to 40 dB and 20 to50 degrees, respectively, for stable amplifier operation.
MEASUREMENTThe vector voltmeter is ideally suited for high-frequencyfeedback amplifier analysis. The open-loop gain andphase can be read simultaneously over the frequencyrange from 1 to 1,000 MHz and over a 90-dB dynamicrange. The configuration for making open-loop gainmeasurements is given in Figure 2b.
INPUT
A procedure for making open-loop gain measurementsis as follows:
1. Break the circuit at the summing junction (pointwhere the output is fed back into the input asindicated in Figure 2a for an ideal feedbackamplifier).
2. Terminate the open-loop with impedances equalto the closed-loop impedances seen at the sum-ming junction of the closed-loop amplifier. SeeFigure 2b.
3. Set the signal generator at frequency of interestand secure probe A of the vector voltmeternear the input of the circuit. Probe A is usedto keep the vector voltmeter in phase-lock andmust have an input of at least 1.5 mV, 1—10MHz; 300 /./.V, 10 — 500 MHz; 500 //.V, 500 —1,000 MHz.
4. Measurements are made with channel B of thevector voltmeter. Either the HP 11576A 10:1Divider or the HP 10216A Isolator should beused on the 8405A probes to prevent errors due
GAIN =
TERMINATIONSFOR
OPEN-LOOP GAINMEASUREMENTS
Figure 2a. Schematic Diagram of Typical Feedback Circuit.Figure 2b. Test Setup for Making Open-Loop Gain and PhaseMargin Measurements.
Page 2

to variations in test point impedances. Placeprobe B at test point 1 as indicated in Figure2b. Using the phase zero control, adjust the8405A for a convenient phasemeter reference(preferably 0 degrees]. Note phase and ampli-tude readings.
5. Place probe B at test point 2 as indicated inFigure 2b. Note amplitude and phasemeter read-ings. The difference between these readingsand those of step 4 will give the open-loop gainof the feedback amplifier.
6. Increase the frequency of the signal generatoruntil the phase difference indicated by the vectorvoltmeter is ±180 degrees. The gain indicatedat this frequency is the open-loop gain margin.
7. Increase signal generator frequency until thegain indicated by the vector voltmeter is 0 dB.Subtract 180 degrees from the phase indicated atthis frequency for the open-loop phase-margin.
EXAMPLEFigure 3 shows the open-loop phase and gain for a tran-sistor amplifier circuit as measured with the vectorvoltmeter. The amplifier was unstable, as gain andphase margins indicate.
ACCURACYThere are three accuracy considerations when makingopen-loop gain measurements with the 8405A; 1) basic
-50
-100
£ -150V
If -I80|3-200
ing-250Q.
300
instrument accuracy, 2) test point impedance variation,and 3] open-loop gain terminations.
The procedure described above makes voltage ratioand phase difference measurements. The accuracy ofthe 8405A is best for this type of measurement. Sinceboth input and output measurements are made withchannel B, the absolute voltage and phase errors tendto cancel out. Voltage ratio can be measured within±0.2 dB and phase difference within ±1.5 to ±6 degreesover a 0- to 70-dB dynamic range.
Test point impedance is another source of error. Forinstance, amplitude and phase measurement errors areabout 2 percent and 10 degrees, respectively, with a testpoint impedance variation of 25 to 1,000 ohms. Theseerrors, however, are eliminated by using the HP 10216AIsolators or 11576A 10:1 Dividers on the probes formeasurements up to approximately 100 MHz. Above100 MHz, where circuits behave more like transmissionlines (and impedance levels are more related to thetransmission line characteristic impedance), use of theHP 11536A 50n Probe Tee is especially desirable.
If terminations for the open-loop amplifier do not dupli-cate the closed-loop summing junction impedance, theamplifier characteristics will change, thus causingincorrect measurements. If the necessary impedancecannot be determined by inspection or simple calcula-tion, it can be measured with the HP 4815A RF Imped-ance Meter (500 kHz —108 MHz) to ensure accurateimpedance duplication.
FREQ (MHz)
Figure 3. Phase and gain responses are plotted for a tran-sistor feedback ampl i f ie r from 1 to 40 MHz. Note that dataindicates ampl i f ie r is unstable.
Page 3
Transmission Line Electrical Length
Transmission lines have a vital role in all RF and pulsesystems. Although they are designed primarily for mini-mum SWR and attenuation, it is becoming more andmore important to determine their electrical length. Theelectrical length of a transmission line is critical inmany applications. Some of these are:
Feed lines for phased-array antennasCable for pulsed RF systemsPulse compression radarsComputers
It is also convenient to know the electrical length of adevice which has considerable phase shift, particularlywhen the device is relatively narrow band in nature.Typical examples of such devices are cascaded IF am-plifiers, distributed amplifiers, or crystal filters.
Time domain reflectometry5 is one way to measureelectrical length. However, in cases where both ends ofthe transmission line are available, a method employingphase measurements with the 8405A Vector Voltmeteroffers an important advantage — the ability to measureelectrical length as a function of frequency with highaccuracy and resolution.
Electrical length, I, is given by 6
10s A0
where Af = £2 - f if i (Hz) = an arbitrary frequency£2 (Hz) = a frequency above f i
A0 (degrees) = phase shift when the frequency ischanged from f j to f2
Determining electrical length using this equation becomeseasy because the unknowns, A0 and Af, can readilybe measured with the vector voltmeter and a frequency
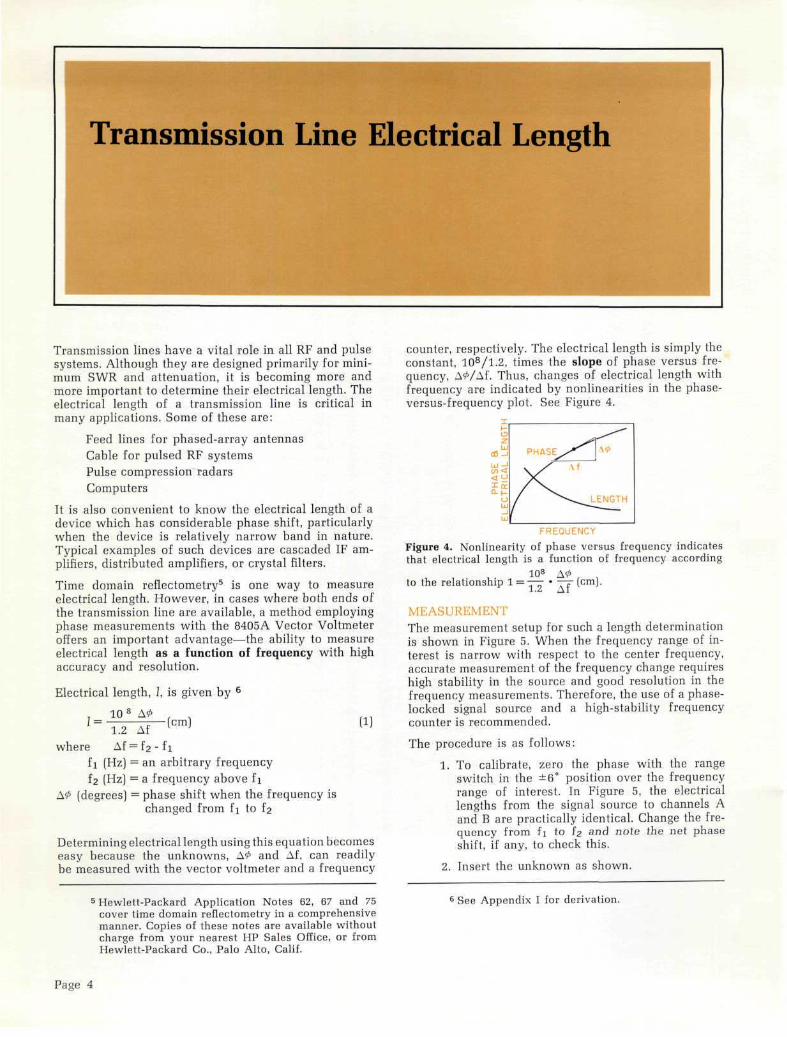
counter, respectively. The electrical length is simply theconstant, 108/1.2, times the slope of phase versus fre-quency, A0/Af. Thus, changes of electrical length withfrequency are indicated by nonlinearities in the phase-versus-frequency plot. See Figure 4.
FREQUENCY
Figure 4. Nonlinearity of phase versus frequency indicatesthat electrical length is a function of frequency according
108 A0 ,to the relationship 1 =T^ ' TT (cm)'
MEASUREMENTThe measurement setup for such a length determinationis shown in Figure 5. When the frequency range of in-terest is narrow with respect to the center frequency,accurate measurement of the frequency change requireshigh stability in the source and good resolution in thefrequency measurements. Therefore, the use of a phase-locked signal source and a high-stability frequencycounter is recommended.
The procedure is as follows:
1. To calibrate, zero the phase with the rangeswitch in the ±6° position over the frequencyrange of interest. In Figure 5, the electricallengths from the signal source to channels Aand B are practically identical. Change the fre-quency from f i to fz and note the net phaseshift , if any, to check this.
2. Insert the unknown as shown.
5 Hewlett-Packard Application Notes 62, 67 and 75cover time domain reflectometry in a comprehensivemanner. Copies of these notes are available withoutcharge from your nearest HP Sales Office, or fromHewlett-Packard Co., Palo Alto, Calif.
6 See Appendix I for derivation.
Page 4

608 FSIGNAL GENERATOR 8405A VECTOR VOLTMETER
I I549A849IA POWER 849IAlOdB SPLITTER IOdB
Figure 5. Test Setup for Measuring Electrical Length by Determining Phase Shift versus Frequency of Test Device.
3. Note the phase shift at fi and measure this fre-quency. Use the phase offset and the ±6° scalefor highest phase resolution.
4. Change to frequency £2 and measure it. Thefrequency increment should be small, or con-sistent with the accuracy of measuring f2-fi , inorder to obtain a good approximation of thephase slope at a given frequency. Again, usethe phase offset and the ±6° range to readphase. Calculate A0 and Af from steps 3 and 4after subtracting any phase shift noted in step1 from A0.
ACCURACYEquation (1) shows that the accuracy in measuring elec-trical length is a function of the error in measuring thequantities A0 and Af. The error in A0 is ~ 0.2 degree forA0 = 10 degrees or about 2 percent when the phase shiftis within the 12 degree single-phase range of the 8405AVector Voltmeter. If the phase shift is greater than 12
degrees, the error in phase is typically no greater than1.5 degrees over a 360 degree range for low loss (<20 dB)devices. Thus, the error, in this case, is a function ofthe measured phase shift.
Frequency increments should be small to keep A0 lessthan 12 degrees. In addition, accurate measurementsof electrical length at a given frequency point are pos-sible with small frequency increments. It is assumedthat a synchronized or stabilized signal source is usedto eliminate frequency drift errors. Accuracy of Af de-pends upon the resolution and accuracy of the frequencycounter used. The resolution and accuracy required willdepend upon the phase-versus-frequency slope, or elec-trical length, of the device. Counters are available thatprovide resolutions and accuracies to a few cycles.Consequently, the error in electrical length is usuallylimited to the vector voltmeter phase error of about±0.2 degree for A0 <12 degrees, or approximately ±2percent.
Page 5

Matching Cable Electrical Length
A common measurement requirement is matching twodevices, such as cables, to have the same electricallength. It is not sufficient for the device to have the exactmechanical length. Small variations in propagation ve-locity between the two will result in different electricallengths even though the mechanical dimensions are thesame.
A difficulty arises in the fabrication of matched cablesfor electrical length. Once the connectors have beenattached, it is time consuming to remove the connectorand re-trim the cables if the electrical lengths are notthe same. The method described here matches the cablesbefore the connectors are attached.
5246L/5253B COUNTER
The 8405A Vector Voltmeter measures the phase shiftbetween the incident wave on a cable and the wavereflected from the open-circuited end of the cable. Whenthe electrical length of two cables is the same, the phaseshift will be the same. The lengths could differ by anintegral number of wavelengths, but in the 1- to 1,000-MHz frequency range of the vector voltmeter this dif-ference is usually apparent by inspection.
MEASUREMENTThe test configuration appears in Figure 6. Note the useof the dual directional coupler for separating the inci-dent and reflected waves. The test frequency is not
8405A VECTOR VOLTMETER
Figure 6. Test Setup using Directional Couplers to Measure Phase Shift and, thus, Match Electrical Length of Two CablesVery Precisely.
Page 6

necessarily limited by the range of the dual directionalcoupler, for it will operate well below the stated fre-quency range. Coupling factor increases as frequency islowered (at a 6 dB/octave rate), and signal levels be-come smaller. This seldom limits measurement rangebecause the vector voltmeter has high sensitivity andwide dynamic range.
By stabilizing the signal generator with the synchronizer,the measurement is more precise. Stabilization is notusually required except at the higher frequencies andwhere the length of the cable is an appreciable part ofa wavelength.
The procedure for matching electrical lengths is asfollows:
1. Set up the instrument as shown in Figure 6.
2. Cut the cables to the approximate length de-sired. You can use time domain reflectometryfor this purpose (see HP Application Note 67).
3. Connect the shorter cable to the coupler andset an arbitrary phase reference.
4. Replace the shorter cable with the longer andtrim the longer cable until the phase readingsare the same. Install the connectors with careto preserve the equality of the electrical length.
EXAMPLETwo pieces of RG214/U cable about 2% feet long areto be made equal in electrical length. The first cable isconnected to the coupler. Using the phase offset and±6° scale, the phase is zeroed. The first cable is replaced
by the second and a + 4.5-degree phase shift is noted.(Note the phase will always be leading for the longerline.) The longer cable is carefully trimmed until thephase shift is zero, i.e., matches the reference phaseshift. The two cables are now matched with about ±0.2mm precision.
ACCURACYThe conditions of this test allow maximum phase ac-curacy. The signal amplitude is approximately the samein both channels and the 8405A probes are both in 50Qline. Furthermore, in the final stages of trimming thelonger cables, the phase range and the phase offsetswitches will remain in the same position for bothcables. Under these conditions, the accuracy dependsupon the resolution, repeatability, and short-term driftof the system, which is approximately ±0.2-degree. Withthe above phase resolution and repeatability, the accu-racy to which lengths can be matched is about
0.2-A = 5.56 • 10'4A
360
At a frequency of 1,000 MHz, the signal wavelength willbe ~30 cm and so accuracy will be about 0.2 mm.
The frequency drift of the source must be kept within±0.1 percent. The HP 606, 608, and 612 Signal Generatorsall have less than this amount of drift after a 10-minutewarmup. The drift can be monitored with a counter.The 8708A Synchronizer, available for both the 606Band 608F Signal Generators, provides for frequencystability of a few parts in 107.
Page 7
Group Delay
A device may introduce two types of distortion. Thefirst type is due to a frequency-sensitive amplituderesponse. The second type occurs from nonlinear phasevariations and may be a significant source of distortioneven when the amplitude response is flat.
Related to the second type is a phenomenon called"group delay," which is the transit time of signalsthrough a device. Group delay is defined as
Group Delay = to =3— [s)do) (2)
It is proportional to the slope of phase versus fre-quency. When the transit time or group delay is notconstant with frequency (phase versus frequency isnonlinear), phase relationships of the signal componentschange, and distortion results.
Group delay measurements are important in audio- andvideo-frequency amplifiers and networks. In transmis-sion systems with complex waveforms, such as TV orcarrier systems, a linear phase characteristic is neces-sary to prevent waveshape degradation.7
The 8405A Vector Voltmeter is well suited for groupdelay measurements. The frequency range of the vectorvoltmeter is 1 to 1,000 MHz, which includes many of thecommunications systems frequency allocations. Thephase offset control of the instrument permits a ±6° full-scale phase reading for high resolution measurements.
MEASUREMENTTo measure the group delay of an amplifier or other net-work, first set up the test equipment as in Figure 7. The8708A Synchronizer will help achieve greater precisionby stabilizing the signal generator. The procedure is asfollows:
1. With the test equipment in the configuration ofFigure 7, zero the phase shift with the rangeswitch on ±6°.
2. Insert the test network as in Figure 8.
7 S. Goldman, Frequency Analysis, Modulation andNoise, McGraw-Hill, 1948. P. 117-123.
3. Vary the frequency over the frequencies of in-terest and note the phase shift.
4. Calculate the group delay.
d<t> (rad) ~ (deg)360 Af (Hz) ' (3)
For convenience, choose Af to be some power of 10times 2.778 Hz. (The number, 2.778 is related to thereciprocal of 360 which, therefore, converts phase indegrees directly into time units.)
For example, if Af is 2.778 MHz,
= A0 (deg) _ =
360 • 2.778 • 106
tD (ns) = A<
• 10'9 (s) or
Thus, when Af = 2.778 MHz, the phase meter units arenanoseconds instead of degrees. In general, group delaycan be determined by changing input frequency in in-crements of 2.78 • 10" kHz and determining delay fromcorresponding phase meter changes with scale factor of10'n jus/deg, where n = 0, ±1, ±2, . . .
EXAMPLEThe device under test in this example was a broadbandamplifier. The test equipment was set up in the configu-ration of Figure 8. The frequency was varied in 2.778-MHz steps. Thus, the phase change in degrees repre-sented the group delay in nanoseconds for that fre-quency increment. The results of this test are plottedin Figure 9.
REFERENCE DELAY LINEIt is much easier to evaluate a device for phase non-linearity, or changes in group delay, if the mean slopeof the phase-versus-frequency curve is as close to zeroas possible so that the changes in slope become devia-tions from a near 0-degree phase reference. This can bedone by inserting into the reference channel a line with
Page 8

608 FSIGNAL GENERATOR 8405A VECTOR VOLTMETER
Figure 7. Equipment Connections for Calibrating Vector Voltmeter for Group Delay Measurements.
608 FSIGNAL GENERATOR 8405A VECTOR VOLTMETER
© ®
PROBE
II549A DEVICE UNDER TEST 1 1POWFR , 1 U
908A 50n TERM
L. _j I536A TEE
5246L/ 5253B COUNTER
HXXWJ167"
Figure 8. Measurement of Group Delay on Device Inserted in Setup of Figure 7.
Page 9
20
oc_)LjJ
14-
_iLUQ
-
10-
200FREQUENCY (MHz)
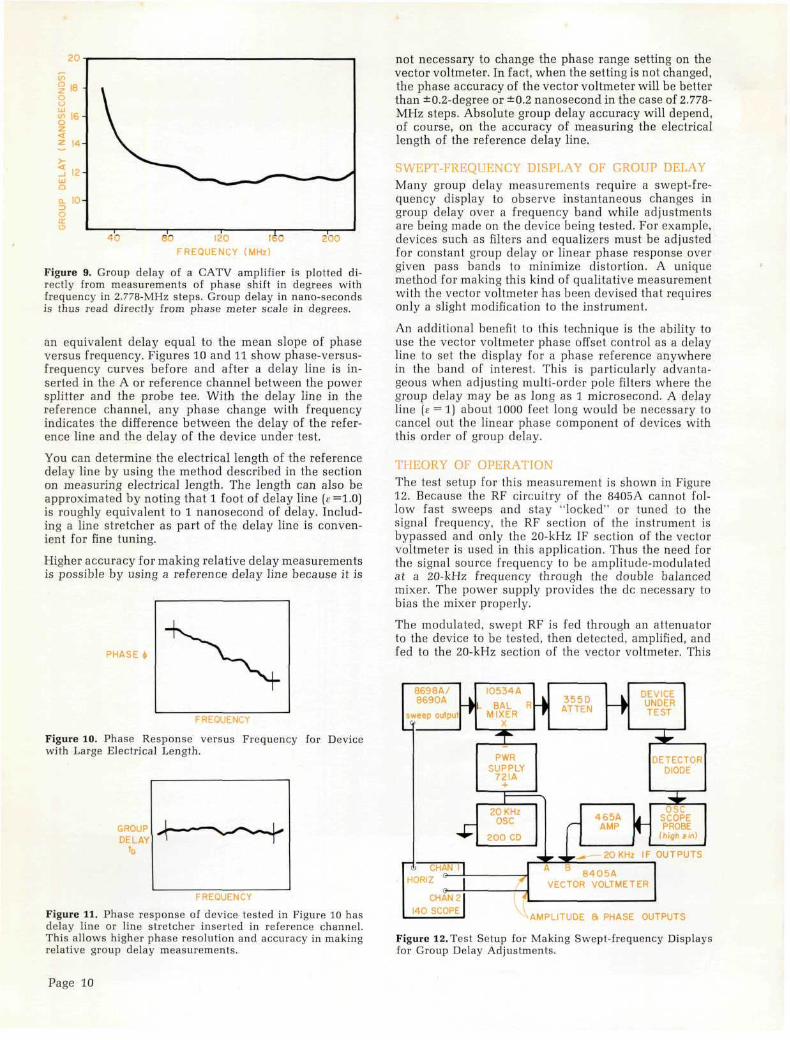
Figure 9. Group delay of a CATV amplif ier is plotted di-rectly from measurements of phase shift in degrees withfrequency in 2.778-MHz steps. Group delay in nano-secondsis thus read directly from phase meter scale in degrees.
an equivalent delay equal to the mean slope of phaseversus frequency. Figures 10 and 11 show phase-versus-frequency curves before and after a delay line is in-serted in the A or reference channel between the powersplitter and the probe tee. With the delay line in thereference channel, any phase change with frequencyindicates the difference between the delay of the refer-ence line and the delay of the device under test.
You can determine the electrical length of the referencedelay line by using the method described in the sectionon measuring electrical length. The length can also beapproximated by noting that 1 foot of delay line (f =1.0)is roughly equivalent to 1 nanosecond of delay. Includ-ing a line stretcher as part of the delay line is conven-ient for fine tuning.
Higher accuracy for making relative delay measurementsis possible by using a reference delay line because it is
PHASE
Figure 10. Phase Response versus Frequency for Devicewith Large Electrical Length.
GROUPDELAY
to
^EQUENCY
Figure 11. Phase response of device tested in Figure 10 hasdelay line or line stretcher inserted in reference channel.This allows higher phase resolution and accuracy in makingrelative group delay measurements.
not necessary to change the phase range setting on thevector voltmeter. In fact, when the setting is not changed,the phase accuracy of the vector voltmeter will be betterthan ±0.2-degree or ±0.2 nanosecond in the case of 2.778-MHz steps. Absolute group delay accuracy will depend,of course, on the accuracy of measuring the electricallength of the reference delay line.
SWEPT-FREQUENCY DISPLAY OF GROUP DELAYMany group delay measurements require a swept-fre-quency display to observe instantaneous changes ingroup delay over a frequency band while adjustmentsare being made on the device being tested. For example,devices such as filters and equalizers must be adjustedfor constant group delay or linear phase response overgiven pass bands to minimize distortion. A uniquemethod for making this kind of qualitative measurementwith the vector voltmeter has been devised that requiresonly a slight modification to the instrument.
An additional benefit to this technique is the ability touse the vector voltmeter phase offset control as a delayline to set the display for a phase reference anywherein the band of interest. This is particularly advanta-geous when adjust ing multi-order pole filters where thegroup delay may be as long as 1 microsecond. A delayline (e = 1) about 1000 feet long would be necessary tocancel out the linear phase component of devices withthis order of group delay.
THEORY OF OPERATIONThe test setup for this measurement is shown in Figure12. Because the RF circuitry of the 8405A cannot fol-low fast sweeps and stay "locked" or tuned to thesignal frequency, the RF section of the instrument isbypassed and only the 20-kHz IF section of the vectorvoltmeter is used in this application. Thus the need forthe signal source frequency to be amplitude-modulatedat a 20-kHz frequency through the double balancedmixer. The power supply provides the dc necessary tobias the mixer properly.
The modulated, swept RF is fed through an attenuatorto the device to be tested, then detected, amplified, andfed to the 20-kHz section of the vector voltmeter. This
I 355DATTEN
If
UNDERTEST
HORIZ
140 SCOPE
•̂
\N I
\N2
F201'osc
200 CD
•* [465AAMP f
8405AVECTOR VOLTMETER
F OUTPUTS
^AMPLITUDE a PHASE OUTPUTS
Figure 12. Test Setup for Making Swept-frequency Displaysfor Group Delay Adjustments.
Page 10
section measures the phase difference between the de-tected 20-kHz signal and the 20-kHz modulating orreference signal. In this case, the demodulated 20-kHzsignal has the same phase relationship to the reference20-kHz signal as the phase-shifted carrier frequencyhas to the reference RF signal applied to the device.The ±180° phase offset switch of the 8405A is con-veniently used as a variable phase shifter, or delay line,to present an easily readable display on an oscilloscope.It is usually desirable to balance out the linear phasecomponent of the phase-versus-frequency response sothat the nonlinear effects can be displayed against thehorizontal graticule lines of the oscilloscope. This allowsfor expansion of the display with the oscilloscope sen-sitivity controls and for calibration, if desired, of thedisplay in units of group delay per centimeter.
The inputs to the vector voltmeter are to the rear panelterminals labeled "20 kHz IF output." Circuit boardsA3, A4, A10 must be removed to disable certain circuitrywhen using this method. The phase and amplitude out-puts of the vector voltmeter are fed into the vertical
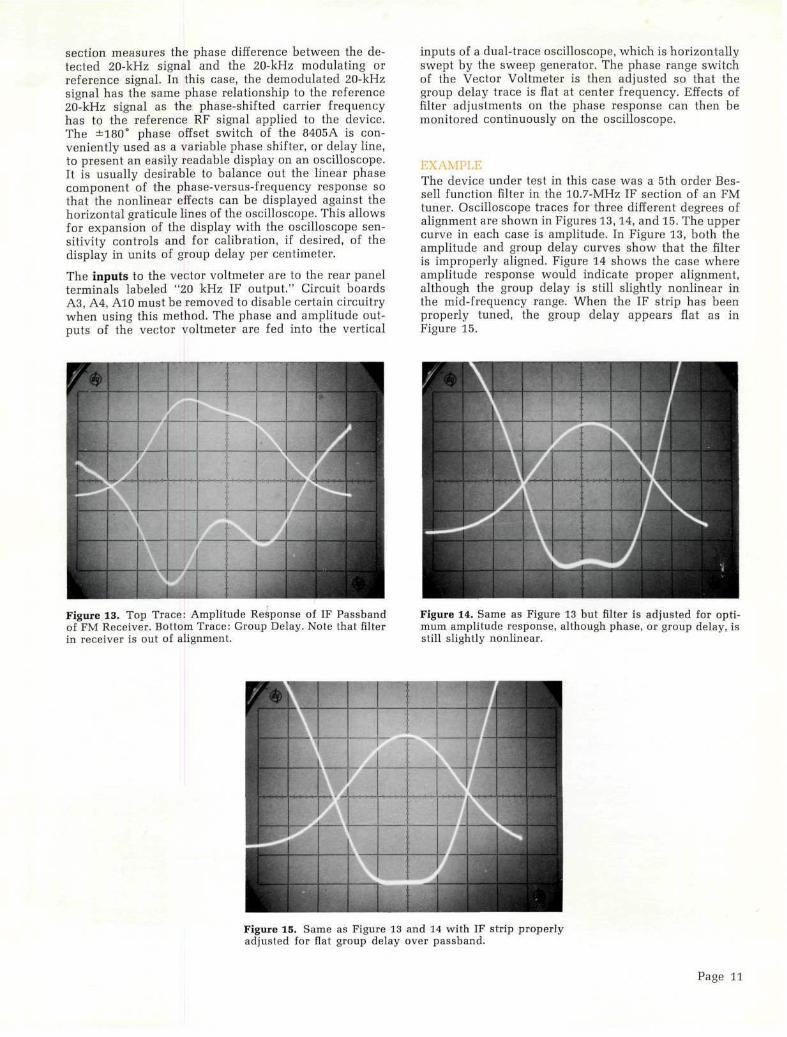
Figure 13. Top Trace: Amplitude Response of IF Passbandof FM Receiver. Bottom Trace: Group Delay. Note that filterin receiver is out of alignment.
inputs of a dual-trace oscilloscope, which is horizontallyswept by the sweep generator. The phase range switchof the Vector Voltmeter is then adjusted so that thegroup delay trace is flat at center frequency. Effects offilter adjustments on the phase response can then bemonitored continuously on the oscilloscope.
EXAMPLEThe device under test in this case was a 5th order Bes-sell function filter in the 10.7-MHz IF section of an FMtuner. Oscilloscope traces for three different degrees ofalignment are shown in Figures 13,14, and 15. The uppercurve in each case is amplitude. In Figure 13, both theamplitude and group delay curves show that the filteris improperly aligned. Figure 14 shows the case whereamplitude response would indicate proper alignment,although the group delay is still slightly nonlinear inthe mid-frequency range. When the IF strip has beenproperly tuned, the group delay appears flat as inFigure 15.
Figure 14. Same as Figure 13 but filter is adjusted for opti-mum amplitude response, although phase, or group delay, isstill slightly nonlinear.
Figure 15. Same as Figure 13 and 14 with IF strip properlyadjusted for flat group delay over passband.
Page 11

Resonance
The 8405A Vector Voltmeter can be used to determinethe resonant frequency of tuned circuits, filters, oscil-lators and other circuits in the frequency range from1 to 1,000 MHz. With the 8405A, one can locate theresonant frequency by detecting the zero-degree phasecrossover. Historically, the technique has been to locatea maximum or minimum of the amplitude response. Thephase detection method is a much more accurate andsensitive method because phase is usually changing veryrapidly near resonance, while the amplitude responsecurve in this region is often essentially flat.
MEASUREMENTA typical measurement setup is shown in Figure 5. (The8708A Synchronizer is used to phase-lock the signalgenerator for greater stability.) The measurement pro-cedure is as follows:
1. Set up the test configuration as in Figure 5,leaving out the test device and connecting the Bchannel 11536A Probe Tee directly to the powersplitter.
2. Zero the phase meter.
3. Insert the test device.
4. Read phase shift versus frequency.
Resonance is defined as the frequency at which thephase shift through the device equals the 0-degree phasereference set during Step 2. The circuit is purely resis-tive at the 0-degree phase crossover point, the reactivecomponents having canceled out, and is thus resonant.To distinguish between a series or parallel-type reso-nance, note whether the amplitude response has peakedto a maximum or minimum.
EXAMPLEThe test device for this example was an HP 8442A 20-MHz narrow band Crystal Filter. Its amplitude andphase characteristics are plotted in Figure 16. The ex-panded scale of Figure 17 shows the curves in greaterdetail near resonance. Note that as the phase variesfrom +6° to —6° (ful l scale on the most sensitive phase
range), the amplitude variation is imperceptible. It isthe extreme phase sensitivity that allows the resonantfrequency to be determined with very high resolution.
m-20-•D
z0_
UJ
-80
MAGNITUDE
400
-200
-400
-6 -5 -4 -2 -I KHz fo I KHz 2
Figure 16. Amplitude and Phase Response of Narrow Band20-MHz Crystal Filter.
-700 -500 -300 -100 fo 100Hz
300 500-5
700
Figure 17. Plot of crystal f i l ter of Figure 16 is greatly ex-panded near resonant frequency. Note the high phase versusfrequency sensitivity which allows determination of reso-nant frequency with exceptional resolution.
Page 12

The Q of the filter can also be obtained from this test.The Q is equal to the resonant frequency divided by the3-dB bandwidth. The Q was about 9100 for the HP8442A Filter.
ACCURACYThis technique assumes that the electrical length atresonance of the device under test is negligible. A pos-sible source of error, however, is the shift in phase fromthe 0-degree resonance phase point due to the electricallength added by the physical length of the device. Thedevice is assumed to resonate at the center plane of itsphysical configuration. The physical length is composedof transmission lines carrying the signal to the resonantstructure. This effect upon accuracy will depend upon(1) the resonant frequency wavelength (2) the slope ofthe phase-versus-frequency curve of the network nearresonance (3) and the physical length of the device. Youcan estimate the effect of the electrical length phase
shift on the resonant frequency determination by mea-suring the physical length of the device, converting thisto phase shift at the resonant frequency, and by notinghow much this phase shift would affect frequencyaccuracy.
In this example, the wavelength is about 1500 cm at 20MHz, the electrical length is approximately 15 cm, andthe phase slope is about 15 Hz/deg. This results in afrequency accuracy of
15 • 360 deg1500 15 Hz/deg = ±54 Hz
54107
= 0.0003'
Note that the very high sensitivity of the phase response(=15 Hz/deg) as compared to the amplitude responseaccounts for the capability to determine the resonantfrequency accurately.
Page 13

Automatically Tuned Voltmeter
Several of the 8405A Vector Voltmeter design featurescombine to make it an exceptionally easy-to-use tunedvoltmeter over its frequency range from 1 to 1,000 MHz.Channel A locks on the largest input signal to the vectorvoltmeter. Channel B responds to signals only at thefrequency to which channel A is locked. The 3-dB band-width is 1 kHz. The vector voltmeter also has a broadthree-decade frequency range and greater than 90 dBdynamic range. With the combination of automatic sig-nal tuning and high measurement selectivity, measure-ments are made easily and accurately. An example ofits use to measure a notch filter is discussed below.Measurement with the vector voltmeter is then com-pared with a broadband voltmeter. The comparisonshows the erroneous results that can be obtained be-cause the broadband voltmeter responds to harmonicsof the signal source output.
harmonic content to cause considerable error in mea-surements of this type unless a tuned voltmeter such asthe 8405A is used. The vector voltmeter shows that thetrue rejection is approximately —50 dB. The test con-figuration for this example is the same as Figure 8.
The operation of the vector voltmeter to obtain this datawas extremely simple. It was only necessary to set thefrequency range switch to the proper octave setting,tune the signal source through the band, and change theamplitude range switch as necessary. The vector volt-meter automatically locked to the signal source andmeasured the response at that frequency only.
EXAMPLEThe filter used in this example is a notch filter designedto reject a 21.6-MHz signal. It is used to suppress thesecond harmonic of a signal generator. Its precise fre-quency response, especially at the rejection frequency,must be known in this application.
For a comparison, the frequency response of the filterwas plotted using both a broadband voltmeter and thevector voltmeter. Since the broadband voltmeter wouldrespond to signal source frequencies other than thefundamental, it was expected to show an incorrect pic-ture of the rejection of the filter. This was found to bethe case.
The two frequency response curves are plotted in Figure18. The lower curve is the data plotted using the vectorvoltmeter; the upper, the broadband voltmeter. At themaximum rejection frequency of about 21.6 MHz, theamplitude response as measured by the broadband volt-meter was approximately 17 dB in error. The broadbandvoltmeter was also measuring the response of the filterat 43.2 and 64.8 MHz, i.e., the 2nd and 3rd harmonicsof the signal source. Most signal generators have enough
o -
8 -
S i 6 Hzot- 2
zUlI- 32-H
40-
48-
12
BROADBAND VOLTMETER
VECTOR VOLTMETER
14 16 18 20 22 24
FREQUENCY (MHz)
26 28 30
Figure 18. Plot of magnitude response of fi l ter using 1 kHzbandwidth vector voltmeter and general purpose broad-band voltmeter. Difference is due to response of broadbandvoltmeter to harmonics of unsuf f i c i en t ly fi l tered signal source.
Page 14

IAmplitude Modulation
The 8405A Vector Voltmeter allows convenient, directmeasurement of peak amplitude modulation on signalsfrom 1 to 1,000 MHz on a low frequency (20 kHz), highinput impedance oscilloscope. It translates signals in this3-decade RF range down to 20 kHz. In translation, therelation of the sidebands to the carrier is preserved forsideband frequencies up to about 10 kHz.
This method of measuring AM offers several advantagesover other methods in this frequency range. It is quicklyand easily made. AM is displayed on a low-frequencyoscilloscope even at frequencies as high as 1,000 MHz.Other methods, such as using crystal detectors to de-modulate, require working in the square-law range,(requiring mathematical conversions), or in the linearrange where selection of crystals with wide dynamicrange is difficult.
The vector voltmeter is, in essence, a broadband receiverwith wide dynamic range that can display AM on anycarrier from 1 to 1,000 MHz through its 20-kHz output.
Amplitude modulation on weak carrier signals (100 /J.V]can be measured with it because of its high sensitivity.In addition, as a receiver, the vector voltmeter auto-matically tunes to the signal source through a phase-lock feedback circuit and, thus, does not require manualretuning to follow any drift in the signal source.
Percent modulation can be conveniently determined asfollows:
1. Connect the instruments as in Figure 19.
2. Calibrate the oscilloscope trace with the un-modulated carrier. The peak magnitude corre-sponds to 100 percent AM. For example, if thepeak carrier voltage were 10 cm, the percentmodulation would be 10%/cm.
608 F 200 CDI40A OSCILLOSCOPE
• © © «
9w®m
8405A VECTOR VOLTMETER
Figure 19. Test setup is used to check percent AM modulation of signal generators from 1 to 1,000 MHz by displaying 20-kHzIF signal of vector voltmeter on oscilloscope.
Page 15

3. Offset the peak of the unmodulated carrier tothe lowest graticule line of the oscilloscope.The offset capabilities of most oscilloscopeswill limit the full scale amplitude to 100 per-cent AM full scale.
4. Modulate the carrier and read percent modula-tion from the oscilloscope trace.
By this procedure, the percent modulation of the tracein Figure 20 can be read directly as 50 percent inFigure 21.
LOW LEVEL MODULATIONFor very low levels of modulation it is possible to in-crease the resolution to a few percent. This requires theuse of the Hewlett-Packard 1406A Differential Amplifierplug-in for the 140 HP/or 141 Oscilloscope. This plug-inhas the dc offset capability required to position the ex-panded modulating signal on the oscilloscope. It alsohas dc stabilization, which eliminates any dc drift ofthe trace.
The following steps briefly outline the method.
1. Set up the instruments as shown in Figure 19using the 1406A Differential Amplifier.
2. Set the peak magnitude of the CW signal to fullscale on the oscilloscope.
3. Increase the vertical sensitivity of the oscillo-scope by the desired multiple (e. g., if the cali-bration was 10% AM per cm, a sensitivitychange from 10 mV/cm to 1 mV/cm on theoscilloscope would result in 1% AM/cm.)
4. Using the positioning adjustment, offset thetrace until the peak of the unmodulated carrieris at the center graticule line.
5. Modulate the carrier and note the percent mod-ulation.
Figure 22 shows about 1 percent modulation, illustrat-ing the sensitivity of the method.
100-
Figure 20. 50% AM on 400-MHz carrier is observed on linefrequency oscilloscope. 400-MHz carrier is reconstructed to20-kHz output signal.
0 —
Figure 21. Oscilloscope offset technique allows percent AMto be read directly off oscilloscope graticule.
1%
t%AM
I
Figure 22. Low levels of AM modulation are observed withuse of sensitive differential amplifier scope plug-in with dcoffset capability.
Page 16

Appendix I
Derivat ion of the fo rmula for de te rmin ing electr icallength.
= number of wavelengths at frequency f j
and
300 • 106 .(meters);
then
I =
But
= electrical length
(2)
(3)
(4)
where
300 • 106 . .A 2 ~ 7 (meters)
(5)
f2 being the next higher frequency above fi whichcauses a phase change of A0.
From (3) and (4)
A0
ni +A0360 __ A! f2
~" A2 " fl
(6]
(7)
A0
1 +360 .
f l
Solving for
A0360
Since 1 = ni
A0
I =360
^ -1
Substituting (2) into (10)
A0
(8)
(9)
(10)
1 = 360 300 • 106 300 • 106 A0
fl- 1 fl 360
(11)
1 =108 A0 10s A01.2 ' f 2 - f i ' 1.2 ' Af
(cm).
(12)
Page 17

Appendix II
SPECIFICATIONS
INPUT CHARACTERISTICS GENERAL
Instrument Type: Two-channel sampling RF millivoltmeter-phasemeterwhich measures voltage of two signals and simultaneously displaysthe phase angle between the two signals.
Frequency Range: 1 MHz to 1 GHz in 21 overlapping octave bands(lowest band covers two octaves).
Tuning: Automatic within each band. Automatic phase control (ARC)circuit responds to the Channel A input signal. Search and lock time,approximately 10 millisec.
Voltage Range
Channel A:1 to 10 MHz: 1.5 mV to 1 V rms.10 to 500 MHz: 300 /*V to 1 V rms.500 to 1,000 MHz: 500 /iV to 1 V rms.Can be extended by a factor of 10 with 11576A 10:1
Divider.
20 kHz IF Output (each channel): Reconstructed signals, with 20 kHzfundamental components, having the same amplitude, waveform,and phase relationship as the input signals. Output impedance, 1,000ohms in series with 2,000 pF; BNC female connectors.
Recorder Output:Amplitude: 0 to + 1 V dc ± 6% open circuit, proportional to volt-
meter reading in volts. Output tracks voltage reading within± 0.5% of full scale. Output impedance, 1,000 ohms; BNCfemale connector.
Phase: 0 to ± 0.5 V dc ± 6%, proportional to phasemeter reading.External load greater than 10,000 ohms affects recorder outputand meter reading less than 1%. Output tracks meter readingwithin ± 1.5% of end scale; BNC female connector.
Channel B: 100 /iV to 1 V rms full scale (input to Channel Arequired); can be extended by a factor of 10 with 11576A10:1 Divider.
Input Impedance (nominal): 0.1 megohm shunted by approximately 2.5pF; 1 megohm shunted by approximately 2 pF when 11576A 10:1Divider is used; 0.1 megohm shunted by approximately 5 pF when10216A Isolator is used. AC coupled.
Isolation Between Channels:1 to 300 MHz-, greater than 100 dB.300 to 1,000 MHz: greater than 80 dB.
Maximum AC Input: 2 V peak.
Maximum DC Input: ± 50 V.
RFI: Conducted and radiated leakage limits are below those specifiedin MIL-I-6181D and MIL-I-16910C except for pulses emitted fromprobes. Spectral intensity of these pulses is approximately 60 /W/MHz; spectrum extends to approximately 2 GHz. Pulse rate variesfrom 1 to 2 MHz.
Power: 115 or 230 V ± 10%, 50 to 400 Hz, 35 watts.
Weight: Net, 30 Ib (13,5 kg). Shipping, 35 Ib (15,8 kg).
Dimensions: 18% x 7 x 16% in. (467 x 177 x 425 mm).
Page 18

VOLTMETER CHARACTERISTICS PHASEMETER CHARACTERISTICS
Meter Ranges: 100 ^V to 1 V rms full scale in 10-dB steps. Meter in-dicates amplitude of the fundamental component of the input signal.
Voltage Accuracy: When accessories are used on one or both probes.
Accessory
HP 11536ASOn Feed-
through Tee
HP 11576A10:1 Divider
HP 10216AIsolator
Impedance
50!
Freq.
1-750 MHz1-1000 MHz
1
SWR
<1.15<1.20
1 M« f"1 2 pFI I on
anini/ fn 7 *>rt
T(MHl)
from 5-100 MHz
lOOkfif"! 5pFl 132
T(MHz)
from 15-200 MHz
Frequency
1-100 MHz
100-300 MHz
300-1000 MHz
1-100 MHz
1-200 MHz
Accuracy
±2%of full scale
±6%of f.s.
± 12%of f.s.*
+ 6%of f.s.
±6%of f.s.
* Above 300 mV and 800 MHz add + 5%.
Voltage Ratio Accuracy: 0.2 (IB.
Residual Noise: Less than 10 ^V as indicated on the meter.
Bandwidth: 1 kHz.
Phase Range: 360°, indicated on zero-center meter with end-scaleranges of ± 180, ± 60, ± 18, and ± 6°. Meter indicates phasedifference between the fundamental components of the input signals.
Resolution: 0.1° at any phase angle.
Meter Offset: ± 180° in 10° steps.
Phase Accuracy: At single frequency 1.5° (equal signal levels at ChannelA and B).
Phase accuracy vs. frequency and signal level.
Accessory
HP 11536A50" Feed-
through Tee
HP 11 576 A10:1 Divider
HP 10216AIsolator
Frequency
1-500 MHz
500-1000 MHz
1-100 MHz
1-200 MHz
Voltage RangeChannel A or B
100 /W to 300 mV
100 /iV to 100 mV
1 mV to 3 V
100 MV to 300 mV
Phase Accuracy
±3°
~+~ 3°
±4°
±6°
Phase Jitter vs. Channel B Input LevelGreater than 700 ifl-. Typically less than 0.1° p-p.125 to 700 /iV: Typically less than 0.5° p-p.20 to 125 ^V: Typically less than 2° p-p.
Page 19

HEWLETT [hO] PACKARDPRINTED IN U.S.A.