Embed Size (px)
Citation preview
1
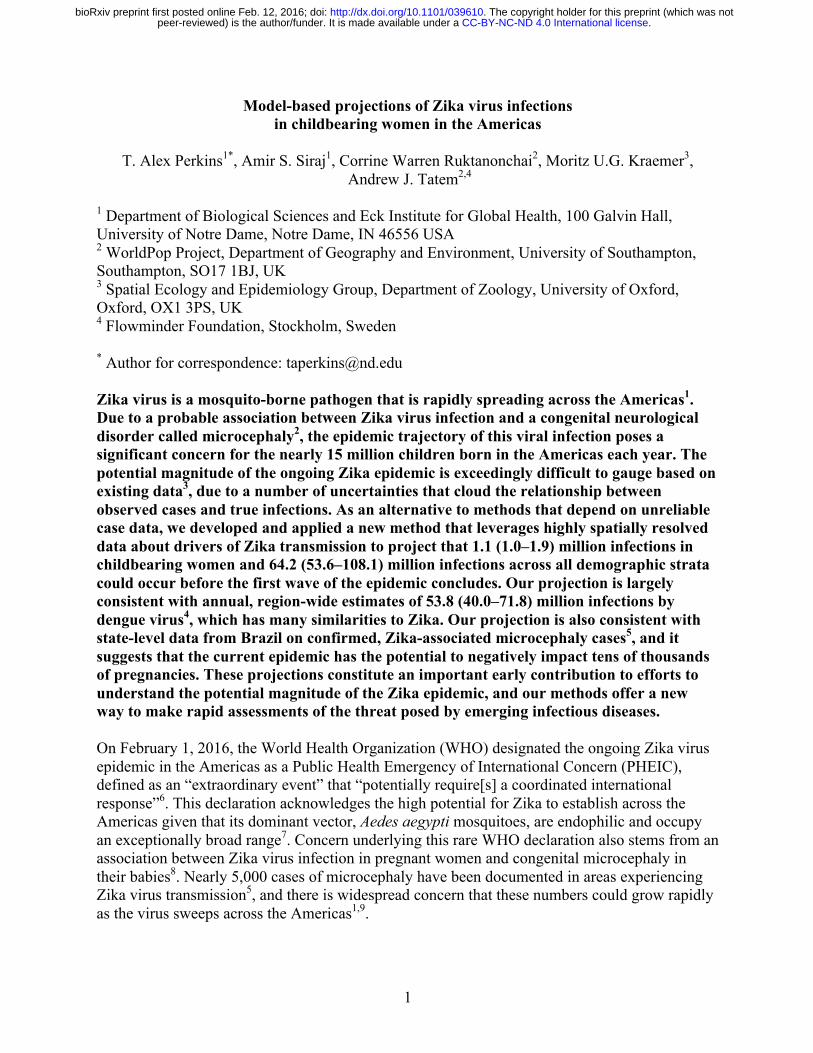
Model-based projections of Zika virus infections in childbearing women in the Americas
T. Alex Perkins1*, Amir S. Siraj1, Corrine Warren Ruktanonchai2, Moritz U.G. Kraemer3,
Andrew J. Tatem2,4
1 Department of Biological Sciences and Eck Institute for Global Health, 100 Galvin Hall, University of Notre Dame, Notre Dame, IN 46556 USA 2 WorldPop Project, Department of Geography and Environment, University of Southampton, Southampton, SO17 1BJ, UK 3 Spatial Ecology and Epidemiology Group, Department of Zoology, University of Oxford, Oxford, OX1 3PS, UK 4 Flowminder Foundation, Stockholm, Sweden * Author for correspondence: [email protected] Zika virus is a mosquito-borne pathogen that is rapidly spreading across the Americas1. Due to a probable association between Zika virus infection and a congenital neurological disorder called microcephaly2, the epidemic trajectory of this viral infection poses a significant concern for the nearly 15 million children born in the Americas each year. The potential magnitude of the ongoing Zika epidemic is exceedingly difficult to gauge based on existing data3, due to a number of uncertainties that cloud the relationship between observed cases and true infections. As an alternative to methods that depend on unreliable case data, we developed and applied a new method that leverages highly spatially resolved data about drivers of Zika transmission to project that 1.1 (1.0–1.9) million infections in childbearing women and 64.2 (53.6–108.1) million infections across all demographic strata could occur before the first wave of the epidemic concludes. Our projection is largely consistent with annual, region-wide estimates of 53.8 (40.0–71.8) million infections by dengue virus4, which has many similarities to Zika. Our projection is also consistent with state-level data from Brazil on confirmed, Zika-associated microcephaly cases5, and it suggests that the current epidemic has the potential to negatively impact tens of thousands of pregnancies. These projections constitute an important early contribution to efforts to understand the potential magnitude of the Zika epidemic, and our methods offer a new way to make rapid assessments of the threat posed by emerging infectious diseases. On February 1, 2016, the World Health Organization (WHO) designated the ongoing Zika virus epidemic in the Americas as a Public Health Emergency of International Concern (PHEIC), defined as an “extraordinary event” that “potentially require[s] a coordinated international response”6. This declaration acknowledges the high potential for Zika to establish across the Americas given that its dominant vector, Aedes aegypti mosquitoes, are endophilic and occupy an exceptionally broad range7. Concern underlying this rare WHO declaration also stems from an association between Zika virus infection in pregnant women and congenital microcephaly in their babies8. Nearly 5,000 cases of microcephaly have been documented in areas experiencing Zika virus transmission5, and there is widespread concern that these numbers could grow rapidly as the virus sweeps across the Americas1,9.
.CC-BY-NC-ND 4.0 International licensepeer-reviewed) is the author/funder. It is made available under aThe copyright holder for this preprint (which was not. http://dx.doi.org/10.1101/039610doi: bioRxiv preprint first posted online Feb. 12, 2016;
2
A number of uncertainties surround the future of Zika in the Americas, including uncertainty about the causal relationship between Zika and microcephaly10, as well as unexplained discrepancies in estimated microcephaly rates in different regions. Adding to these uncertainties is poor understanding of how many childbearing women may be at risk of Zika virus infection and possible microcephaly3. This latter uncertainty is extremely difficult to address directly, because an estimated 80% of infections are asymptomatic11 and diagnostics for ascertaining recent Zika virus infection are further confounded in areas where related arboviruses circulate1. Compounding these problems are variable access to healthcare and inconsistent case reporting12. These numerous uncertainties largely invalidate methods that depend on case data13 and render the interpretation of epidemiological patterns a formidable challenge. To quantify the potential magnitude of the ongoing Zika epidemic, we formulated and applied a method for projecting location-specific epidemic attack rates on highly spatially resolved human demographic projections14. The central concept behind our approach is that of the “first-wave” epidemic. Zika and other arboviruses have been known to exhibit explosive outbreaks, infecting as much as 75% of a population in a single year15. Classical epidemiological theory predicts that some proportion of a population will always remain uninfected during an epidemic, because herd immunity eventually causes the epidemic to burn out16. A related prediction of this theory is that the proportion infected prior to burnout (i.e., the epidemic attack rate) has a one-to-one relationship with the basic reproduction number, R0
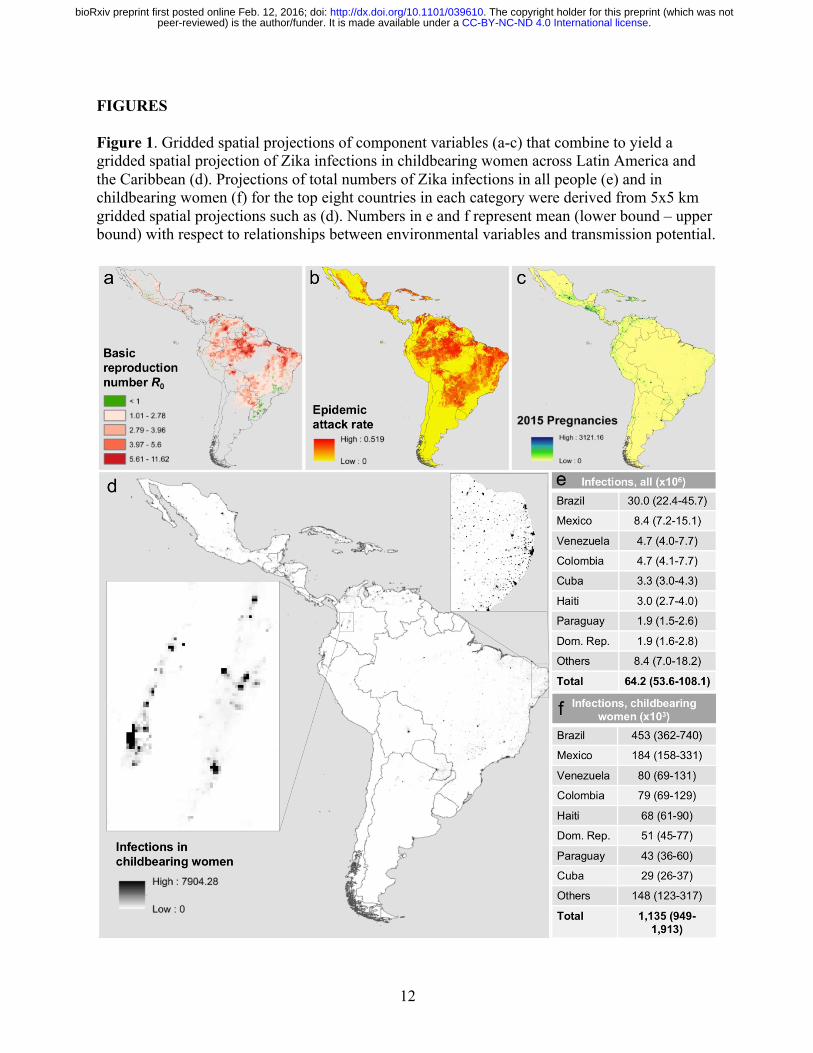
17. The latter quantity has a well-established mechanistic formulation for mosquito-borne pathogens18 that easily accommodates the effects of environmental drivers on transmission19. For example, the incubation periods of viruses in the Ae. aegypti mosquitoes that transmit Zika virus have a well-characterized relationship with temperature20, which can in turn be used to inform calculations of R0. Together with similar relationships for other transmission parameters, it is possible to characterize R0, a fundamental measure of transmission potential, as a function of local environmental conditions21,22. We leveraged these classic results from epidemiological theory to first perform highly spatially resolved calculations of R0 (Fig. 1a) and then to translate those calculations into location-specific projections of first-wave epidemic attack rates (Fig. 1b). Because values of transmission parameters for Zika virus are unknown, we used well-established parameter values for dengue virus in our R0 calculations. We furthermore calibrated our attack rate projections to match empirically estimated attack rates from 12 chikungunya epidemics and one Zika epidemic (Extended Data Table 1). These calibration steps enhanced the realism of the model with respect to the intensely heterogeneous nature of arbovirus transmission23 and with respect to differences in human-mosquito contact associated with economic disparities24. The final step in our analysis was to apply our projected attack rates to spatially gridded demographic projections (Fig. 1c) to obtain expected numbers of infections in the overall population and among childbearing women in particular (Fig. 1d). All calculations were performed on a 5x5 km grid across Latin America and the Caribbean. Our results are among the very first projections of the potential magnitude of the ongoing Zika epidemic in the Americas. In total, we project that 64.2 (53.6–108.1) million people in the Americas could be infected during the first wave of the epidemic (Fig. 1e). This total is consistent with an estimate of 53.8 (40.0–71.8) million dengue infections in this region in 2010 alone4. Indeed, it is reasonable to expect Zika incidence to be higher than dengue incidence given
.CC-BY-NC-ND 4.0 International licensepeer-reviewed) is the author/funder. It is made available under aThe copyright holder for this preprint (which was not. http://dx.doi.org/10.1101/039610doi: bioRxiv preprint first posted online Feb. 12, 2016;
3
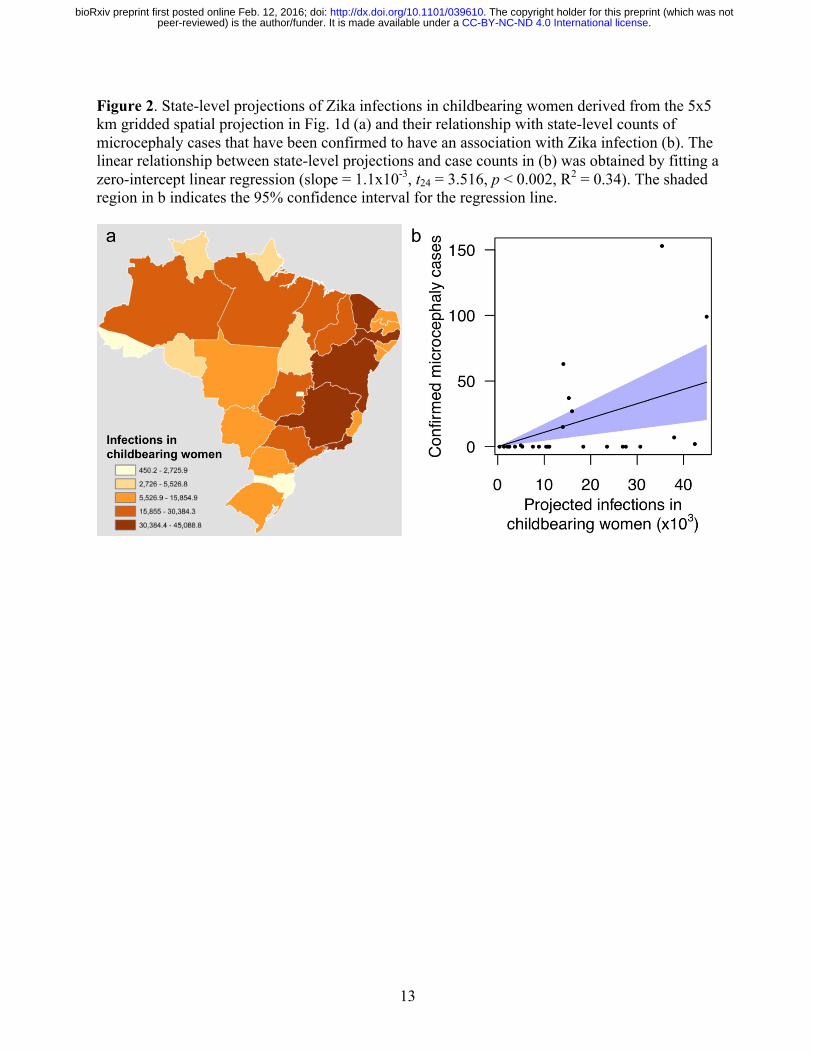
that far more people are currently susceptible to Zika. At the country level, we project that Brazil will have the largest total number of infections by more than three fold, due to a combination of its size and suitability for transmission. Island countries in the Caribbean are projected to experience the highest nationally averaged attack rates, with 14 of the highest 20 values projected for countries including Aruba, Haiti, and Cuba. This projection is consistent with a frequent history of arbovirus outbreaks on islands25 and likely owes to the uniformity of environmental conditions on portions of islands where people live. In more heterogeneous regions, the 5x5 km spatial resolution of our maps allows for nuanced projections for areas of interest to local stakeholders (Fig. 1d). We also projected numbers of Zika virus infections in childbearing women, because Zika’s disease burden is expected to derive disproportionately from microcephaly following prenatal exposure8. Our results indicate that 1.14 (0.95–1.91) million childbearing women could be infected before the first wave of the epidemic concludes (Fig. 1f). To assess how this projection compared with reported microcephaly cases in Brazil, we performed a zero-intercept linear regression (Fig. 2b) of state-level, Zika-associated microcephaly incidence against state-level projections of Zika virus infections in childbearing women during the first wave of the epidemic (Fig. 2a). We found a positive, statistically significant relationship between these quantities (t24 = 3.516, p < 0.002, R2 = 0.34), which is consistent with other findings that suggest an association between prenatal Zika infection and microcephaly. Extrapolating a slope of 1.1x10⁻³ (4.5x10⁻⁴–1.7x10⁻³) to our projections of 1.14 (0.95–1.91) million Zika virus infections in childbearing women, we project that there could be at least 1,135 (427–3,253) microcephaly cases across the Americas in the first wave of the ongoing Zika epidemic. Our projection of microcephaly cases during the first wave of the epidemic could be an underestimate for several reasons. First, there is no indication at present that the Zika epidemic in Brazil is abating, in which case it could take another year or more for numbers of infections comparable to our projections to be obtained. Second, if babies are only prone to Zika-induced microcephaly during a limited portion of their mother’s pregnancy, then microcephaly cases come from a smaller pool of childbearing women than the annual numbers of births that we used in our projections. Third, our analyses did not account for the 3,670 microcephaly cases that are still being investigated in Brazil5, nor did they account for the possibility of miscarriages and stillbirths that could be associated with Zika infection8. Altogether, our analysis suggests that on the order of tens of thousands of pregnant women could experience negative outcomes associated with the first wave of the Zika virus epidemic in the Americas. The most literal interpretation of the quantities we projected is that they represent the number of people who would be infected before herd immunity would drive local, isolated epidemics to burn out. Like many models of mosquito-borne pathogen transmission26, ours assumes that local populations are deterministic, well-mixed, and demographically static, with spatially variable but temporally homogenous conditions for transmission. These assumptions may often be violated in reality, but strengths of our approach include that its use of these assumptions is transparent17 and that relaxing these assumptions can be achieved through simulation modeling27. Furthermore, our approach has absolutely no reliance on data from the ongoing epidemic, because its predictions are based solely on highly resolved spatial information about drivers of transmission. The availability of tools such as ours in the context of an emerging epidemic of a
.CC-BY-NC-ND 4.0 International licensepeer-reviewed) is the author/funder. It is made available under aThe copyright holder for this preprint (which was not. http://dx.doi.org/10.1101/039610doi: bioRxiv preprint first posted online Feb. 12, 2016;
4
disease whose natural history is poorly known offer an attractive alternative to more data-intensive approaches, and it should be a research priority to develop similar capabilities for other high-risk emerging diseases. In addition to the methodological advance that our approach represents, our highly spatially resolved projections have a number of policy implications. First, our projections provide information about the possible magnitude of the epidemic and could allow for better planning for surveillance and outbreak response, both internationally and locally9. Second, our focus on the conditions for epidemic burnout serve as a reminder of the transient nature of epidemics. For those for whom the option is available, postponement of pregnancy until after the first wave of the epidemic has passed could be a rational strategy for minimizing microcephaly risk. For those for whom postponement of pregnancy is not an option and for the general population in high-risk areas, aggressive measures to reduce Zika virus transmission by Ae. aegypti mosquitoes should be regarded as an urgent priority. METHODS Data sources and processing Human demography To estimate the annual numbers of pregnancies per 1x1 km grid cell in 2015, methods developed by the WorldPop project (www.worldpop.org28,29) were adapted for the Americas region. High-resolution estimates of population counts per 100x100 m grid cell for 2015 were recently constructed for Latin American, Asian, and African countries14. With consistent subnational data on sex and age structures, as well as subnational age-specific fertility rate data across the Americas currently unavailable for fully replicating the approaches of Tatem et al.28, national level adjustments were made to construct pregnancy counts. Data on estimated total numbers of births30 and pregnancies31 occurring annually in 2012 were assembled for all Latin American study countries, as well as births in 201530. As no 2015 pregnancy estimates existed at the time of writing, the ratios of births to pregnancies for each country in the Americas were calculated using 2011 and 2012 estimates, and then these were applied to the 2015 births numbers to obtain 2015 estimates of annual pregnancy numbers per-country. This made the assumption that per-country births-to-pregnancies ratios remained the same in 2015 as they were in 2011 and 2012. The 100 m spatial resolution gridded population totals were aggregated to 1 km spatial resolution, and the per-country totals were linearly adjusted to match the 2015 pregnancy estimates, to create gridded estimates of numbers of pregnancies across the Americas. Ongoing work is focused on refining these estimates using subnational age-sex structures and age-specific fertility rates, following previous approaches28,29, to better account for subnational variations within countries. Temperature We used interpolated meteorological station temperature data from the 1950-2000 period at a 5x5 km resolution, processed to create climatological monthly averages that represent “typical” conditions (www.worldclim.org32).
.CC-BY-NC-ND 4.0 International licensepeer-reviewed) is the author/funder. It is made available under aThe copyright holder for this preprint (which was not. http://dx.doi.org/10.1101/039610doi: bioRxiv preprint first posted online Feb. 12, 2016;
5
Aedes occurrence probability To predict the likely distribution of the vector, Kraemer et al.7 generated high-resolution occurrence probability surfaces based on a species distribution modeling approach13. More specifically, a boosted regression tree model was applied using a comprehensive set of known occurrences (n = 19,930) of Ae. aegypti and a set of environmental predictors known to influence the distribution of the species7. Covariates included a temperature suitability mask19, contemporary mean and range maps of the Enhanced Vegetation Index and precipitation33, and an urbanization index from the Global Rural Urban Mapping Project. For our mean projections, we used a spatial layer of median occurrence probabilities. To generate lower and upper bounds, we sampled 100 spatial layers from the posterior distribution of these maps and calculated layers representing 0.025 and 0.975 quantiles of this posterior sample distribution. Economic index To account for socio-economic differences among populations residing in different regions, we used one-degree resolution gridded estimates of purchasing power parity (PPP) in U.S. Dollars from 2005 adjusted for inflation (G-Econ)34. When we encountered missing values, we imputed values in one of two ways. Grid cells in small island countries with data missing for the entire country were uniformly filled with population-adjusted PPP figures obtained from the U.S. CIA World Factbook35. Missing values in continental grid cells were imputed with the mean of the surrounding eight grid cell values. Once we obtained a complete PPP grid layer at one-degree resolution, we expanded the layer to a resolution of 5x5 km to match the resolution of gridded layers for human demography, temperature, and Ae. aegypti occurrence probability. Seroprevalence estimates To calibrate our model, we identified published estimates of seroprevlance that were relevant to the context of our study (Extended Data Table 1). Specifically, we sought estimates of seroprevalence to either Zika or chikungunya viruses in populations that were presumably naïve prior to an outbreak. Thus, we excluded some seroprevalence estimates that were obtained from endemic populations. We also excluded estimates from small islands—namely, Reunion and Grande Comore—for which it was clear that gridded temperature data were unrealistically low due to steep elevational gradients and other features of island geography. Appropriately, a number of the seroprevalence estimates we obtained pertained specifically to pregnant women, although there do not appear to be differences in the seroprevalence of pregnant women and the population at large, at least in the context of a naïve population following an outbreak36. Calculation of epidemiological quantities Mosquito abundance Occurrence probabilities can be translated into proxies for abundance provided that an assumption is made about how abundance is distributed as a random variable37. Assuming that mosquito abundance is distributed as a Poisson random variable, the probability that there is at least one mosquito present in a given location is 1 − exp −𝜆 , where 𝜆 is the expected abundance of mosquitoes. Inverting this relationship, we obtained an estimate 𝜆 = − ln 1 −occurrenceprobability of expected mosquito abundance under the Poisson model and used this as a proxy for mosquito abundance in our calculations.
.CC-BY-NC-ND 4.0 International licensepeer-reviewed) is the author/funder. It is made available under aThe copyright holder for this preprint (which was not. http://dx.doi.org/10.1101/039610doi: bioRxiv preprint first posted online Feb. 12, 2016;
6
Mosquito-human ratios The estimates of mosquito occurrence probability that we used7 incorporated a number of environmental variables. They did not account for factors that modulate contact between mosquitoes and humans, however. Due largely to economic differences, factors such as air conditioning can drastically limit mosquito-human contact and virus transmission, even when mosquitoes are abundant24. We accounted for the effect of economic differences between locations by multiplying our proxy for mosquito abundance 𝜆 by a function of the gross cell product economic index that we fitted to match our attack rate predictions with published seroprevalence estimates. We fitted this function with a shape constrained additive model, or SCAM38, because relationships between mosquito-human ratios and economic indices should be monotonically decreasing, nonlinear, and without a predictable functional form. The response variable to which we fitted this relationship was a set of scalar multiples of expected mosquito abundances that would result in a perfect correspondence between attack rates predicted by our model and published seroprevalence estimates. Basic reproduction number R0 We calculated the basic reproduction number R0 according to its classic Ross-Macdonald formulation and as a function of temperature T,
𝑅5 𝑇 =𝑚𝑏𝑐𝑎;𝑒=> ? @ ?
𝜇 𝑇 𝑟 ,
with adult mosquito mortality 𝜇 and extrinsic incubation period n specified as functions of temperature. Parameters that did not depend on temperature were set at the following values according to published estimates for Ae. aegypti and dengue virus: mosquito-to-human transmission probability, b = 0.4 [39]; human-to-mosquito transmission probability times number of days of human infectiousness, c / r = 3.5 [40]; and mosquito biting rate, a = 0.67 [41]. The ratio of mosquitoes to humans, m, was quantified using a combination of occurrence probabilities and the gross cell product economic index. For mosquito mortality, we used the temperature- and age-dependent model by Brady et al.42, to which we added an additional force of extrinsic mortality (0.025 d-1) to match an overall daily mortality value of 0.115 estimated in a mark-release-recapture experiment carried out under temperatures ranging 20–34 °C43. We then computed the mean of the age- and temperature-dependent lifespan distribution as a function of temperature to inform 𝜇 𝑇 . We used the relationship between temperature and mean duration of the extrinsic incubation period, 𝑛 𝑇 = exp 8 − 0.2𝑇 , estimated by Chan and Johansson20. Because temperature values were available for each location on a monthly basis, we computed monthly values of R0 for each location and then used the mean of the highest six monthly values as a singular estimate of R0 for each location. Attack rates Under a susceptible-infected-recovered (SIR) transmission model, there is a one-to-one relationship between R0 and final epidemic size, which is equivalent to the attack rate over the course of an epidemic17. There is no explicit solution for this quantity, but the final epidemic size can be estimated numerically by obtaining an implicit solution of 𝑆J = 𝑒=KL M=NO for 𝑆J, which is the proportion remaining susceptible after the epidemic has burned out17. Thus, we consider the attack rate over the course of an epidemic to be 𝐴𝑅 = 1 − 𝑆J.
.CC-BY-NC-ND 4.0 International licensepeer-reviewed) is the author/funder. It is made available under aThe copyright holder for this preprint (which was not. http://dx.doi.org/10.1101/039610doi: bioRxiv preprint first posted online Feb. 12, 2016;

7
Lower and upper bounds For our mean projections, we used published, best-fit estimates of the parameters described above. To obtain lower and upper bounds on our projections, we ran our model under lower and upper bound estimates of three key parameters that describe the relationship between environmental drivers and transmission intensity. For the mosquito-to-human ratio, m, we used 0.025 and 0.975 quantile estimates of the Ae. aegypti occurrence probability layer for lower- and upper-bound scenarios, respectively. We then converted occurrence probabilities into estimates of our proxy for abundance according to the same Poisson relationship described above37. We then adjusted those estimates by the economic index in the same way that we made that adjustment for the mean scenario. We did not utilize lower and upper bounds of the relationship between the economic index and mosquito densities, because that relationship was calibrated to seroprevalence data for downstream analyses. It was therefore not clear in what direction differing estimates of that relationship would alter our projections. For adult mosquito mortality, µ(T), we estimated the relationship between mortality and temperature for lower- and upper-bound scenarios in the same way that we did for the mean scenario, except that we calibrated the force of extrinsic mortality to yield overall daily mortality estimates of 0.09 and 0.14, rather than 0.115, averaged across 20–34 °C. The former values reflect two independent estimates of Ae. aegypti mortality from the field43 that we averaged to obtain our mean estimate of 0.115. For the extrinsic incubation period, n(T), we first took joint uniform random draws of slope and intercept parameters ranging -0.29 to -0.12 and 6–10, which corresponded to 95% confidence interval values reported by Chan and Johansson20. We then took the mean of slope and intercept parameter values that resulted in extrinsic incubation period values at 30 °C within 0.1 d of the 95% confidence interval values of 3.4 and 9.9 reported by Chan and Johansson20. This resulted in the following lower- and upper-bound parameter values: slope, -0.224 and -0.191; intercept, 7.94 and 8.02. Our lower (upper) bound projections of attack rates combined the lower (upper) bound estimates of each of these three parameters. By combining lower and upper bounds of each parameter independently, we considered a broader range of parameter values than would be obtained from lower and upper bounds of their joint densities, which we did not calculate due to the heterogeneous data sources from which these estimates were derived. Performance and refinement of attack rate projections The shape constrained additive model that we fitted to the relationship between the gross cell product economic index and the multiplication factor for mosquito densities followed a gradually decelerating negative slope as economic index values varied from low to high (Extended Data Fig. 1). The smooth term relating the economic index to the multiplication factor was not statistically significant (F1 = 0.57, p = 0.583). We incorporated this relationship into our projections nonetheless, because our goal was to quantify a strongly hypothesized relationship, to the extent that we could given available data, rather than to test that hypothesis. Although this relationship was not statistically significant, it was epidemiologically significant. Examining predicted values on a linear scale, which is how we applied them, we noted that they ranged more than three fold between the most and least economically prosperous sites from which we had seroprevalence estimates (Italy versus Madagascar).
.CC-BY-NC-ND 4.0 International licensepeer-reviewed) is the author/funder. It is made available under aThe copyright holder for this preprint (which was not. http://dx.doi.org/10.1101/039610doi: bioRxiv preprint first posted online Feb. 12, 2016;
8
Prior to incorporating the economic index into our model, attack rate projections from the model consistently underestimated empirical estimates of seroprevalence (Extended Data Fig. 2a). After applying the economic index adjustment to mosquito densities, higher attack rate projections were more consistently associated with higher seroprevalence estimates (Extended Data Fig. 2b). At the same time, the model revised to account for the economic index overshot a number of seroprevalence estimates. This overshooting was problematic given our goal of making a priori projections of attack rates across a vast geographic region with no other data with which to further calibrate our model. The shape of the curve defining the relationship between R0 and attack rate in Extended Data Fig. 2b only allowed for intermediate attack rates in a very narrow range of R0 = 1-2. Given that our projected R0 values fell within a plausible range for an arboviral epidemic21, we interpreted the tendency to overestimate attack rates as a consequence of unrealistic assumptions underlying the functional relationship between R0 and attack rate. Different functional relationships between these quantities can be derived under a variety of different epidemiological assumptions44, but one very common departure from the standard formulation shown in Extended Data Fig. 2b is that, due to contact heterogeneity45, the true relationship between R0 and attack rate should be lower than that derived under SIR model assumptions. There is broad empirical support for extensive heterogeneity in contacts between people and Ae. aegypti mosquitoes46,47, so a lower relationship than the one shown in Extended Data Fig. 2b is highly plausible. Indeed, such a relationship for mosquito-borne pathogens has been predicted by theoretical studies for precisely these reasons48. To obtain a curve that led to attack rate projections more consistent with published seroprevalence estimates, we substituted 𝑅5Q for 𝑅5 in the calculation of attack rates using a value of α = 0.14 obtained by minimizing the sum of squares of residuals between predicted and observed attack rates (Extended Data Fig. 2c). Concurrent with the estimation of α, we also re-estimated the relationship between the economic index and mosquito density, given that the latter affects projected values of 𝑅5. After simultaneously fitting both of these relationships, projected attack rates accounted for 29% of variation in seroprevalence estimates obtained from the literature. Relationship between R0 and environmental variables Our estimates of R0 were shaped by three environmental variables: temperature, Ae. aegypti occurrence probability, and economic index. With respect to temperature, peak values of R0 were obtained at around 30 °C (Extended Data Fig. 3). Linear increases in Ae. aegypti occurrence probability resulted in accelerating increases in R0 due to our assumed relationship between Ae. aegypti occurrence probability and our proxy for abundance. Differences in R0 attributable to differences in the economic index also increased steeply as lower economic index values were approached (Extended Data Fig. 3). Overall, projected values of R0 were consistent with published estimates of R0 for chikungunya21,22. Projecting R0, attack rate, and numbers of infections Combining spatial layers describing temperature, Ae. aegypti occurrence probability, and the gross cell product economic index, we first calculated a spatial layer describing R0. We then used the relationship in Extended Data Fig. 2c to translate the R0 spatial layer into a spatial layer
.CC-BY-NC-ND 4.0 International licensepeer-reviewed) is the author/funder. It is made available under aThe copyright holder for this preprint (which was not. http://dx.doi.org/10.1101/039610doi: bioRxiv preprint first posted online Feb. 12, 2016;
9
describing attack rate over the course of an SIR-like epidemic. To obtain estimates of numbers of infections in total and among childbearing women, we multiplied the attack rate layer by demographic layers for the corresponding population stratifications. High-resolution spatial projections of R0, attack rate, and number of infected childbearing women are presented in Extended Data Figs. 4-9. REFERENCES 1. Fauci, A. S. & Morens, D. M. Zika Virus in the Americas—Yet Another Arbovirus Threat. New England Journal of Medicine (2016). 2. Melo, A., et al. Zika virus intrauterine infection causes fetal brain abnormality and microcephaly: tip of the iceberg. Ultrasound in Obstetrics and Gynecology 47, 6-7 (2016). 3. Editorial. The next steps on Zika. Nature 530, 5 (2016). 4. S. Bhatt, et al. The global distribution and burden of dengue. Nature 496, 504-507 (2013). 5. Ministerio da Saude da Brazil. Boletim: Saude investiga 3.670 casos suspeitos de microcefalia no pais. 4 February 2016, http://combateaedes.saude.gov.br/noticias/251-saude-investiga-3-670-casos-suspeitos-de-microcefalia-no-pais. 6. World Health Organization. WHO statement on the first meeting of the International Health Regulations (2005) (IHR 2005) Emergency Committee on Zika virus and observed increase in neurological disorders and neonatal malformations. 1 February 2016, http://www.who.int/mediacentre/news/statements/2016/1st-emergency-committee-zika/en/. 7. Kraemer, M. U. G., et al. The global distribution of the arbovirus vectors Aedes aegypti and Ae. albopictus. eLife e08347 (2015). 8. European Centre for Disease Prevention and Control. Rapid risk assessment: Microcephaly in Brazil potentially linked to the Zika virus epidemic. 24 November 2015. (2015). 9. Lucey, D. R. & Gostin, L. O. The Emerging Zika Pandemic: Enhancing Preparedness. Journal of the American Medical Association (2016). 10. Hayden, E. C. Proving Zika link to birth defects poses huge challenge. Nature 530, 142-143 (2016). 11. Duffy, M., et al. Zika virus outbreak on Yap Island, Federated States of Micronesia. New England Journal of Medicine 360, 2536-2543 (2009). 12. Ioos, S., et al. Current Zika virus epidemiology and recent epidemics. Medecine et Maladies Infectieuses 44, 302-307 (2014). 13. Elith, J. & Leathwick, J. Species distribution models: ecological explanation and prediction across space and time. Annual Review of Ecology, Evolution, and Systematics 40, 677 (2009). 14. Sorichetta, A., et al. High-resolution gridded population datasets for Latin America and the Caribbean in 2010, 2015, and 2020. Scientific Data 2, 150045 (2015). 15. Sergon, K., et al. Seroprevalence of chikungunya virus (CHIKV) infection on Lamu Island, Kenya, October 2004. American Journal of Tropical Medicine and Hygiene 78, 333-337 (2008). 16. Kermack, W. & McKendrick, A. A contribution to the mathematical theory of epidemics. Proceedings of the Royal Society A 115, 700-721 (1927). 17. Keeling, M. & Rohani, P. Modeling Infectious Diseases in Humans and Animals. Princeton (2007). 18. Smith, D. L., et al. Ross, Macdonald, and a theory for the dynamics and control of mosquito-transmitted pathogens. PLOS Pathogens 8, e1002588 (2012). 19. Brady, O. J., et al. Global temperature constraints on Aedes aegypti and Ae. albopictus persistence and competence for dengue virus transmission. Parasites and Vectors 7, 338 (2014). 20. Chan, M. & Johansson, M. A. The incubation periods of dengue viruses. PLOS ONE 7, e50972 (2012). 21. Johansson, M. A., et al. Nowcasting the spread of chikungunya virus in the Americas. PLOS ONE 9, e104915 (2014).
.CC-BY-NC-ND 4.0 International licensepeer-reviewed) is the author/funder. It is made available under aThe copyright holder for this preprint (which was not. http://dx.doi.org/10.1101/039610doi: bioRxiv preprint first posted online Feb. 12, 2016;
10
22. Perkins, T. A., Metcalf, C. J. E., Grenfell, B. T. & Tatem, A. J. Estimating drivers of autochthonous drivers of chikungunya virus in its invasion of the Americas. PLOS Currents Outbreaks 10 February (2015). 23. Salje, H., et al. Revealing the microscale spatial signature of dengue transmission and immunity in an urban population. Proceedings of the National Academy of Sciences 109, 9535-9538 (2012). 24. Reiter, P., et al. Texas lifestyle limits transmission of dengue virus. Emerging Infectious Diseases 9, 86-89 (2003). 25. Feldstein, L., Brownstein, J., Brady, O.J., Hay, S. I. & M. A. Johansson. Dengue on islands: a Bayesian approach to understanding the global ecology of dengue viruses. Transactions of the Royal Society of Tropical Medicine and Hygiene 109, 303-312 (2015). 26. Reiner, R. C., et al. A systematic review of mathematical models of mosquito-borne pathogen transmission: 1970-2010. Journal of the Royal Society Interface 10, 20120921 (2013). 27. Riley, S. Large-scale spatial transmission models of infectious disease. Science 316, 1298-1301 (2007). 28. Tatem, A. J., et al. Mapping for maternal and newborn health: the distributions of women of childbearing age, pregnancies and births. International Journal of Health Geographics 13, 2 (2013). 29. UNFPA. The State of the World's Midwifery 2014. (2014). 30. United Nations, Department of Economic and Social Affairs, Population Division. World Population Prospects: The 2015 Revision. (2015). 31. Singh, S., Darroch, J. & Ashford L. Adding It Up: The Need for and Cost of Maternal and Newborn Care - Estimates for 2012. Guttmacher Institute (2013). 32. Hijmans, R. Very high resolution interpolated climate surfaces for global land areas. International Journal of Climatology 25, 1965-1978 (2005). 33. Weiss, D. An effective approach for gap-filling continental scale remotely sensed time-series. ISPRS Journal of Photogrammetry and Remote Sensing 98, 106-118 (2014). 34. Nordhaus, W. The G-Econ database on gridded output: methods and data. 12 May 2006. http://gecon.yale.edu/sites/default/files/gecon_data_20051206_1.pdf. 35. U. S. Central Intelligence Agency. The World Factbook. 5 January 2016. https://www.cia.gov/library/publications/the-world-factbook/geos/xx.html. 36. Gerardin, P. Estimating chikungunya prevalence in Reunion Island outbreak by serosurveys: two methods for two critical times of the epidemic. BMC Infectious Diseases 8, 99 (2008). 37. Wright, D. Correlations between incidence and abundance are expected by chance. Journal of Biogeography 18, 463-466 (1991). 38. Pya, N. & Wood, S. Shape constrained additive models. Statistics and Computing 25, 543-559 (2015). 39. Nishiura, H. Mathematical and statistical analyses of the spread of dengue. Dengue Bulletin 30, 51-67 (2006). 40. Nishiura, H., & Halstead, S. Natural history of dengue virus (DENV)-1 and DENV-4 infections: reanalysis of classic studies. Journal of Infectious Diseases 195, 1007-1013 (2007). 41. Scott, T.W., et al. Longitudinal studies of Aedes aegypti (Diptera: Culicidae) in Thailand and Puerto Rico: blood feeding frequency. Journal of Medical Entomology 37, 89-101 (2000). 42. Brady, O. J., et al. Modelling adult Aedes aegypti and Aedes albopictus survival at different temperatures in laboratory and field settings. Parasites and Vectors 6, 351-362 (2013). 43. Muir, L. & Kay, B. Aedes aegypti survival and dispersal estimated by mark-release-recapture in northern Australia. American Journal of Tropical Medicine and Hygiene 58, 277-282 (1998). 44. Miller, J. A note on the derivation of final epidemic sizes. Bulletin of Mathematical Biology 74, 2125-2141 (2012). 45. Andreasen, V. The final size of an epidemic and its relation to the basic reproduction number. Bulletin of Mathematical Biology 73, 2305-2321 (2011). 46. de Benedictis, J., et al. Identification of the people from whom engorged Aedes aegypti took blood meals in Florida, Puerto Rico, using polymerase chain reaction-based DNA profiling. American Journal of Tropical Medicine and Hygiene 68, 437-446 (2003).
.CC-BY-NC-ND 4.0 International licensepeer-reviewed) is the author/funder. It is made available under aThe copyright holder for this preprint (which was not. http://dx.doi.org/10.1101/039610doi: bioRxiv preprint first posted online Feb. 12, 2016;
11
47. Liebman, K. A., et al. Determinants of heterogeneous blood feeding patterns by Aedes aegypti in Iquitos, Peru. PLOS Neglected Tropical Diseases 8, e2702 (2014). 48. Perkins, T. A., Scott, T. W., Le Menach, A. & Smith, D. L. Heterogeneity, mixing, and the spatial scales of mosquito-borne pathogen transmission. PLOS Computational Biology 9, e1003327 (2013). 49. Schwarz, N., et al. Seroprevalence of antibodies against chikungunya, dengue, and Rift Valley fever viruses after febrile illness outbreak, Madagascar. Emerging Infectious Diseases 18, 1780-1786 (2012). 50. Sissoko, D. Outbreak of chikungunya fever in Mayotte, Comoros archipelago, 2005-2006. Transactions of the Royal Society of Tropical Medicine and Hygiene 102, 780-786 (2008). 51. Dwibedi, B., et al. Rapid spread of chikungunya virus infection in Orissa, India. Indian Journal of Medical Research 133, 316-321 (2011). 52. Gay, N., et al. Seroprevalence and asymptomatic rates of Asian lineage chikungunya virus infection on Saint Martin, Caribbean. American Journal of Tropical Medicine and Hygiene 94, 393-396 (2015). 53. Moro, M., et al. Chikungunya virus in north-eastern Italy: a seroprevalence study. American Journal of Tropical Medicine and Hygiene 82, 508-511 (2010). 54. Balmaseda, A., et al. Clinical attack rate of chikungunya in a cohort of Nicaraguan children. American Journal of Tropical Medicine and Hygiene 94, 397-399 (2016). ACKNOWLEDGEMENTS We thank J Ashander, CM Barker, MA Johansson, RC Reiner, ST Stoddard, and members of the Perkins Lab for useful discussions. TAP is supported by funding from NIH/NIAID (1P01AI098670-01A1) and the Bill & Melinda Gates Foundation (OPP1110495). AJT is supported by funding from NIH/NIAID (U19AI089674), the BMGF (OPP1106427, 1032350), NORAD, and a Wellcome Trust Sustaining Health Grant (106866/Z/15/Z). CWR is supported by funding through the University of Southampton’s Economic and Social Research Council’s Doctoral Training Centre. AJT and CWR acknowledge the support of the WorldPop Project (www.worldpop.org) and Flowminder Foundation (www.flowminder.org) teams in demographic dataset production, and TAP and ASS acknowledge support from the Notre Dame Center for Research Computing.
.CC-BY-NC-ND 4.0 International licensepeer-reviewed) is the author/funder. It is made available under aThe copyright holder for this preprint (which was not. http://dx.doi.org/10.1101/039610doi: bioRxiv preprint first posted online Feb. 12, 2016;
12
FIGURES Figure 1. Gridded spatial projections of component variables (a-c) that combine to yield a gridded spatial projection of Zika infections in childbearing women across Latin America and the Caribbean (d). Projections of total numbers of Zika infections in all people (e) and in childbearing women (f) for the top eight countries in each category were derived from 5x5 km gridded spatial projections such as (d). Numbers in e and f represent mean (lower bound – upper bound) with respect to relationships between environmental variables and transmission potential.
.CC-BY-NC-ND 4.0 International licensepeer-reviewed) is the author/funder. It is made available under aThe copyright holder for this preprint (which was not. http://dx.doi.org/10.1101/039610doi: bioRxiv preprint first posted online Feb. 12, 2016;
13
Figure 2. State-level projections of Zika infections in childbearing women derived from the 5x5 km gridded spatial projection in Fig. 1d (a) and their relationship with state-level counts of microcephaly cases that have been confirmed to have an association with Zika infection (b). The linear relationship between state-level projections and case counts in (b) was obtained by fitting a zero-intercept linear regression (slope = 1.1x10⁻³, t24 = 3.516, p < 0.002, R2 = 0.34). The shaded region in b indicates the 95% confidence interval for the regression line.
.CC-BY-NC-ND 4.0 International licensepeer-reviewed) is the author/funder. It is made available under aThe copyright holder for this preprint (which was not. http://dx.doi.org/10.1101/039610doi: bioRxiv preprint first posted online Feb. 12, 2016;
14
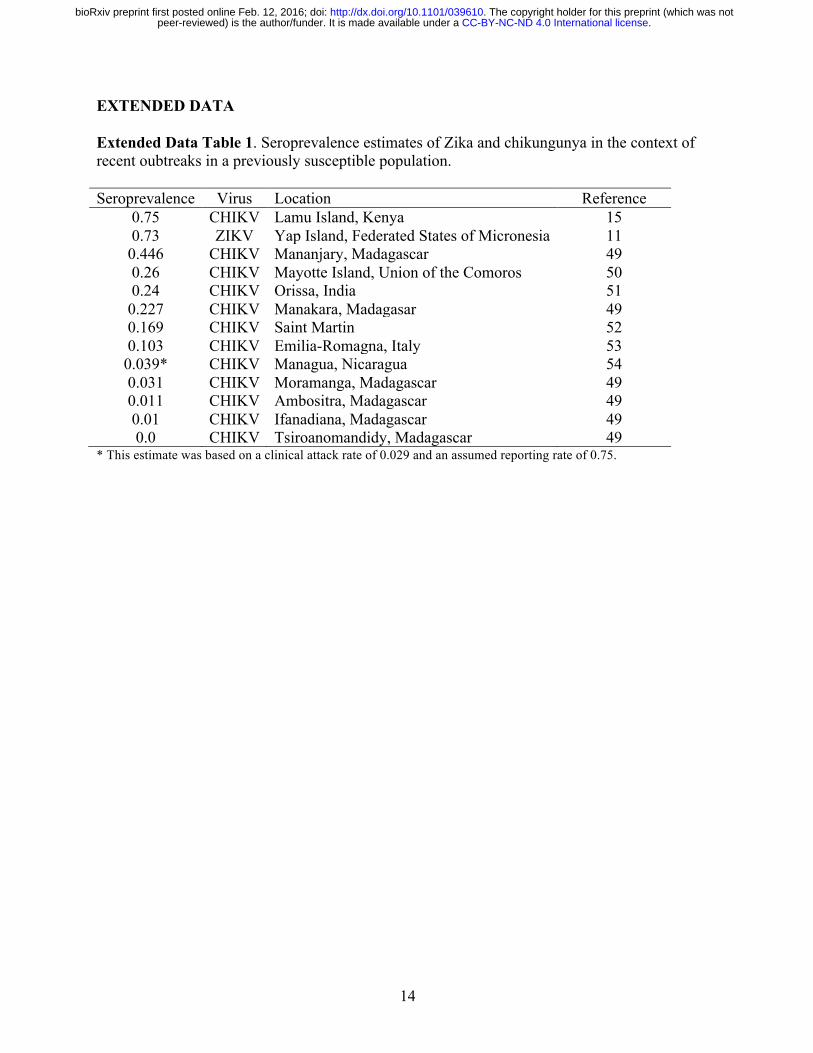
EXTENDED DATA Extended Data Table 1. Seroprevalence estimates of Zika and chikungunya in the context of recent oubtreaks in a previously susceptible population. Seroprevalence Virus Location Reference
0.75 CHIKV Lamu Island, Kenya 15 0.73 ZIKV Yap Island, Federated States of Micronesia 11 0.446 CHIKV Mananjary, Madagascar 49 0.26 CHIKV Mayotte Island, Union of the Comoros 50 0.24 CHIKV Orissa, India 51 0.227 CHIKV Manakara, Madagasar 49 0.169 CHIKV Saint Martin 52 0.103 CHIKV Emilia-Romagna, Italy 53 0.039* CHIKV Managua, Nicaragua 54 0.031 CHIKV Moramanga, Madagascar 49 0.011 CHIKV Ambositra, Madagascar 49 0.01 CHIKV Ifanadiana, Madagascar 49 0.0 CHIKV Tsiroanomandidy, Madagascar 49
* This estimate was based on a clinical attack rate of 0.029 and an assumed reporting rate of 0.75.
.CC-BY-NC-ND 4.0 International licensepeer-reviewed) is the author/funder. It is made available under aThe copyright holder for this preprint (which was not. http://dx.doi.org/10.1101/039610doi: bioRxiv preprint first posted online Feb. 12, 2016;

15
Extended Data Figure 1. Fitted relationship between the gross cell product economic index and a multiplication factor to relate expected mosquito abundance to mosquito-human ratios, both of which are shown on a log scale. The mean estimate is shown with a black line, the blue band indicates standard error estimates around that mean, and points reflect data from locations with seroprevalence estimates listed in Extended Data Table 1.
●
●
●
●
●
●
●
●
●
●
●
●
●
7 8 9 10
−2
−1
0
1
ln(gross cell product)
ln(m
ultip
licat
ion
fact
or fo
r m)
.CC-BY-NC-ND 4.0 International licensepeer-reviewed) is the author/funder. It is made available under aThe copyright holder for this preprint (which was not. http://dx.doi.org/10.1101/039610doi: bioRxiv preprint first posted online Feb. 12, 2016;
16
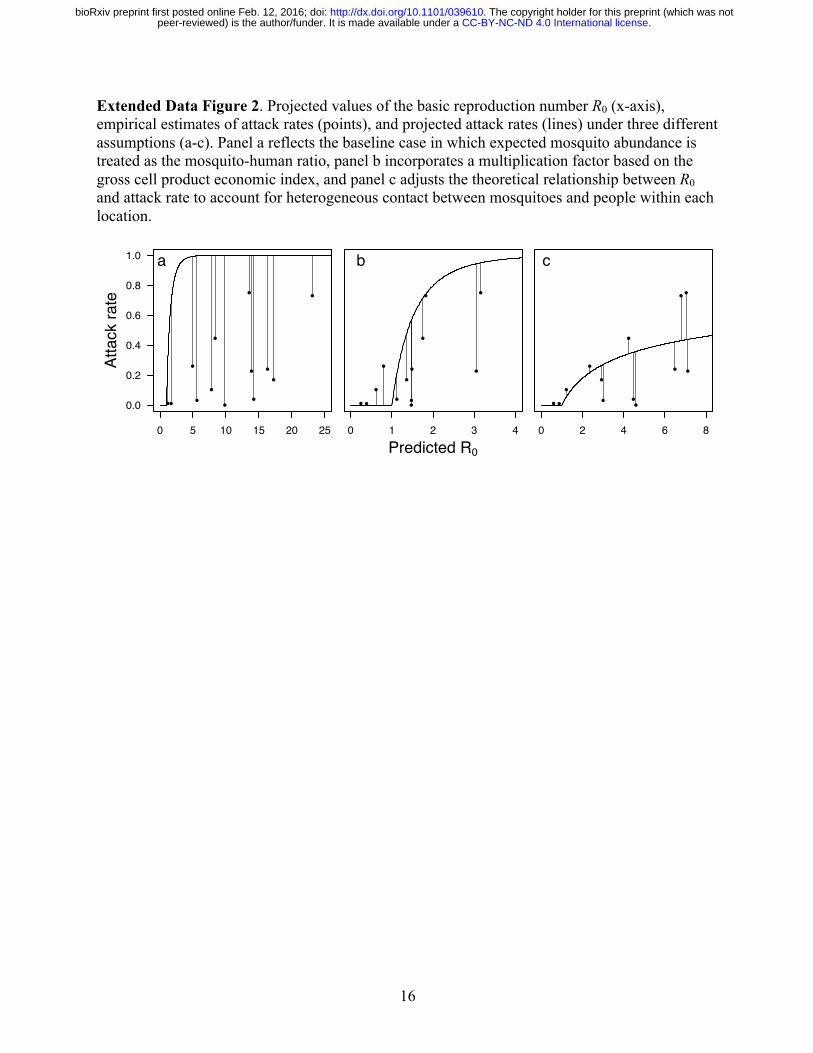
Extended Data Figure 2. Projected values of the basic reproduction number R0 (x-axis), empirical estimates of attack rates (points), and projected attack rates (lines) under three different assumptions (a-c). Panel a reflects the baseline case in which expected mosquito abundance is treated as the mosquito-human ratio, panel b incorporates a multiplication factor based on the gross cell product economic index, and panel c adjusts the theoretical relationship between R0 and attack rate to account for heterogeneous contact between mosquitoes and people within each location.
0 5 10 15 20 25
0.0
0.2
0.4
0.6
0.8
1.0
●
●
●
●
●
●●
●●
●
●
●
●
a
Atta
ck ra
te
0 1 2 3 4
●
●
●
●
●
●●
●●
●
●
●
●
b
Predicted R0
0 2 4 6 8
●
●
●
●
●
●●
●●
●
●
●
●
c
.CC-BY-NC-ND 4.0 International licensepeer-reviewed) is the author/funder. It is made available under aThe copyright holder for this preprint (which was not. http://dx.doi.org/10.1101/039610doi: bioRxiv preprint first posted online Feb. 12, 2016;
17
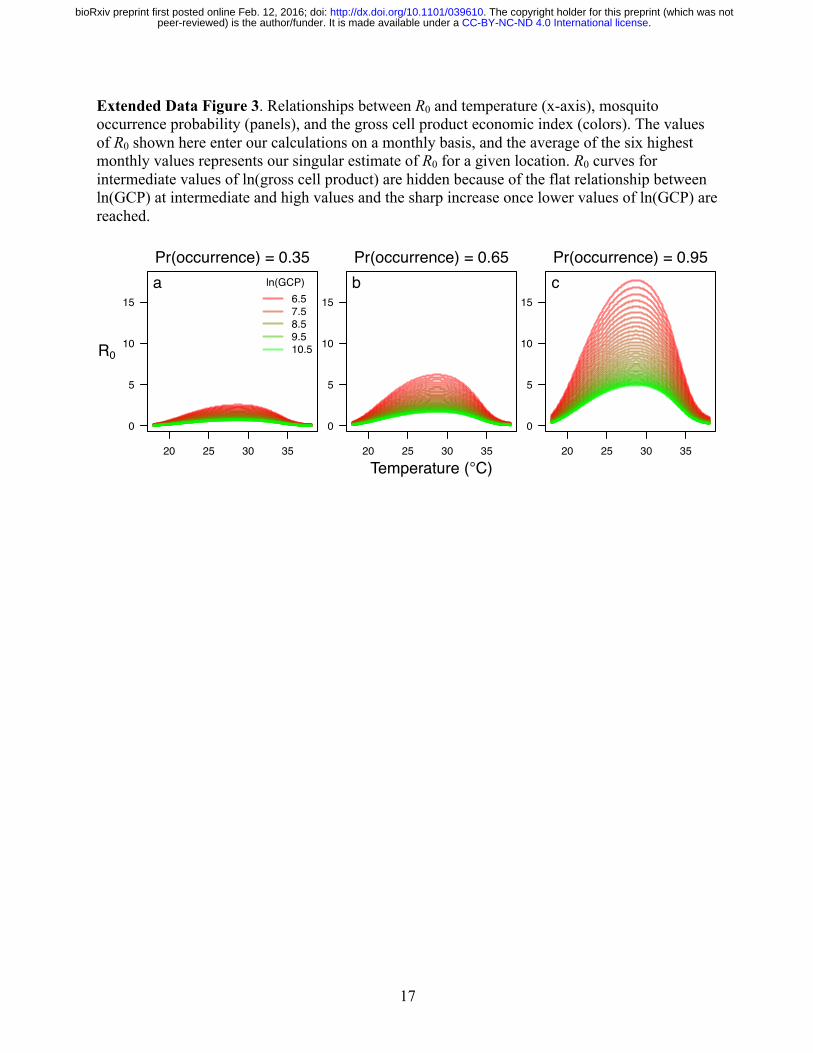
Extended Data Figure 3. Relationships between R0 and temperature (x-axis), mosquito occurrence probability (panels), and the gross cell product economic index (colors). The values of R0 shown here enter our calculations on a monthly basis, and the average of the six highest monthly values represents our singular estimate of R0 for a given location. R0 curves for intermediate values of ln(gross cell product) are hidden because of the flat relationship between ln(GCP) at intermediate and high values and the sharp increase once lower values of ln(GCP) are reached.
20 25 30 35
0
5
10
15
unique(d$temp)
d$R
0[d$
gdp_
pcpp
p200
5 ==
uni
que(
d$gd
p_pc
ppp2
005)
[1]]
R0
aPr(occurrence) = 0.35
ln(GCP)6.57.58.59.510.5
20 25 30 35
0
5
10
15
unique(d$temp)
d$R
0[d$
gdp_
pcpp
p200
5 ==
uni
que(
d$gd
p_pc
ppp2
005)
[1]]
Temperature (°C)
bPr(occurrence) = 0.65
20 25 30 35
0
5
10
15
unique(d$temp)
d$R
0[d$
gdp_
pcpp
p200
5 ==
uni
que(
d$gd
p_pc
ppp2
005)
[1]]
cPr(occurrence) = 0.95
.CC-BY-NC-ND 4.0 International licensepeer-reviewed) is the author/funder. It is made available under aThe copyright holder for this preprint (which was not. http://dx.doi.org/10.1101/039610doi: bioRxiv preprint first posted online Feb. 12, 2016;
18
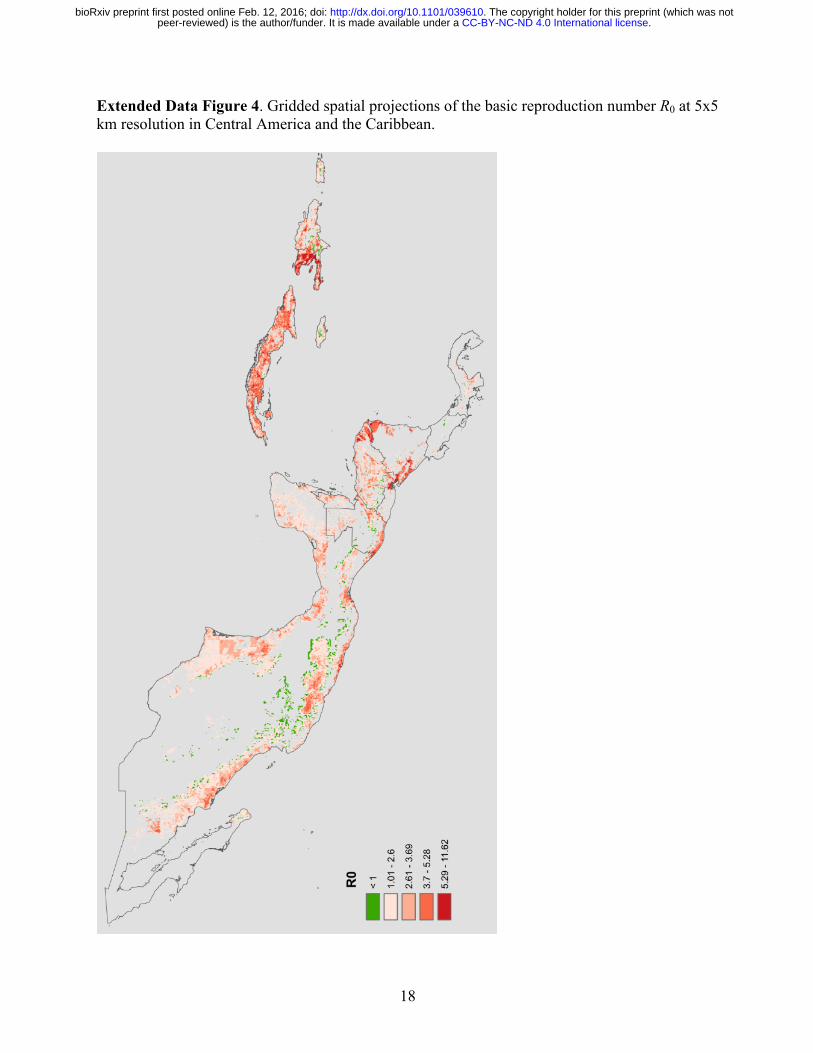
Extended Data Figure 4. Gridded spatial projections of the basic reproduction number R0 at 5x5 km resolution in Central America and the Caribbean.
.CC-BY-NC-ND 4.0 International licensepeer-reviewed) is the author/funder. It is made available under aThe copyright holder for this preprint (which was not. http://dx.doi.org/10.1101/039610doi: bioRxiv preprint first posted online Feb. 12, 2016;
19
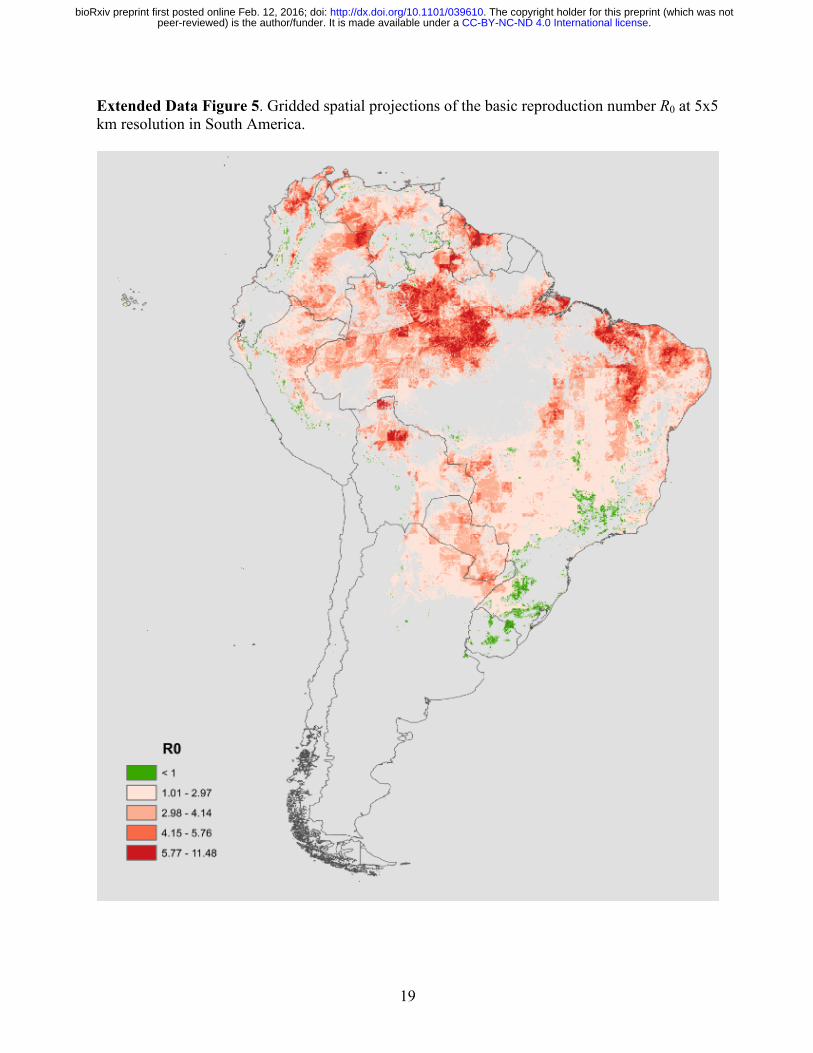
Extended Data Figure 5. Gridded spatial projections of the basic reproduction number R0 at 5x5 km resolution in South America.
.CC-BY-NC-ND 4.0 International licensepeer-reviewed) is the author/funder. It is made available under aThe copyright holder for this preprint (which was not. http://dx.doi.org/10.1101/039610doi: bioRxiv preprint first posted online Feb. 12, 2016;
20
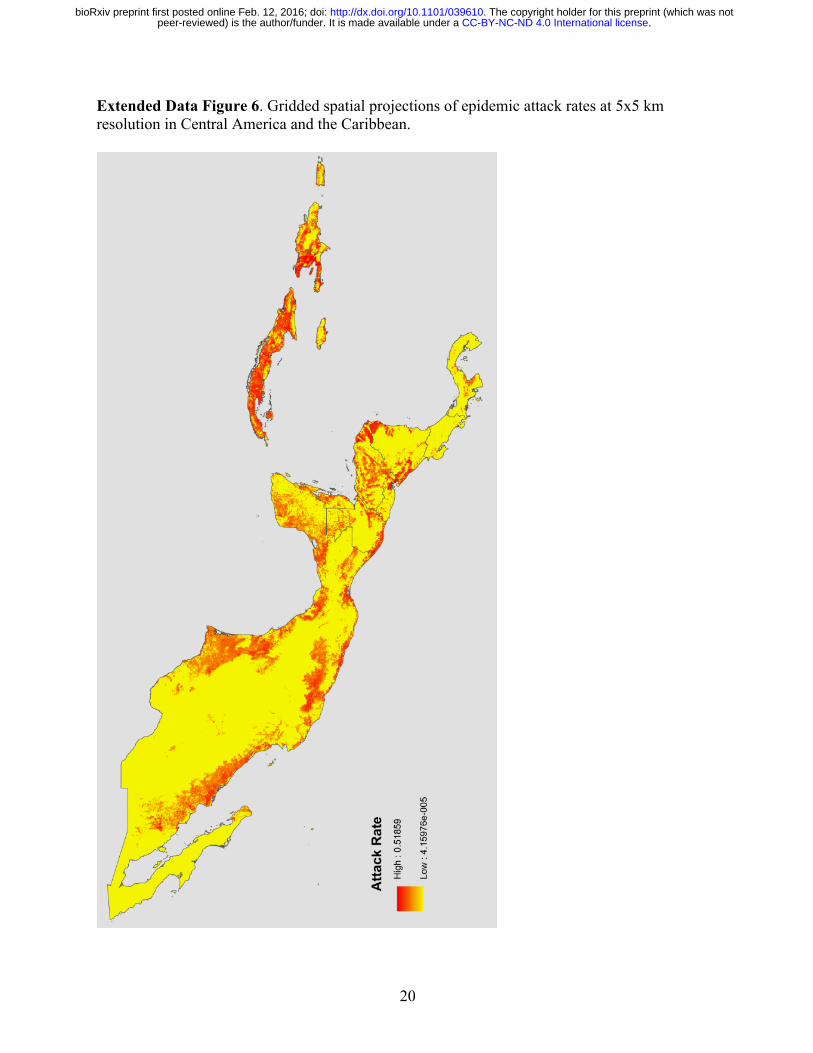
Extended Data Figure 6. Gridded spatial projections of epidemic attack rates at 5x5 km resolution in Central America and the Caribbean.
.CC-BY-NC-ND 4.0 International licensepeer-reviewed) is the author/funder. It is made available under aThe copyright holder for this preprint (which was not. http://dx.doi.org/10.1101/039610doi: bioRxiv preprint first posted online Feb. 12, 2016;
21
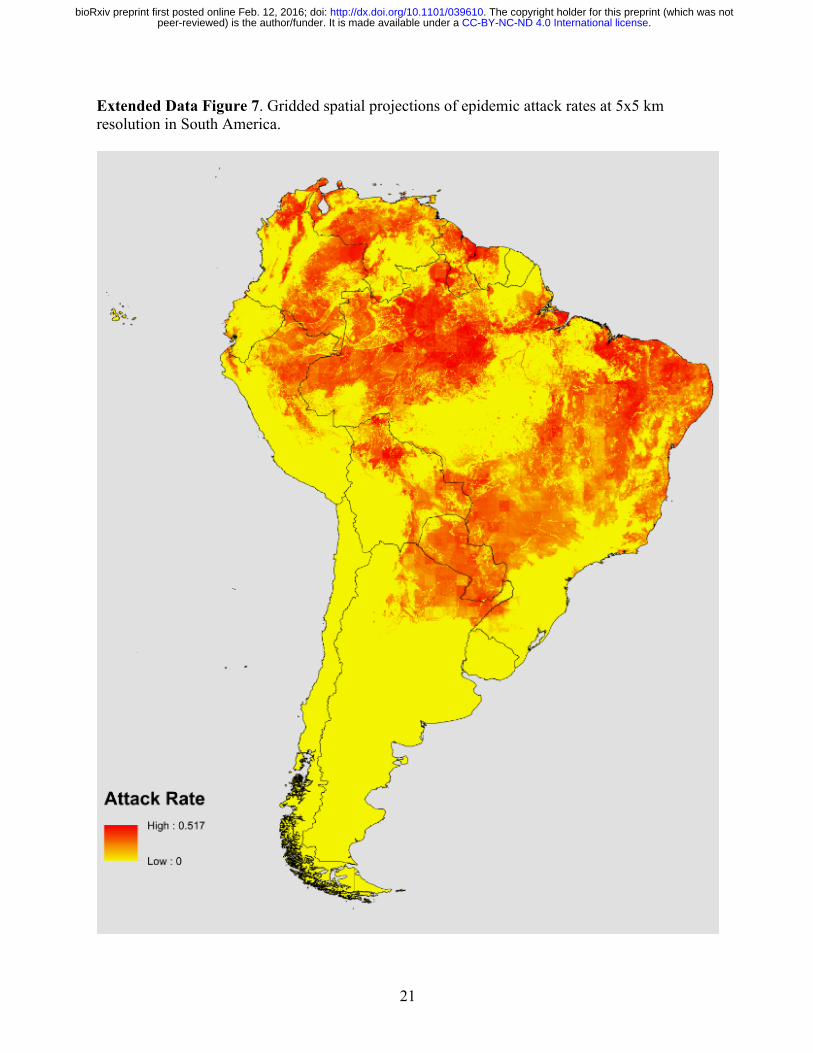
Extended Data Figure 7. Gridded spatial projections of epidemic attack rates at 5x5 km resolution in South America.
.CC-BY-NC-ND 4.0 International licensepeer-reviewed) is the author/funder. It is made available under aThe copyright holder for this preprint (which was not. http://dx.doi.org/10.1101/039610doi: bioRxiv preprint first posted online Feb. 12, 2016;
22
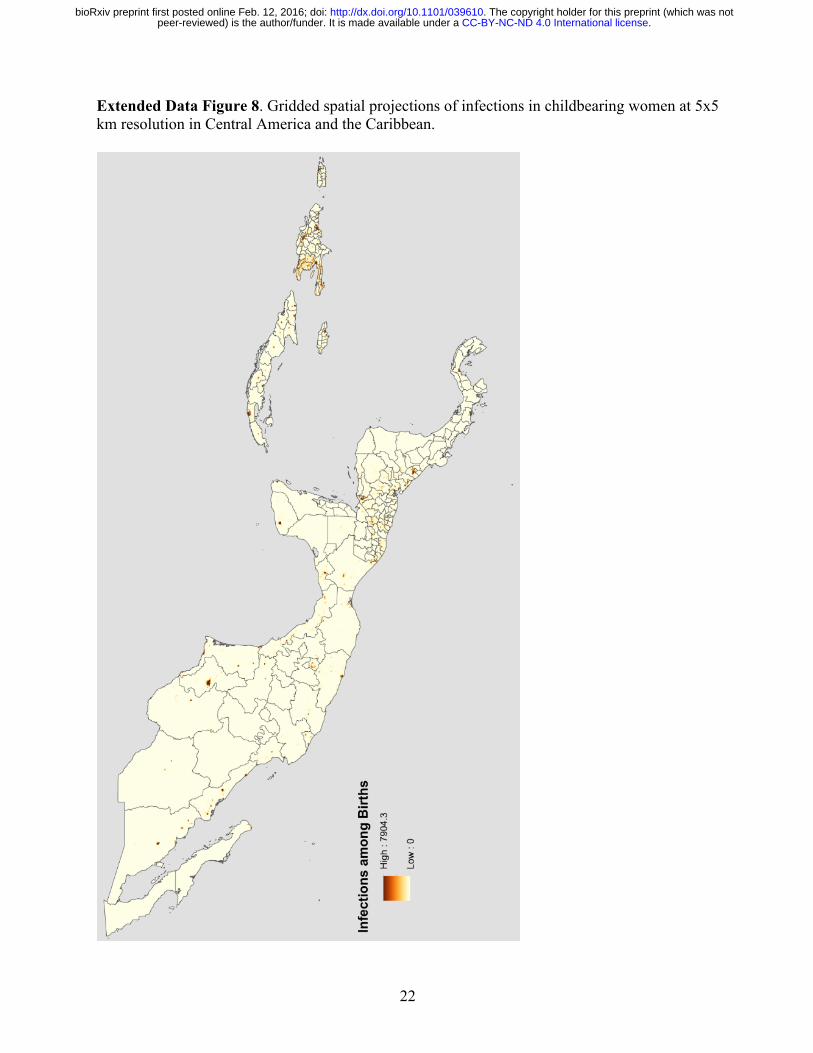
Extended Data Figure 8. Gridded spatial projections of infections in childbearing women at 5x5 km resolution in Central America and the Caribbean.
.CC-BY-NC-ND 4.0 International licensepeer-reviewed) is the author/funder. It is made available under aThe copyright holder for this preprint (which was not. http://dx.doi.org/10.1101/039610doi: bioRxiv preprint first posted online Feb. 12, 2016;
23
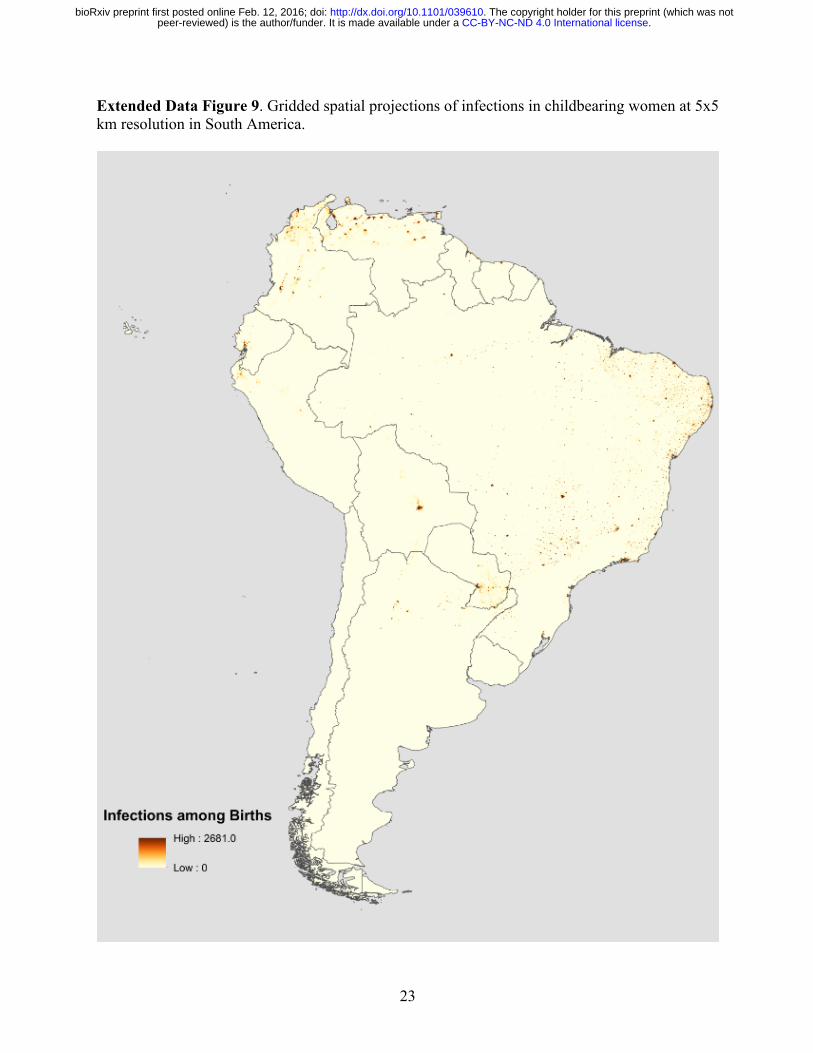
Extended Data Figure 9. Gridded spatial projections of infections in childbearing women at 5x5 km resolution in South America.
.CC-BY-NC-ND 4.0 International licensepeer-reviewed) is the author/funder. It is made available under aThe copyright holder for this preprint (which was not. http://dx.doi.org/10.1101/039610doi: bioRxiv preprint first posted online Feb. 12, 2016;