Embed Size (px)
Citation preview
Model-based transcriptome engineering promotes afermentative transcriptional state in yeastDrew G. Michaela,b,1, Ezekiel J. Maiera,b,1, Holly Browna,b, Stacey R. Gishc, Christopher Fiorea, Randall H. Browna,d,and Michael R. Brenta,b,e,2
aCenter for Genome Sciences and Systems Biology, Washington University in St. Louis, St. Louis, MO 63108; bDepartment of Computer Science andEngineering, Washington University in St. Louis, St. Louis, MO 63130; cDepartment of Molecular Microbiology, Washington University School of Medicine,St. Louis, MO 63110; dDepartment of Electrical and Systems Engineering, Washington University in St. Louis, St. Louis, MO 63130; and eDepartment ofGenetics, Washington University School of Medicine, St. Louis, MO 63110
Edited by Steven Henikoff, Fred Hutchinson Cancer Research Center, Seattle, WA, and approved September 27, 2016 (received for reviewMarch 2, 2016)
The ability to rationally manipulate the transcriptional states ofcells would be of great use in medicine and bioengineering. Wehave developed an algorithm, NetSurgeon, which uses genome-wide gene-regulatory networks to identify interventions thatforce a cell toward a desired expression state. We first validatedNetSurgeon extensively on existing datasets. Next, we used Net-Surgeon to select transcription factor deletions aimed at improv-ing ethanol production in Saccharomyces cerevisiae cultures thatare catabolizing xylose. We reasoned that interventions that movethe transcriptional state of cells using xylose toward that of cellsproducing large amounts of ethanol from glucose might improvexylose fermentation. Some of the interventions selected by NetSur-geon successfully promoted a fermentative transcriptional state inthe absence of glucose, resulting in strains with a 2.7-fold increase inxylose import rates, a 4-fold improvement in xylose integration intocentral carbon metabolism, or a 1.3-fold increase in ethanol produc-tion rate. We conclude by presenting an integrated model of tran-scriptional regulation and metabolic flux that will enable futureefforts aimed at improving xylose fermentation to prioritize func-tional regulators of central carbon metabolism.
gene-regulatory networks | regulatory systems biology | transcriptome |engineering | Saccharomyces cerevisiae
The central premise of regulatory systems biology is that asystematic map of a cell’s regulatory machinery will enable us
to understand, predict, and rationally manipulate the cell’s stateor behavior. Manipulation of cellular state has many promisingapplications, including stem cell biology and regenerative med-icine, biofuel production, and gene therapy. Progress towardcellular state control has been driven by both the systems biologyand the synthetic biology research communities. Systems biologyhas produced whole-genome regulatory network maps (1), butrelatively little research has focused on using these maps forpredicting and manipulating cellular behavior (2). Regulatorysynthetic biology has focused on creating molecular circuits thatcan be placed into a cell to control the transcription of a smallnumber of transgenes, but genome-scale engineering of the cell’snative regulatory apparatus is still rare, with most systems re-stricted to a limited set of controlled targets (3). Here, wedemonstrate that transcription factor (TF) network mapping,gene expression profiling, and computational modeling can beintegrated to rationally engineer transcriptional state. We callthis activity, which bridges the gap between systems biology andsynthetic biology, “transcriptome engineering.”Transcriptome engineering focuses on the manipulation of
extant regulatory networks to enforce a state associated with adesired phenotype. The use of native regulatory mechanisms andnetwork models enables designers to access evolutionarily opti-mized states and to rationally control the expression of hundredsof genes (4). Although there has been previous work on tran-scriptome engineering via random mutagenesis, we use the termhere to refer to rational, design-based approaches (5). Most
previous work on transcriptome engineering has taken place inthe context of stem cell engineering, with the generation of in-duced pluripotency being the most prominent example (6). Sincethen, many transcriptional interventions have been identifiedthat move cells along a specified lineage (7). However, currentstrategies for lineage conversion are typically guided by humanexpertise rather than generally applicable analytical methods andoften are unable to fully convert cells to the desired fate (8–10).In the past year, several algorithms have been proposed for
recommending TFs to overexpress to convert mammalian cellsfrom one cell type to another (8, 11, 12). These are importantcontributions to regenerative medicine, but they are not generalalgorithms for moving cells from any transcriptional state to anyother transcriptional state. For example, the CellNet (8) rec-ommendation system requires many expression profiles for thetarget cell type after many distinct perturbations of that cell type.CellNet is intentionally biased toward TFs with many targetgenes, and it recommends only activators to overexpress, notactivators to knock down or interventions on repressors (13).The Mogrify (11) system requires multiple input databases in-cluding a protein–protein interaction network, considers only theactivation of genes expressed in the target state (not the re-pression of genes that are not expressed), and focuses on TFs
Significance
The ability to engineer specific behaviors into cells would havea significant impact on biomedicine and biotechnology, in-cluding applications to regenerative medicine and biofuelsproduction. One way to coax cells to behave in a desired way isto globally modify their gene expression state, making it morelike the state of cells with the desired behavior. This paperintroduces a broadly applicable algorithm for transcriptomeengineering—designing transcription factor deletions or over-expressions to move cells to a gene expression state that isassociated with a desired phenotype. This paper also presentsan approach to benchmarking and validating such algorithms.The availability of systematic, objective benchmarks for acomputational task often stimulates increased effort and rapidprogress on that task.
Author contributions: D.G.M., E.J.M., and M.R.B. designed research; D.G.M., E.J.M., H.B.,S.R.G., C.F., and R.H.B. performed research; D.G.M. and E.J.M. analyzed data; D.G.M., E.J.M.,and M.R.B. wrote the paper.
The authors declare no conflict of interest.
This article is a PNAS Direct Submission.
Freely available online through the PNAS open access option.
Data deposition: The data reported in this paper have been deposited in the Gene Ex-pression Omnibus (GEO) database, www.ncbi.nlm.nih.gov/geo (accession no. GSE69682).1D.G.M. and E.J.M. contributed equally to this work.2To whom correspondence should be addressed. Email: [email protected].
This article contains supporting information online at www.pnas.org/lookup/suppl/doi:10.1073/pnas.1603577113/-/DCSupplemental.
E7428–E7437 | PNAS | Published online November 3, 2016 www.pnas.org/cgi/doi/10.1073/pnas.1603577113

that are differentially expressed (DE) between the source andtarget cells (not those that are activated by posttranscriptionalmechanisms). Finally, these systems have been tested on only ahandful of conversion tasks, perhaps because of the technicalchallenges of mammalian cell culture, transdifferentiation, andcell type determination.In this paper, we introduce and systematically evaluate Net-
Surgeon, a broadly applicable algorithm for recommending TFdeletions or overexpressions to move cells from an initial (cur-rent) expression state to any desired state associated with anydesired phenotype. The only inputs it requires are one expressionprofile of the initial state, one expression profile of cells in thetarget state, and an approximate transcriptional regulatory mapindicating the direct targets of each TF. The network map can bederived from gene expression data by NetProphet (14) or othernetwork inference algorithms, from TF binding motifs determinedin vitro, or from in vivo binding data derived by methods such aschromatin immunoprecipitation sequencing (ChIP-seq) or CallingCards (15, 16). Unlike the CellNet recommendation system (8),NetSurgeon considers all genes that are DE between the initial andtarget states, not only those that increase, it considers interventionson all TFs whether or not they are DE, and it has no bias towardTFs with large numbers of targets. Instead, it prefers interventionson TFs most of whose targets are predicted to move in the desireddirection upon deletion or overexpression of the TF. Because itconsiders the predicted direction of change, NetSurgeon has nobias toward activators over repressors or overexpression overknockdown. CellNet, by contrast, considers only interventions in
which activators are overexpressed. We also introduce a systematic,genome-scale evaluation procedure for general transcriptomeengineering algorithms. Saccharomyces cerevisiae is ideal forevaluating transcriptome engineering because of the ease of ex-perimental testing in yeast and the wealth of data available for TFnetwork mapping and algorithmic validation (17–20).After evaluation on existing yeast data, we apply NetSurgeon to
the goal of improving xylose fermentation in S. cerevisiae. Xylose isa five-carbon sugar that is found, together with glucose and othersugars, in cellulosic biomass. Although S. cerevisiae is the mostcommonly used organism for industrial ethanol production, itsinefficient fermentation of pentoses has hampered the productionof ethanol from lignocellulosic biomass (21). Recombinant yeaststrains expressing transgenes that facilitate integration of xyloseinto central carbon metabolism have been constructed (22, 23).However, when they are grown in mixed glucose/xylose cultures,which would be encountered in lysates of cellulosic biomass, theyrapidly ferment all available glucose and then shift into a re-spiratory metabolic state in which little if any ethanol is produced(23). This led us to hypothesize that engineering yeast cells to havea gene expression profile in xylose similar to the profile of wild-type (WT) cells in glucose would increase ethanol yield.
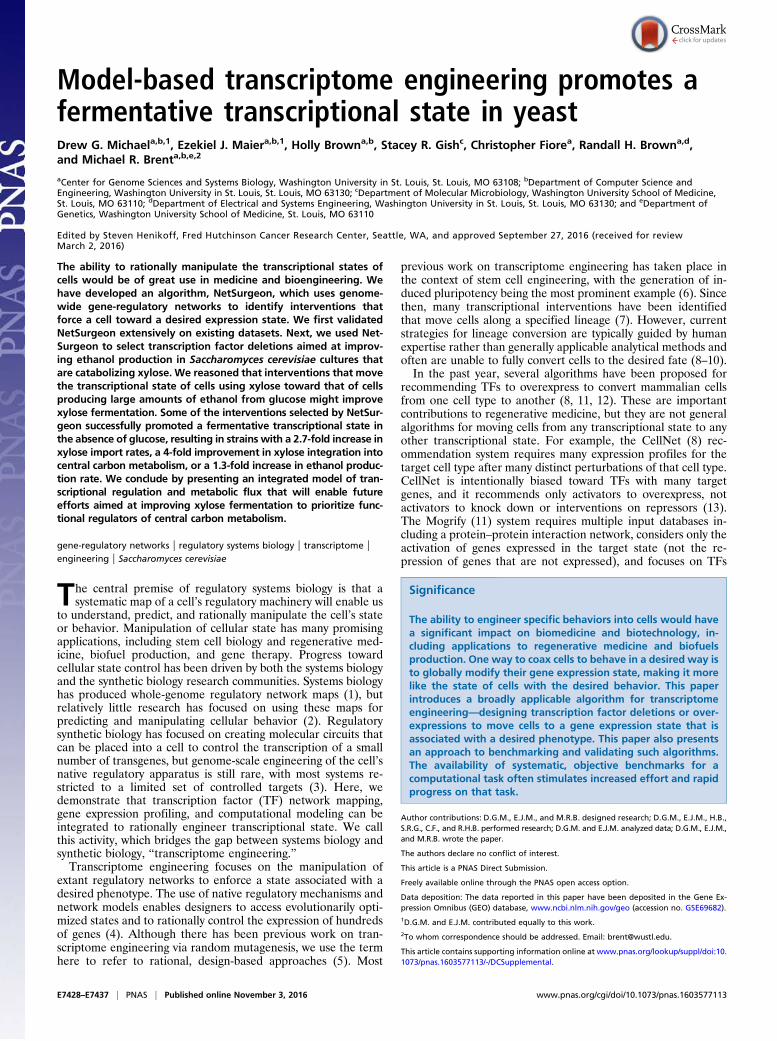
ResultsAlgorithmic Approach to Transcriptome Engineering. Our approachconsists of three steps. First, we build a genome-wide map of thenetwork of direct, functional regulation (Fig. 1A). Each TF–target relationship in this map is labeled as either activating or
Expression Profiles
DNA Binding Motifs
Network map
Initial GoalNetwork map
TF deletion simulation
Regulator Prioritization
+TF deletion
Quantitative Phenotyping
Expression Profiling
Assessment
g1g2g3
g1g2g3
Low ExpressionHigh Expression
state state
TFA TFB
TFA TFB
+ - - - - - -
Wrong sign
TFA
- - -
Expression lower in goal state
Expression higher in goal state
No expression difference
Positives
Draws Successes
TFA
-
- -
+ +
+ +
A B
D
C
Fig. 1. Overview of computational and experimental approach for control of transcriptional state. (A) A gene-regulatory network map is constructed fromexpression profiles and DNA binding motifs. (B) Given an initial state (gene expression profile), a goal state, and a network map, NetSurgeon simulates thequalitative effects of each intervention (symbolized by the scissors icon) on the expression of each gene. Predicted effects that move the expression of a targetgene in the desired direction are indicated by green check marks. Using the results of the simulation, NetSurgeon assigns a priority score to each intervention thatreflects its confidence that the intervention will move the cell from the initial state toward the goal state. (C) High-priority interventions are carried out, and theireffects on the expression profile and the desired phenotype are assessed quantitatively. (D) NetSurgeon scores are calculated using the hypergeometric prob-ability function with draws, positives, and successes as indicated (see text for details). Arrowheads indicate activation, and T heads indicate repression.
Michael et al. PNAS | Published online November 3, 2016 | E7429
BIOPH
YSICSAND
COMPU
TATIONALBIOLO
GY
PNASPL
US
repressing. Second, we define starting and goal transcriptional statesand apply NetSurgeon, which searches through all possible inter-ventions (TF deletions or overexpressions) to identify those that arelikely to move the transcriptional state toward the goal state (Fig.1B). Finally, we construct strains containing the predicted best in-terventions, profile their transcriptomes, and quantitatively assaythe phenotypes of interest—in this study, sugar consumption andthe production of biomass and major metabolic products (Fig. 1C).NetSurgeon assigns a score to each possible intervention, rep-
resenting its confidence that the intervention will yield a sub-stantial shift toward the goal state. The score is loosely based onthe cumulative hypergeometric distribution, where the universe isthe set of all genes. The “positives” are the genes that are sig-nificantly differently expressed between the initial state and thegoal state, optionally intersected with a set of genes involved in aprocess of interest (Fig. 1D). In the hypergeometric enrichmentcalculation, the “draws” are the target genes of the TF on whichthe intervention acts, as specified by the input network map. Thesuccesses are the positives drawn—that is, the targets of the TFthat are also DE between initial and goal states. To count as asuccess, a gene must not only be a target of the TF, it must also bepredicted to move in the direction of the goal state as a result ofthe intervention (Fig. 1D). Deletion of a TF is predicted to in-crease the expression of targets it represses and decrease expres-sion of targets it activates. Overexpression of a TF is predicted tohave the opposite effects.The NetSurgeon score is not used for hypothesis testing—that
is, rejecting a null hypothesis. It is simply a convenient formulafor calculating a score that increases when either of two numbers(the number of targets or the fraction of targets that are DEbetween the initial and goal states) increases while the other isheld constant. The NetSurgeon score differs from the P value ofa hypergeometric enrichment test in that different genes amongthe positives have different weights. This weighting does notchange the total number of positives, but it allocates that numberunequally among the DE genes. Thus, the number of successes isnot just the number of targets that are DE and predicted to movein the right direction, it is the sum of the weights of those targets.To calculate the weight of each gene, we take advantage of thefact that the initial and goal states are both defined by measuredexpression profiles, so we can calculate a q value (false-discoveryrate) for each gene being DE. All genes that pass a q-valuethreshold for being significantly DE (we used q < 0.05) areweighted by the negative logarithm of the their q values, nor-malized by the sum of the negative log q values of all positives:
Wi =−log qi
−P
j∈D log qj,
where qi is the false-discovery rate for gene i being DE betweenthe initial and goal states and D is the set of indices of geneswhose q value is below the threshold. The sum of Wi over all DEgenes is 1. The number of successes for intervention k, Sk, is thetotal number of DE genes times the sum of the weights of theDE genes that are targets of the TF:
Sk = kDkX
i∈TkWi,
where Tk is the index set of targets that are predicted to movetoward the goal state as a result of the intervention. The Net-Surgeon score for intervention k given a fixed network is then thehypergeometric probability of obtaining at least Sk positiveswhen drawing a sample of size T from a universe of all genescontaining jjDjj positives, where T is the total number of targetsof the perturbed TF.For a given network map in which each gene is categorized as
repressed, activated, or unregulated by each TF, the scores for
interventions are calculated as above. However, network-mappingalgorithms typically return a list of possible TF–target relationsranked from most confident to least confident; setting a confi-dence threshold is left to the user. NetSurgeon therefore makesthe score calculation described above using various thresholds andtakes the maximum score over all thresholds considered. It con-siders a threshold that includes only the top 500 interactions, thetop 1,000, the top 1,500, and so on, down to the top 40,000.
Building a TF Network Map. To test this approach, we first built anintegrated gene-regulatory network map by combining separatefunctional and physical maps. The functional map was built byusing NetProphet, an expression-based mapping algorithm thatcombines a differential expression analysis and a regression analysis(14). Each possible TF–target pair is assigned a differentialexpression score that is equal to the log odds that the putative targetis DE when the TF is perturbed, given the available replicate ex-pression profiles. Each pair is also assigned a regression score basedon a regularized regression of the expression level of the target gene(the dependent variable) against the expression levels of all TFs (thepredictor variables). The regression score for a given TF–target pairis simply the regression coefficient assigned to the TF’s expressionlevel as a predictor of the target’s expression level. The differentialexpression and regression scores are combined to provide a finalscore representing NetProphet’s confidence that the TF binds andregulates the target (see ref. 14 for details). For this paper, we ranNetProphet with 320 potential regulators including proteins withDNA-binding domains, chromatin factors, and other members ofDNA-binding protein complexes that regulate gene expression. Theinput data were gene expression profiles of 269 regulator deletionstrains grown in rich medium with glucose (19). For the 51 po-tential regulators for which there was no expression-profiled de-letion, strain 0 was used as the differential expression componentof the NetProphet score. The physical map was built by scanningposition weight matrix (PWM) models over all yeast promoters(17) to estimate the potential of each TF to bind each promoter(see SI Materials and Methods for details). We integrated thefunctional and physical network maps by assigning to each TF–target pair a score that was equal to the geometric mean of thescores assigned to it in the functional and physical networks. Werefer to this as the NetProphet+PWM network.
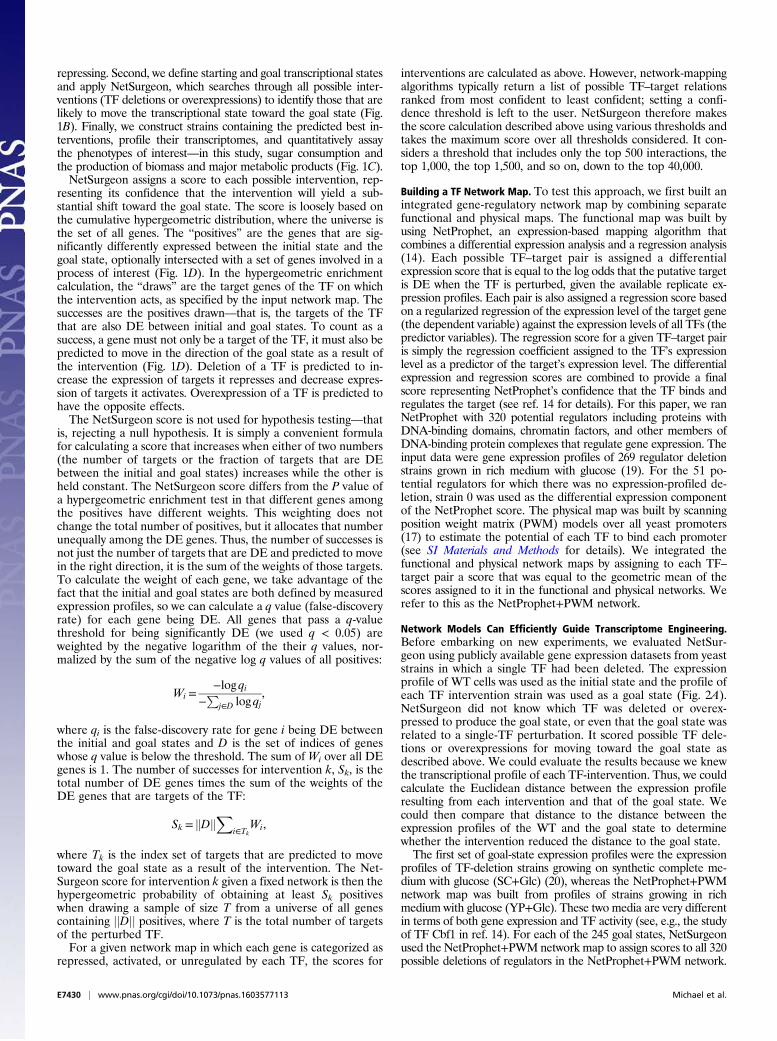
Network Models Can Efficiently Guide Transcriptome Engineering.Before embarking on new experiments, we evaluated NetSur-geon using publicly available gene expression datasets from yeaststrains in which a single TF had been deleted. The expressionprofile of WT cells was used as the initial state and the profile ofeach TF intervention strain was used as a goal state (Fig. 2A).NetSurgeon did not know which TF was deleted or overex-pressed to produce the goal state, or even that the goal state wasrelated to a single-TF perturbation. It scored possible TF dele-tions or overexpressions for moving toward the goal state asdescribed above. We could evaluate the results because we knewthe transcriptional profile of each TF-intervention. Thus, we couldcalculate the Euclidean distance between the expression profileresulting from each intervention and that of the goal state. Wecould then compare that distance to the distance between theexpression profiles of the WT and the goal state to determinewhether the intervention reduced the distance to the goal state.The first set of goal-state expression profiles were the expression
profiles of TF-deletion strains growing on synthetic complete me-dium with glucose (SC+Glc) (20), whereas the NetProphet+PWMnetwork map was built from profiles of strains growing in richmedium with glucose (YP+Glc). These two media are very differentin terms of both gene expression and TF activity (see, e.g., the studyof TF Cbf1 in ref. 14). For each of the 245 goal states, NetSurgeonused the NetProphet+PWM network map to assign scores to all 320possible deletions of regulators in the NetProphet+PWM network.
E7430 | www.pnas.org/cgi/doi/10.1073/pnas.1603577113 Michael et al.
The 320 included 75 “distractor” regulators that were present in theNetProphet+PWM network but did not correspond to goal states.We plotted the cumulative percentage of goal states for whichNetSurgeon ranked the best intervention (the one that actuallyproduced the goal state profile) at or above each rank (Fig. 2B,green). We compared NetSurgeon performance to random rankingof TF deletions (Fig. 2B, dotted black) and found that NetSurgeonassigns higher ranks to the correct interventions (Mann–Whitney Utest, P < 10−23). NetSurgeon ranks the correct intervention withinthe top five, a reasonable number to test experimentally, for 91 goalstates, which is 24 times better than chance (P < 10−96). We also ran
NetSurgeon on 100 random networks with the same topology as theNetProphet+PWM network (Fig. 2B, gray) and observed perfor-mance at random chance levels, indicating that an accurate networkis critical for NetSurgeon.We then repeated the analyses described above using goal states
defined by cells cultured in conditions even further from those usedto construct the input network map. These goal states consisted of63 expression profiles obtained from regulator overexpressionstrains grown in SC+Gal (24) (defined medium with galactose),whereas the NetProphet+PWM network was built using expressionprofiles from regulator deletion strains growing in YP+Glc (rich
D
5% ChIP Recovery AUC0 0.05 0.10 0.15 0.20 0.25 0.30
Cel
l Sta
te S
elec
tion
AU
C
0.50
0.55
0.60
0.65
0.70
0.75
0.80 NetProphetNetProphet
+ PWM
Regression
CLR
Correlation Glc; TF DeletionsGal; TF OEs
E
B C
Cum
ulat
ive
perc
enta
ge o
f goa
l sta
tes
at o
r abo
ve th
e in
dica
ted
rank
100%
80%
60%
40%
20%
0%
Rank among prioritized interventions1 50 100 150 200 250 300 1 50 100 150 200 250 300
100%
80%
60%
40%
20%
0%Netprophet + PWMRandom
Netprophet + PWMRandom
Held-out Expression StatesProfiles in SC Gal or SC Glc
Initial WT
Goal TFA
A
Random networkNetProphet+PWMAll Useful Most Useful Any Useful
deriuqeR
snoitnevretnIforebmu
N 0
30
60
90
120
150
180
210
Prioritized interventionsRank Intervention
1 2 3 4
TFETFATFDTFB
*
*Correct Intervention
NetSurgeon
Rank among prioritized interventions
Expression profiles in YPD
DNA binding motifs
Network map
Cum
ulat
ive
perc
enta
ge o
f goa
l sta
tes
at o
r abo
ve th
e in
dica
ted
rank
… …
5 TFK
Fig. 2. Benchmarking NetSurgeon on existing data. (A) Overview of our approach to benchmarking NetSurgeon on existing expression data. (B) Cumulativepercentage of correct picks (the TFs that were actually deleted to generate the goal state profile; y axis) prioritized above the rank indicated on the x axis. Thegoals states were the expression profiles 245 regulator deletion mutants growing in synthetic complete medium (SC) supplemented with 2% glucose.NetSurgeon ranking using the NetProphet+PWM network map (green), NetSurgeon ranking using random permutations of the NetProphet+PWM map(gray), and the expectation for randomly ranked interventions (dotted line). (C) Same as B for goal states defined by the expression profiles of 63 TFoverexpression strains growing in SC supplemented with 2% galactose. (D) Median number of top-ranked NetSurgeon interventions required to include alluseful interventions, the most useful intervention, or any useful intervention (lower is better). Useful interventions are defined as those that reduce thedistance to the goal state by at least 10%. The analogous numbers for randomly ranked networks are shown in gray. (E) NetSurgeon accuracy as a function ofthe accuracy of the input TF network map for five networks, where NetSurgeon is assessed with goal states defined by TF deletion strains in SC with glucose(green) or TF overexpression strains in SC with galactose (orange). NetSurgeon accuracy is summarized by the area under curves analogous to those shown inB and C. The accuracy of the input GRNs is assessed using ChIP-supported interactions as the gold standard and summarized by the area under the precisionrecall curve from 0% to 5% recall (SI Materials and Methods).
Michael et al. PNAS | Published online November 3, 2016 | E7431
BIOPH
YSICSAND
COMPU
TATIONALBIOLO
GY
PNASPL
US
medium with glucose). As expected, performance on this morechallenging task was not as good as when the goals states were fromregulator deletion strains grown on SC+Glc. Nonetheless, NetSur-geon assigned higher ranks to the correct interventions comparedwith randomly assigned ranks (Mann–WhitneyU test, P < 10−3) andassigned the best intervention a top five rank for 8 of the 63 goalstates (13%), an eightfold improvement over chance (P < 10−5).To assess the practicality of NetSurgeon-guided transcriptome
engineering, we ran NetSurgeon on the NetProphet+PWM networkand the SC+Glc goal set (20) and computed the median number oftop-ranked interventions that would need to be tested to identify thesingle most useful intervention. NetSurgeon can identify the singlemost useful intervention (the one that produced the goal state) in amedian of 22 predictions, whereas random guessing would take 161tries. An intervention was deemed useful if it reduced the distancebetween the WT cells and the goal by at least 10% (Fig. 2D). Net-Surgeon can identify at least one useful intervention in a median of13 predictions, whereas random guessing would take 134 tries.
NetSurgeon Accuracy Depends on the Accuracy of the TF NetworkMap. To evaluate the effect of network accuracy on NetSurgeonperformance, we applied NetSurgeon to network maps inferredfrom the same expression dataset as before but using differentalgorithms for TF network mapping: CLR (25), LASSO regression(26), NetProphet alone (14), and NetProphet integrated withPWM scores. We first evaluated the structural accuracy of the fivemaps by their level of support from ChIP data. The results showthat NetProphet is more accurate than a simple LASSO regressionapproach, which is more accurate than CLR, consistent with ourpreviously published comparison of these algorithms (14) (see ref. 27for a recent review of TF network mapping algorithms.) As expected,scoring potential TF–target relations by the correlation of the TF’sexpression level with target’s expression level performed worse thanCLR, which postprocesses correlation coefficients. Also as expected,supplementing NetProphet scores with scores reflecting the TF’spotential for binding the sequences in the promoter region of eachgene improved accuracy above that of NetProphet alone. We thenplotted the accuracy of NetSurgeon when using each of these fiveinput maps on our two goal sets—the TF-deletion strains in SC+Glcand TF-overexpression strains in SC+Galactose—against the accu-racy of the input map (Fig. 2E). This shows a clear pattern of im-proved NetSurgeon performance with more accurate network maps.
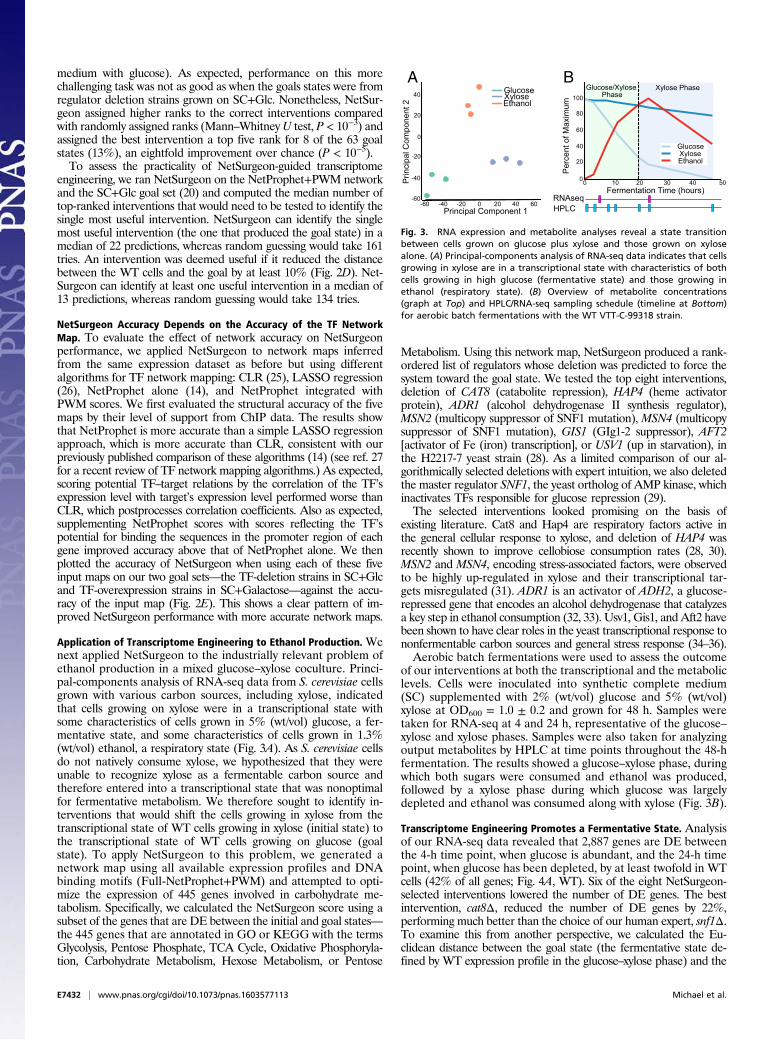
Application of Transcriptome Engineering to Ethanol Production. Wenext applied NetSurgeon to the industrially relevant problem ofethanol production in a mixed glucose–xylose coculture. Princi-pal-components analysis of RNA-seq data from S. cerevisiae cellsgrown with various carbon sources, including xylose, indicatedthat cells growing on xylose were in a transcriptional state withsome characteristics of cells grown in 5% (wt/vol) glucose, a fer-mentative state, and some characteristics of cells grown in 1.3%(wt/vol) ethanol, a respiratory state (Fig. 3A). As S. cerevisiae cellsdo not natively consume xylose, we hypothesized that they wereunable to recognize xylose as a fermentable carbon source andtherefore entered into a transcriptional state that was nonoptimalfor fermentative metabolism. We therefore sought to identify in-terventions that would shift the cells growing in xylose from thetranscriptional state of WT cells growing in xylose (initial state) tothe transcriptional state of WT cells growing on glucose (goalstate). To apply NetSurgeon to this problem, we generated anetwork map using all available expression profiles and DNAbinding motifs (Full-NetProphet+PWM) and attempted to opti-mize the expression of 445 genes involved in carbohydrate me-tabolism. Specifically, we calculated the NetSurgeon score using asubset of the genes that are DE between the initial and goal states—the 445 genes that are annotated in GO or KEGG with the termsGlycolysis, Pentose Phosphate, TCA Cycle, Oxidative Phosphoryla-tion, Carbohydrate Metabolism, Hexose Metabolism, or Pentose
Metabolism. Using this network map, NetSurgeon produced a rank-ordered list of regulators whose deletion was predicted to force thesystem toward the goal state. We tested the top eight interventions,deletion of CAT8 (catabolite repression), HAP4 (heme activatorprotein), ADR1 (alcohol dehydrogenase II synthesis regulator),MSN2 (multicopy suppressor of SNF1 mutation), MSN4 (multicopysuppressor of SNF1 mutation), GIS1 (GIg1-2 suppressor), AFT2[activator of Fe (iron) transcription], or USV1 (up in starvation), inthe H2217-7 yeast strain (28). As a limited comparison of our al-gorithmically selected deletions with expert intuition, we also deletedthe master regulator SNF1, the yeast ortholog of AMP kinase, whichinactivates TFs responsible for glucose repression (29).The selected interventions looked promising on the basis of
existing literature. Cat8 and Hap4 are respiratory factors active inthe general cellular response to xylose, and deletion of HAP4 wasrecently shown to improve cellobiose consumption rates (28, 30).MSN2 and MSN4, encoding stress-associated factors, were observedto be highly up-regulated in xylose and their transcriptional tar-gets misregulated (31). ADR1 is an activator of ADH2, a glucose-repressed gene that encodes an alcohol dehydrogenase that catalyzesa key step in ethanol consumption (32, 33). Usv1, Gis1, and Aft2 havebeen shown to have clear roles in the yeast transcriptional response tononfermentable carbon sources and general stress response (34–36).Aerobic batch fermentations were used to assess the outcome
of our interventions at both the transcriptional and the metaboliclevels. Cells were inoculated into synthetic complete medium(SC) supplemented with 2% (wt/vol) glucose and 5% (wt/vol)xylose at OD600 = 1.0 ± 0.2 and grown for 48 h. Samples weretaken for RNA-seq at 4 and 24 h, representative of the glucose–xylose and xylose phases. Samples were also taken for analyzingoutput metabolites by HPLC at time points throughout the 48-hfermentation. The results showed a glucose–xylose phase, duringwhich both sugars were consumed and ethanol was produced,followed by a xylose phase during which glucose was largelydepleted and ethanol was consumed along with xylose (Fig. 3B).
Transcriptome Engineering Promotes a Fermentative State. Analysisof our RNA-seq data revealed that 2,887 genes are DE betweenthe 4-h time point, when glucose is abundant, and the 24-h timepoint, when glucose has been depleted, by at least twofold in WTcells (42% of all genes; Fig. 4A, WT). Six of the eight NetSurgeon-selected interventions lowered the number of DE genes. The bestintervention, cat8Δ, reduced the number of DE genes by 22%,performing much better than the choice of our human expert, snf1Δ.To examine this from another perspective, we calculated the Eu-clidean distance between the goal state (the fermentative state de-fined by WT expression profile in the glucose–xylose phase) and the
500 10 20 30 40Fermentation Time (hours)
100
80
60
40
20
0
Per
cent
of M
axim
um
XyloseGlucose
Ethanol
Xylose Phase
Principal Component 1
Prin
cipa
l Com
pone
nt 2
GlucoseXyloseEthanol
-60
-40
-20
0
20
40
-60 -40 -20 0 20 40 60
A B
RNAseqHPLC
Glucose/Xylose Phase
Fig. 3. RNA expression and metabolite analyses reveal a state transitionbetween cells grown on glucose plus xylose and those grown on xylosealone. (A) Principal-components analysis of RNA-seq data indicates that cellsgrowing in xylose are in a transcriptional state with characteristics of bothcells growing in high glucose (fermentative state) and those growing inethanol (respiratory state). (B) Overview of metabolite concentrations(graph at Top) and HPLC/RNA-seq sampling schedule (timeline at Bottom)for aerobic batch fermentations with the WT VTT-C-99318 strain.
E7432 | www.pnas.org/cgi/doi/10.1073/pnas.1603577113 Michael et al.
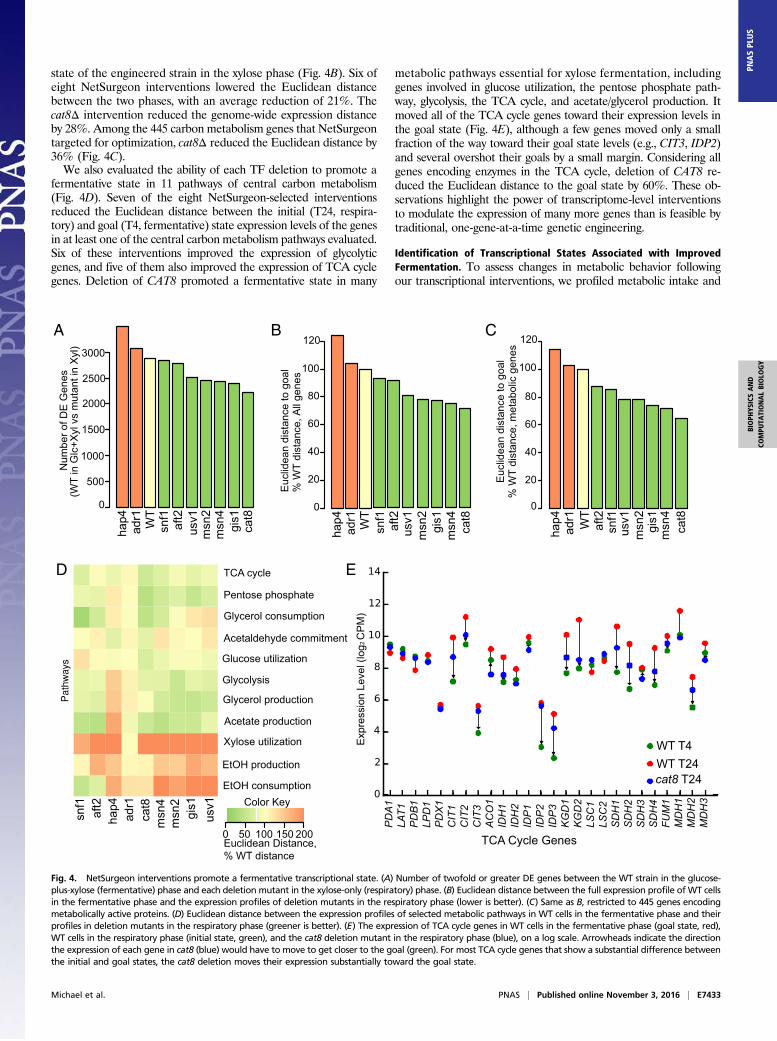
state of the engineered strain in the xylose phase (Fig. 4B). Six ofeight NetSurgeon interventions lowered the Euclidean distancebetween the two phases, with an average reduction of 21%. Thecat8Δ intervention reduced the genome-wide expression distanceby 28%. Among the 445 carbon metabolism genes that NetSurgeontargeted for optimization, cat8Δ reduced the Euclidean distance by36% (Fig. 4C).We also evaluated the ability of each TF deletion to promote a
fermentative state in 11 pathways of central carbon metabolism(Fig. 4D). Seven of the eight NetSurgeon-selected interventionsreduced the Euclidean distance between the initial (T24, respira-tory) and goal (T4, fermentative) state expression levels of the genesin at least one of the central carbon metabolism pathways evaluated.Six of these interventions improved the expression of glycolyticgenes, and five of them also improved the expression of TCA cyclegenes. Deletion of CAT8 promoted a fermentative state in many
metabolic pathways essential for xylose fermentation, includinggenes involved in glucose utilization, the pentose phosphate path-way, glycolysis, the TCA cycle, and acetate/glycerol production. Itmoved all of the TCA cycle genes toward their expression levels inthe goal state (Fig. 4E), although a few genes moved only a smallfraction of the way toward their goal state levels (e.g., CIT3, IDP2)and several overshot their goals by a small margin. Considering allgenes encoding enzymes in the TCA cycle, deletion of CAT8 re-duced the Euclidean distance to the goal state by 60%. These ob-servations highlight the power of transcriptome-level interventionsto modulate the expression of many more genes than is feasible bytraditional, one-gene-at-a-time genetic engineering.
Identification of Transcriptional States Associated with ImprovedFermentation. To assess changes in metabolic behavior followingour transcriptional interventions, we profiled metabolic intake and
A
Num
ber o
f DE
Gen
es
(WT
in G
lc+X
yl v
s m
utan
t in
Xyl
)
0
500
1000
1500
2000
2500
3000
D TCA cycle
Pentose phosphate
Glycerol consumption
Acetaldehyde commitment
Glucose utilization
Glycolysis
Glycerol production
Acetate production
Xylose utilization
EtOH production
EtOH consumption
snf1
aft2
hap4
adr1
cat8
msn
4m
sn2
gis1
usv1
0 50 100 150 200Euclidean Distance, % WT distance
Color Key
B
Euc
lidea
n di
stan
ce to
goa
l %
WT
dist
ance
, All
gene
s 100
80
60
40
20
0
120
E
PDA1
LAT1
PDB1
LPD1
PDX1
CIT1
CIT2
CIT3
ACO1
IDH1
IDH2
IDP1
IDP2
IDP3
KGD1
KGD2
LSC1
LSC2
SDH1
SDH2
SDH3
SDH4
FUM1
MDH1
MDH2
MDH3
Exp
ress
ion
Leve
l (lo
g 2 C
PM
)
C
cat8
msn
4gi
s1m
sn2
usv1
snf1
aft2
WT
adr1
hap4
cat8 T24WT T24WT T4
Euc
lidea
n di
stan
ce to
goa
l %
WT
dist
ance
, met
abol
ic g
enes
100
80
60
40
20
0
120
TCA Cycle Genes
cat8
msn
4gi
s1m
sn2
usv1
snf1
aft2
WT
adr1
hap4
cat8
msn
4gi
s1
msn
2us
v1
snf1
aft2
WT
adr1
hap4
Fig. 4. NetSurgeon interventions promote a fermentative transcriptional state. (A) Number of twofold or greater DE genes between the WT strain in the glucose-plus-xylose (fermentative) phase and each deletion mutant in the xylose-only (respiratory) phase. (B) Euclidean distance between the full expression profile of WT cellsin the fermentative phase and the expression profiles of deletion mutants in the respiratory phase (lower is better). (C) Same as B, restricted to 445 genes encodingmetabolically active proteins. (D) Euclidean distance between the expression profiles of selected metabolic pathways in WT cells in the fermentative phase and theirprofiles in deletion mutants in the respiratory phase (greener is better). (E) The expression of TCA cycle genes in WT cells in the fermentative phase (goal state, red),WT cells in the respiratory phase (initial state, green), and the cat8 deletion mutant in the respiratory phase (blue), on a log scale. Arrowheads indicate the directionthe expression of each gene in cat8 (blue) would have to move to get closer to the goal (green). For most TCA cycle genes that show a substantial difference betweenthe initial and goal states, the cat8 deletion moves their expression substantially toward the goal state.
Michael et al. PNAS | Published online November 3, 2016 | E7433
BIOPH
YSICSAND
COMPU
TATIONALBIOLO
GY
PNASPL
US

output via HPLC. We calculated the carbon import rate per unitbiomass for each strain and displayed the percentage of input car-
bon that is directed to each of the major carbon fates in each growthphase (Fig. 5 A and B). Carbon import rates declined in the xylose
WTsn
f1ca
t8ha
p4adr1us
v1gis
1msn
2msn
4aft
2
Glucose
g A
naly
te/g
Bio
mas
s/hr
C
WTsn
f1ca
t8ha
p4adr1us
v1gis
1msn
2msn
4aft
2
XyloseD
Glucose/Xylose Phase
WT
snf1
cat8
hap4 ad
r1us
v1gis
1msn
2msn
4aft
2
INP
UTS
WT
snf1
cat8
hap4
adr1
usv1
gis1
msn2
msn4
aft2
OU
TPU
TS
100
80
60
40
20
0
Per
cent
of i
nput
car
bon
Xylose PhaseA B
**
**
*
Inpu
t car
bon
(g C
/g B
iom
ass/
hr)
0.40
0.35
0.30
0.25
0.20
0.15
0.10
0.05
0
0.40
0.35
0.30
0.25
0.20
0.15
0.10
0.05
0
100
80
60
40
20
0
0.70.6
0.50.4
0.30.20.1
0
g A
naly
te/g
Bio
mas
s/hr 0.30
0.25
0.20
0.15
0.10
0.05
0
WTsn
f1ca
t8ha
p4ad
r1us
v1gis1msn
2msn
4aft
2
Acetic AcidE
**
*
g A
naly
te/g
Bio
mas
s/hr 0.0035
0.00300.00250.00200.00150.00100.0005
0W
Tsn
f1ca
t8ha
p4ad
r1us
v1gis
1msn
2msn
4aft
2
EthanolF
* *
* * * *
g A
naly
te/g
Bio
mas
s/hr 0.25
0.20
0.15
0.10
0.05
0
Residual (CO2)BiomassEthanol
GlucoseXyloseXylitolGlycerolAcetic Acid
Inpu
t car
bon
(g C
/g B
iom
ass/
hr)
Per
cent
of i
nput
car
bon
Fig. 5. Transcriptome engineering alters carbon uptake rates and commitment ratios but does not prevent the transition to respiratory metabolism. (A) Theabsolute rate of carbon uptake (Top) and the distribution of carbon fates (Bottom) during the fermentative (glucose-plus-xylose) phase. (B) Same as A for therespiratory (xylose) phase. Red in Top panel indicates net ethanol consumption. (C) Specific rate of glucose consumption (fermentative phase); asterisksindicate a difference from WT with P < 0.05 by Benjamini–Hochberg-corrected t test. (D) Same as C for xylose consumption. (E) Same as C for acetic acidproduction. (F) Same as C for ethanol production.
E7434 | www.pnas.org/cgi/doi/10.1073/pnas.1603577113 Michael et al.
phase by 86%, on average, and the cells significantly shifted theircarbon commitment from fermentative to respiratory processes inthe xylose phase. The proportion of input carbon released as CO2increased from a mean of 24% in the glucose–xylose phase to 89%in the xylose-only phase.Although the interventions we tested did not prevent the
transition from fermentative to respiratory metabolism, they didaffect carbon fate significantly. Fractional carbon commitment toevery measured metabolite was altered by at least one of the TFdeletions. The xylitol fraction was significantly increased by in-terventions affecting TFs associated with respiratory processes, apotential side effect of the respiratory factors regulating thepromoters of the XYL1, XYL2, and XKS1 transgenes, which en-code enzymes required for integrating xylose into central carbonmetabolism. Interestingly, all significant changes in the fraction ofinput carbon allocated to ethanol or biomass were reductions. Thedeletions of SNF1, HAP4, USV1, GIS1, MSN4, and AFT1 signif-icantly reduced the fraction of carbon committed to ethanol (av-erage, 26%). Deletions of CAT8 and HAP4 reduced carboncommitment to biomass by 33% and 38%, respectively, in theglucose–xylose phase.We also analyzed the specific rate (rate per unit biomass) of
production of each metabolite by each strain (Fig. 5 C–F). Thisdiffers from the previous analysis, which focused on the fractionof carbon input allocated to each carbon fate. Although none ofthe interventions increased the fraction of input carbon allocatedto ethanol, some interventions increased the specific rate ofcarbon input and hence the specific rate of ethanol production inthe glucose–xylose phase. Interventions on respiratory regulators(Cat8, Hap4, and Adr1) improved the specific rate of glucoseconsumption between 11% and 40% (Fig. 5C). The hap4Δ and
msn4Δ mutants improved the specific rate of xylose consumption by170% and 120%, respectively (Fig. 5D). Acetic acid, a fermentationby-product that has been demonstrated to inhibit glycolysis (37), wasproduced at lower specific rates in the hap4 and cat8 mutants (53%and 83%; Fig. 5E). Importantly, the specific rate of ethanol pro-duction was significantly increased by 22% and 31% in the cat8 andhap4 mutants (Fig. 5F). These strains directed a smaller fraction ofthe carbon they consumed toward biomass than WT and their peakethanol levels were significantly higher than those of WT (by 14%and 19%, respectively) and occurred at approximately the same timeas WT (24 h). Among the stress-associated factors, we found that thedeletion of USV1,MSN2,MSN4, and AFT2 significantly reduced thespecific rate of ethanol production (22% on average; Fig. 5F). Takentogether, these data demonstrate that transcriptome engineering cangenerate significant changes in metabolic behavior.
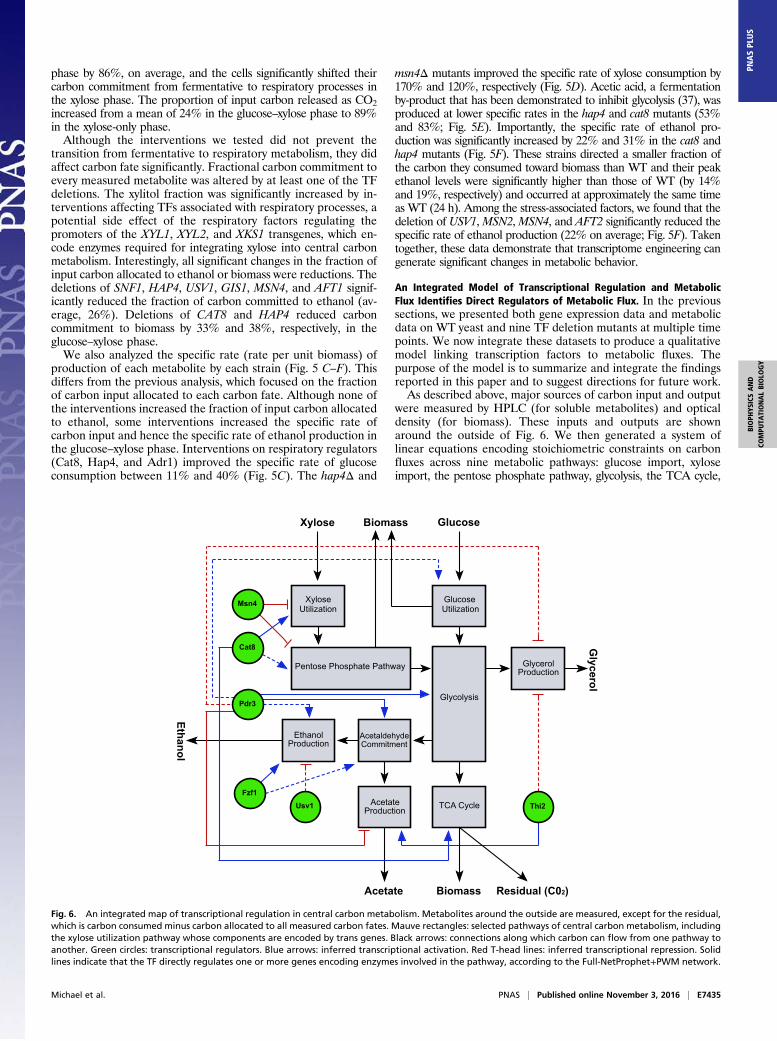
An Integrated Model of Transcriptional Regulation and MetabolicFlux Identifies Direct Regulators of Metabolic Flux. In the previoussections, we presented both gene expression data and metabolicdata on WT yeast and nine TF deletion mutants at multiple timepoints. We now integrate these datasets to produce a qualitativemodel linking transcription factors to metabolic fluxes. Thepurpose of the model is to summarize and integrate the findingsreported in this paper and to suggest directions for future work.As described above, major sources of carbon input and output
were measured by HPLC (for soluble metabolites) and opticaldensity (for biomass). These inputs and outputs are shownaround the outside of Fig. 6. We then generated a system oflinear equations encoding stoichiometric constraints on carbonfluxes across nine metabolic pathways: glucose import, xyloseimport, the pentose phosphate pathway, glycolysis, the TCA cycle,
Xylose Utilization
Pentose Phosphate Pathway
Glucose Utilization
Glycolysis
Glycerol Production
Glycerol
Xylose Glucose
TCA Cycle
Acetaldehyde Commitment
Ethanol Production
Ethanol
Acetate Production
Acetate
Cat8
Msn4
Fzf1Usv1 Thi2
Pdr3
Biomass
Biomass
Residual (C02)
Fig. 6. An integrated map of transcriptional regulation in central carbon metabolism. Metabolites around the outside are measured, except for the residual,which is carbon consumed minus carbon allocated to all measured carbon fates. Mauve rectangles: selected pathways of central carbon metabolism, includingthe xylose utilization pathway whose components are encoded by trans genes. Black arrows: connections along which carbon can flow from one pathway toanother. Green circles: transcriptional regulators. Blue arrows: inferred transcriptional activation. Red T-head lines: inferred transcriptional repression. Solidlines indicate that the TF directly regulates one or more genes encoding enzymes involved in the pathway, according to the Full-NetProphet+PWM network.
Michael et al. PNAS | Published online November 3, 2016 | E7435
BIOPH
YSICSAND
COMPU
TATIONALBIOLO
GY
PNASPL
US
glycerol production and consumption, acetate production/con-sumption, ethanol production and consumption, and biomass pro-duction (Fig. 6, rectangles and black arrows). These equations,together with our measurements and an approximate partitioning ofbiomass into components emanating from each pathway, enabled usto calculate fluxes through the pathways. Together, our measure-ments and the assumption that most of the unaccounted-for carbonwas released as CO2 fully constrained the internal fluxes. Unlikemany flux balance analyses (e.g., refs. 38 and 39), our fully con-strained model did not require the assumption that fluxes are dis-tributed in a way that maximizes biomass production.To link transcriptional states with metabolic flux states, we
computed the Pearson correlation coefficient between the ex-pression of each TF in the yeast genome and the carbon fluxthrough each pathway. The correlation was calculated across allstrains and time points described above. We also generated anull distribution of correlation coefficients by correlating ran-domly permuted gene expression patterns with the metabolicfluxes. We then identified TFs whose expression is significantlycorrelated with metabolic flux (false-discovery rate ≤ 0.01) andgenerated edges (Fig. 6, red and blue lines) linking correlatedTFs (Fig. 6, green circles) with each metabolic pathway. Inter-actions between TFs and pathways were hypothesized to be di-rect (solid lines) if our TF network map supported the TF as adirect regulator of one or more genes encoding proteins in thepathway. This analysis of our data suggested three transcriptionalregulators that may be deeply interconnected with biochemicalpathways important for xylose metabolism and fermentation.CAT8 expression was significantly correlated with carbon fluxthrough the xylose utilization, the pentose phosphate, and theTCA cycle. Msn4 was predicted to directly regulate genes in-volved in xylose utilization and the pentose phosphate pathway,and flux through these pathways was negatively correlated withMSN4 expression. Pdr3 was suggested as a regulator of glycolyticgenes, and flux through glycolysis was positively correlated withPDR3 expression. This integrated model suggests importanttranscriptional regulators that may control both transcriptionaland metabolic state and therefore represent high-value targetsfor future transcriptomic engineering of ethanol productions.
DiscussionIn this paper, we introduced NetSurgeon, an algorithm that uses amap of direct transcriptional regulation to select TFs whose deletionor overexpression will move a cell’s transcriptional state toward aspecified goal. The availability of comprehensive TF deletion andoverexpression collections in S. cerevisiae enabled us to systematicallyassess NetSurgeon’s accuracy on a genome-wide scale. Given theexpression profile of a cell in which a single TF has been deleted,NetSurgeon can identify that TF in a median of 22 predictions,whereas random guessing would take 161 tries. We observed thatnetwork maps built with expression data from one environmentalcondition can be successfully used to identify interventions forachieving goal states defined by profiles in different environmentalconditions. We also demonstrated that TF network maps enrichedfor direct regulatory relationships are important for this task—network maps generated by NetProphet together with PWMmodels led to selections that were substantially better than thosemade by using maps based on expression correlation or CLR (25).We applied NetSurgeon to optimizing yeast for ethanol pro-
duction from glucose–xylose coculture. NetSurgeon selected criticalregulators supported in the literature without prior knowledge, andsix of the eight selected interventions promoted a fermentativetranscriptional state when considering the expression of all genes(Fig. 4 A and B) or the expression of 450 genes encoding enzymesinvolved in carbon metabolism (Fig. 4C). Although the TF deletionswere insufficient to entirely prevent a state transition that normallyaffects 42% of the genes in the yeast genome, they succeeded insignificantly changing the allocation of input carbon to various fates
and the specific rates of production or consumption of metabolites.We found that regulators associated with respiratory processes hadsignificant metabolic effects in the fermentative phase of the cul-ture. We also found that deletion of stress factors lowers the rate ofethanol production and total ethanol yield.We noted that five of the six interventions that improved the
transcriptional state when considering all genes (Fig. 4 A and B)or 450 genes encoding metabolic enzymes (Fig. 4C) actuallyreduced the specific rate of ethanol production (Fig. 5F). Onepossible explanation is that these interventions deleted stressfactors, thereby removing tools that S. cerevisiae needs to growwell in stressful conditions, including conditions in which xyloseis the sole carbon source. Another possible explanation is thatthese interventions moved the expression of key ethanol pro-duction genes in the wrong direction (Fig. 4D). This cannot bethe whole story because hap4Δ, which also moves these ethanolproduction genes in the wrong direction (Fig. 4D), significantlyimproves the specific rate of ethanol production (Fig. 5F).Nonetheless, it might be useful to modify NetSurgeon so that ittakes in a list of key genes and vetoes any proposed interventionsthat move any of the key genes in the wrong direction. This rulewould veto the hap4Δ mutant, which improved the specific rateof ethanol production, but would have allowed cat8Δ, arguablythe best of the interventions tested.There are several other modifications of NetSurgeon that would
be worth exploring in future work. Currently, NetSurgeon weightsgenes that are DE between the initial and target states by their qvalue, a measure of confidence that they are in fact DE. The q valueincreases with both the difference in means between the initial andgoal states and the inverse of the pooled variance. This works well inpractice, but it is possible that performance would be further im-proved by considering only the difference in means. NetSurgeoncould also be used iteratively to improve a strain by taking the ex-pression profile after a single intervention as the initial state forselecting a second intervention. A more ambitious goal would be toselect pairs of interventions a priori, before testing single interven-tions. One way to approach this would be to take the union of thepredicted effects of the two interventions as the set of predictedeffects of the pair. However, selecting double interventions mightwork better in conjunction with a quantitative model of transcrip-tional regulation that could predict how much the expression ofeach target gene would change as a result of each intervention.Transcriptome engineering focuses on attaining naturally evolved
transcriptional states under circumstances in which they do notnormally occur. This focus contrasts with the more common ap-proach to synthetic biology, in which individual genes encodingenzymes or transporters are knocked out or overexpressed, leadingto unnatural transcriptional states. For example, the expressionlevels of genes encoding proteins in the TCA cycle are highly reg-ulated, maintaining an appropriate ratio of enzymes and therebyavoiding intermediate metabolite accumulation or allosteric in-hibition of upstream processes. The engineering of optimal ex-pression levels across entire pathways is a challenging problem thatis often addressed through iterative selection strategies (40). How-ever, we found that CAT8 deletion provided a shortcut. The TCAcycle in S. cerevisiae consists of 26 genes, making optimization of thispathway’s expression level a difficult task for one-gene-at-a-timeengineering. Deletion of CAT8moved all 26 genes of the TCA cycletoward the fermentative state, showing that the manipulation oftransfactors that have evolved to regulate a naturally occurringtranscriptional state can greatly facilitate transcriptome engineering.Transcriptome engineering is a relatively new endeavor with a
bright future. We have demonstrated that transcriptional net-work maps enriched for direct regulatory interactions are highlyvaluable for identifying the key regulators that mediate a statetransition and prioritizing them for genetic intervention. Byexploiting collections of expression profiles from TF deletion oroverexpression strains, we have established clear benchmarks by
E7436 | www.pnas.org/cgi/doi/10.1073/pnas.1603577113 Michael et al.
which transcriptome engineering algorithms can be compared withone another, which may accelerate progress (41). We have alsodemonstrated that transcriptome engineering can be used to movecellular behavior—in this case, metabolic behavior—toward a de-sired goal. Our dataset of 8,055 metabolic measurements with 73matched RNA-seq profiles across 14 genotypes will enable futureefforts to maximize ethanol production by manipulating key tran-scriptional regulators. We are optimistic that further progress intranscriptome engineering will lead to improvements in biofuelproduction, personalized medicine, and stem cell engineering.
Materials and MethodsA software package implementing NetSurgeon is available from the BrentLaboratory web page: mblab.wustl.edu/software.html.
The NetSurgeon scoring algorithm (described at the beginning of Results)can be expressed in the following formula for the score of intervention k:
maxl∈f500,1000, ....40,000ghðSkðlÞ, kGk, kTkðlÞk, kDkÞ,
where h is the hypergeometric probability function, SkðlÞ (the positives in thesample) is defined below, G (the population) is the index set of all genes in
the genome, TkðlÞ (the sample) is the index set of targets of the perturbedregulator among the l most confidently predicted regulatory interactions inthe network that are predicted to move toward the goal state as a result ofthe intervention, and D (the positives) is the set of indices of genes that areDE between the initial and goal state (i.e., those whose q value is below theuser-determined threshold).
The number of positives in the sample for intervention k is defined to bethe following:
Sk = kDkX
i∈Tk ðlÞ−logqiPj∈D−logqj
,
where qi is the false-discovery rate for gene i (and all those q values < qi)being DE between the initial and goal states.
ACKNOWLEDGMENTS.We thank Dr. Ron Hector for his gracious provisionof plasmids containing the At5g17010 xylose transporter and technicaladvice on HPLC. We also thank Dr. Laura Salusjarvi and Dr. LauraRuohonen for providing the H2217 S. cerevisiae strain. D.G.M. was supportedby NIH Grant T32HG000045. This work was supported by NIH GrantGM100452.
1. Gerstein MB, et al. (2012) Architecture of the human regulatory network derivedfrom ENCODE data. Nature 489(7414):91–100.
2. Chuang HY, Hofree M, Ideker T (2010) A decade of systems biology. Annu Rev CellDev Biol 26:721–744.
3. Cameron DE, Bashor CJ, Collins JJ (2014) A brief history of synthetic biology. Nat RevMicrobiol 12(5):381–390.
4. Cardinale S, Arkin AP (2012) Contextualizing context for synthetic biology—identi-fying causes of failure of synthetic biological systems. Biotechnol J 7(7):856–866.
5. Lam FH, Hartner FS, Fink GR, Stephanopoulos G (2010) Enhancing stress resistance andproduction phenotypes through transcriptome engineering.Methods Enzymol 470:509–532.
6. Takahashi K, Yamanaka S (2006) Induction of pluripotent stem cells from mouseembryonic and adult fibroblast cultures by defined factors. Cell 126(4):663–676.
7. Morris SA, Daley GQ (2013) A blueprint for engineering cell fate: Current technologiesto reprogram cell identity. Cell Res 23(1):33–48.
8. Cahan P, et al. (2014) CellNet: Network biology applied to stem cell engineering. Cell158(4):903–915.
9. Marro S, et al. (2011) Direct lineage conversion of terminally differentiated hepato-cytes to functional neurons. Cell Stem Cell 9(4):374–382.
10. Feng R, et al. (2008) PU.1 and C/EBPalpha/beta convert fibroblasts into macrophage-like cells. Proc Natl Acad Sci USA 105(16):6057–6062.
11. Rackham OJ, et al.; FANTOM Consortium (2016) A predictive computational frame-work for direct reprogramming between human cell types. Nat Genet 48(3):331–335.
12. D’Alessio AC, et al. (2015) A systematic approach to identify candidate transcriptionfactors that control cell identity. Stem Cell Rep 5(5):763–775.
13. Morris SA, et al. (2014) Dissecting engineered cell types and enhancing cell fateconversion via CellNet. Cell 158(4):889–902.
14. Haynes BC, et al. (2013) Mapping functional transcription factor networks from geneexpression data. Genome Res 23(8):1319–1328.
15. Wang H, Mayhew D, Chen X, Johnston M, Mitra RD (2012) “Calling Cards” for DNA-binding proteins in mammalian cells. Genetics 190(3):941–949.
16. Wang H, Mayhew D, Chen X, Johnston M, Mitra RD (2011) Calling Cards enablemultiplexed identification of the genomic targets of DNA-binding proteins. GenomeRes 21(5):748–755.
17. Spivak AT, Stormo GD (2012) ScerTF: A comprehensive database of benchmarkedposition weight matrices for Saccharomyces species. Nucleic Acids Res 40(Databaseissue):D162–D168.
18. Weirauch MT, et al. (2014) Determination and inference of eukaryotic transcriptionfactor sequence specificity. Cell 158(6):1431–1443.
19. Hu Z, Killion PJ, Iyer VR (2007) Genetic reconstruction of a functional transcriptionalregulatory network. Nat Genet 39(5):683–687.
20. Kemmeren P, et al. (2014) Large-scale genetic perturbations reveal regulatory net-works and an abundance of gene-specific repressors. Cell 157(3):740–752.
21. Fortman JL, et al. (2008) Biofuel alternatives to ethanol: Pumping the microbial well.Trends Biotechnol 26(7):375–381.
22. Hector RE, Dien BS, Cotta MA, Qureshi N (2010) Engineering industrial Saccharomycescerevisiae strains for xylose fermentation and comparison for switchgrass conversion.J Ind Microbiol Biotechnol 38(9):1193–1202.
23. Hector RE, Qureshi N, Hughes SR, Cotta MA (2008) Expression of a heterologous xy-lose transporter in a Saccharomyces cerevisiae strain engineered to utilize xyloseimproves aerobic xylose consumption. Appl Microbiol Biotechnol 80(4):675–684.
24. Chua G, et al. (2006) Identifying transcription factor functions and targets by phe-notypic activation. Proc Natl Acad Sci USA 103(32):12045–12050.
25. Faith JJ, et al. (2007) Large-scale mapping and validation of Escherichia coli tran-scriptional regulation from a compendium of expression profiles. PLoS Biol 5(1):e8.
26. Bonneau R, et al. (2006) The Inferelator: An algorithm for learning parsimoniousregulatory networks from systems-biology data sets de novo. Genome Biol 7(5):R36.
27. Brent MR (2016) Past roadblocks and new opportunities in transcription factor net-work mapping. Trends Genet 32(11):736–750.
28. Salusjärvi L, et al. (2008) Regulation of xylose metabolism in recombinant Saccharo-myces cerevisiae. Microb Cell Fact 7:18.
29. Kuttykrishnan S, Sabina J, Langton LL, Johnston M, Brent MR (2010) A quantitativemodel of glucose signaling in yeast reveals an incoherent feed forward loop leading to aspecific, transient pulse of transcription. Proc Natl Acad Sci USA 107(38):16743–16748.
30. Lin Y, et al. (2014) Leveraging transcription factors to speed cellobiose fermentationby Saccharomyces cerevisiae. Biotechnol Biofuels 7(1):126.
31. Matsushika A, Goshima T, Hoshino T (2014) Transcription analysis of recombinantindustrial and laboratory Saccharomyces cerevisiae strains reveals the molecular basisfor fermentation of glucose and xylose. Microb Cell Fact 13:16.
32. Tachibana C, et al. (2005) Combined global localization analysis and transcriptomedata identify genes that are directly coregulated by Adr1 and Cat8. Mol Cell Biol25(6):2138–2146.
33. Ciriacy M (1975) Genetics of alcohol dehydrogenase in Saccharomyces cerevisiae. II. Two locicontrolling synthesis of the glucose-repressible ADH II. Mol Gen Genet 138(2):157–164.
34. Hlynialuk C, Schierholtz R, Vernooy A, van der Merwe G (2008) Nsf1/Ypl230w par-ticipates in transcriptional activation during non-fermentative growth and in re-sponse to salt stress in Saccharomyces cerevisiae. Microbiology 154(Pt 8):2482–2491.
35. Pedruzzi I, Bürckert N, Egger P, De Virgilio C (2000) Saccharomyces cerevisiae Ras/cAMP pathway controls post-diauxic shift element-dependent transcription throughthe zinc finger protein Gis1. EMBO J 19(11):2569–2579.
36. Blaiseau PL, Lesuisse E, Camadro JM (2001) Aft2p, a novel iron-regulated transcriptionactivator that modulates, with Aft1p, intracellular iron use and resistance to oxidativestress in yeast. J Biol Chem 276(36):34221–34226.
37. Pampulha ME, Loureiro-Dias MC (1990) Activity of glycolytic enzymes of Saccharomycescerevisiae in the presence of acetic acid. Appl Microbiol Biotechnol 34(3):375–380.
38. Orth JD, Thiele I, Palsson BO (2010) What is flux balance analysis? Nat Biotechnol28(3):245–248.
39. Plata G, Hsiao TL, Olszewski KL, Llinás M, Vitkup D (2010) Reconstruction and flux-balanceanalysis of the Plasmodium falciparum metabolic network. Mol Syst Biol 6:408.
40. Wang HH, et al. (2009) Programming cells by multiplex genome engineering andaccelerated evolution. Nature 460(7257):894–898.
41. Stolovitzky G, Prill RJ, Califano A (2009) Lessons from the DREAM2 challenges. AnnN Y Acad Sci 1158:159–195.
42. Haynes BC, et al. (2011) Toward an integrated model of capsule regulation in Cryp-tococcus neoformans. PLoS Pathog 7(12):e1002411.
43. Trapnell C, Pachter L, Salzberg SL (2009) TopHat: Discovering splice junctions withRNA-Seq. Bioinformatics 25(9):1105–1111.
44. Langmead B, Trapnell C, Pop M, Salzberg SL (2009) Ultrafast and memory-efficientalignment of short DNA sequences to the human genome. Genome Biol 10(3):R25.
45. Trapnell C, et al. (2010) Transcript assembly and quantification by RNA-Seq revealsunannotated transcripts and isoform switching during cell differentiation. NatBiotechnol 28(5):511–515.
46. Smyth GK (2004) Linear models and empirical Bayes methods for assessing differentialexpression in microarray experiments. Stat Appl Genet Mol Biol 3(1):3.
47. Law CW, Chen Y, Shi W, Smyth GK (2014) voom: Precision weights unlock linearmodel analysis tools for RNA-seq read counts. Genome Biol 15(2):R29.
48. Anders S, Pyl PT, Huber W (2015) HTSeq–a Python framework to work with high-throughput sequencing data. Bioinformatics 31(2):166–169.
49. Marbach D, et al.; DREAM5 Consortium (2012) Wisdom of crowds for robust genenetwork inference. Nat Methods 9(8):796–804.
50. Gasch AP, et al. (2000) Genomic expression programs in the response of yeast cells toenvironmental changes. Mol Biol Cell 11(12):4241–4257.
51. Grant CE, Bailey TL, Noble WS (2011) FIMO: Scanning for occurrences of a given motif.Bioinformatics 27(7):1017–1018.
52. Risso D, Ngai J, Speed TP, Dudoit S (2014) Normalization of RNA-seq data using factoranalysis of control genes or samples. Nat Biotechnol 32(9):896–902.
Michael et al. PNAS | Published online November 3, 2016 | E7437
BIOPH
YSICSAND
COMPU
TATIONALBIOLO
GY
PNASPL
US


![Transcriptome Analysis and Identification of a ... · Transcriptome Analysis and Identification of a Transcriptional Regulatory Network in the Response to H 2O 2 1[OPEN] Ayaka Hieno,a](https://img.pdfslide.net/doc/110x75/5e4a261271aed8655f372deb/transcriptome-analysis-and-identification-of-a-transcriptome-analysis-and-identiication.jpg)