Embed Size (px)
Citation preview

������������� ������������������
������
��������������� ���

MODEL-DRIVEN DESIGN OFGEO-INFORMATION SERVICES
Javier Marcelino Morales Guarin
March 2004

international institute for geo-information science and earth
observation, enschede, the netherlands
ITC Dissertation number 110ITC, P.O. Box 6, 7500 AA Enschede, The Netherlands
CTIT Ph.D.-thesis series, no. 03-61CTIT, P.O. Box 217, 7500 AE Enschede, The Netherlands
ISSN 1381-3617
ISBN 90-6164-222-1
Printed by ITC Printing Department
Copyright c© 2004 by Javier M. Morales G.

MODEL-DRIVEN DESIGN OFGEO-INFORMATION SERVICES
PROEFSCHRIFT
ter verkrijging vande graad van doctor aan de Universiteit Twente,
op gezag van de rector magnificus,prof.dr. F.A. van Vught,
volgens besluit van het College voor Promotiesin het openbaar te verdedigen
op vrijdag 26 maart 2004 om 15.00 uur.
door
Javier Marcelino Morales Guarin
geboren op 16 januari 1968te Bogota, Colombia

This thesis is approved byprof. dr. ir. C. A. Vissers, promotor

To the memoryof my Father
Marcelino Morales Bastidas1938–1988


Preface
The technological advances of recent years have brought many changes to today’s society.These changes have impacted the geo-information community, altering the way geo-informa-tion is perceived, collected, managed and used. The advent of sophisticated communicationinfrastructures, like the World Wide Web for example, opened the possibility for geo-infor-mation users to exchange information or to use remote specialised geo-processing functionsthat were inaccessible before. Such possibilities create new interesting opportunities in manyareas of our everyday lives.
To benefit from this modern technology, during the last decade a great deal of effort hasbeen directed towards the design and establishment of geo-information infrastructures. Sofar, the main purpose of developing these infrastructures has been, to make geographicdata broadly available, accessible and shareable for a multiplicity of users from differentapplication domains.
The notion of developing distributed applications complementary to these infrastructures,which was initially neglected, is starting to draw attention. This is an important developmentspecially because experience has shown that such infrastructures can only become useful andprofitable, when they are deployed in the context of a variety of end-user application services.
New initiatives of distributed geo-processing have consequently appeared, namely distributedGIS (Geographic Information Systems), internet GIS, and more recently, there have beensome developments in the area of web services. Unfortunately, a lot of attention has beengiven to implement distributed geo-components, partially disregarding the development andprovision of guidelines to handle the reuse and combination of available geo-components andthe design of new geo-components.
There exist consequently a need focus on the use of techniques to conceptualise distributedgeo-processing systems as an important step in their development process. This would leadto obtaining a conceptual description also called abstract specification of every system partand every system function (internal or external). Such descriptions could be developedaccording to, for example, different sets of concerns or points of interest.
Two important considerations have to be taken into account for the conceptual design ofhigh quality distributed geo-processing systems: (1) the specification and development ofcomposable and shareable artefacts, viz., data, processes, operations, resources, value-addedproducts; (2) the construction of geo-information services by assembling these prefabricatedand configurable artefacts, enhancing the degree of tailorability provided by these systems.
iii
Preface
Both (1) and (2) can be achieved by following an appropriate design methodology.
This thesis aims at the development of a methodology to support the design of distributedgeo-information services. The methodology features a systematic approach to master com-plex designs, and incorporates proper concepts that enable the effective structuring of suchdesigns. A system architecture upon which to deployed the designs is also proposed. Thisarchitecture is used to help deriving the necessary abstraction levels and identifying thevarious milestones.
The methodology is organised around two perspectives, the internal and external perspective.These perspectives are used to focus the design activities on specifics aspects of the system.A set of general purpose design concepts is provided to capture relevant information aboutthe system according to the concerns associated with these perspectives.
The methodology proposes the use of a repository service to organise the creation, updating,validation, accessing and sharing of service models and service instances. The repositorydefines necessary and sufficient conditions for services to interact, while leaving maximumfreedom to implementors to realise these services.
iv

Acknowledgements
There are a number of people who has, in one way or another, contributed to make this workpossible. I would like to thank some of them here.
First, I want to express my sincere gratitude to my promoter Prof. dr. Chris Vissers for hiscontribution, support, guidance and encouragement throughout the duration of this work.I would also like to thank Dr. Luıs Ferreira Pires and Dr. Marten van Sinderen for theirever-lasting support and for providing me with outstanding professional guidance, feedbackand advice even beyond the topics of this thesis. Their contribution was indispensable forthe completion of this work as was their stimulating personal friendship.
A special word of thanks is due to Dr. Radwan who created the opportunity and laid thefoundation for this work. He has been a continuous source of inspiration and has continuouslyprovided me with the professional and personal support required to finalise this work. It wasa privilege to have him as my supervisor and more importantly as an outstanding friend.
I am deeply indebted to the Geographic Institute Agustın Codazzi, IGAC, for offering me thechance to develop the ideas conveyed in this thesis. My gratitude goes to Santiago Borrero,former Director General of IGAC, for seeing the importance of my studies and for providingme with his endorsement and support. I want to express my sincerest gratitude to AmparoFigueroa and Ana Lucia Vallejo for their endless support and contribution to overcome theoperational hurdles surrounding my studies.
I would also like to thank Chris Paresi, Dr. Liesbeth Kosters, Prof. dr. Martin Hale, andLoes Colenbrander for their support. I want to thank all my colleagues in the former GMIdepartment, the members of educational affairs and all members of the PhD community atITC.
I want to thank my direct circle of friends who provided me with their friendship, time andadvice to escape from the long and lonely hours of work, and who became a second familyin this far away land.
I extend my very special thanks to Dr. Rolf de By who lightened the spark back in 1997at the very beginning of my research carrier, and who provided me with views, feedbackand valuable professional and scientific advice. His support throughout the duration of thisresearch was invaluable but I would especially like to thank him for being such a great friend.
“Quiero extender el mayor de los agradecimientos a mi querida madre, Socorro de Morales,por su carino, sus oraciones y consejos, por su respaldo y comprension y por estar allı siempre
v

Acknowledgements
que el camino se hizo duro y la carga mas pesada. Mama, he dedicado este trabajo a ti y ala memoria de mi padre”
Further, I can not thank my wife, Liliana, enough for her patience and support during allthese years, but more importantly, I must thank her for her sacrifice in putting aside herown professional aspirations and committing fully to our family and to the cause of thisendeavour. It is beyond any doubt that I would not have been able to complete this workwithout her encouragement, care, company and love. I owe you more than I will ever beable to repay. Finally, I want to thank our children Diego Nicolas and Maria Paula for theirunderstanding, for condoning my absences, for providing me with their smiles and for beinga continuous source of inspiration.
vi

Contents
Preface iii
Acknowledgements v
List of Figures xi
List of Tables xv
1 Introduction 51.1 Motivation . . . . . . . . . . . . . . . . . . . . . . . . . . . . . . . . . 51.2 Geo-information systems . . . . . . . . . . . . . . . . . . . . . . . . . . 71.3 Systems and distributed systems . . . . . . . . . . . . . . . . . . . . . 81.4 Design methodology . . . . . . . . . . . . . . . . . . . . . . . . . . . . 91.5 Objective . . . . . . . . . . . . . . . . . . . . . . . . . . . . . . . . . . 101.6 Approach . . . . . . . . . . . . . . . . . . . . . . . . . . . . . . . . . . 111.7 Structure of the thesis . . . . . . . . . . . . . . . . . . . . . . . . . . . 11
2 Geo-information concepts 132.1 The geo-information infrastructure concept . . . . . . . . . . . . . . . 132.2 GDI components . . . . . . . . . . . . . . . . . . . . . . . . . . . . . . 152.3 Geographic data . . . . . . . . . . . . . . . . . . . . . . . . . . . . . . 172.4 Representations of geographic data . . . . . . . . . . . . . . . . . . . . 19
2.4.1 Vector-based representations . . . . . . . . . . . . . . . . . . . 202.4.2 Raster-based representations . . . . . . . . . . . . . . . . . . . 22
2.5 Organisation of geographic data . . . . . . . . . . . . . . . . . . . . . . 242.5.1 Conceptual schema . . . . . . . . . . . . . . . . . . . . . . . . . 242.5.2 Building geographic databases . . . . . . . . . . . . . . . . . . 25
2.6 Describing geographic data . . . . . . . . . . . . . . . . . . . . . . . . 262.6.1 Levels of metadata . . . . . . . . . . . . . . . . . . . . . . . . . 272.6.2 Metadata standards . . . . . . . . . . . . . . . . . . . . . . . . 28
2.7 Geo-information services . . . . . . . . . . . . . . . . . . . . . . . . . . 292.7.1 GSI . . . . . . . . . . . . . . . . . . . . . . . . . . . . . . . . . 292.7.2 GSP-node . . . . . . . . . . . . . . . . . . . . . . . . . . . . . . 31
vii
Contents
3 System’s representation and architecting 333.1 System architecting . . . . . . . . . . . . . . . . . . . . . . . . . . . . . 333.2 Architectural principles . . . . . . . . . . . . . . . . . . . . . . . . . . 35
3.2.1 Abstraction . . . . . . . . . . . . . . . . . . . . . . . . . . . . . 353.2.2 A model of a system . . . . . . . . . . . . . . . . . . . . . . . . 363.2.3 Abstraction levels . . . . . . . . . . . . . . . . . . . . . . . . . 373.2.4 Views . . . . . . . . . . . . . . . . . . . . . . . . . . . . . . . . 38
3.3 Development strategies . . . . . . . . . . . . . . . . . . . . . . . . . . . 403.3.1 Early development models . . . . . . . . . . . . . . . . . . . . . 403.3.2 Object-oriented development . . . . . . . . . . . . . . . . . . . 423.3.3 The Unified Process . . . . . . . . . . . . . . . . . . . . . . . . 433.3.4 Catalysis . . . . . . . . . . . . . . . . . . . . . . . . . . . . . . 453.3.5 The Model Driven Architecture . . . . . . . . . . . . . . . . . . 463.3.6 Conclusion . . . . . . . . . . . . . . . . . . . . . . . . . . . . . 48
4 Geo-services design methodology (GSDM) 494.1 Introducing GSDM . . . . . . . . . . . . . . . . . . . . . . . . . . . . . 494.2 GSDM overview and scope . . . . . . . . . . . . . . . . . . . . . . . . 504.3 The role of models . . . . . . . . . . . . . . . . . . . . . . . . . . . . . 534.4 Metamodel for GSI . . . . . . . . . . . . . . . . . . . . . . . . . . . . . 564.5 Architectural elements . . . . . . . . . . . . . . . . . . . . . . . . . . . 59
5 Design concepts 615.1 Entity structures . . . . . . . . . . . . . . . . . . . . . . . . . . . . . . 61
5.1.1 Entities . . . . . . . . . . . . . . . . . . . . . . . . . . . . . . . 625.1.2 Interaction points . . . . . . . . . . . . . . . . . . . . . . . . . 62
5.2 Behaviour concepts . . . . . . . . . . . . . . . . . . . . . . . . . . . . . 635.2.1 Actions . . . . . . . . . . . . . . . . . . . . . . . . . . . . . . . 635.2.2 Interactions . . . . . . . . . . . . . . . . . . . . . . . . . . . . . 655.2.3 Causality relations . . . . . . . . . . . . . . . . . . . . . . . . . 675.2.4 Conjunction of causality conditions . . . . . . . . . . . . . . . . 695.2.5 Disjunction of causality conditions . . . . . . . . . . . . . . . . 705.2.6 Action attribute constraints . . . . . . . . . . . . . . . . . . . . 71
5.3 Decomposition . . . . . . . . . . . . . . . . . . . . . . . . . . . . . . . 765.3.1 Entity decomposition . . . . . . . . . . . . . . . . . . . . . . . 765.3.2 Action decomposition . . . . . . . . . . . . . . . . . . . . . . . 77
5.4 Behaviour Structuring . . . . . . . . . . . . . . . . . . . . . . . . . . . 785.4.1 Causality-oriented structuring . . . . . . . . . . . . . . . . . . . 785.4.2 Constraint-oriented structuring . . . . . . . . . . . . . . . . . . 83
6 The external perspective 856.1 The GSI system . . . . . . . . . . . . . . . . . . . . . . . . . . . . . . . 856.2 Design trajectory . . . . . . . . . . . . . . . . . . . . . . . . . . . . . . 876.3 Design concepts . . . . . . . . . . . . . . . . . . . . . . . . . . . . . . . 88
6.3.1 Functional entity . . . . . . . . . . . . . . . . . . . . . . . . . . 886.3.2 Interactions . . . . . . . . . . . . . . . . . . . . . . . . . . . . . 89
viii

Contents
6.4 Spatial data types . . . . . . . . . . . . . . . . . . . . . . . . . . . . . 916.5 Service design . . . . . . . . . . . . . . . . . . . . . . . . . . . . . . . . 93
6.5.1 Service definition . . . . . . . . . . . . . . . . . . . . . . . . . . 946.5.2 Extended service definition . . . . . . . . . . . . . . . . . . . . 956.5.3 Interaction signatures . . . . . . . . . . . . . . . . . . . . . . . 966.5.4 Behaviour model . . . . . . . . . . . . . . . . . . . . . . . . . . 101
7 The internal perspective model 1037.1 Decomposition goals . . . . . . . . . . . . . . . . . . . . . . . . . . . . 103
7.1.1 Criteria . . . . . . . . . . . . . . . . . . . . . . . . . . . . . . . 1047.1.2 Decomposition pattern . . . . . . . . . . . . . . . . . . . . . . . 1067.1.3 Recursive pattern application . . . . . . . . . . . . . . . . . . . 107
7.2 Decomposition method . . . . . . . . . . . . . . . . . . . . . . . . . . . 1087.2.1 Overview . . . . . . . . . . . . . . . . . . . . . . . . . . . . . . 1087.2.2 Introduction of internal behaviour . . . . . . . . . . . . . . . . 1117.2.3 Composition structures . . . . . . . . . . . . . . . . . . . . . . 112
7.3 Correctness assessment . . . . . . . . . . . . . . . . . . . . . . . . . . . 1137.4 Service descriptions . . . . . . . . . . . . . . . . . . . . . . . . . . . . . 117
7.4.1 Data descriptions . . . . . . . . . . . . . . . . . . . . . . . . . . 1187.4.2 Processing descriptions . . . . . . . . . . . . . . . . . . . . . . 119
7.5 Design example . . . . . . . . . . . . . . . . . . . . . . . . . . . . . . . 1207.5.1 Introduction of internal actions . . . . . . . . . . . . . . . . . . 1217.5.2 Restructuring . . . . . . . . . . . . . . . . . . . . . . . . . . . . 1237.5.3 Assignment of sub-behaviours . . . . . . . . . . . . . . . . . . . 125
8 Case study: land information service 1298.1 Overview . . . . . . . . . . . . . . . . . . . . . . . . . . . . . . . . . . 1298.2 Service walkthrough . . . . . . . . . . . . . . . . . . . . . . . . . . . . 1308.3 External perspective model . . . . . . . . . . . . . . . . . . . . . . . . 1318.4 Internal perspective . . . . . . . . . . . . . . . . . . . . . . . . . . . . 133
8.4.1 Introduction of internal actions . . . . . . . . . . . . . . . . . . 1338.4.2 Restructuring . . . . . . . . . . . . . . . . . . . . . . . . . . . . 1348.4.3 Assignment of sub-behaviours . . . . . . . . . . . . . . . . . . . 136
9 Conclusions 1399.1 General considerations . . . . . . . . . . . . . . . . . . . . . . . . . . . 1399.2 Main contributions . . . . . . . . . . . . . . . . . . . . . . . . . . . . . 1409.3 Further Research . . . . . . . . . . . . . . . . . . . . . . . . . . . . . . 142
Appendices 145
A Services metadata 145A.1 Service descriptions . . . . . . . . . . . . . . . . . . . . . . . . . . . . . 145A.2 The metadata elements . . . . . . . . . . . . . . . . . . . . . . . . . . 146A.3 Service metadata schema . . . . . . . . . . . . . . . . . . . . . . . . . 147
B Repository schema 153
ix

Contents
C GML Overview 163
Bibliography 167
Index 185
Summary 189
Samenvatting 191
Curriculum Vitae 193
ITC Dissertations 195
x

List of Figures
1.1 The elements of a design methodology . . . . . . . . . . . . . . . . . . 9
2.1 GDI components . . . . . . . . . . . . . . . . . . . . . . . . . . . . . . 152.2 GDI typical architecture . . . . . . . . . . . . . . . . . . . . . . . . . . 162.3 Linear feature representation . . . . . . . . . . . . . . . . . . . . . . . 202.4 Region features representation . . . . . . . . . . . . . . . . . . . . . . 212.5 Vector-based representation of geographic data . . . . . . . . . . . . . 222.6 Regular tessellations . . . . . . . . . . . . . . . . . . . . . . . . . . . . 222.7 Representations of geographic data . . . . . . . . . . . . . . . . . . . . 232.8 Conceptual and logical abstraction levels . . . . . . . . . . . . . . . . . 252.9 The GSI system concept . . . . . . . . . . . . . . . . . . . . . . . . . . 302.10 GSI-node internal structure . . . . . . . . . . . . . . . . . . . . . . . . 31
3.1 A system development process . . . . . . . . . . . . . . . . . . . . . . 343.2 Abstract representation of an underground system . . . . . . . . . . . 363.3 System and model . . . . . . . . . . . . . . . . . . . . . . . . . . . . . 373.4 Abstraction, refinement and levels of abstraction . . . . . . . . . . . . 383.5 RM-ODP viewpoints on a system . . . . . . . . . . . . . . . . . . . . . 393.6 The waterfall model . . . . . . . . . . . . . . . . . . . . . . . . . . . . 403.7 Iterative development methods . . . . . . . . . . . . . . . . . . . . . . 413.8 The Unified Process life cycle . . . . . . . . . . . . . . . . . . . . . . . 443.9 The levels of description according to Catalysis . . . . . . . . . . . . . 463.10 The Model Driven Architecture framework . . . . . . . . . . . . . . . . 47
4.1 Main phases and scope of GSDM . . . . . . . . . . . . . . . . . . . . . 524.2 Architectural elements, element models and service models . . . . . . 534.3 Role of the metamodel in the GSI architecture . . . . . . . . . . . . . 544.4 Metamodels and system models . . . . . . . . . . . . . . . . . . . . . . 554.5 A metamodel for GSI services . . . . . . . . . . . . . . . . . . . . . . . 574.6 Modelling dimensions . . . . . . . . . . . . . . . . . . . . . . . . . . . 59
5.1 Entities with shared interaction points . . . . . . . . . . . . . . . . . . 625.2 Action representation . . . . . . . . . . . . . . . . . . . . . . . . . . . 655.3 Interaction representation . . . . . . . . . . . . . . . . . . . . . . . . . 665.4 Some simple action relations . . . . . . . . . . . . . . . . . . . . . . . . 695.5 Conjunction of causality conditions . . . . . . . . . . . . . . . . . . . . 70
xi

List of Figures
5.6 Disjunction of causality conditions . . . . . . . . . . . . . . . . . . . . 715.7 Attribute value domain . . . . . . . . . . . . . . . . . . . . . . . . . . 735.8 Attribute reference relation . . . . . . . . . . . . . . . . . . . . . . . . 745.9 Implicit time reference (impossible action) . . . . . . . . . . . . . . . . 755.10 Attribute causality condition . . . . . . . . . . . . . . . . . . . . . . . 755.11 Entity decomposition . . . . . . . . . . . . . . . . . . . . . . . . . . . . 765.12 Action decomposition . . . . . . . . . . . . . . . . . . . . . . . . . . . 775.13 Action distribution . . . . . . . . . . . . . . . . . . . . . . . . . . . . . 785.14 Causality-oriented structuring . . . . . . . . . . . . . . . . . . . . . . . 795.15 Multiple entry points and exit points . . . . . . . . . . . . . . . . . . . 805.16 Parameterised exits and entries . . . . . . . . . . . . . . . . . . . . . . 815.17 Repetition of a sub-behaviour . . . . . . . . . . . . . . . . . . . . . . . 825.18 Recursive instantiation of sub-behaviour D . . . . . . . . . . . . . . . 825.19 Constraint-oriented decomposition . . . . . . . . . . . . . . . . . . . . 83
6.1 The GSI as a target oriented system . . . . . . . . . . . . . . . . . . . 866.2 Design trajectory at the external perspective level . . . . . . . . . . . 876.3 Different types of functional entities . . . . . . . . . . . . . . . . . . . 896.4 Special case of the information attribute of an interaction . . . . . . . 906.5 The data type concept . . . . . . . . . . . . . . . . . . . . . . . . . . . 926.6 The use of spatial data types . . . . . . . . . . . . . . . . . . . . . . . 936.7 TD-service definition . . . . . . . . . . . . . . . . . . . . . . . . . . . . 946.8 Interactions at the service and extended service levels . . . . . . . . . 956.9 Interactions between two behaviour blocks . . . . . . . . . . . . . . . . 976.10 Interaction signature . . . . . . . . . . . . . . . . . . . . . . . . . . . . 976.11 Items coupled to actions . . . . . . . . . . . . . . . . . . . . . . . . . . 986.12 Examples of interaction types [1] . . . . . . . . . . . . . . . . . . . . . 996.13 Examples of interaction types [2] . . . . . . . . . . . . . . . . . . . . . 1006.14 Interactions definition for service chaining . . . . . . . . . . . . . . . . 1016.15 refinement of the TD-service definition . . . . . . . . . . . . . . . . . . 102
7.1 Decomposition step . . . . . . . . . . . . . . . . . . . . . . . . . . . . . 1057.2 Mediated compositions . . . . . . . . . . . . . . . . . . . . . . . . . . . 1067.3 Recursive mediated compositions . . . . . . . . . . . . . . . . . . . . . 1077.4 Decomposition method . . . . . . . . . . . . . . . . . . . . . . . . . . . 1087.5 Step 1: transformation to integrated form . . . . . . . . . . . . . . . . 1097.6 Step 2: introduction of internal actions . . . . . . . . . . . . . . . . . . 1107.7 Step 3: constraint-oriented restructuring . . . . . . . . . . . . . . . . . 1107.8 Step 4: assignment of behaviours to elements . . . . . . . . . . . . . . 1117.9 Composition structures . . . . . . . . . . . . . . . . . . . . . . . . . . 1127.10 Correctness assessment . . . . . . . . . . . . . . . . . . . . . . . . . . . 1147.11 Abstract behaviour . . . . . . . . . . . . . . . . . . . . . . . . . . . . . 1157.12 Refinement of an abstract behaviour into two concrete behaviours . . 1167.13 Alternative refinement of an abstract behaviour into two concrete be-
haviours . . . . . . . . . . . . . . . . . . . . . . . . . . . . . . . . . . . 116
xii

List of Figures
7.14 Alternative refinement of an abstract behaviour into two concrete be-haviours . . . . . . . . . . . . . . . . . . . . . . . . . . . . . . . . . . . 117
7.15 Metadata elements . . . . . . . . . . . . . . . . . . . . . . . . . . . . . 1187.16 Simple route service EP model . . . . . . . . . . . . . . . . . . . . . . 1207.17 Introduction of internal actions to the SimpleRoute behaviour . . . . . 1217.18 Item representation of the SimpleRoute behaviour . . . . . . . . . . . . 1227.19 Extended route service EP model . . . . . . . . . . . . . . . . . . . . . 1237.20 Extended route service process flow . . . . . . . . . . . . . . . . . . . . 1247.21 Data elements diagram of the extended route determination service . . 1257.22 Restructured specification of the extended route service . . . . . . . . 126
8.1 The Land Information Service external perspective . . . . . . . . . . . 1318.2 Information diagram of the LI-Service . . . . . . . . . . . . . . . . . . 1328.3 General service process . . . . . . . . . . . . . . . . . . . . . . . . . . . 1348.4 Initial internal perspective design . . . . . . . . . . . . . . . . . . . . . 1358.5 WeatherData service interaction diagram . . . . . . . . . . . . . . . . 1358.6 Introduction of the action generate area of interest . . . . . . . . . . . 1368.7 Behaviour definition for the imageProcessing element . . . . . . . . . . 1378.8 Behaviour definition for the featureExtraction element . . . . . . . . . 137
B.1 Repository schema - part I . . . . . . . . . . . . . . . . . . . . . . . . . 155B.2 Repository schema - part II . . . . . . . . . . . . . . . . . . . . . . . . 156B.3 Repository schema - part III . . . . . . . . . . . . . . . . . . . . . . . . 157
C.1 GML Geometry schema (class representation) . . . . . . . . . . . . . . 165C.2 GML Feature schema (class representation) . . . . . . . . . . . . . . . 165C.3 GML Geometry schema . . . . . . . . . . . . . . . . . . . . . . . . . . 166
xiii

List of Figures
xiv

List of Tables
2.1 Selection of framework data for NGDI . . . . . . . . . . . . . . . . . . 18
3.1 RM-ODP Viewpoints and focus of concern . . . . . . . . . . . . . . . . 39
5.1 Common action relations . . . . . . . . . . . . . . . . . . . . . . . . . 72
B.1 Structure of the GSDM repository documents . . . . . . . . . . . . . . 153
xv

List of Tables
xvi

Chapter 1
Introduction
Anything I’ve ever donethat ultimately was worthwhile...
initially scared me to death.
Betty Bender
In this chapter we introduce the research accounted for in this thesis by explain-ing the motivation, introducing the objectives and illustrating the approach followedto achieve the objectives. The chapter opens in section 1.1 with the descriptionof the motivation for the work; section 1.2 analyses trends in geo-information sys-tems; section 1.3 introduces some terminology used throughout the thesis; section 1.4discusses system development, development methods and the main aspects of devel-opment methodologies; section 1.5 defines the research objectives; section 1.6 outlinesthe approach; the chapter closes with the presentation of the overall structure of thethesis in section 1.7.
1.1 Motivation
We are living in an age where information plays a central role in our daily activities,driving and constraining every decision that we make. A good indication of the impactof information awareness can be seen, for example, at the financial markets, whereinterest rate values and share transactions change as some international facts becomeknown.
We can also see information as an important decision factor in a more familiar situ-ation, for instance when driving along the highway, where you make changes in yourplanned route as a traffic report becomes available. In this second example however,
5

1.1. Motivation
one may require more information than just the traffic data. To make a satisfactorychange of route chances are that you will need some additional information such asdata about the road network, possibly some relief characteristics (the topography ofthe area you are in), proximity to built-up areas (cities, towns). This extra informa-tion is known as geographic information or geo-information .
Geo-information has always been used by individuals when they are having to findtheir way in unfamiliar territories. But beyond that, geo-information was almostexclusively used and valued by professionals, e.g., the military or the city planners,who exploit it to support some of their specific activities. This particularly exclusiveuse of geo-information by these so called traditional users was caused by the high costand effort required to access these data and manipulate it properly.
During the last decade however, technological improvements have been facilitatingthe access to geo-information, and have been reducing the effort and skills required touse it effectively. As a consequence, the use of geo-information is expanding beyondthe traditional users, to include new user communities. These new user communi-ties now see how their activities can benefit from the proper use of geo-information,mainly because they have easier access to it and to the tools needed for its manipula-tion. Examples of these user communities include, among others, telecommunications,emergency services, transport companies and tourism.
As individuals start to have easier access to geo-information, a more sophisticatedspatial awareness is being developed. This results in geo-information being requiredto support many daily activities. Nowadays, it is not uncommon to hear questions like,“which areas of the city are not covered by our retail offices?” or “how much overlapis there between retail offices A and B” or “what is the shortest route to supply allour retail offices.” All these questions have location as a key ingredient. This growingdependence of people and organisations on geo-information has converted it into aprecious resource.
Traditional users differ form other users in the sense that they know how geographicdata is collected and represented, and they have a specific use for it. Consequently,they have well-defined requirements and furthermore, these requirements are to alarge extent fulfilled by the conventional methods of geo-information production usedby geo-information providers.
Nevertheless, as the use of information increases, these traditional users are identify-ing new application areas where geo-information can be exploited, hence, expandingtheir set of requirements making them more diverse and difficult to satisfy. Moreover,other users who are less aware of the nature of the data and require it for a vari-ety of applications, turn to have a much wider and less specific set of requirements.This forces geo-information providers to deal with a large variety of information re-quirements to satisfy. It is a challenge for any provider to satisfy these requirements,especially if we take into account that the way information is perceived, expected andused depends very much on the current forms and shapes of markets, projects, andtechnology.
6

Chapter 1. Introduction
Most of the existing information providers rely on supportive systems (geo-informa-tion systems) that have been specifically designed to deal with a standard set ofrequirements, mainly those of traditional users. Systems that deal with requirementsof this sort, are designed using system design methods that put the emphasis on staticaspects of the system, such as data and structure. This has been traditionally thecase with the design of geo-information systems. As a result these systems producespecific, static and pre-defined products. Unfortunately, these ever-lasting productsdo no longer fulfil the requirements of the users.
The requirements for these systems no longer remain static, but they keep on chang-ing, mainly because users want to influence the products in many different ways, andbecause new technology offers a bunch of opportunities. Therefore, we have to extendthe methodologies for geo-information system design such that these methodologiescan support the development of systems that can cope with dynamically changingrequirements.
This change can be achieved using a systematic methodology that pays attentionnot only to the structural aspects of the system but also to the system’s behaviour.Analysing behaviour and possibly separating different behavioural patterns that mightbe reused, we can identify elements that could be assembled in multiple combinations,facilitating the generation of a larger set of services. Based on this idea we can designmore flexible and adaptive architectures, where we can benefit from functionalityreuse, and we can generate more tailored services to satisfy a wider group of users.
1.2 Geo-information systems
Geographic data fundamentally encompasses people’s perception of real world phe-nomena such as, rivers, roads, cities, etc. To store information about geographicobjects in an information system we use spatial data types. Spatial data types are aspecialisation of traditional data types such as records or structured text. These datatypes represent geographic objects as geometric features with an associated location.
Geo-information systems are information systems that store and manage informationabout geographic objects. This information is mainly collected, maintained and pro-vided to geo-information users who employ this information to solve spatial problems.Spatial problems are those which make implicit or explicit reference to locations orpositions relative to the Earth.
Before technological advances like the World Wide Web emerged, geo-informationwas not very accessible for the general public, and it was stored at isolated informa-tion systems and in proprietary formats. With the advent of the World Wide Web,developments in data formats and data transmission followed, which have greatly fa-cilitated access to and have increased the availability of geo-information. As a result,users do not have to rely on single data sources, but they can solve their spatialproblems using multiple interconnected collections of geographic data.
7

1.3. Systems and distributed systems
The same technological advances have also opened the possibility to use remote geo-processing functions. Many specialised operations that were inaccessible before cannow be accessed and exploited by users, who can incorporate them in their specificproblem-solving approaches.
We see future geo-information systems as distributed systems from which specialisedgeo-information services can be generated by exploiting artefacts (data and functions)that are located in an infrastructure of interconnected service nodes. These artefactsare combined to define large geo-processing tasks that provide a more diverse func-tionality than that of the artefacts in isolation. From all of these considerations wecan derive some important issues to concentrate on when proposing new directions ingeo-information system design: composition, distribution, coordination and reuse.
The development of systems with these characteristics can be rather complex, there-fore we require the use of structured methods to analyse, model, design and redesignthe system. With the help of these methods, knowledge about the artefacts of thesystem and their relevant characteristics can be captured. This makes it possibleto specify complex interactions between these artefacts for the generation of systemservices.
We distinguish three different classes of artefacts: data elements, processing elementsand connecting elements. Processing elements generate or transform data elements;data elements contain the information that is used or manipulated by the processingelements; connecting elements represent the properties and constraints that governthe interactions between elements.
1.3 Systems and distributed systems
Organisations rely on different systems to support their activities, and to assist themin obtaining the information they need. Here we introduce a precise notion of system.A system is an entity formed by a configuration of interacting parts, put together toserve a purpose. A part of a system can be considered a system in itself and generallya system as a whole can be a subsystem or a component of a larger system.
In some cases, the parts of a system or subsystems have to operate somewhat inde-pendently from each other, which allows these parts, for example, to be placed closeto geographically separated users, and still perform together as a single unit. In suchcases the system is called a distributed system.
A distributed system is defined as a system whose parts are physically or logicallyseparated and operate in a partly autonomous way. Each part of a distributed systemexhibits a behaviour that is partially independent from other parts. Examples ofdistributed systems are organisations, communication networks and the World WideWeb.
8

Chapter 1. Introduction
1.4 Design methodology
A design methodology provides a set of structured procedures and rules that guidea designer in the process of designing a system. During this design process a seriesof models is created that represent the system and parts thereof. These modelsdescribe relevant aspects of the system under consideration, allowing for a betterunderstanding of the system. In these models designers express their ideas as to howto achieve predefined design goals. An effective design methodology should supportdesigners in the production of accurate designs in a target application domain.
A design methodology is defined as a collection of design methods based on design con-cepts and supported by design tools. Design concepts are used to represent primitiveelements and their characteristics in an application domain. These design conceptsare expressed via a textual or graphical design notation.
To enable the composition of design concepts, an underlying syntax is required thatdefines them precisely and unambiguously. This syntax enforces the proper use of thedesign concepts when they are combined to create designs. Designs are expressed bymeans of models, which in turn are written using a design notation.
A design methodology defines an organised set of guidelines, design steps and struc-turing techniques that are necessary to produce models of elements in an applicationdomain. Tools provide (semi)-automated support for the production and analysis ofthese models, facilitating their creation, validation and verification.
The application domain defines the environment in which a design methodology is
Design-Methodology.pdf
DesignConcept
Applicationdomain
Designnotation
represents
DesignMethod
manipulates
characterises
Design
Tooluses
supported by
describes
conceivedwith
supported by
Model
writtenusing
defines
guides
Figure 1.1: The elements of a design methodology
9
1.5. Objective
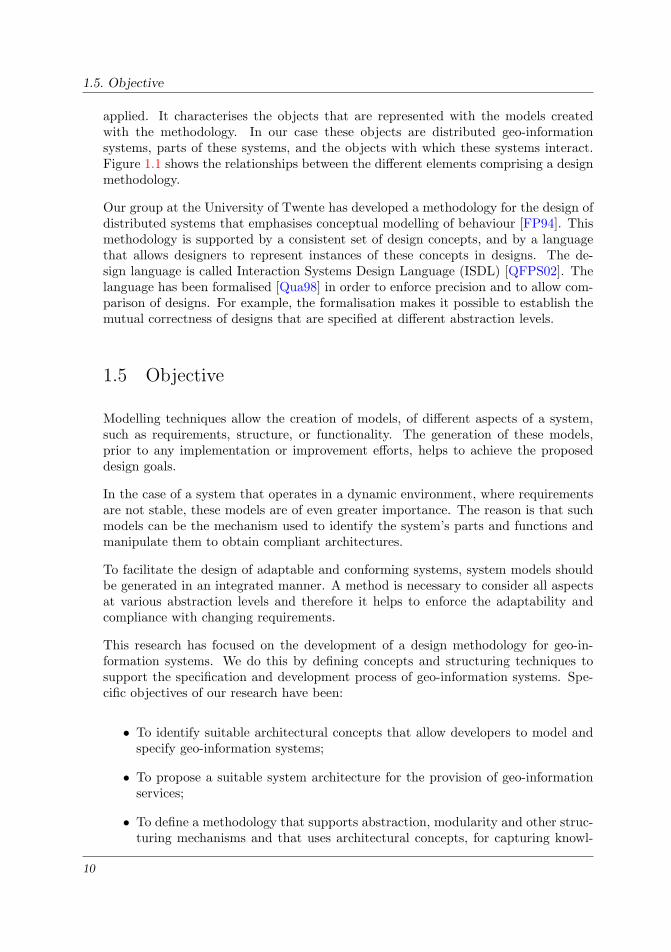
applied. It characterises the objects that are represented with the models createdwith the methodology. In our case these objects are distributed geo-informationsystems, parts of these systems, and the objects with which these systems interact.Figure 1.1 shows the relationships between the different elements comprising a designmethodology.
Our group at the University of Twente has developed a methodology for the design ofdistributed systems that emphasises conceptual modelling of behaviour [FP94]. Thismethodology is supported by a consistent set of design concepts, and by a languagethat allows designers to represent instances of these concepts in designs. The de-sign language is called Interaction Systems Design Language (ISDL) [QFPS02]. Thelanguage has been formalised [Qua98] in order to enforce precision and to allow com-parison of designs. For example, the formalisation makes it possible to establish themutual correctness of designs that are specified at different abstraction levels.
1.5 Objective
Modelling techniques allow the creation of models, of different aspects of a system,such as requirements, structure, or functionality. The generation of these models,prior to any implementation or improvement efforts, helps to achieve the proposeddesign goals.
In the case of a system that operates in a dynamic environment, where requirementsare not stable, these models are of even greater importance. The reason is that suchmodels can be the mechanism used to identify the system’s parts and functions andmanipulate them to obtain compliant architectures.
To facilitate the design of adaptable and conforming systems, system models shouldbe generated in an integrated manner. A method is necessary to consider all aspectsat various abstraction levels and therefore it helps to enforce the adaptability andcompliance with changing requirements.
This research has focused on the development of a design methodology for geo-in-formation systems. We do this by defining concepts and structuring techniques tosupport the specification and development process of geo-information systems. Spe-cific objectives of our research have been:
• To identify suitable architectural concepts that allow developers to model andspecify geo-information systems;
• To propose a suitable system architecture for the provision of geo-informationservices;
• To define a methodology that supports abstraction, modularity and other struc-turing mechanisms and that uses architectural concepts, for capturing knowl-
10

Chapter 1. Introduction
edge about the fundamental elements of geo-information systems. Such knowl-edge is represented in models that express structure and behaviour of the system;
• To develop a framework for the use of system elements as building blocks inmultiple model-driven compositions for the construction of complex services.
1.6 Approach
The approach we adopted to achieve our objectives is as follows:
• Investigate the state-of-the-art in geo-information systems and geo-informationsharing. This investigation is used as the basis to introduce a geo-informationservices architecture;
• Study the different ways of formalising systems, focusing especially on how tospecify system behaviour and interaction systems;
• Introduce a methodology based on a sound design model that supports thedevelopment of geo-information systems. The methodology aids at managingthe complexity of this system development process. This methodology helps tostructure the basic elements of the system and provides guidelines to combinethese elements systematically to form more complex element specifications;
• Propose a set of design concepts that can be used to create abstract models ofsystem services. Services are specified by combining sets of predefined elements.These elements could be either elementary definitions or complex definitions,which were defined to provide an intermediate service. These models also serveto evaluate the functionality of a system, and as a template for implementation;
• Evaluate the methodology through the use of a comprehensive case study.
1.7 Structure of the thesis
The remaining chapters of this thesis are organised as follows:
Chapter 2 presents an overview of the state-of-the-art in geo-information systemswith specific emphasis on geo-information infrastructures. The chapter also motivatesand introduces the concept of geo-information service infrastructure (GSI) and asupporting architecture.
Chapter 3 discusses the concepts that underline system design. The chapter motivatesthe need for a process to guide the activities involved in developing systems. Itprovides an overview of techniques used to manage the complexity of the development
11

1.7. Structure of the thesis
process. The chapter also identifies and analyses the various strategies available tosteer the development process.
Chapter 4 introduces the Geo-Services Design Methodology (GSDM), which has beentailored to the development of geo-information systems.
Chapter 5 introduces the design concepts, and their combination rules, necessary torepresent architectures of distributed systems.
Chapter 6 explains how to define GSI-services according to the external perspective.This perspective looks at the system from the point of view of its surrounding environ-ment. The chapter also introduces a metamodel to facilitate the seamless interchangeof service definitions.
Chapter 7 describes how to define GSI-services according to the internal perspec-tive. The chapter explains the architectural style defined to guide and constrain thedefinition of components. The chapter shows how to use these design concepts to rep-resent elements of a geo-information system. The chapter also includes the proposedstrategies to assemble elements into chains to define complex services.
Chapter 8 provides a comprehensive example on the design of a Land InformationService that illustrates the main features of the methodology.
Chapter 9 summarises the research achievements, presents the conclusions, and pro-vides some directions for further research and development.
12

Chapter 2
Geo-information concepts
To invent something,you need a bit of imagination and a pile of junk.
Thomas A. Edison
This chapter presents an overview of state-of-the-art in geo-information systems andmotivates and introduces the concept of geo-information service infrastructure. Westart by introducing the concept of geo-information infrastructure as a mechanism todiscover and access geographic data, with its main components, and then we examineeach of those components in detail.
The chapter is organised as follows: section 2.1 deals with the issues of geo-informa-tion infrastructure; section 2.2 outlines the components of a GDI; section 2.3 explainsgeographic information in detail; section 2.4 concentrates on how we represent andstructure geographic data; section 2.5 describes how to organise geographic data suchthat it can be used in a variety of applications; section 2.6 discusses aspects of docu-menting geographic data; and finally, section 2.7 wraps up the chapter by introducingthe concept of the geo-information services infrastructure.
2.1 The geo-information infrastructure concept
Geographic information has always been a part of most cultures, because spatialthinking is an essential factor in people’s relationship with the surrounding physicaland cultural environment. This information is required in a wide variety of forms andcontexts because linking location to information is a process that applies to many as-pects of business and community decision-making. Individuals make temporary mapsto remind themselves or show others how to find their way in an unfamiliar territory(way finding). The use of maps has increased as we develop sophisticated spatial
13

2.1. The geo-information infrastructure concept
awareness and spatial communication abilities that came to support other activi-ties besides the physical way finding. These other activities include urban planning,hazard management, intelligence gathering and cartography. The efficient creation,storage, processing, presentation and dissemination of geographic information is ‘the’big challenge these days. Having the ability to use this information efficiently is astrategic resource for now and into the future.
In the last decade, more and more volume of geographic data has been created tosupport geography-based analysis within multiple disciplines such as cartography,and cadastre. Due to advances in technology and to increasing users’ awareness ofthe usefulness of geographic data, society’s reliance on such data has grown substan-tially. This fact, together with the extended availability of methods and tools for thecollection, processing, analysis and presentation of geographic data has led to a changein the way geo-information is produced, used and shared. The conventional approachof closed production systems with proprietary structure and purpose is changing intomore open systems that allow data to be widely available for users with purposespossibly different from those for which the data was originally produced.
The opportunities for lower costs and shorter production times that were foreseenfrom the possibility of using existing data from different sources motivated users toshare data. To satisfy this increasing need for data to be shared among multipleuser communities and disciplines, a data sharing scheme has been put forward bysome of the experts in the field. The idea was to establish a mechanism by whichmultiple collections of geographic data could be made available for everyone’s use.This mechanism is known as the geo-information infrastructure or Geospatial DataInfrastructure (GDI).
A GDI is defined as the relevant base collection of technologies, policies and institu-tional arrangements that facilitate the availability of and access to geospatial data.The GDI provides the basis for spatial data discovery, evaluation, and applicationfor users and providers within all levels of government, the commercial sector, thenon-profit sector, academia and by citizens in general [Dou01].
The benefits of this mechanism are, a.o., reduced data collection times and cost, fastand wider access to data, interoperability between geo-applications and generation ofdata for multiple uses. Internet technology acted as a facilitator for the evolution ofthis concept into a tangible reality. Existing geospatial data infrastructures include:
• The Spatial Information Council – ANZLIC (Australia & New Zealand)[ANZ02];• The Colombian Spatial Data Infrastructure – ICDE [ICD02];• The Dutch Council for Geographic Information – RAVI [RAV02];• The National System for Geographic Information – SNIG (Portugal) [SNI02];• The National Geospatial Data Framework – NGDF (United Kingdom) [NGD02];• The National Spatial Data Infrastructure – NSDI (USA) [FGD03];• Common and Open (Geo-)Spatial Data Infrastructure – GDI-NRW (North
Rhine Westphalia, Germany) [GDI02].
14

Chapter 2. Geo-information concepts
As the definition of GDI implies, such a data sharing scheme can only be realised ifdata producers at local, regional and/or national levels (depending on the scope ofthe GDI) agree on a set of legal, economical and technical principles that enable thediscovery of and access to their geographic data.
2.2 GDI components
From the technical point of view, a GDI is a facility that acts as intermediary betweenproducers and users of geographic data to facilitate data sharing. To make datasharing possible, data has to be made known, analysable and accessible. In order torealise these goals, various issues have to be addressed.
Existing data has to be organised to form data collections. A data collection is a setof structured or semi-structured geographic data collected by a data producer andstored in a proprietary format.
Data stored in data collections has to be described. Data producers with interest insharing their data should create precise descriptions of their data collections. Thesedescriptions should allow potential users to analyse and evaluate the collections’ con-tents and determine their fitness for use. Such descriptions should also include infor-mation concerning the means to access and retrieve the data stored in the collection.
According to the principles behind the GDI initiatives, data descriptions as explainedabove are created in the form of metadata. Metadata is a formalised set of propertiesthat describe with significant amount of detail the characteristics of the contents of adata collection.
When creating metadata, one follows a set of rules that delineate how to describe acollection of data (in our case geographic data), in terms of its contents, quality, con-
. . .Elevation
Rivers
. . .Roads
AdministrativeUnits
. . .Soil
Land Use
Clearinghouse server
. . .
Catalogue
Metadata entries
Metadata entriesMetadata entries
User Interface&
search and queryapplications
Data providers’ servers(data collections or datasets)
User requests
GDI-Components.pdf
vertices
end-nodes
(a) (b) (c)
Linear-Representation.pdf Tessellations.pdf
Figure 2.1: GDI components
15

2.2. GDI components
GDI-Configuration-C.pdf
Detailed metadata
request / response
General metadata
request / response
Geographic Information
request / response
Network (Internet)
Network (Internet)
Data provider (1)Data provider (1)
datacollection
detailedmetadata
Data provider (3)Data provider (3)
datacollection
detailedmetadata
User (1)User (1) User (2)User (2) User (n)User (n)
Data provider (n)Data provider (n)
datacollectiondetailed
metadata
Catalogue
generalmetadata
Clearinghouse Server
Clearinghouse Server
Figure 2.2: GDI typical architecture
dition, geographical extent, currentness and other factors of relevance to the potentialusers.
Different data providers wishing to make their data available through a GDI shouldfollow the same set of rules to create their metadata. There exist various standardsthat provide common terminology and rules to describe geographic data. Some ofthese standards are described in section 2.6.2.
Within a GDI, data descriptions are organised and arranged as metadata entries (seeFigure 2.1). A metadata entry contains information that describes a data collection.The arrangement of metadata entries results in a central catalogue that allows oneto search and find data collections. A user interface allows users to interact with thecatalogue to ask for and retrieve metadata entries. Figure 2.1 shows the relationshipsbetween the different elements mentioned above.
From the architectural point of view, data collections are located in distributed dataservers and the catalogue is situated in an independent server that is commonly knownas the clearinghouse server. Users can connect to the clearinghouse server to formulatetheir queries using, for example, a web browser.
Figure 2.2 shows one possible configuration of a GDI. The users post queries to theclearinghouse server to find out about availability of data. The queries are answeredbased on the contents of the catalogue, which in this case contains general (general)
16

Chapter 2. Geo-information concepts
metadata.
If a user finds a particular data collection useful for her/his application, s/he canrequest more specific descriptive details on that particular data collection. A searchis then executed at the data provider site where more detailed metadata is stored toprovide the user with the requested additional information. Figure 2.2 shows thesetwo different query types; a dash-dot-line is used to represent a query to the catalogue(for general or global metadata), while a dashed-line represents queries for detailedmetadata. The solid line represents requests for the data itself.
As a result of a query for metadata, a user obtains the following information: thename of the provider(s) that supply the required data; the web address(es) of theserver(s) through which the data can be accessed; and, the conditions (e.g., price)and instructions on how the data can be retrieved.
2.3 Geographic data
Geographic data is the most important constituent of a GDI. Geographic data funda-mentally encompasses people’s perception of real world phenomena. These phenom-ena can be either natural such as trees, rivers, continents, rainfall and temperature,or man-made such as towns, buildings and roads. We make observations of thesegeographic elements to obtain relevant information about them. The information col-lected on these elements lets us determine, a.o., what they are, where they are andwhat shape they have.
Geographic data is used to perform multiple analysis mainly to support decision-mak-ing (e.g., where to locate a new railroad or how to get from A to B). Therefore it hasto be organised and stored in a structured way. Normally, a collection of this datais arranged in descriptions composed of two parts: a descriptive part, consisting ofa type or a name and all other specific attributes (the what), and a positional part,consisting of a geographic reference and certain shape determined by its boundaries(the where, the what shape).
Based on the information that we collect about geographic elements we see that theseelements manifest themselves in two different ways: as clearly identifiable elementswith clear-cut boundary, or as vaguely distinctive elements with indistinguishableboundary. In order to represent these two kinds of elements in a proper way they areclassified in two groups: objects and fields, respectively.
Geographic objects are phenomena with well-defined spatial limits. This implies clearshape and size. Examples include buildings, railways, roads and water bodies. Geo-graphic fields, in contrast, are those elements for which no distinct limit or boundarycan be drawn. Examples are soil type, elevation, and temperature.
Objects and fields also differentiate from each other in the way their attribute values
17
2.3. Geographic data
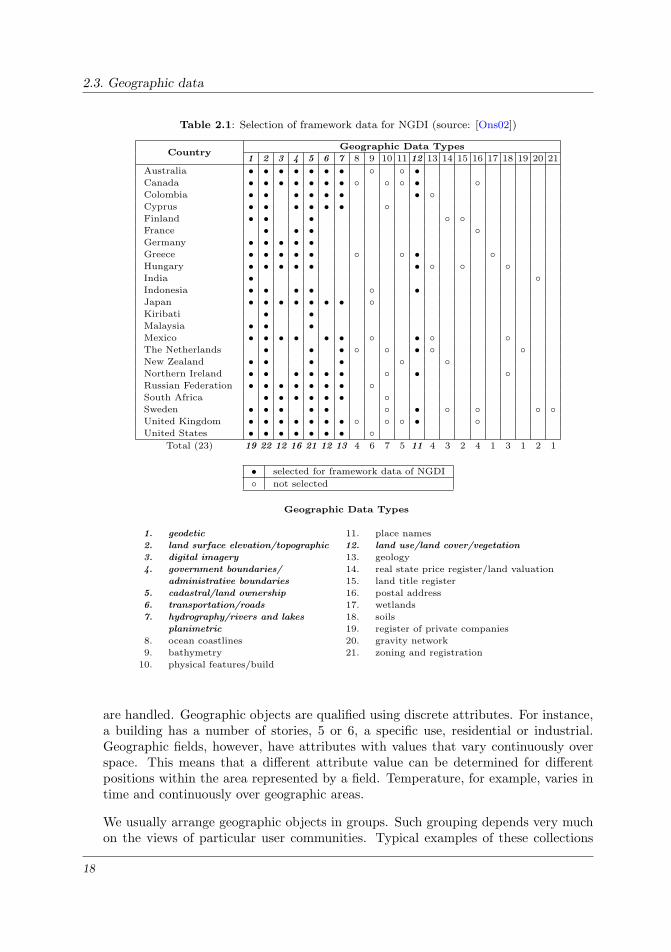
Table 2.1: Selection of framework data for NGDI (source: [Ons02])
CountryGeographic Data Types
1 2 3 4 5 6 7 8 9 10 11 12 13 14 15 16 17 18 19 20 21
Australia • • • • • • • ◦ ◦ •Canada • • • • • • • ◦ ◦ ◦ • ◦Colombia • • • • • • • ◦Cyprus • • • • • • ◦Finland • • • ◦ ◦France • • • ◦Germany • • • • •Greece • • • • • ◦ ◦ • ◦Hungary • • • • • • ◦ ◦ ◦India • ◦Indonesia • • • • ◦ •Japan • • • • • • • ◦Kiribati • •Malaysia • • •Mexico • • • • • • ◦ • ◦ ◦The Netherlands • • • ◦ ◦ • ◦ ◦New Zealand • • • • ◦ ◦Northern Ireland • • • • • • ◦ • ◦Russian Federation • • • • • • • ◦South Africa • • • • • • ◦Sweden • • • • • ◦ • ◦ ◦ ◦ ◦United Kingdom • • • • • • • ◦ ◦ ◦ • ◦United States • • • • • • • ◦
Total (23) 19 22 12 16 21 12 13 4 6 7 5 11 4 3 2 4 1 3 1 2 1
• selected for framework data of NGDI
◦ not selected
Geographic Data Types
1. geodetic 11. place names
2. land surface elevation/topographic 12. land use/land cover/vegetation
3. digital imagery 13. geology
4. government boundaries/ 14. real state price register/land valuation
administrative boundaries 15. land title register
5. cadastral/land ownership 16. postal address
6. transportation/roads 17. wetlands
7. hydrography/rivers and lakes 18. soils
planimetric 19. register of private companies
8. ocean coastlines 20. gravity network
9. bathymetry 21. zoning and registration
10. physical features/build
are handled. Geographic objects are qualified using discrete attributes. For instance,a building has a number of stories, 5 or 6, a specific use, residential or industrial.Geographic fields, however, have attributes with values that vary continuously overspace. This means that a different attribute value can be determined for differentpositions within the area represented by a field. Temperature, for example, varies intime and continuously over geographic areas.
We usually arrange geographic objects in groups. Such grouping depends very muchon the views of particular user communities. Typical examples of these collections
18

Chapter 2. Geo-information concepts
are, the railways in a transportation system, the railway stations in that system, andthe parcels in a cadastral system.
Geographic objects can also be organised at higher aggregation levels like, plots thatform a neighbourhood, neighbourhoods that form a municipality. These aggregationscan be useful for certain types of analysis, like capacity or connectivity computations.For example, if one needs to know how much water flows into a lake, rivers, streamsand lakes will have to be studied together as a hydrographic system, to enable a querythat can provide the required (capacity) answer.
Geographic data is collected to support a wide range of applications. Within thecontext of a GDI, however, the question arises whether data collected for one appli-cation can be effectively used for another. This consideration leads us to distinguishbetween three categories of geographic data: framework data, foundation data andapplication-specific data.
Framework data is collected with a broad audience in mind and can be used bymultiple user communities with different expertise in multiple domains of interest.Foundation data is collected with the aim of satisfying the needs of a single usercommunity with a particular expertise or domain of interest. Application-specificdata is collected to serve no other purpose but an individual application with a highlyspecialised and narrow scope.
Table 2.1 [Ons02] shows the result of a survey in multiple countries to determine whatdata should be considered as framework data in the context of a National GeospatialData Infrastructure (NGDI). Different countries selected from a list of geographic datatypes the most relevant ones (in terms of data sharing) according to their individualneeds. These are shown as empty circles in Table 2.1. From this list 8 types wereselected as being framework data, which are shown as filled circles in Table 2.1.
2.4 Representations of geographic data
This section introduces concepts required to create descriptions of geographic datasuch that this data can be organised and stored, e.g., in databases.
Digital representations of geometric data can be created using a variety of alternatives.This could be seen as a benefit because we can represent our data in the form that suitsour specific application the best. However, if everyone chooses his own representationof data, the possibility of sharing data among multiple application domains diminishesconsiderably. This is because users and their intended applications are very diverseand, data collected and structured in an application-specific way becomes hard tore-use (see section 2.3).
The method selected to represent and store geographic data has huge implicationson its possible uses. Therefore, it is important to understand the notions behind
19

2.4. Representations of geographic data
geographic data representation. We use this notion in section 6.4 when we explaindata definitions. The two most used computer representations of geographic dataare vector-based and raster-based representations [By01, Wor95]. In the sequel, wedescribe in detail these representation methods, and we also discuss their suitabilityto represent geographic objects and geographic fields.
2.4.1 Vector-based representations
The representation of a geographic element consist of two parts: a descriptive partand a positional part (see section 2.3). In vector-based representations, an attemptis made to associate zero-, one- or two-dimensional features to the positional-part ofgeographic elements. This type of representation is also referred to as entity-based,feature-based or object-based representation. This representation method is the mostsuitable to handle geographic objects.
Zero-dimensional features or points are defined as a single coordinate pair (x, y) orcoordinate triple (x, y, z), and are used to represent geographic elements with an areathat is too small or irrelevant with respect to the scope of the spatial application.The values of the coordinates define the location of the element. Transmission towers,water valves, cities, airports, museums, churches are some of the elements that areoften represented as points.
One-dimensional features or lines are defined by two delimiting end nodes and zeroor more internal nodes or vertices that form segments or edges. Nodes are definedlike points as discussed before, but they do not serve any purpose other than to helpdefining the shape of the line.
Linear features are used to represent geographic elements such as roads, rivers, pipe-lines, power lines, railroads. Multiple connected lines are often used for representingnetworks, especially when there is the need to study, for example, connectivity in aroad network, or, capacity when monitoring a river system. Figure 2.3 shows a linerepresentation with four segments connected by three vertices and delimited by twoend nodes.
. . .Elevation
Rivers
. . .Roads
AdministrativeUnits
. . .Soil
Land Use
Clearinghouse server
. . .
Catalogue
Metadata entries
Metadata entriesMetadata entries
User Interface&
search and queryapplications
Data providers’ servers(data collections or datasets)
User requests
GDI-Components.pdf
vertices
end nodes
(a) (b) (c)
Linear-Representation.pdf Tessellations.pdf
Figure 2.3: Linear feature representation
20

Chapter 2. Geo-information concepts
CC
DD
BB
EE3
12
4
5
6
b
a
c
de
f
g
h
i
arc from to left right vertices
abcdefghi
211535463
524613246
AADEAADCC
BDCBCEBBE
. . .
. . .
. . .
. . .
. . .
. . .
. . .
. . .
. . .
Region-Representation.pdf
AA
Figure 2.4: Region features representation
Two-dimensional features or regions are defined by a set of interconnected arcs (lines)that determine the boundary of the polygon that encloses a region. For every arc,we store its external nodes, its left and right polygons and the list of vertices. Thisrepresentation form is called the boundary model.
Figure 2.4 shows a group of regions B, C, D, E. The list of arcs contains the initialand final nodes, in the columns left and right, that define the direction in which arcshave been represented, their left and right polygons, and the list of vertices (whichhave been omitted in Figure 2.4). Arc d, for example, starts in node 5 and ends innode 6, and it has polygon E to the left and polygon B to the right. Polygon Ain the table denotes the outside polygon. The outside polygon represents the areasurrounding the area of interest, or the external area.
The boundary model is often called the topological model since it captures some topo-logical information, like, e.g., polygon neighbourhood. Region features are mostlyused to depict geographic elements with large areas like lakes, parcels and adminis-trative units.
Figure 2.5 shows some geographic elements represented using points, lines and regions,with a corresponding attribute value. The lake element in Figure 2.5, for example,is represented by a region feature and has the attribute value 4. The house and thetransmission tower are portrayed as points, while the road and railroad are depictedas lines.
The decision on which type of feature to use to represent an element depends on theapplication requirements. Here, the house is represented as a point, but if we need tomake some analysis based on the area of the house for taxation purposes, then it isnecessary to represent the house as a region. Shape and size of the elements can berepresented more accurately with this type of representation.
21

2.4. Representations of geographic data
1 2
3
4 5
Vector-basedRepresentation
GeographicElements
Vector-Representation.pdf
Figure 2.5: Vector-based representation of geographic data
2.4.2 Raster-based representations
The raster-based representation approach makes use of tessellations for the represen-tation of geographic elements. A tessellation can be defined as a repeating patternof interconnected shapes. With a tessellation, the whole study area is partitionedinto an arrangement of pairwise, disjoint cells. Each cell is associated with attributevalues or labels that indicate to which geographic element it belongs.
Tessellations can be regular or irregular. A regular tessellation is formed by cells thatare congruent regular polygons. Regular means that the sides of the polygon are allthe same length, and congruent means that also all the polygons are of the same sizeand shape, such as in Figure 2.6.
Irregular tessellations are partitions of the study space into disjoint cells, but in thiscase the cells may vary in shape and size. A well-known form of irregular tessellationis the region quadtree. It is also made up of square cells, but in this case adjacentcells with the same attribute value or label are merged to form a bigger cell.
. . .Elevation
Rivers
. . .Roads
AdministrativeUnits
. . .Soil
Land Use
Clearinghouse server
. . .
Catalogue
Metadata entries
Metadata entriesMetadata entries
User Interface&
search and queryapplications
Data providers’ servers(data collections or datasets)
User requests
GDI-Components.pdf
vertices
end-nodes
(a) (b) (c)
Linear-Representation.pdf Tessellations.pdf
Figure 2.6: Regular tessellations: (a) triangular cells, (b) square cells, and (c) hexagonal cells.
22

Chapter 2. Geo-information concepts
Square cell tessellations, also known as grids or rasters, are mostly used to representgeographic fields (elevation, temperature, etc). Grids are suitable for representingarea objects (polygons). In this case, each cell in the grid is labelled according to thepolygon it belongs to. Grids are less suitable to represent geographic objects withpoint or line geometry.
Grids greatly facilitate tasks such as geo-referencing, because in a grid of m× n cellsthe location that corresponds to a particular cell can be determined rather easily, justby knowing the cell position (row and column coordinates), and the cell size.
The cell size of a tessellation is an important aspect to consider. Various factors mayinfluence the choice of the cell size; the most relevant factors are the scale requiredfor the intended application, the resolution of the elements of interest and the type ofdata to be obtained such as satellite imagery. A small cell size yields a representationclose to the geometry of the real objects, but results in a large data set that may bedifficult to manipulate.
4 44
4 4
44
4
1 1
1 1
11
3
2
5555
1 2
3
4 5
Vector-basedRepresentation
Raster-basedRepresentation
GeographicElements
Raster-Vector-Representation.pdf
Figure 2.7: Representations of geographic data
23

2.5. Organisation of geographic data
It is always necessary to make a trade-off between the accuracy of the representation ofthe elements portrayed in the tessellation and the amount of memory space requiredto store and manipulate the data, specially when dealing with large areas. Theprocessing time for most of the operations on tessellations increases more or lesslinearly with the amount of data.
Figure 2.7 shows how the geometry of a group of geographic elements is representedusing both vector-based and raster-based representations. The bottom of the figuredepicts how in the raster-based approach a geographic element is represented by aseries of neighbouring cells that share the same attribute value. For instance, thecells in the grid that represent the road have been assigned the value 1, the cells thatrepresent the lake have been assigned the value 4, etc. The figure also shows howthe cell size affects the geometric representation that is associated with the variouselements.
2.5 Organisation of geographic data
The most optimal way to organise large amounts of data, either geographic or ofany other type, so that it can be accessed, managed, retrieved and updated is ina database. Databases are organised around data models. Data models representpeople’s perception of reality in an abstract way. Data models are used to describe thearchitecture of a database. By architecture we mean the data contents, relationshipsand constraints, the data structure and the physical storage or data format. Datamodels are commonly organised into different abstraction levels according to whataspect of the database architecture they describe.
2.5.1 Conceptual schema
The conceptual level describes what information is stored in the database. At thislevel we define precisely what are the data contents, the relationships among the data,and the constraints that should hold on this data. This description of the databaseis called the conceptual database schema.
In a conceptual schema, we represent a set of real world objects (employees, rivers,buildings) or concepts (projects, temperature, rainfall) of interest. We identify prop-erties of interest that further describe the objects and concepts, such as the buildings’sname and owner. We also describe relationships among objects, for example, an is-owned-by relationship between a building and an owner.
Conceptual schemas can be expressed using different techniques, the most commonones being Entity-Relationship (ER) diagrams and class diagrams (UML). In ERdiagrams we use concepts such as entity types, attributes and relationships. Entitytypes represent objects or concepts, attributes represent descriptive properties of theentities, and relationships represent interactions among entities.
24

Chapter 2. Geo-information concepts
In class diagrams [OMG01d] we use concepts such as objects, classes, attributes,operations and associations. to create conceptual data models. An object representsan identifiable abstract or concrete thing. A class describes a set of objects that sharethe same attributes, operations, methods and relationships. A class is used to groupobjects in such a way that their similarities can be emphasised and their differencesignored. Attributes are named properties of objects that contain values that qualifythe individual objects. Associations represent static relationships that exist amongclasses.
2.5.2 Building geographic databases
Figure 2.8 shows a selection of elements from the real world, and a conceptual schemaof those elements constructed using a class diagram, which captures the types ofobjects of interest and some of their relationships from the real world. Figure 2.8 alsoshows that a logical data model can be built from the conceptual data model usingthe relational model technique. The logical model shows a group of tables, wherethe rows in the tables represent objects that belong to a certain class. The linesconnecting the tables represent relationships between the objects, such as, who ownswhich building or which road gives access to which building.
The process of designing a database to store geographic data is fundamentally thesame as that of any other database. However, one additional issue that we considerin geospatial databases is the definition of the spatial representation of the objects orconcepts of interest together with their spatial and topological relationships [Zei99,RSV01]. This means that after we have created the conceptual schema and identifiedobjects and relationships, we determine whether these objects are represented as
Real world
Building RailwayRoad
Owner
RoadRailway
Class diagram
Relationalmodel
Owner Transport
Building
Data-models.pdf
Figure 2.8: Conceptual and logical abstraction levels
25

2.6. Describing geographic data
points, lines, polygons or grids. This decision depends, among others, on the natureof the objects, the significance of their shape, the scale (spatial scale) of the application(see section 2.4). We also define topological associations such as, for example, groupsof elements, e.g., bus stop, bus station, street and traffic light, which together form atransportation network.
One last issue in the design of a geographic database is the determination and assign-ment of the coordinate system that references spatia;;y the contents of the database.A coordinate system, is used to define locations on earth. Based on a coordinatesystem objects can be referenced by their coordinates with respect to an origin point.Locations of objects are identified by x,y coordinates on a grid, with the origin at thecentre of the grid. One specifies its horizontal position (East–West) and the otherits vertical position (North–South). The two values are called the x-coordinate andy-coordinate. Using this notation, the coordinates at an origin could be x = 1000000and y = 1000000.
2.6 Describing geographic data
The value of geographic data is recognised by both government and society, but itseffective use has remained inhibited by poor knowledge of the existence and where-abouts of data, poorly documented data collections, and data inconsistencies.
Once created, geographic data can be used by multiple users for different purposes,given that its existence and fitness-for-use are known. If we also consider the dy-namic nature of this type of data, we conclude that describing the data is thereforean essential requirement. For a community organised around the concept of datasharing, data plus its documentation (metadata) is certainly more valuable than justundocumented data.
Metadata can be used by data providers to monitor and control the status as well asto advertise their data to potential users. Coordinated metadata development andadvertisement could avoid duplication of effort and waste of resources, by ensuringthat producers are aware of the existence of data collections.
Metadata enables users to locate all available geographic and associated data coveringtheir particular area of interest, therefore improving the quality of their analysis andapplications. Generating metadata certainly adds to the cost of data collection, but inthe long run the value of the data or the revenues that can be obtained from the dataincrease if that data is properly documented and described by means of metadata.
The term metadata and the metadata itself have become widely used over the lastyears, but its underlying concepts have been in use since collections of informationstarted being created and properly organised. Library catalogues represent an estab-lished sort of metadata that has served for decades as a management and resourcediscovery mechanism.
26

Chapter 2. Geo-information concepts
The concept of metadata is now common among people who deal with location relatedissues. A map legend is one representation of metadata, containing information aboutthe publisher of the map, the publication date, the type of map, a description of themap, spatial references and the map’s scale and accuracy, among other things. Meta-data can be defined as the set of descriptive information applied to a data collectionthat enables its discovery, access and use.
2.6.1 Levels of metadata
Based on how metadata is used, we organise it in three different levels:
• Discovery metadata allows users to find data collections that contain the sortof geographic data they are interested in. Producers publish or make availablethis type of metadata to advertise the contents of their data collections;
• Exploration metadata allows users to perform a deeper study of discovered datacollections, to determine if or which of the data is useful for their purposes. Thistype of metadata aims at ensuring that data is used correctly and wisely;
• Exploitation metadata allows users to determine how to obtain and use thedata that they suspect can satisfy their needs. This type of metadata aims atensuring that existing data can be accessed.
We are not implying that these levels of metadata are unique, but rather we find themsufficient as description levels of data collections. The boundaries between these levelsare not sharp or definite and the levels are somehow complementary or overlapping.Data producers should be aware of these issues and they should look at their overallneeds and requirements, and then determine and specify how their metadata shouldbe structured, or, in other words, what data to collect as metadata.
Discovery metadata is the minimum amount of information that needs to be providedto inform anyone interested in the nature and content of a data collection. This meansthat discovery metadata should address the issues of “who has what data and fromwhere.” Who defines the creator and supplier of the data, and possibly intendedaudience; what defines a name or title, resolution and description of the data; wheredefines the geographical area being covered, based on coordinates, geographical namesor administrative areas. Discovery metadata usually, but not exclusively, enables oth-ers to discover collections of data that have similar contents and that cover (describe)either the same, or similar, or partially overlapping geographic areas.
Exploration metadata provides sufficient information to enable users to determinewhether some existing data is useful for their application. This means that explorationmetadata should address the issues of “why, when and how was data collected.” Whydefines the reasons for data collection and its intended uses; when defines the datethat the data represents, when the data set was created and the update sequence, if
27

2.6. Describing geographic data
any; how defines what instruments, procedures and sources were used to generate thedata, and how the data is structured.
Exploration metadata includes the details required to allow the prospective end-usersto know whether the data meets the requirements for their application. Explorationmetadata usually facilitates to establish the quality and usability of data collectionsand whether they are up-to-date.
Exploitation metadata provides information to enable users to access, transfer, load,interpret and use the data in their end applications. This type of metadata alsoincludes details on contact person, the price of the data and copyright.
2.6.2 Metadata standards
In order to make metadata readable, understandable and usable by users from dif-ferent disciplines, standards are necessary to provide a common terminology and todefine how to document geographic data. To the best of our knowledge there exist atthe moment three main metadata standards of broad international scope and usage:
• CSDGM, the Content Standard for Digital Geospatial Metadata [FGD98], cre-ated in the USA by the Federal Geographic Data Committee (FGDC) in 1994.
• ENV, the European Set of Standards for Metadata Generation (Euro-NormeVoluntaire), created by the Comite Europeen de Normalisation (CEN) in 1998.
• ISO-FDIS 19115, the International Standard for Geographic Information - Meta-data [ISO01c], developed by ISO through the Technical Committee 211 (ISOTC-211), which is responsible for the Geoinformation/Geomatics area.
Metadata also forms an important part of the OpenGIS Abstract Specification. TheOpenGIS Consortium (OGC) is an international membership organisation engagedin a cooperative effort to create open computing specifications in the area of geo-processing. As part of the draft ‘OpenGIS Abstract Specification’ there is a topicon recording metadata for spatial data, which is developed in cooperation with ISO-TC 211.
The ISO/FDIS 19115 - Draft International Standard [ISO01c] is now in its third ver-sion. It is the responsibility of 33 countries and 12 observer organisations to turn thisdraft standard into an International Standard. People expect that all the existingstandards will converge through the ISO initiative. Indeed, most of the existing stan-dards already have a great deal in common and a robust international discussion hasensured that the ISO standard has accommodated most of the various internationalrequirements. The ISO standard has equally benefited from the experience of thevarious national bodies and their implementations of metadata standards.
28

Chapter 2. Geo-information concepts
2.7 Geo-information services
The role of the GDI is currently changing, from it being a simple data discoveryand retrieval facility to become an integrated system suitable for the provision ofcustomised information and services. We consider a service as the contribution ofa system or part thereof to its surrounding environment. This contribution can bedefined in terms of data, operations, processes, resources, value-added products orany combinations of them. For the sake of simplicity we use the term services todenote geo-information services.
Normally developers address the issue of designing complex services by stringing to-gether groups of functions in an ad hoc manner. This approach may satisfy a particu-lar need but doing this separately for different services hampers reusability. Moreover,lack of descriptions of the solutions obtained makes it hard to aggregate solutions toexecute complex tasks.
Research is therefore focusing on the development of mechanisms to describe, combineand manage independent collections of services. Here, we introduce a concept thataims at facilitating the generation of sophisticated value-added services. We call itthe Geo-information Service Infrastructure or GSI for short. The idea of the GSI isthat elementary services can be described, accessed, combined and managed to delivercomplex content. Within the GSI, a common method is used to describe elementaryservices and their interfaces, and then these services are made available for users tocreate service chains that perform complex geo-processing tasks.
2.7.1 GSI
A Geo-information Service Infrastructure (see Figure 2.9) is a system from whichspecialised geo-information products and services can be obtained by exploiting theartefacts (see section 4.5) of an infrastructure of interconnected nodes that includedata repositories, data brokers, service providers, service brokers and clients. Thisservice framework builds upon the layer of interoperability of information as defined bythe OpenGIS implementation specifications [OGC99], therefore separating the actualimplementation of services from their definitions and the perception of these servicesby the users.
Large geo-processing tasks can be constructed by combining or chaining sets of arte-facts located along the distributed nodes. Such combinations of artefacts providediverse functionality that satisfies particular sets of requirements. Every artefact hasan economic value; these artefacts are assembled to perform operations within theinfrastructure, resulting in a specialised artefact that has a value equal or larger thanthe combined value of the artefacts used. This architectural approach can be regardedas a “value-added system.” By chaining artefacts one can provide a service. A ser-vice is defined as a behaviour of value to the user, which is accessible or instantiatedthrough interaction points (see section 5.1.2). This behaviour is exhibited through an
29

2.7. Geo-information services
GSI-configuration-C.pdf
Network (Internet)
GSP-node (m)GSP-node (m)
GSP-node (x)GSP-node (x)GSP-node (n)GSP-node (n)
GSP - node (y)GSP - node (y)
User (1)User (1) User (2)User (2) User (n)User (n)
Network (Internet)
Clearinghouse ServerData provider (a)Data provider (a)
datacollection
detailedmetadata
Data provider (n)Data provider (n)
datacollection
detailedmetadata
“metadata”catalogue
GSP-node (b)GSP-node (b)
GSP-node (a)GSP-node (a)
Figure 2.9: The GSI system concept
appropriate combination of elementary artefacts.
In order to bind multiple artefacts into a chain that accomplishes a large geo-pro-cessing task, a proper description of the participating artefacts is required. Thesedescriptions focus on exposing the artefact’s internal behaviour, its intended effectand its interaction points or points of composition. These descriptions, which arepresented as instances of well-defined models, make it possible to interchange andreuse artefacts. We call these descriptions system metadata; they are stored andmade accessible through a service repository.
The GSI system enables Geo-Service Providers (GSPs) to make use of functionalityoffered by others to supply a wide range of services and possibly to reach larger groupsof users. Figure 2.9 illustrates the interactions that take place as GSP-nodes provideservices to their users.
Users interact with the different GSP-nodes to request their specific services. Fig-ure 2.9 shows these interactions as dashed-lines. GSP-nodes may make use of arte-facts available in other GSP-nodes in order to realise a particular service. Theseinteractions between GSP-nodes are shown in Figure 2.9 as solid lines running fromnode to node. All connections mentioned here are established through a network.
30

Chapter 2. Geo-information concepts
At the bottom of Figure 2.9 we can see that additional data collections located atnon-GSP-nodes may still be accessed, if needed, either by users or service providers.This is achieved by making use of the conventional data discovery functionality, ofthe clearinghouse server. These interactions appear in Figure 2.9 as dashed-dot-lines.
2.7.2 GSP-node
Figure 2.10 shows the internal configuration of a GSP-node. The service repositorycontains the descriptions of available artefacts, either data definitions, process defini-tions, or previously assembled service chains.
The geo-processing units are responsible for the execution of the various functionsof the node. These units use geo-data and applications during operation as speci-fied in the definitions stored in the service repository. The service design unit is incharge of defining how the different services are realised. The underlying principlesof this architecture are based on OGC technical baseline specifications for OpenGISServices [OGC02].
The process of generating service chains within the GSI can be broken down intothree major activities: defining and registering elementary services, assembling aservice chain and delivering the results. Three different roles can be identified fromthese activities: service providers, service consumers and end users.
Service providers are responsible for describing and making their elementary servicesavailable for others to use. We denote the entities that provide these elementary ser-vices as components. Service providers make use of a framework (design methodology)
GSP-node (a)
Service design
apps
datadefinitions
geo-datacollection
geo-processingdefinitions geo-processing units
Servicerepository
GSP-node (b)GSP-node (b)
GSP-node (y)GSP-node (y)
User (1)User (1)
GSP-node (n)GSP-node (n)
User (n)User (n)
GSI-node.pdf
Figure 2.10: GSI-node internal structure
31

2.7. Geo-information services
that enables the modelling of these components. These models act as descriptors thatspecify the function and the interaction point(s) of the components.
Service consumers use available components to design more complex services. Serviceconsumers make use of the same framework used by the service providers to assembleindividual components into chains. They define these chains by adding control com-ponents that govern the relations between the elementary components used in thechain.
These control components help ensuring that the constraints and conditions definedat the interaction points of the elementary components are satisfied. The resultingchain is described as a service realisation. The service can be realised by instantiatingthe behaviour portrayed in the specification. End users trigger the definition andexecution of service specifications by posting requests to the system.
32

Chapter 3
System’s representation andarchitecting
You can tell whether a man is clever by his answers. You can tellwhether a man is wise by his questions.
Naguib Mahfouz
This chapter discusses the concepts that underline system design. The chapter moti-vates the need for a process to guide the activities involved in developing systems. Itprovides an overview of techniques used to manage the complexity of the developmentprocess. The chapter also identifies and analyses the various strategies available tosteer the development process.
The chapter is organised as follows: section 3.1 motivates the need for a developmentprocess; section 3.2 introduces the concepts underlining system design and describeshow techniques such as abstraction can be used to structure the development process;section 3.3 introduces and analyses the most popular development strategies.
3.1 System architecting
The primary purpose of system architecting is to help designers cope with the com-plexity of large systems and, more specifically, the complexity of those systems’ devel-opment process. This is especially important when dealing with systems that supportthe core business of organisations, which is often the role of geo-information systems.
Complexity arises when systems can not be grasped in their entirety, mainly becausethey are formed by a vast number of parts that have numerous relationships among
33

3.1. System architecting
them. In such cases, designers are forced to split the system into parts, such thateach individual part can be studied and understood independently, and its interactionswith other parts can be considered in isolation. Complexity does not decrease in thisway but it does become manageable.
A system is defined as a collection of independent artefacts that interact and form acoherent entity that performs a function that is unachievable by any of the artefactsin isolation. System architecting is defined as the application of a systematic, well-structured approach to the development, operation and maintenance of a system.
A system development process is the set of activities followed by a team to analyse aproblem and transform a set of customer requirements into a system (see Figure 3.1).This set of activities helps structuring the actions and thoughts of the developmentteam by clearly stating what to do in terms of phases and outputs, when to do it,how to do it and why.
Requirements
Specification
Design
Implementation
Test
Waterfall-Model.pdfDevelopment-Process.pdf
System DevelopmentProcess
Customerrequirements System
Requirements text
Analysis PIM
Low-level design PSM
Coding code
Testing code
Deployment
MDAProcess
MDA-Process.pdf
Figure 3.1: A system development process
The process of developing a system resembles very much that of construction of build-ings or bridges. When constructing a building one does not start piling up bricks, butrather studies the needs of the client and then outlines a structure that complies tothose needs. Information system construction goes much in the same way. First, theproblem is analysed and the requirements identified and described in a precise way.Next, a design based on the requirements is made, and this design should conceptuallysolve the problem for the user. Next, the construction process starts and the actualsystem is realised. Finally the system is tested in a controlled environment to validatethe fulfillment of the requirements. Generally, a system is said to be well-designed ifit provides the expected (or predefined) service, within the limits of its budget andfor a reasonable period of time.
These phases are not necessarily sequential. It is possible, for instance, that dur-ing the development process the requirements change or that errors are found and,therefore, backtracking to an earlier phase takes place. Moreover, the phases are notstrictly separated. For example, it is quite possible to start the implementation ofsome parts of the system, which have been completely designed, while delaying theimplementation of other parts, which have not been fully designed yet.
The goals of this separation into phases are, first, to provide adequate structuring ofthe various aspects addressed during development; and, second, to identify a numberof design milestones that allow to control the progress of the development process,and the verification of the transition between subsequent phases.
34

Chapter 3. System’s representation and architecting
3.2 Architectural principles
During the design process of a system we may decompose the system into smalleridentifiable parts. There are, in principle, many ways to decompose a system intoparts. Therefore, it is essential to establish, in addition to controlling complexity, therequired design features of a decomposition such that a decomposition method canbe applied correctly and satisfactorily.
The design characteristics we are most interested in are modularity, functionality,reuse and distribution. These characteristics are specially relevant for systems thatmay witness frequent change. A design process organised around these critical aspectsis, in principle, capable of supporting the design of systems that are easy to maintain,flexible to adapt, while satisfying changing requirements.
3.2.1 Abstraction
The process of designing and developing a system like a vehicle, a database, a map,a software system or a telematic system involves the generation of descriptions ofthe various characteristics of the system under consideration. The object’s descrip-tive characteristics initially exist only in the minds of the designers and need to beexpressed, therefore, to express their ideas, designers make use of formalised nota-tion to create a conceptual description of the system. In most situations, however,the amount of detail required to create a description that concretely and sufficientlydescribes a system simply overwhelms the minds of those working on it.
To deal with this problem, designers use a technique that enables them to reduceand organise the amount of detail required to create a particular description. Thistechnique makes it possible to generate a series of descriptions of the same system,each focusing on the representation of a specific aspect () of the object and ignoringthe other aspects. This technique is called abstraction. Abstraction can be definedas the process of selecting and representing particular aspects of a system or problemthat are relevant at a particular phase of a development process while ignoring thoseother details that are also proper to the object but yet irrelevant during that phaseof development. Abstraction is the primary technique for handling complexity.
Making the correct choice of abstraction facilitates the generation of clear representa-tions of a system, which then enable people to make sense out of what might become arather complex implementation. An accurate representation created using the correctabstraction choice is called a specification.
Figure 3.2 illustrates the concept of abstraction. In this example a description of asystem is presented in the form of a map. The description represents an undergroundsystem. System’s descriptions are always created for a specific purpose. This purposeshould be used to select the choice of abstraction. The purpose of the undergrounddescription is to aid travellers in using the underground. For this reason in theunderground description much of the physical detail has been removed and only the
35

3.2. Architectural principles
Rio Negro
Rio
Bog
otá
ParqueNacional
Planetario
CentroInternacional Plaza de
Bolívar
LasAguas
avenida19
Catastro
UniversidadNacional
Galerías
El campin
Colsubsidio
CementerioCentral
HotelTequendama
Parkway
Univ. Nal.Plaza Che
FeriaExposición
Gobernación
CAD
Teusaquillo
HospitalMilitar
Compensar
IcontecParqueEl Salitre
Club deEmpleados
Av. Las Palmas
Lourdes
UniversidadSanto Tomas
ChapineroAlto
UniversidadPedagógica
Cementeriodel norte
UniversidadJaveriana
Calle 45
UniversidadDistrital
La Soledad
QuintaCamacho
7 de agosto
Los Héroes
Unilago
La Porciuncula
World TradeCenrter
Usaquen
EscuelaMilitar
BavariaGuardia
Presidencial
EstaciónSexta
La Hortua
SalitrePlaza
Acueducto
Terminalde Transportes
Germania
BibliotecaLuis A. Arango
Avianca
SanAndresito
CentroAndino
Puentearanda
Rionegro20 de Julio
Underground-Specification.pdf
Figure 3.2: Abstract representation of an underground system
logical layout is presented. The logical layout (the relevant aspect in this case) isdefined by the metro lines, the stations and the connections between stations.
When creating a description of a system, one selects those design concepts that bestexpress the aspects of interest. In the underground description (Figure 3.2), abstractconcepts such as colours and shapes are used to show metro lines and stations, andstraight lines with 45◦ or 90◦ angles are used to show the connections between stations.We intentionally selected this example of the use of abstraction since it brings togetherthe two central subjects of this research; geo-information and system design.
Abstraction is a familiar concept in the field of geo-information. Abstraction is theconcept that underlines the techniques for representation of geographic informationin computer systems. Moreover, abstraction has always been used in the field ofgeo-information as a tool to control what and how information is portrayed on maps.
3.2.2 A model of a system
Modelling is essential in system design. To be able to express and communicate thecharacteristics of a system that are relevant in a design project it is necessary to createsystem models (see Figure 3.3). A model is a conceptual (abstract) representation of areal-world system or part thereof. A model is the result of the designers mental imageof a system. The model of a system considers some characteristics of the system, andignores others. Abstraction as defined above can be used to capture the common
36

Chapter 3. System’s representation and architecting
properties of a system, therefore, it is the main technique employed in the creation ofsystem’s models.
basedept
height
= 1u= 1u= 2u
vol = b x d x h
Real World MentalImages
ConceptualRepresentation
System Thought Model
Figure 3.3: System and model
A model of a system is an abstraction of this system. A model can be createdusing different alternative representations. For example, a miniature of a house andits construction drawings are both models of the house. These representations aredifferent because they have different purposes, e.g., the miniature is used to givepotential buyers a good impression of how the house will look, while the constructiondrawings are used by the constructors to know what must be built.
A model can only be effectively used for communicating the characteristics of thesystem being modelled to the people interested in the system, if the model possessesthe following properties [VFPQS99]:
• it is precise enough to avoid confusion on what it means (preciseness);• it is simple and well-structured to be understood;• it is clearly related to the system that it models, such that it appeals to the
intuitive understanding of those who have to use it;• it can be manipulated such that possible behaviour and properties of the system
it models can be explored.
3.2.3 Abstraction levels
Although designers benefit from the use of abstraction when devising a new system,abstraction only helps to focus on a controllable amount of detail. Yet all the necessarydetails to fully express a design have to be considered and subsequently described toobtain the desired system.
To accommodate all the essential information for a complete design, multiple modelshave to be created. This can be done by using different levels of abstraction, each ofthem dealing with a different set of characteristics of the system. At each abstractionlevel models of the system are created, which consider the system at a predefined levelof detail [BCK03].
37

3.2. Architectural principles
Abstraction 1
Abs
tract
ion
Refinem
ent
less detaileddesign
more detaileddesign
design step
level (n)
level (m)
level (m+1) Abstraction 2
Abstraction N
Abstraction-Levels (.)pdf
Figure 3.4: Abstraction, refinement and levels of abstraction
If a design is composed of multiple abstraction levels, then, given two abstractionlevels (A and B), we say that A is at a higher level than B if and only if : 1) Aexpresses fewer properties than B; and, 2) all the properties of the system that areexpressed in A are preserved in B.
The action of moving from one level of abstraction to the next level is called a designstep. The process of moving from one level of abstraction to another to create a modelthat includes a larger amount of detail than the previous one is called refinement.Refinement is the reverse of abstraction, since it is used to incorporate the detailabstracted away in previous design steps, providing a more detailed description of thesystem. The relationship between abstraction, refinement and levels of abstraction isshown in Figure 3.4.
3.2.4 Views
In some cases, it is not practical to include all relevant details about a system forsome abstraction level, for instance in a single monolithic design. For example, itmay not be desirable to mix in a single system description information about whata system does (functionality), with information about how effectively the systemoperates (performance).
In such cases, one can use the concept of views. A view is a representation of a systemrelative to a set of concerns or points of interest. Instead of expressing everythingabout a system in a single model, a view addresses a subset of the concerns on the
38

Chapter 3. System’s representation and architecting
Enterprise
Information
Engineering
Technology
Computational
Correspondence for consistency
System
System-Views.pdf
Figure 3.5: RM-ODP viewpoints on a system
whole system. These subsets of concern may be defined according to some develop-ment objectives, examples include, performance, cost, maintainability and reliability.
A set of concerns or aspects of interest is called a viewpoint. Viewpoints are not lay-ered, but rather different perspectives of the same system. A view is a representationof a system according to a viewpoint. Each view is considered a complete repre-sentation of the system with respect to the associated viewpoint. The collection ofviews together provide a consistent and complete representation of the system. This
Table 3.1: RM-ODP Viewpoints and focus of concern
Viewpoint Concern
Enterprise Deals with the system responsibility, the reason for the systemand its use in the environment — purpose and objectives.
Information Deals with the information that is manipulated in the systemand the constraints or rules and relationships that apply to thatinformation — semantics of processing and information.
Computational Deals with the internal composition of the system and the in-teractions that take place between components — behaviour,interactions and constraints.
Engineering Deals with the distribution and configuration of the system andwith the mechanism needed to realise the distribution — dis-tribution and infrastructure.
Technology Deals with the technology and products required to implementthe system and with the issues of conformance of the systemagainst its specification — technology, standards, products,code and conformance test points.
39
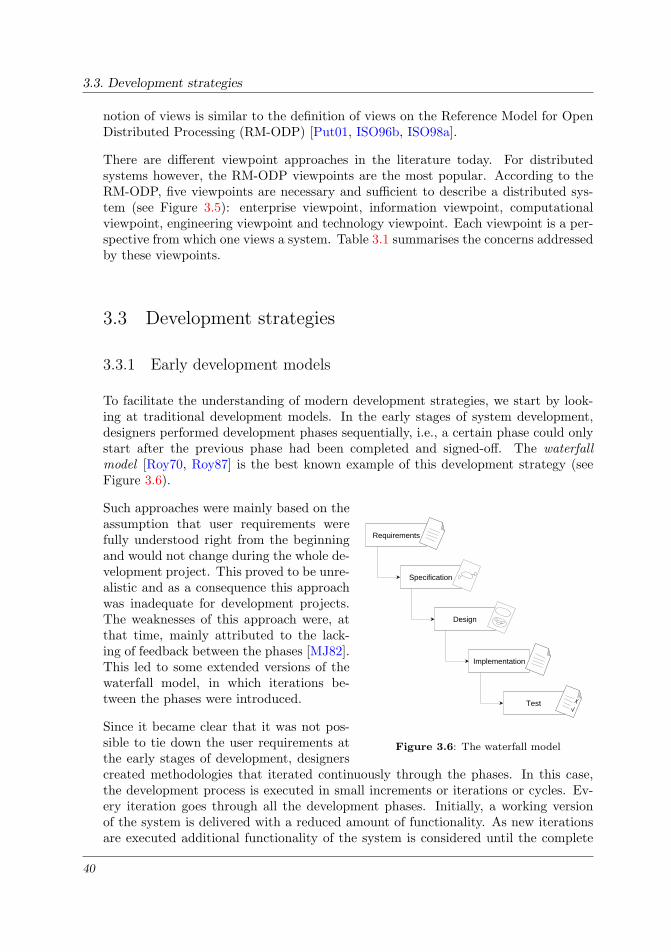
3.3. Development strategies
notion of views is similar to the definition of views on the Reference Model for OpenDistributed Processing (RM-ODP) [Put01, ISO96b, ISO98a].
There are different viewpoint approaches in the literature today. For distributedsystems however, the RM-ODP viewpoints are the most popular. According to theRM-ODP, five viewpoints are necessary and sufficient to describe a distributed sys-tem (see Figure 3.5): enterprise viewpoint, information viewpoint, computationalviewpoint, engineering viewpoint and technology viewpoint. Each viewpoint is a per-spective from which one views a system. Table 3.1 summarises the concerns addressedby these viewpoints.
3.3 Development strategies
3.3.1 Early development models
To facilitate the understanding of modern development strategies, we start by look-ing at traditional development models. In the early stages of system development,designers performed development phases sequentially, i.e., a certain phase could onlystart after the previous phase had been completed and signed-off. The waterfallmodel [Roy70, Roy87] is the best known example of this development strategy (seeFigure 3.6).
Requirements
Specification
Design
Implementation
Test
Waterfall-model.pdfDevelopment-process.pdf
System DevelopmentProcess
Customer’srequirements System
Requirements text
Analysis PIM
Low-level design PSM
Coding code
Testing code
Deployment
MDAProcess
MDA-process.pdf
Figure 3.6: The waterfall model
Such approaches were mainly based on theassumption that user requirements werefully understood right from the beginningand would not change during the whole de-velopment project. This proved to be unre-alistic and as a consequence this approachwas inadequate for development projects.The weaknesses of this approach were, atthat time, mainly attributed to the lack-ing of feedback between the phases [MJ82].This led to some extended versions of thewaterfall model, in which iterations be-tween the phases were introduced.
Since it became clear that it was not pos-sible to tie down the user requirements atthe early stages of development, designerscreated methodologies that iterated continuously through the phases. In this case,the development process is executed in small increments or iterations or cycles. Ev-ery iteration goes through all the development phases. Initially, a working versionof the system is delivered with a reduced amount of functionality. As new iterationsare executed additional functionality of the system is considered until the complete
40

Chapter 3. System’s representation and architecting
start
Analysis & design Prototyping
Planning
version #1
version #2
version #3
Newfunctions
Determineobjectives,
Evaluate alternatives,
Identify and resolve risks.
Develop andVerify next-level
product.
Requirements validation,
Plan next iteration.
Spiral-model.pdf
(a) Spiral model
Incremental-model.pdf
Detail design
Code / Test
Integration
Implement...
Maintenance
Increment [1] …
Requirements
Preliminary Design
Detail design
Code / Test
Integration
Implement...
Maintenance
Increment [2]
Detail design
Code / Test
Integration
Implement...
Maintenance
Increment [n]
…
…(b) Incremental model
Figure 3.7: Iterative development methods
functionality of the system is realised. Each full iteration employs all of the phases de-fined in the waterfall model, therefore the milestones of that method remained validand applicable. Examples of this approach are the spiral model (see Figure 3.7a)[Boe88, BB90], and the incremental model (see Figure 3.7b) [MOL+80].
These iterative strategies were useful for development projects in which the designproblem was not fully understood, and particularly if the requirements were expectedto change during the life cycle of the project [Boe96]. Advantages of these iterativestrategies over the early ones were: they provided some opportunity for incorporat-ing change; and they delivered a working system with a limited functionality at anearly stage of development, which allows for faster evaluations. This limited workingsystem allows users to try and test the system leading to possible improvement andclarification of the requirements.
The most important legacy of these early development methods was the identificationof important milestones in the development process: the requirements specification,the analysis model, the design model and the implementation. These milestoneswere obtained at the end of the various development phases. The phases are calledrequirements, analysis, design, implementation and test, and operation, respectively.These phases are still considered valid today, but the trajectories navigating themin modern strategies are much more complex. From now on, we concentrate on therequirements, analysis and design phases because these are the most relevant for ourwork.
The objective of the requirements phase is to capture and document the requirementsof the system. These requirements are commonly expressed in business terms that de-scribe the problem domain. The requirements phase results in an agreement betweenthe system users and designers concerning the functions, rules and constraints thatare visible from the outside of the system. Requirements do not only include func-tional aspects of the system but also issues such as cost, reliability and developmenttime.
41

3.3. Development strategies
The analysis phase focuses on the definition of the functionality of the system. Duringthis phase, the business requirements obtained in the previous phase are studied todetermine what services should be provided by the system. The result of this phase is aspecification that prescribes what is the functionality of the system. Such functionalityshould fulfill the requirements of the users.
The design phase focuses on defining how the functionality of the system is realised.This phase is usually divided into two related stages. In the first stage, the overallstructure of the system is specified and all the necessary components are identified.This stage involves the definition of the role of each component and the specification ofthe interactions between components. In the second stage, the individual componentsare refined to obtain their internal structure in terms of subcomponents and theirinteractions. The second stage is applied recursively on the subcomponents untilcomponent specifications suitable for implementation have been produced.
3.3.2 Object-oriented development
With the introduction of object-oriented concepts, new approaches to system develop-ment were proposed. Designers identified that the ideas of object-oriented program-ming could be used to strengthen the analysis and design phases of the developmentprocess as well. Although most of the practitioners of object-orientation agree thatanalysis and design are the key activities to ensure success in a development project,there are few others that prefer to write code almost from the start, and work theirway through the project using mainly prototyping as their core activity.
In object-oriented development, models at different levels of detail are created duringthe analysis and design phases. In the analysis phase, a model is created that com-prises a number of logical objects. Each logical object in the model corresponds toan object in the real world. These real world objects are often called domain objects.This is because they are only meaningful from the system domain point of view.
In the design phase a definition of the architecture of the system is created. Thedesign model is a definition of the logical objects in enough detail to enable theirimplementation. In this phase new objects are defined. These objects, also calledimplementation objects, represent the actual objects to be found in the system im-plementation as opposed to the logical objects defined before. The design model is aprecise description of how the system functions are realised.
Object-oriented development strategies follow a methodology that defines a series ofsteps or development phases, and the trajectory to navigate through those phases.Some of the best known approaches to object-oriented development can be found in[JCJ92, TP96, Boo94, RBP+91].
Summarising from the different authors we identify the major tasks to undertake dur-ing object-oriented development. The steps mentioned bellow are listed sequentially,but they could partly or totally overlap.
42

Chapter 3. System’s representation and architecting
1. Gather requirements;2. Describe typical scenarios;3. Identify candidate domain objects, determine what these objects are, and what
they are responsible for;4. Establish the relationships between objects;5. Iterate.
The purpose of steps 1 through 5 is to establish the description of the problem interms of domain objects and the basic interactions among them.
6. Refine the definition of relationships;7. Identify any existing or previously implemented objects and generalise them;8. Refine the objects to determine their internal structure;9. Iterate.
The purpose of steps 6 through 9 is to create a complete definition of the objects inenough detail to allow their implementation or coding. These steps emphasise theuse of controlled iterations to help achieving the required functionality. Iterationsare a natural and intuitive way to obtain complete understanding, interpretation andimplementation of the user requirements.
The most important approaches that came as a result of the incorporation of object-oriented concepts in system development, were the Objectory process [JCJ92], ObjectModelling Technique or OMT [RBP+91] and the Booch Method [Boo94]. The ideasput forward by Booch, Jacobson and Rumbaugh grew and evolve into what eventuallybecame the known as the Unified Process [JBR99].
3.3.3 The Unified Process
The Unified Process [JBR99] is a generic process framework for software development.According to its developers, the Unified Process is more than a single process, butit is a framework that can be specialised for a large class of systems and differentapplication areas. An example of a specialisation of the Unified Process is the RationalUnified Process (RUP) [Kru99].
The Unified Process is organised around three main principles: functional require-ments, component-based architecture, and, iterative and incremental development.
First of all, the Unified Process is driven by requirements. The Unified Process de-fines a systematic and intuitive mechanism for capturing and documenting functionalrequirements with a focus on value-added to the user. All other activities within thedevelopment process can only start once the requirements have been captured anddocumented.
The Unified Process focuses on architecture. The Unified Process identifies the sys-tem’s architecture as a primary artefact for conceptualising, constructing, managing
43

3.3. Development strategies
inception elaboration
iterations
phases
Unified-process.pdf
#1#1
#2#2 …… …… ……
cycle 1 cycle m+1 cycle n-1 cycle n
Organization along time
Organization along content
Developmentproject
…… …… ……
construction
…… …… …… …… …… ……
transition
……#n-1
#n-1#n
#n
cycle m …
requirements
analysis
design
implementation
test
Cor
e w
orkf
low
s
– Cycle (small project) –
releases
…
Figure 3.8: The Unified Process life cycle
and evolving the system under development. Aspects of an architecture according tothe Unified Process include the selection of structural elements, the specification ofthe behaviours of these elements and their interfaces, and how these elements worktogether to progressively compose larger subsystems. Architecture also addresses theissues of performance, scalability, reuse, and constraints either economical or techno-logical.
Another fundamental principle of the Unified Process is its iterative and incrementalnature. An iteration is a mini-project that produces a working version of the system.This version is supposed to offer added or improved functionality over the previousversion, and that is why the result of an iteration is called an increment.
The Unified Process is organised along two dimensions: time and content (see Fig-ure 3.8). The time dimension represents the dynamic aspects of the developmentprocess as it is enacted. This dimension is expressed in terms of cycles, phases anditerations. The content dimension represents the static aspect of the developmentprocess or, in other words, the main activities. This dimension is expressed in termsof core workflows.
Within the Unified Process, the life-cycle of a development project is represented asa series of cycles. A cycle ends with the release of a working version of the system tothe customers. Each cycle contains four phases: inception, elaboration, constructionand transition (see Figure 3.8). Each phase has a specific purpose and concludes witha milestone. At the end of each phase decisions are made about how to proceed withthe project.
The purpose of the inception phase is to determine the viability of the proposed
44

Chapter 3. System’s representation and architecting
system. The outcome of this phase is a business case, which contains, a.o, the scopeof the system, success criteria and risk assessment.
The elaboration phase focuses on determining the ability to build the new systemgiven the constrains faced by the project. This phase results in the determination offunctional requirements and the delivery of an architectural baseline that serves asthe foundation for further system development.
The goal of the construction phase is to build an operational system according to thedecisions made in the previous phases. In the transition phase the working system isincorporated into the user’s working environment.
The activities executed during development cut across the four phases (see Figure 3.8).These activities are: requirements, analysis, design, implementation and test. In eachone of these activities a blueprint of the system is produced and documented in anumber related models, which capture different aspects of the system. These modelsare the use-case model, the analysis model, the design and deployment models, theimplementation model and the test model.
Although the activities and phases are presented here sequentially, they actually liewithin an iterative process, and therefore, they are revisited again and again through-out the project life-cycle.
3.3.4 Catalysis
Catalysis [DW99] is a development method that addresses three different aspects ofthe system, each organised at an abstraction level: the outside (domain/businesslevel), the boundary (component specification), and the inside (component internaldesign level). Figure 3.9 shows these aspects.
The outside or domain/business level is used to identify the users and their needs,modelling the environment where the system has to operate. The boundary or com-ponent specification level describes the behaviour of the system that is visible fromthe outside, that is the behaviour of the components that interact with the environ-ment. The inside or component internal design level describes how system behaviouris realised in terms of the interactions between components, and it also describes theinternal architecture of the components.
Catalysis is based on three modelling concepts: type, collaboration and refinement.Types are used to specify the external behaviour of single objects. Collaborations areused to specify the behaviour of group of objects. Refinement allows the specificationof behaviour at different levels of detail. Frameworks describe recurring patterns ofthese three modelling concepts.
The development of a typical (large) system involves the phases of requirement captur-ing, system specification, architectural design and component internal design. Thesephases are performed in accordance with the abstraction levels. Catalysis does not
45

3.3. Development strategies
Domain/Business
ComponentSpecification
ComponentInternal Design
Identify problem: “outside”
Establish problem domain terminologyUnderstand business process, roles, collaborationsBuild as-is and to-be models
Specify system: “boundary”
Scope and define component responsibilityDefine component and/or system interfaceSpecify desired component operations
Implement the spec: “inside”
Define internal architectureDefine internal components and collaborationsDesign the insides of the system and/or component
Catalysis.pdf
DesignConcepts
Applicationdomain
Designnotation
represents
DesignMethods
manipulate
characterizes
ModelsTools
use
supported by
describe
are used to create
validate, …
Figure 3.9: The levels of description according to Catalysis
prescribe a unique path through its phases of the development, but it proposes mul-tiple paths through the method, each better suited for projects with certain charac-teristics.
3.3.5 The Model Driven Architecture
Recently the Object Management Group introduced a new initiative , called the ModelDriven Architecture [OMG01b, OMG01a]. The Model Driven Architecture (MDA) isan approach to the full life cycle of systems comprised of software, hardware, humans,and business practices. MDA aims to separate all business or application concernsfrom the underlying platform technology [OMG03a, KWB03].
The MDA provides a systematic framework to understand, design, operate, and evolveall aspects of such systems, using engineering methods and tools [Bro04]. MDA isbased on modelling separately technology-independent and technology-specific aspectsof a system, by describing them in separate models. The most important aspect of theMDA approach is the explicit identification of Platform-Independent Models (PIMs)and the flexibility to implement them on different platforms via Platform-SpecificModels (PSMs). A platform can be any technology that supports the execution ofthese models, either directly or after translation into code [D’S01].
From the perspective of system development, a significant quality of the MDA ap-proach is the independence of system specifications (i.e., sets of models) from potentialtarget implementation platforms. A system specification exists independently of anyimplementation platform and has formal or semi-formal transformation rules ontomany possible target platforms [FPSFAA03]. The MDA approach to system (appli-cation) specification, portability and interoperability is based on the use of formal
46

Chapter 3. System’s representation and architecting
CIM
PSM1 PSM2 PSM3
Code Code Code
PIM
modelTransformation
modelTransformation
Transformation Transformation
MDA.pdf
Figure 3.10: The Model Driven Architecture framework
and semi-formal models.
Three different types of model are considered in MDA (see Figure 3.10): computa-tion-independent models, platform-independent models and platform-specific mod-els [OMG03a]. A computation-independent model (CIM) focuses on the system en-vironment and its requirements. However, there is no concern for the details of thestructure of and processing by the system. A platform-independent model (PIM)focuses on the system operation, but hides the details necessary for a particular plat-form. A platform-specific model (PSM) combines the platform-independent modelwith the details of the use of a specific platform by a system. Model transformation isbasically seen as a mapping of elements of one model onto elements of another model.
An essential feature of the MDA framework is to make transformations between mod-els automatic [MB02]. This means that a transformation tool takes a PIM and trans-forms it into a PSM. A second transformation tool transforms the PSM to code. Inthis context, a transformation is seen as the automatic generation of a target modelfrom a source model, according to a transformation definition. A transformation defi-nition is a set of transformation rules that together describe how a model in the sourcelanguage can be transformed into a model in the target language. A transformationrule is a description of how one or more constructs in the source language can betransformed into one or more constructs in the target language.
The MDA defines that first a PIM should be created and then transformed into oneor more PSMs. These transformations should be automatically executed by toolsif a proper transformation definition has been defined. Designers may benefit be-cause they can focus their efforts on the generation of well-defined, precise, andconsistent PIMs that contain enough information about the system, which can be
47

3.3. Development strategies
automatically converted into PSMs for different platforms. Therefore, everythingthey specify in a PIM becomes completely portable. MDA is made up of a suite ofstandards that include Unified Modelling Language (UML) [OMG03b]; Meta-ObjectFacility (MOF) [OMG02]; XML Meta-Data Interchange (XMI) [OMG03c]; and Com-mon Warehouse Meta-model (CWM) [OMG01c].
3.3.6 Conclusion
The strategies described in section 3.3 form a comprehensive list that demonstratesthe evolution of system development. We observed that the importance given toiterations over development phases increased as designers try to find ways to managethe impact of the (inevitable) changes in requirements during development.
Apart from the importance of iterations, there is also separation of concerns, whichallows one to concentrate on different sets of aspects of the systems at different timesalong the design trajectory. There is no consent among the various strategies on thesets of concerns. There is consent, however, on the notion that this separation allowsthe design of systems in a more incremental manner. This notion induces a way ofthinking about the system based on distinct and well-defined objectives.
The most current strategies strongly emphasise the role of models. Earlier on, the roleof a conceptual model was to guide the implementation and possibly support somefuture re-engineering activities on the developed system. Nowadays, the role of theseconceptual models has been extended as they are seen as a mechanism to expresssystem functionality; they can be interchanged and shared to facilitate interoperabil-ity among heterogeneous systems. Furthermore, model-driven approaches promotethe independence of the application model (system specification) from the implemen-tation technology and platform. Therefore, an application model can be developedindependently from any implementation model and may have a formal mapping tomany alternative platform infrastructures.
We adhere to these last two principles, namely the separation of concerns and themodel-driven approach, to devise our methodology in support of GSI system design.
48

Chapter 4
Geo-services design methodology(GSDM)
The significant problems we face cannot be solvedat the same level of thinking we were at when we created them.
Albert Einstein
This chapter introduces the Geo-Services Design Methodology (GSDM) which is tai-lored to the development of geo-information systems. The chapter starts by describingthe main phases of GSDM. The chapter also describes the role played by design mod-els in GSDM and motivates the need for a metamodel. Next, the chapter introducesa metamodel for GSI services, and finally the chapter discusses the main architecturalelements of the methodology.
The structure of the chapter is organised as follows: section 4.1 gives a general in-troduction of GSDM; section 4.2 illustrates the scope of GSDM in the context of thedevelopment process and discusses the main phases of GSDM; section 4.3 explains therole played by models in GSDM; section 4.4 introduces a metamodel for GSI servicemodels; and finally section 4.5 discusses the main architectural elements used in thedescription of GSI components.
4.1 Introducing GSDM
The trajectory followed during the construction of a system should start with a con-ceptual modelling phase, during which models that describe static and behaviouralaspects of the system are produced [Gra01]. Traditionally, in the design of geo-infor-mation systems these two aspects have not received the same amount of attention,
49

4.2. GSDM overview and scope
since little or no focus has been put on the behavioural aspects of these systems.
Conceptual design should be supported by a development methodology. A develop-ment methodology provides a set of structured procedures and rules that guide adesigner in the process of designing a system (see Section 1.4).
In this research we have developed a methodology to guide the design of distributedgeo-information services, which we call the Geo-Service Design Methodology or GSDMfor short. GSDM is organised around the concepts for behaviour modelling supportedby ISDL [QFPS02]. Although the methodology can be used to design distributedsystems in general, we concentrate on its application for defining both structural andbehavioural aspects of distributed geo-information systems.
GSDM focuses on the definition of the services provided by GSI systems (see Sec-tion 2.7). A service is a collection of functions or operations organised in a way thatthey exhibit a behaviour of value to a user. The functions used within a service areprovided by independent entities, and these functions are available at different systemnodes. Such services have to be formally defined before they can be properly imple-mented. The internal structure of the service (i.e., the service realisation) describeshow different components interact to provide the desired service.
4.2 GSDM overview and scope
When we choose to regard some part of the ‘real world’ as a system, then we areimmediately defining that part as one entity, and at the same time, indirectly wedraw a line (the system boundary) between what should, and what should not, beconsidered part of the system.
The boundary of the system does not simply separate what is part of the systemand what is not. It also represents the point of contact between the system and theoutside world. It is at the system boundary that interactions take place.
It is not possible, however, to ignore everything that exists outside the system bound-ary. On the contrary, we must identify the things that are not themselves part ofthe system, but affect and/or shape the system’s operation. For example, if wedefine a national mapping organisation as a system, then we have to recognise thatsuch organisation has close relationship with entities like image suppliers or budgetproviders like, e.g., the government.
The determination of the system boundary does not only depend on the identificationof the system itself, but also in the determination of that system’s purpose. Forexample, if we choose to consider a prison as a system to, say, ‘rehabilitate criminals’,then the system includes entities such as therapist and social workers, whereas if wedecide to consider a prison as a system just to ‘punish criminals’, then such entitieswould not be included within the system.
50

Chapter 4. Geo-services design methodology (GSDM)
Similarly, If one chooses to regard a map, as it is conventionally done, as a systemfor, say ‘representation of information’ then one has to deal precisely with a singlescale and strict use of location and orientation (e.g., a topographic map), whereasif one decides to consider a map as a system for ’communication’, say, a map of anunderground system, then one can use multiple or distorted scales, relative locationsand other types of spatial distortions that facilitate communication with the mapusers.
These considerations lead us to the identification of four main areas of interest withrespect to a system: the objective or purpose (the contribution of the system to thesurrounding environment in terms of what it does), the boundary (the interfaces of thesystem), the outside (the environment in which the system operates), and the inside(the system’s internal structure or structures and composition). Our methodologyhas been organised according to these levels of concern.
To address these concerns levels, GSDM defines two main system perspectives thatenable the representation of a high-level architecture of a GSI system:
• the external perspective model captures information about the purpose and en-vironment of the system in service specifications. This includes the servicedefinition, the boundary level interactions through which the service can beaccessed and the entities that participate in these interactions;
• the internal perspective model captures information about the system’s archi-tecture. This includes decomposed service specifications that in turn compriseidentification of architectural elements and definition of behaviours. This be-haviour definitions describe the interactions, between architectural elements,that are required to realise the system’s services.
The external perspective aims at identifying and explicitly delimiting the scope of thesystem under development and helps determining the objectives of the developmentprocess. It is at this stage that the boundary between the system and its environmentis defined. The external perspective involves: the organisation and understandingof requirements; the specification of system functionality or system responsibilities(services), which represent the contribution of the system to the environment; andthe definition of interactions that prescribe how external entities may interact withthe system in order to access its services.
The internal perspective aims at describing the internal system structure in termsof compositions of simpler or more elementary architectural elements. Arrangementsof these architectural elements form the so called decomposed service specifications.A decomposed service specification identifies a group of architectural elements anddescribes how these elements interact to perform a system function (service). Manydifferent alternative compositions are allowed that implement the same functionalityin a different way.
The internal perspective actually covers two related concerns, namely the set of ar-
51
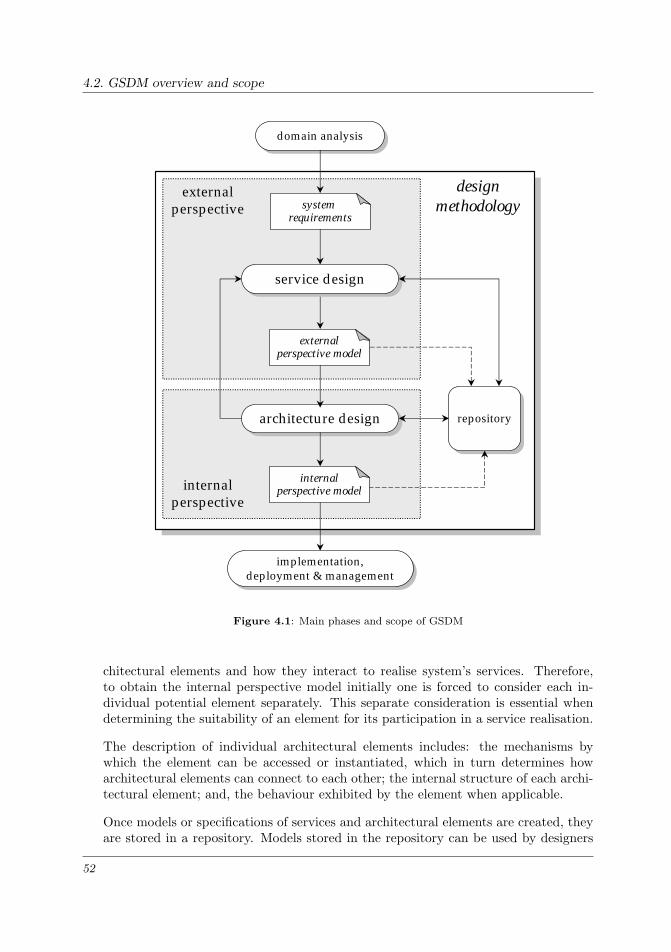
4.2. GSDM overview and scope
externalperspective model
Our-design-methodology.pdf
domain analysisdomain analysis
architecture designarchitecture design
implementation,deployment & management
implementation,deployment & management
repositoryrepository
system requirements
internalperspective model
designmethodology
service designservice design
externalperspective model
domain analysisdomain analysis
architecture designarchitecture design
implementation,deployment & management
implementation,deployment & management
repositoryrepository
system requirements
internalperspective model
designmethodology
service designservice design
externalperspective
internalperspective
Figure 4.1: Main phases and scope of GSDM
chitectural elements and how they interact to realise system’s services. Therefore,to obtain the internal perspective model initially one is forced to consider each in-dividual potential element separately. This separate consideration is essential whendetermining the suitability of an element for its participation in a service realisation.
The description of individual architectural elements includes: the mechanisms bywhich the element can be accessed or instantiated, which in turn determines howarchitectural elements can connect to each other; the internal structure of each archi-tectural element; and, the behaviour exhibited by the element when applicable.
Once models or specifications of services and architectural elements are created, theyare stored in a repository. Models stored in the repository can be used by designers
52

Chapter 4. Geo-services design methodology (GSDM)
in other arrangements to realise other more complex services. Figure 4.1 shows therelationships between the perspectives of GSDM and the phases of development, andhow they influence each other.
4.3 The role of models
Our approach to geo-information services design focuses on the use of conceptualmodels as an intermediate step in the development process, which sit in betweenrequirements and the actual implementation (see figure 4.1). The purpose of thisstep is to obtain a conceptual description also called abstract specification of everysystem part and every system function (internal or external). This is done solely toenable and facilitate reuse and to enhance flexibility.
The main benefit of these models is to serve as the basis for the specification of com-plex services. If a model properly describes an architectural element, that is, with therelevant information at the correct level of detail to enable one to determine what itdoes and how to access the function it provides, then this architectural element canbe easily reused. By reuse of architectural elements, we mean the inclusion of pre-viously designed element in multiple service definitions. We use constraint-orientedcomposition to combine multiple architectural elements (see section 5.4.2). This way
architecturalelements
models ofarchitectural
elements
service models
Models-and-services.pdf
generic
specific
Figure 4.2: Architectural elements, element models and service models
53

4.3. The role of models
modelrepository
GSP node (a)
GSP node (b)
GSP node (…)
metamodel
modelexchange
Metamodel-role.pdf
Figure 4.3: Role of the metamodel in the GSI architecture
it is possible to assemble large processing chains by correctly combining models of(generic) architectural elements to form more specialised specifications (service mod-els) with the intention of provide more specific or particular services (see Figure 4.2).
Since the models of architectural elements prescribe the behaviour exhibited by in-dividual elements, a service model can be used to choreograph the realisation of theservice specified in the model. Additionally, once a service model is available it canitself be reused, as a generic element, in another definition as a part of a yet morespecialised service. Reuse and flexibility is ultimately achieved by developing, sharingand integrating well-defined models of all composing elements of the system.
For this approach to work, models need not only to be interchanged between partici-pants, but they also have to be understood by all parties involved. This can only beachieved if the models are based on the same metamodel. Such metamodel shouldtherefore provide a rigourous abstract syntax for defining models. Figure 4.3 showsthe role of the metamodel in the GSI architecture. The metamodel enables the im-plementation of a repository where compliant models of GSI services can be stored.Hence, the repository becomes the central component in a GSI system. The repos-itory supports the exchange of models between different service providers, therebyfacilitating the use of these models in combinations to form more complex servicemodels that address specialised sets of requirements.
A metamodel defines the set of design concepts and their relationships, which onecan use to produce models of some system according to a specific objective. A designconcept, also called modelling concept, is a building block that can be used in theconstruction of a model. A design concept represents one or more related properties
54

Chapter 4. Geo-services design methodology (GSDM)
Systemmetamodel (y) metamodel (x)
System models System models
System-metamodels.pdf
Figure 4.4: Metamodels and system models
of a system or system part that are considered relevant in the design of a system. Thecomplete collection of design concepts should allow one to model all relevant systemproperties. Relationships between design concepts define the possible ways in whicha model can be constructed from of these concepts.
Figure 4.4 illustrates the relations between system models and metamodels. In Fig-ure 4.4 design concepts defined in a metamodel are represented by different geometri-cal shapes, while a relationship between concepts is represented by a line connectingtwo concepts.
Which metamodel should be used depends on the modelling needs of every particularproject. For the purpose of designing GSI systems, we require design concepts suitablefor specifying the system’s functionality and its environment, the system’s internalstructure in terms of its composing parts or subsystems and their relationships, andthe contribution of each part to the system’s overall functionality. This translatesinto the following modelling needs:
• to represent the system, its logical or physical parts and any external thing thatinteracts with the system, which could be a person, another system, etc., assingle entities capable of exhibiting behaviour;
• to represent the locations where interactions between different entities occur;
• to represent behaviour according to different related abstraction levels;
• to be able to discriminate between the behaviour and the entity that carries the
55

4.4. Metamodel for GSI
behaviour, such that an entity could potentially exhibit multiple behaviours.
• to be able to structure behaviour into units behaviour and their relationships;
• to represent anything that is used or produced in a behaviour.
Additionally, the selection of an appropriate set of design concepts should adhere tothe following quality principles [Sin95]:
• consistency, which requires that concepts should be consistent in their repre-sentation of the aspects in the real world;
• orthogonality, which requires that distinct concepts should be used to representdifferent aspects;
• propriety, which requires that concepts should be proper to the modelling needs;
• generality, which requires that concepts should be of general purpose in a givendomain and the complete set of concepts be sufficient to cover the needs of thedomain.
4.4 Metamodel for GSI
The types of service provided by a GSI system spread along the whole geo-informationvalue chain. This value chain starts with identification of information sources that areused in different geo-processing tasks to create value added geo-information products.These products are subsequently used in various types of analysis with the purpose ofderiving new information that is not directly obtainable from the sources. In most ofthe cases diverse combinations of tasks and information sources are required to solvespecific problems and help user communities to make sense of the geographical worldthat surrounds them.
The structural organisation of this work is consequently formed by arrangementsof independent functions and data sources organised in such way that large geo-processing tasks can be accomplished. Any of these arrangements defines a specificbehaviour. This behaviour is accomplished through the creation, manipulation ortransformation of some items or artefacts, and must be carried out by entities withinthe system.
According to these criteria and to the modelling needs mentioned in the previoussection, we need a metamodel to be able to build repositories where our models canbe properly, structurally and consistently stored and retrieved. We introduce a meta-model to be used in the creation of repositories to store our models (see Figure 4.5).This metamodel is a specialisation of the ISDL metamodel [Qua03]. The metamodelis organised in a number of classes, where each class addresses a group of relateddesign concepts.
56

Chapter 4. Geo-services design methodology (GSDM)
Behaviour
MonolithicBehaviourStructuredBehaviour
Action InteractionContribution
Interaction
FunctionalEntity Service1..*
1..*
1..*
ActivityUnitCausalityCondition
1..*causalityrelation
carrier
Attribute
TimeAttributeLocationAttribute
Item
Information Attribute
0..*2..*
1..*
0..1
InteractionAlternative
1..*
Metamodel.pdfFigure 4.5: A metamodel for GSI services
The abstract class behaviour defines the behaviour concept, which models some type ofsystem behaviour. A behaviour is a (partial) description of the system that describesa distinct part of that system functionality.
An instantiation of a behaviour results in a service of value to a user. Multiple be-haviours may provide the same service. Behaviours are associated with functionalentities. Functional entities are capable of exhibiting the characteristics defined ina behaviour. A functional entity represents a logical or physical part of the systemcapable of executing behaviour in the real world. A functional entity executes be-haviour by itself or in cooperation with other functional entities. A behaviour canbe carried by more than one functional entity. A functional entity can exhibit morethan one behaviour.
Two sorts of behaviour types are distinguished: structured behaviour, which are com-positions of one or more related smaller behaviour; and monolithic behaviour, whichare not further decomposed into smaller behaviours.
A monolithic behaviour consists of a group of related activity units that can take the
57

4.4. Metamodel for GSI
form of actions or interaction contributions. An activity unit represents an atomicpiece of work at a given abstraction level.
An action represents an activity that is defined entirely within a single behaviour.An interaction represents an activity in which two or more declared behaviours par-ticipate (cooperate). An interaction contribution represents the participation of abehaviour in some interaction.
At higher levels in the behaviour hierarchy, the participation of one or more monolithicbehaviours in some interaction may be represented by the participation of the struc-tured behaviour in which these monolithic behaviours are defined as sub-behaviours.This may be applied recursively to structured behaviours that are defined as sub-behaviours, such that the participation of a structured behaviour in some interactionmay represent the participation of monolithic and structured sub-behaviours.
Alternative groups of sub-behaviours may participate in an interaction. Therefore,an interaction is defined as a set of one or more interaction alternatives, where eachalternative represents an optional group of participating sub-behaviours.
A causality condition is associated with each activity unit. This association is calleda causality relation. A causality condition defines the type of relation between two ormore activity units. This relation is used to specify how the occurrence or executionof activity units depends on the occurrence or non-occurrence of other activity units.
The completion of an activity produces some result that can be manipulated by otheractivities. An activity unit can have attributes. These attributes represent the resultthat is established by an activity unit.
Three attributes are defined:
• the information attribute, which represents the product (typically some infor-mation) that has been produced by the activity unit;
• the time attribute, which represents the time moment at which the product isavailable;
• the location attribute, which represents the location where the product is avail-able.
Items are a special class of the information attribute. Items represent the informationthat is directly manipulated by an activity unit. The type of manipulation that canbe performed on an item by an activity unit are create, use, change or destroy theitem.
The metamodel described here only allows for the definition of an abstract syntaxfor the design concepts used in the creation of GSI models. The semantics of theconcepts is provided by the ISDL modelling language (see Chapters 5). For furtherdetail on the ISDL metamodel, we refer to [Qua03].
58

Chapter 4. Geo-services design methodology (GSDM)
4.5 Architectural elements
To deal with the issues concerning the internal structure of a service, we have toidentify and characterise the architectural elements within a distributed geo-informa-tion system. First of all we ignore details of implementation and communication ofthese elements in order to focus on the functions they provide and the constraintsthat apply to their interactions with one another.
Architectural elements basically encompass the different components of the system,however, here we refer to a component in a slightly different manner than the way thisterm is used by the software engineering community. The term component in softwareengineering disciplines refers to a self-contained unit of independent deployment, withwell-defined interfaces that has no persistent state [Szy02]. Usually, a componentprovides a particular function or group of related functions. A component is a reusableunit of composition that can be used to form applications with other components inthe same or other computers in a distributed network. In this thesis, whenever werefer to this type of component we explicitly say software component.
We refer to a component not only to represent units of software, but in general toany architectural element of the system that provides a function required in a largerprocessing chain. Such processing chain is formally described in a service realisation.Components in this context can thus be used, for example, to refer to some abstractrepresentations of data. or to an action or set of actions performed by a human, andthat may yield a necessary result or provide a required function. In order to createabstract representations of components of geo-information systems, GSDM makes useof architectural elements. GSDM ignores the details of component implementation tofocus on the roles of components, the constraints upon their interaction with othercomponents, and their use of data.
processdimension
controldimension
datadimension service realisation
{arrangement of elements}
information service{product}
design problem{set of requirements}
Figure 4.6: Modelling dimensions
59

4.5. Architectural elements
We distinguish three different types of architectural elements within a GSI system(see Figure 4.6):
• data elements;• processing elements; and• connecting elements.
The data elements represent the information that is used, manipulated and/or gener-ated by the system. The process elements represent the geo-processing capabilities ofthe GSI system, which can perform transformations on data elements. The connectingelements are like mediators, they represent the relationships between other elements.The connecting elements represent the conditions and constraints that define howthe different elements may interact and how they are organised with respect to eachother in a service specification. A similar approach to system elements can be foundin [PW92, Fie00].
To illustrate the differences between these elements we can use metaphorical example.Consider the games of soccer and handball. The two games are similar in structure,they use a ball as data element and players as processing elements. The differencebetween them lies in how these elements are allowed to interact with each other, whichare the context and rules of the games (the connecting elements). These connectingelements are defined by game designers based on what they want to achieve with theinteractions.
Separation of concerns is the principle behind this modelling dimensions. For example,by separating the concerns on the nature and state of data from the data processingconcerns, we simplify the processing elements allowing them to change and evolveindependently. In the same way portability of the data is improved by avoidingthat the data remain encapsulated and hidden within processing elements. However,the drawback is that we lose the advantages of information hiding and therefore amechanism is required for processing elements to identify and understand the datatypes.
The origin of the reference system determined by the modelling dimensions in Fig-ure 4.6 represents the starting point of a development process. The process is activatedby a design problem. Design problems represent the various inputs (requests) to theGSI system that have to be converted into services. A service has to be specifiedbefore it can be realised. The path taken through the cube shown in Figure 4.6corresponds to the functional specification of a service that satisfies a specific de-sign problem using an appropriate arrangement of components. The execution of apredefined service specification generates the desired service.
60

Chapter 5
Design concepts
If you don’t ask why this? often enough,somebody will ask why you?
Tom Hirshfield
In this chapter we introduce the design concepts and their combination rules neces-sary to represent architectures of distributed systems. An architecture consists of astructure of parts and their functionality (functions). This chapter introduces theconcepts of entity and behaviour, and the other concepts that form our basic designmodel for distributed systems. An entity is an abstract concept that can be used torepresent systems and system parts, while a behaviour is an abstract concept thatcan be used to represent the functions of these systems and system parts.
This chapter is structured as follows: section 5.1 introduces the design concepts nec-essary to represent structures of interconnected entities, section 5.2 introduces thedesign concepts necessary to represent behaviours, section 5.3 introduces decomposi-tion as a tool to produce designs at lower levels abstraction, and finally, section 5.4discusses the structuring of behaviours as compositions of sub-behaviours.
5.1 Entity structures
A system can be modelled as a structure of interacting entities, each one of themrepresenting a logical or physical part of the system. This section presents the conceptsnecessary to represent such structures.
61

5.1. Entity structures
5.1.1 Entities
An entity is an abstract concept that models the identity of some system in the real-world (either existing or being built). At a certain abstraction level a single entitymay be used to describe, for example, a complete system. At another abstractionlevel, though, the same system may be represented as an arrangement of interactingentities. The entity concept is useful in systems development, because the conceptmakes it possible to structure systems as compositions of entities, which facilitatesinsight. This system structure can be made of either physical or logical parts or both.
A system has certain properties, which can be represented as characteristics of itscorresponding entity. For example, a car can be modelled as an entity that is madeof a particular material, with a particular form, and with a particular colour. Thematerial, the form, and the colour are the properties of the car that in this case canbe associated with its corresponding entity.
Geo-information systems have specific characteristics as well. The most importantcharacteristic of a geo-information system, in the context of this research, is itsfunctionality. This characteristic can be represented in terms of behaviour (see sec-tion 5.2). This means that to properly model the way a geo-information systemoperates, a behaviour has to be associated to the entity that represents the system.To distinguish between different entities, each entity has to be uniquely identifiedusing an entity identifier (entity names).
5.1.2 Interaction points
Users interact with systems through mechanisms that are specially designed to sup-port these interactions. An interaction point models the mechanisms through whichan entity can interact with its environment. Interaction points serve to delimit anentity and hence to separate this entity from its environment. An entity without in-teraction points is meaningless for its environment. Two or more entities must sharean interaction point, to enable their interaction.
Users of geo-information systems interact with these systems through, for example,user interfaces. We considered an interface as the shared mechanism that support
GI-SystemUser
Int-A
(a) (b)
Entity-and-InteractionPoint.pdf
User
GI-system
Int-BInt-A
Int-B
GI-system
GI-system
Int-BInt-A request register
data server
geo-processingserver
portrayalserver
service dispatcher
Int-BInt-A
Entity-decomposition.pdf
createmap
ιτλ
: MapUnit [ sheet-no = “62A” ; scale = “1:5000” ; type = “landuse”]: GenerationDate = 22-JAN-03: Address = www.gsinode.itc.nl/maps
Action-representation.pdf
Figure 5.1: Entities with shared interaction points
62

Chapter 5. Design concepts
the interaction between the system and a user. This mechanism can be modelledas the interaction point that is common to the geo-information system and to theuser. Analogously to entities, interaction points must also be uniquely identified, forinstance, by means of an interaction point identifier.
Figure 5.1a shows the graphical representation of entities and interaction points. Anentity is represented by a non-overlapping polygon with cut-off corners. An interac-tion point is represented by an oval that overlaps with the entities that share thisinteraction point. The identifiers of entities and interaction points can be placed ei-ther inside their graphical representations or in text boxes linked to the correspondingentities or interaction points. Figure 5.1b depicts an alternative representation.
5.2 Behaviour concepts
A system is designed to provide a specific functionality, which makes it useful to itsenvironment. An entity, as explained in the preceding section, allows to define whatthe system is. In order to specify what the system does, we associate the entity witha behaviour. A behaviour represents the functionality of the system modelled by itsassociated entity.
The functionality of a system consists of all the activities performed by the systemand the relationships between these activities. We use behaviour models to representthe functionality of a system. A behaviour model is created by combining designconcepts that represent activities performed by the system and their relationships. Inthis section we introduce the concepts required to specify behaviour.
5.2.1 Actions
An action is an abstract concept that represents a real world activity. The occurrenceof an action represents that its corresponding activity has been successfully performed.Consequently, an action models the result (product) of an activity.
Examples of activities are filling up a request form, extracting data from a data repos-itory, deriving the slope of the terrain, measuring the area of a parcel or identifyinga set of land use classes from a satellite image. These examples show the variety ofactivities in geo-information production in terms of required expertise or machinery,complexity, time duration, etc.
Each action is uniquely identified and is the most abstract representation of an ac-tivity: it models only the result of an activity. As a consequence, an action cannotbe considered as a composition of other actions at the abstraction level at which it isdefined. This is called the atomicity property of actions.
To illustrate this, consider the activity of producing a landuse map. Obviously, this
63

5.2. Behaviour concepts
activity takes time and involves, e.g., visiting the area of interest to collect someground truth, acquiring satellite images, classifying the images, etc. However, if onlymap production is relevant, then we can model this activity with a single action,produce landuse map, which models this result. The action occurs at the moment themap is finished, which is a single, indivisible point of time. An action is therefore anindivisible unit of activity (atomic) at a certain abstraction level.
The atomicity property of does not imply that actions cannot be decomposed intosub-actions or actions at a lower abstraction level. Action decomposition is neededwhenever the activity represented by an action has to be defined in more detail (seesection 5.3.2). For example, it is perfectly allowed to decompose the action producelanduse map into the actions collect ground truth, classify images, etc. In the latercase, however, one is considering the original action at a lower abstraction level.
The atomicity of actions has the following consequences:
• An action either occurs completely, or does not occur at all. In contrast toactivities, actions cannot occur partly;
• If an activity delivers multiple results at multiple points of time and the differ-ence between these results is relevant, then the activity has to be modelled asmultiple actions.
Activities can yield different forms of results. These results could be a concrete prod-uct (a map, a land title, a book), information (personal data, a message) or a service(a geo-referenced image). Furthermore, the result of an activity, once produced, be-comes available at a particular place and at a specific point in time.
An action has attributes that can be used to represent the most relevant characteristicsof the activity it represents, namely the result produced by the activity, the timemoment when the result becomes available, and the physical or logical location wherethe result can be found. Therefore an action has three attributes:
• the information attribute models the result of an activity;
• the location attribute models the physical or logical location at which the resultof the activity is made available;
• the time attribute models the point in time at which the established resultbecomes available.
All the mentioned characteristics of activities are modelled in terms of values of thedifferent action attributes. Action attributes represent the characteristics of an ac-tivity that are of interest to other activities once this activity has been successfullycompleted. An action models what result is established in an activity, when andwhere, but not how this result is established. An action abstracts from all mecha-nisms of the activity that make it possible for the activity to reach its result.
64

Chapter 5. Design concepts
GI-SystemUser
Int-A
(a) (b)
Entity-and-InteractionPoint.pdf
User
GI-system
Int-BInt-A
Int-B
GI-system
GI-system
Int-BInt-A request register
data server
geo-processingserver
portrayalserver
service dispatcher
Int-BInt-A
Entity-decomposition.pdf
createmap
ιτλ
: MapUnit [ sheet-no = “62A” ; scale = “1:5000” ; type = “landuse”]: GenerationDate = 22-JAN-03: Address = www.gsinode.itc.nl/maps
Action-representation.pdf
Figure 5.2: Action representation
We graphically represent an action by a circle. The action name is placed eitherinside the circle, or in a text-box connected to the circle through a line. Actionattributes are represented in a text-box connected to the action circle. The values ofthe information, time, and location attributes are represented by the symbols ι, τ,and λ, respectively.
Figure 5.2 depicts action create map, which represents the activity of creating a map.In Figure 5.2, action create map models the generation of the landuse map, No. “62A”on January 22, 2003, which has been produced at www.gsinode.itc.nl/maps.
Actions are design concepts for defining models that represent the behaviours ofsystems. Since a model prescribes the implementation of a system, the mechanismthat implements an action must be reliable, such that behaviours can be properlyimplemented. Thus, if the activities specified in a model are to be carried out by,for example, people or computers, the model should be structured in terms of suchentities. The actual physical assignment may occur at the end.
5.2.2 Interactions
Some activities in real-life are performed by two or more systems in cooperation.In that case such activities take place at a shared interaction point of the entitiesthat represent the systems. An interaction is an abstract concept introduced tomodel an activity performed by multiple systems in cooperation. The involvement orparticipation of an entity in an interaction is called an interaction contribution.
Examples of interactions are transferring a product (e.g., from a seller to a buyer),logging in to a system (usually a computer system and a user), or posting a letter,which requires the co-operation between the person posting the letter and the mailbox (or, more abstractly, the postal service).
Interactions have the same attributes as actions. However, when two or more systemsinteract, each of them has interaction constraints that define under which conditionsthey can participate in the interaction and which are the results that can be es-tablished by the activity. Therefore, two or more systems can only interact if theintersection of their constraints on the possible values that can be established in theinteraction attributes does not result in an empty set of values. This means that afterapplying all constraints at least one valid information value must be established. This
65

5.2. Behaviour concepts
applies to all three attributes information, time and location. Three basic forms ofvalue establishment are distinguished:
• value checking, which represents that one behaviour establishes a specific valuex, while other behaviour requires a specific value y. In order to allow theinteraction to happen the following condition must hold: x = y;
• value passing, which represents that one behaviour allows a specific value x tobe established, while other behaviour accepts any value from a set of values Y .In order to allow the interaction to happen the following condition must hold:x ∈ Y ;
• value generation, which represents that one behaviour allows any value from aset of values X to be established, while other behaviour allows any value froma set of values Y to be established. In order to allow the interaction to happenthe following condition must hold: X ∩ Y ≠ ∅.
Similarly to actions, interactions are also uniquely identified by means of interactionidentifiers. The graphical representation of an interaction stresses the partitioning ofresponsibilities between the participating entities. An interaction is represented usingconnected circle segments, one circle segment for each participating entities, Eachcircle segment represents the interaction contribution of the participating entity.
Figure 5.3 shows an interaction that models a login operation as an activity per-formed by two systems: the computer system and a human user. The interactioncontribution of an entity is identified by the interaction identifier and (optionally) theentity identifier, separated by a dot. Interaction identifiers are underlined in order todistinguish them from action identifiers.
In Figure 5.3, interaction contribution login.user (system user) defines that the userwould login at any time with the password “pjf286” to the address ftp.gsi.sys. interac-tion contribution login.user (computer system) defines that the system accepts usersto login to the address ftp.gsi.sys, with one of two passwords “pjf286” or “vmd404”,somewhere between 07:30 and 20:30 hours every day (no constraint on the day hasbeen defined).
This example illustrates value checking, since both for the user and for the computersystem the same address value must be established for the interaction to happen. Theexample illustrates value passing, since the user logs in with the password “pjf286”
login.user
ιτλ
: Password = “pjf404”: Time | any time: Address = ftp.gsi.sys
login.system
ιτλ
: Password = “pjf286”,“vmd404”: Time | 07:30 < τ < 22:30: Address = ftp.gsi.sys
Interaction-representation.pdf
Figure 5.3: Interaction representation
66

Chapter 5. Design concepts
and the computer system allows two possible passwords for a login operation, one ofwhich matches the users password. This example also illustrates value generation,as the user may login at any time and the system allows login operation during thespecific time period 07:30..22:30. Therefore the interaction is only allowed to occur atan allowed time moment.
5.2.3 Causality relations
In general, the occurrence of an action depends on the satisfaction of a condition.This condition consists of some statement on the occurrence or non-occurrence ofother actions. For example, the development of a set of aerial photographs dependson these photographs being taken before. Once the condition ‘the aerial photos havebeen taken’ is satisfied, the development photographs action becomes possible, andmay happen at any time. Some actions do not depend on other actions, and areallowed to occur at any time. These actions are called initial actions.
Causality relations are used to model the relationships between actions (interactions).A causality relation defines how the occurrence of an action, the so-called target action,depends on the occurrences or non-occurrences of other actions. A causality relationmodels the conditions under which an action becomes enabled. A causality relationconsists of:
• a causality condition, which defines how the occurrence of the result actiondepends on the occurrences or non-occurrences of other actions;
• action attribute constraints, which define how the values established in the in-formation, time and location attributes of an action influence the occurrenceof a related action (a target action) and possibly the values of its information,time and location attributes; and
• a probability attribute, which defines the likelihood of occurrence of the tar-get action in case the causality condition and action attribute constraints aresatisfied.
Causality conditions
Consider two actions a and b, which happen at time moments τa and τb respectively.There exist three possibilities in terms of the temporal ordering of the occurrence ofthese two actions: a occurs before b (τa<τb), a occurs at the same time as b (τa=τb)or a occurs after b (τa>τb). These possibilities do not overlap, therefore we candefine some basic causality conditions for action a as follows (a causality condition isrepresented by the symbol ‘γ’):
• γ = b, defines that the occurrence of action b is a condition for the occurrenceof action a, such that the occurrence of b must precede the occurrence of a.
67

5.2. Behaviour concepts
Since action a is only allowed to occur after action b occurs, we say that theoccurrence of action b enables the occurrence of action a (τa>τb). This conditionis called a enabling condition and action b is called a enabling action.
• γ =¬b, defines that the non-occurrence of action b is a condition for the occur-rence of action a, until a has occurred. Action a is allowed to occur when b doesnot occur before a and b does not occur simultaneously with a. Since action acan only occur if action b has not occur, we say that the occurrence of action bdisables the occurrence of action a (τa<τb). This condition is called a disablingcondition and action b is called a disabling action.
• γ ==b, defines that the occurrence of action b is a condition for the occurrenceof action a, such that the occurrence of b must happen simultaneously with theoccurrence of a (τa=τb). This condition is called a synchronisation conditionand actions a and b are called synchronised actions, since their occurrence haveto be synchronised.
• γ = √, defines that action a does not depend on the occurrence of other actions,such that action a may occur independently from other actions at any time.This condition is called start condition since no condition exists, and action ais called initial action.
Simple behaviour definitions
A behaviour definition consists of one or more actions and their relations. Since weuse causality relations to model the relations between actions, we define a behaviourin terms of a set of causality relations, one for each action of the behaviour.
The textual representation of causality relation has the following form: γ → a. Wherea is the identifier of the target action, and γ is the causality condition of action a.
The textual notation of a behaviour definition consists of a behaviour identifier, fol-lowed by the symbol ‘=’, and a set of causality relations delimited by the symbols‘{’ and ‘}’. For example, the notation B = {√ → d , √ → c} represents a behaviourdefinition named B, which contains two independent actions c and d . Some examplesof simple behaviours are explained below, and are depicted in Figure 5.4:
• a follows b: a enabling condition is used to define the sequential ordering ofa and b such that a occurs after b. The textual notation for this behaviour isB = {√ → b, b → a}. The enabling condition relation is graphically representedby a solid arrow from b to a (see Figure 5.4i);
• either a or b occur: mutual disabling conditions are use to define a choicebetween a and b, such that only one of the actions occurs. This choice definesthat either the occurrence of b disables the occurrence of a, or vice versa. Thetextual notation for this behaviour is B = {¬a → b, ¬b → a}. The disablingcondition ¬b of action a is graphically represented by a solid arrow from b to a,with a vertical bar in between (see Figure 5.4ii);
68

Chapter 5. Design concepts
b a b a
b a b b
ground_truht
image_classificationgeoreferencing
feature_retrieval
a
c
b(i) a follows b
b a b a
b a b b
ground_truht
image_classificationgeoreferencing
feature_retrieval
a
c
b(ii) either a or b occur
b a b a
b a b b
ground_truht
image_classificationgeoreferencing
feature_retrieval
a
c
b
(iii) a and b are synchronised
b a b a
b a b b
ground_truht
image_classificationgeoreferencing
feature_retrieval
a
c
b
(iv) independence of a and b
Figure 5.4: Some simple action relations
• a and b are synchronised: a synchronisation condition between a and b definesthat both actions occur at the same time, or both actions do not occur at all.Synchronisation is a reciprocal condition for actions a and b, since a can onlysynchronise with b when b can synchronise with a. The textual notation forthis behaviour is B = {=b → a, =a → b}. The synchronisation condition =bof action a is graphically represented by a solid double lined from b to a (seeFigure 5.4iii);
• independence of a and b: defines two initial actions a and b, with no depen-dency defined between them, therefore they may occur independently of eachother at any time. In this case both actions have an associated start condition.The textual notation for this behaviour is B = {√ → a, √ → b}. The start con-dition is graphically represented by a solid arrow pointing to the action (seeFigure 5.4iv).
5.2.4 Conjunction of causality conditions
Often one needs to represent that multiple basic conditions involving different actionsmust all be satisfied to enable the occurrence of other action. Conjunctive causalityconditions can be used to define the conjunction of two or more causality conditionsinvolving different actions. The and -operator ‘∧’ allows the representation of theconjunction of two causality conditions. The conjunction of multiple conditions canbe represented by the repeated application of the same and -operator.
The conjunction of two causality conditions γ1 and γ2 of result action a is definedas follows: γ1 ∧ γ2 → a. This definition indicates that γ1 and γ2 are both necessaryconditions for the occurrence of result action a, Therefore action a is only allowed tooccur when both conditions γ1 and γ2 are satisfied. The use of the and -operator isillustrated with the following examples:
• a ∧ d ∧ ¬b → c , specifies that action c is allowed to occur after actions a andd have occur and when action b has not occurred before c nor occurs simulta-neously with c ;
69

5.2. Behaviour concepts
b a b a
b a b b
collect_groundtruth
image_classificationgeoreferencing
feature_retrievalc
a
b
cd
τd : T τc : T
τc < τd - 2
Figure 5.5: Conjunction of causality conditions
• a ∧ ¬b ∧ =d → c , specifies that action c is allowed to occur simultaneously withd after action a has occurred and when action b has not occurred before c noroccurs simultaneously with c .
Figure 5.5 depicts an example of the conjunction of enabling conditions. In this fig-ure the symbol ‘�’ is used to graphically represent the conjunction operator. Actionimage classification, r for short, models the classification of a satellite image. The ac-tions ground truth, georeferencing and feature retrieval , c1 , c2 and c3 for short, modelactivities that produce inputs required by action r of generate its results. The con-junction models that the classification of an image can only be finished successfullyafter all three other actions have finished. The textual representation of the behaviourdepicted in Figure 5.5 is as follows:
B := { c1 ∧ c2 ∧ c3 → r ,√ → c1 ,√ → c2 ,√ → c3 }
5.2.5 Disjunction of causality conditions
When creating composite causality conditions, often one needs to represent that atleast one simple or conjunctive causality condition must be satisfied for a certainaction to happen. Disjunctive causality conditions define alternatives between twoor more basic or conjunctive causality conditions. The or-operator ‘∨’ allows therepresentation of the disjunction of disjunctive causality conditions.
The disjunction of two causality conditions γ1 and γ2 of result action a is definedas follows: γ1 ∨ γ2 → a. This definition establishes that γ1 and γ2 are alternativecausality conditions for the occurrence of the result action a, such that a is allowedto occur when at least one of these conditions is satisfied in an execution.
70

Chapter 5. Design concepts
b a b a
b a b b
collect_groundtruth
image_classificationgeoreferencing
feature_retrievalc
a
b
cd
τd : T τc : T
τc < τd - 2
Figure 5.6: Disjunction of causality conditions
Figure 5.6 depicts behaviour B = {a ∨ b → c , √ → a, √ → b}. In this Figure thesymbol ‘�’ is used to graphically represent the disjunction operator. In Figure 5.6there are two possibilities: the occurrence of c either depends on the occurrence of aand is then independent of b, or the occurrence of c depends on the occurrence of band is then independent of a.
This definition implicitly states that, according to what has been specified, an oc-currence of c as a consequence of both the occurrence of a and the occurrence ofb is not allowed. This is because the occurrence of c can not refer to the result ofboth occurrences a and b, when assuming that both a and b have occurred before c ,because c it is only related to either a or b.
The abstract causality condition represented in Figure 5.6 describes, for example,the allocation of a particular resource, e.g., a stereoplotter. In such case, actions aand b account for two independent requests to use the stereoplotter, and action crepresents the allocation of the stereoplotter to a particular task. In order to allocatethe stereoplotter only one of the requests is necessary, since the resource can only begranted to one of them. The possible occurrence of another request is irrelevant toperform any further action.
Table 5.1 depicts a set of commonly used action relations between actions a, b, c andd . These relations represent definitions of consistent and comprehensible behavioursthat consist of multiple actions composed as conjunctions and/or disjunctions of ac-tions relations. The Table also shows the corresponding graphical notation for eachbehaviour.
5.2.6 Action attribute constraints
In section 5.2.1 we introduce the concept of the information, time and location at-tributes, which allow one to model the establishment of information, time and loca-tion values in action occurrences. In this section we extend this concept with attributeconstraints, which allow to model the dependencies between information, time and lo-cation values established in different action occurrences. Action attribute constraintsare part of the definition of causality relations.
The possible values that can be established in an attribute of a result action a aredetermined by three types of constraints:
71

5.2. Behaviour concepts
• the attribute value domain, which defines the values that are allowed by resultaction a itself;
• attribute reference relations, which define how the attribute values of a dependon the attribute values of the actions in the causality condition of a;
• attribute causality conditions, which define how the occurrence of a depends onthe attribute values of the actions in the causality condition of a.
This extension can be performed analogously to the information, time and locationattributes of actions. Therefore we present attribute constraints in a uniform way forthe three attributes.
Table 5.1: Common action relations
Action relationGraphical
RepresentationTextual
Representation
choice
a
c
b
a
c
b
b
c
a
b
d
a
b a
c
{¬a → b, ¬b → a}. . . . . . . . . . . . . . . . . . . . . . . . . . . . . . . . . . . . . . . . . . . . . . . . . . . . . . . . . . . . . . . . . . . . . . .
and - join a
c
b
a
c
b
b
c
a
b
c
a
b a
{b ∧ c → a,√ → b,√ → c}
. . . . . . . . . . . . . . . . . . . . . . . . . . . . . . . . . . . . . . . . . . . . . . . . . . . . . . . . . . . . . . . . . . . . . . .
or - join
a
c
b
a
c
b
b
c
a
b
c
a
b a
{b ∨ c → a,√ → b,√ → c}
. . . . . . . . . . . . . . . . . . . . . . . . . . . . . . . . . . . . . . . . . . . . . . . . . . . . . . . . . . . . . . . . . . . . . . .
and - split
a
c
b
a
c
b
b
c
a
b
c
a
b a
{a → b, a → c}
. . . . . . . . . . . . . . . . . . . . . . . . . . . . . . . . . . . . . . . . . . . . . . . . . . . . . . . . . . . . . . . . . . . . . . .
or - split(multiple choice)
a
c
b
a
c
b
b
c
a
b
d
a
b a
c
{a ∧ ¬c ∧ ¬d → b,a ∧ ¬b ∧ ¬d → c ,a ∧ ¬b ∧ ¬c → d ,
√ → a}
72

Chapter 5. Design concepts
Attribute value domain
An action is used to represent a specific activity, for example, updating maps, mea-suring control points, classifying images, etc. This implies that an action only allowsa certain range of attribute values to be established. The restriction of the universeof attribute values to a specific range is called the attribute value domain of a resultaction.
a
c
b
a
c
b
b
c
a
b
d
a
b a
c
cd
τd : [08:00 .. 17:00] τc : [09:00 .. 12:00]
cd
ιd : [point,line,polygon] ιc : N
ιd = polygon
cd
τd : [08:00 .. 17:00] τc : [09:00 .. 12:00]
τc = τd + 60min
Figure 5.7: Attribute value domain
Figure 5.7 shows the definition of value domain for the information attribute of actionsc and d . The time attributes are represented in separate text-boxes in the graphicalnotation, and are represented between brackets to the right side of the result actionin the textual notation. In Figure 5.7 the symbols τc and τd represent the time val-ues established in actions c and d , respectively. The range of allowed time attributevalues of actions c and d is depicted between square brackets. The behaviour de-picted in Figure 5.7 defines that c and d are only allowed to occur during the timeranges [08:00..17:00] and [09:00..12:00], respectively. The textual representation of thisbehaviour in as follows:
B := { d → c (τc : [09:00..12:00]),√ → d (τd : [08:00..17:00]) }
Location and information values can be dealt with in the same way as the time valuespresented in Figure 5.7. For a given action, the set of values that are allowed as a resultof the action is called the information value domain, the set of locations where theaction occurrence make its results available is called the location value domain, andthe set of the time moments when the action can occur is called time value domain.The definition of attributes value domains is optional, therefore it is only used whenit is relevant at the considered abstraction level, otherwise it can be omitted.
Attribute reference relation
The attribute value established by some action occurrence may depend on the at-tribute values established in other action occurrences. In this case we say that anaction occurrence refers to the attribute values of other action occurrences.
An attribute value reference from one action occurrence to another implies a depen-dency (relation) between these action occurrences. Therefore, an action c may refer
73

5.2. Behaviour concepts
a
c
b
a
c
b
b
c
a
b
d
a
b a
c
cd
τd : [08:00 .. 17:00] τc : [09:00 .. 12:00]
cd
ιd : [point,line,polygon] ιc : N
ιd = polygon
cd
τd : [08:00 .. 17:00] τc : [09:00 .. 12:00]
τc = τd + 60min
Figure 5.8: Attribute reference relation
to the attribute value established by another action d, when c depends on d , and coccurs after d .
Figure 5.8 depicts a behaviour in which action c refers to the time value of action d .The time value of action c depends on the time value established in action d such thatthe value of τc must be greater than the value of τd (which is implicit in the enablingrelation) and less or equal to the value of τd plus 60 minutes. The relation betweenτc and τb is called a time reference relation. The conjunction of this time referencerelation with the time value domains of c and d allows action c to occur within anhour after the occurrence of action d . That means action c can only occur if action doccurs between 08:00 and 11:00. The occurrence of action d at any other time will notenable the occurrence of action c , because the reference relation τd < τc ≤ τd + 60min
can not be satisfied. The textual representation of the behaviour in Figure 5.8 is asfollows:
B := { d → c (τc : [09:00..12:00]) [τc ≤τd + 60min],√ → d (τd : [08:00..17:00]) }
The reference relation τc ≤ τd + 60min is graphically represented within a text-boxlinked to the enabling relation between the involved actions, in this case c and d .In the textual notation, information reference relations are represented as constraintsbetween square brackets to the right side of the corresponding attribute of the resultaction.
Implicit time references
Some causality relations prescribe a specific time relation. For example, an enablingrelation contains an implicit time constraint, which defines that the enabling actionsmust occur before the result action. That means, for instance in the relation b → athere is an implicit time constraint τa > τb prescribed by the enabling relation be-tween b and a. This time constraint is called an implicit time reference relation.Implicit time reference relations must be made explicit whenever we have to deter-mine the complete time attribute constraint of some result action to avoid impossiblebehaviours.
74

Chapter 5. Design concepts
b a b a
b a b b
collect_groundtruht
image_classificationgeoreferencing
feature_retrievala
c
b
cd
τd : T τc : T
τc < τd - 2
Figure 5.9: Implicit time reference (impossible action)
For example, Figure 5.9 defines the implicit time reference relation τc > τd prescribedby the enabling relation between actions b and a. The time reference relation τc < τd−2implies that τc must be smaller than τd. In other words, action c may occur before doccurs. This creates a conflict with the implicit time constraint τc > τd prescribed bythe enabling relation between d and c , which means that action c will never occur inthis behaviour definition.
The sane consideration have to be taken into account when defining time relationsbetween synchronised actions, in which the synchronisation relation defines an implicittime reference relation that imposes that all synchronised actions must occur at thesame time moment.
Attribute causality condition
A causality condition can be extended to define conditions on the attribute values ofthe enabling actions. These conditions are called attribute causality conditions, andmust be satisfied in order to allow the occurrence of the result action.
a
c
b
a
c
b
b
c
a
b
d
a
b a
c
cd
τd : [08:00 .. 17:00] τc : [09:00 .. 12:00]
cd
ιd : [point,line,polygon] ιc : N
ιd = polygon
cd
τd : [08:00 .. 17:00] τc : [09:00 .. 12:00]
τd < τc = τd + 60min
Figure 5.10: Attribute causality condition
Figure 5.10 depicts an example of an information causality condition. Action d repre-sents the extraction of a geometric feature from a data collection, which has geometrytype point, line or polygon. The information value domain of action d is defined as ιd:[point, line, polygon]. Action c represents the calculation of the area of features. Theinformation value domain of action d is defined with the symbol ‘N’ which representsany natural number. The information causality condition ιd = polygon represents that
75

5.3. Decomposition
action c is only allowed to occur when the information value established in d is equalto polygon. The textual representation of the behaviour in Figure 5.10 is as follows:
B := { d [ ιd = polygon ] → c (ιc : N),√ → d (ιd : [point,line,polygon]) }
Attribute causality conditions are represented within a text-box linked to the enablingrelation between the actions in the graphical notation. In the textual notation, infor-mation causality conditions are represented as constraints between square brackets tothe right side of the corresponding causality condition.
5.3 Decomposition
We have introduced so far a set of comprehensive design concepts suitable to specifysystems at a single level of abstraction. Decomposition is therefore needed to obtainmore detailed system descriptions, i.e., specifications at a lower level of abstraction.For this purpose we introduce entity decomposition and action decomposition.
5.3.1 Entity decomposition
An entity may consist of other, lower-level, entities or sub-entities. In order to addinternal structure, an entity can be decomposed into two or more sub-entities. Thesesub-entities should be interconnected via internal interaction points, to be able tocooperate. Furthermore, the interaction points of the original entity should be main-tained.
To be able to represent an entity in this way, we need to know the internal structureof the system that is represented by the original entity, in terms of the parts thatcompose the system. Figure 5.11 depicts a decomposition of the GI-system entity ofFigure 5.1, into five sub-entities, which are interconnected via five internal interactionpoints.
GI-SystemUser
Int-A
(a) (b)
Entity-and-InteractionPoint.pdf
User
GI-system
Int-BInt-A
Int-B
GI-system
GI-system
Int-BInt-A request register
data server
geo-processingserver
portrayalserver
service dispatcher
Int-BInt-A
Entity-decomposition.pdf
createmap
ιτλ
: MapUnit [ sheet-no = “62A” ; scale = “1:5000” ; type = “landuse”]: GenerationDate = 22-JAN-03: Address = www.gsinode.itc.nl/maps
Action-representation.pdf
Figure 5.11: Entity decomposition (refinement)
76

Chapter 5. Design concepts
The sub-entities of Figure 5.11 represent the sub-systems that define the internalstructure of the GI-system entity. Since the entity structure of the decompositionadds more detail to the initial representation, this new entity structure is called arefinement of the GI-system entity. To reflect this the GI-system entity is representedin Figure 5.11 as a dashed polygon containing the decomposition. The inverse ofdecomposition is composition, which allows one to abstract from (parts of) the internalstructure.
5.3.2 Action decomposition
In order to obtain a more detailed model of an activity, this activity has to be decom-posed into multiple sub-activities and their relations. The relevant characteristics ofthese sub-activities can be modelled again by distinct actions at a lower abstractionlevel. The concepts necessary to model relations between actions are explained indetail in section 5.2.3.
login.user
ιτλ
: Password = “pjf404”: Time | any time: Address = ftp.gsi.sys
login.system
ιτλ
: Password = “pjf286”,“vmd404”: Time | 07:30 < τ < 22:30: Address = ftp.gsi.sys
Interaction-representation.pdf
create_map
take_aerialphoto
measure_controlpoints
extract_features
plot_map
decomposition
composition
Action-decomposition.pdfFigure 5.12: Action decomposition
Figure 5.12 depicts the modelling of the activity of creating a map, at two differentabstraction levels. At the most abstract level, a single action create map models whatresult is established by the entire activity Create map. At a more detailed level, theactivity Create map is decomposed into four related sub-activities, which are modelledby four distinct actions.
The arrows connecting the actions depicted in Figure 5.12 represent enabling rela-tions between the actions. For example, action extract features may occur only afteraction measure controlpoints has occurred. Intuitively, these models are considered con-sistent if the result of action plot map, which is the final action of activity Create map,corresponds to (conforms to) the result of action create map.
An action may also model an integrated interaction, which abstracts from the indi-vidual interaction contributions of the involved entities. Replacing an action by aninteraction is considered a refinement of the action, since an interaction defines aspecific distribution of the responsibility for performing the interaction over multipleentities. We call the replacement of an action by an interaction action distribution.All constraints on the interaction are combined into the corresponding action. Fig-ure 5.13 depicts the distribution of action measure that is refined into the interaction
77

5.4. Behaviour StructuringParameters : [ shortest , cheapest , … ]
Inputs : start : pointend : point
Results : route : linebackg : image
client entity
service entity
Functional entity Functional entity
Int-A
Int-C
Int-B
client entity
auxiliary entity
service entity
Int-A
Int-B
BB–OptimumRoute
Interaction-attributes.pdf
Interaction-comparison.pdf
measure
measuremeasure
measure
refinement
Figure 5.13: Action distribution
measure consisting of three interaction contributions.
5.4 Behaviour Structuring
In this section we discuss the techniques to structure behaviours as compositionsof smaller or simpler sub-behaviours. A structured behaviour is in general easierto read and understand than an unstructured (monolithic) behaviour. Structuringlarge behaviours also enables the identification of sub-behaviours that could happenmultiple times, and in these cases one can create a structured behaviour that definesa behaviour in terms of a repetition of a (simpler) behaviour (see Figure 5.18). Animportant aspect of behaviour structuring is that it allows one to decompose a complexbehaviour into sub-behaviours that can be assigned to different entities.
We distinguish This chapter two techniques to structure behaviours: causality-ori-ented behaviour structuring and constraint-oriented behaviour structuring. Thesetechniques can be used separately and in combination.
5.4.1 Causality-oriented structuring
In the structuring of a complex behaviour, one may want to define this behaviour interms of sub-behaviours and the relations between these sub-behaviours. Relationsbetween (sub-)behaviours play the same role in behaviour definitions as relations be-tween actions, except at a different level of granularity: behaviours can be defined ascompositions of actions, as compositions of sub-behaviours, or a combination of both.The causality-oriented structuring technique allows the structuring of a complex be-haviour in terms of less complex sub-behaviours and their relationships. That meansin a causality-oriented structured behaviour, conditions in one behaviour definitionenable or disable actions in another behaviour.
A relation between two or more behaviours can be defined by introducing entry andexit points. Entry points and exit points are only syntactical constructs that enablethe decomposition of causality relations. This allows for an action and the condition
78

Chapter 5. Design concepts
a
c
b
c
b
a
Causality-Oriented-Decomposition.pdf
B
B1 B2
Figure 5.14: Causality-oriented structuring
for its occurrence to be defined in distinct sub-behaviours. Therefore, entry and exitpoints of monolithic behaviours are applied in the following way: an exit point insome behaviour defines a causality condition that can be used to enable actions inother behaviours; an entry point in some behaviour allows actions in this behaviour tobe enable by conditions defined in other behaviours. Consequently, entry points andexit points have to be coupled together to define a causality relation where actions ofa latter behaviour become dependent of actions of a former behaviour.
Figure 5.14 illustrates the decomposition of causality relation b ∧ c → a into the(pseudo)causality relations b ∧ c → exit and entry → a, which are defined in behavioursB1 and B2 , respectively. Entry points and exit points are graphically represented bythe symbol ‘B’, pointing inside and outside the corresponding behaviour, respectively.Causality relation b ∧ c → exit defines that the exit point of B1 represents causalitycondition b ∧ c . Causality relation entry → a defines an entry point in the behaviourB2 , representing a place-holder for the causality condition of a.
The textual representation of the behaviours depicted in Figure 5.14 are as follows:
B := { b ∧ c → a, √ → b, √ → c }
B1 := { b ∧ c → exit, √ → b, √ → c }
B2 := { entry → a }
By combining the exit point of B1 with the entry point of B2 , condition b ∧ c isassigned as the causality condition of action a. This corresponds to replacing entry inthe causality condition of a by causality condition b ∧ c . The combination of an exitand an entry point is graphically represented by linking the corresponding exit andentry symbols with a solid line. The causality-oriented structured causality relationrepresents the same condition as the unstructured causality relation.
79
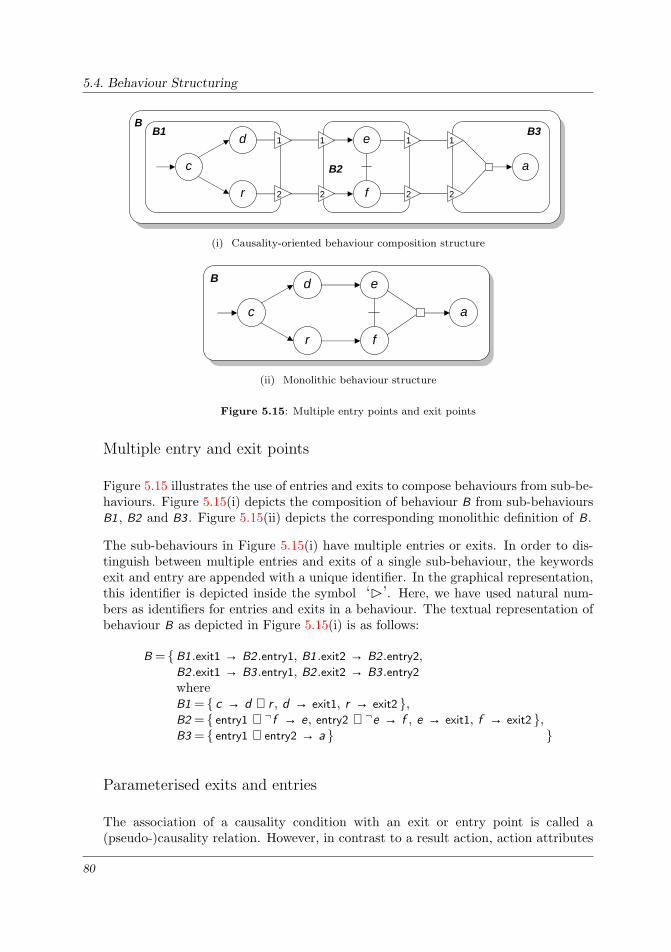
5.4. Behaviour Structuring
a
c
b
c
b
a
Causality-Oriented-Decomposition.pdf
B
B1 B2
c
d
r
a
e
f
c
d
r
a
e
f
1
2
1
2
1
2
1
2
B
BB1 B3
B2
Entry-and-Exit-Points.pdf (i) Causality-oriented behaviour composition structure
a
c
b
c
b
a
Causality-Oriented-Decomposition.pdf
B
B1 B2
c
d
r
a
e
f
c
d
r
a
e
f
1
2
1
2
1
2
1
2
B
BB1 B3
B2
Entry-and-Exit-Points.pdf
(ii) Monolithic behaviour structure
Figure 5.15: Multiple entry points and exit points
Multiple entry and exit points
Figure 5.15 illustrates the use of entries and exits to compose behaviours from sub-be-haviours. Figure 5.15(i) depicts the composition of behaviour B from sub-behavioursB1 , B2 and B3 . Figure 5.15(ii) depicts the corresponding monolithic definition of B.
The sub-behaviours in Figure 5.15(i) have multiple entries or exits. In order to dis-tinguish between multiple entries and exits of a single sub-behaviour, the keywordsexit and entry are appended with a unique identifier. In the graphical representation,this identifier is depicted inside the symbol ‘B’. Here, we have used natural num-bers as identifiers for entries and exits in a behaviour. The textual representation ofbehaviour B as depicted in Figure 5.15(i) is as follows:
B = {B1 .exit1 → B2 .entry1, B1 .exit2 → B2 .entry2,B2 .exit1 → B3 .entry1, B2 .exit2 → B3 .entry2
whereB1 = { c → d ∧ r , d → exit1, r → exit2 },B2 = { entry1 ∧ ¬f → e, entry2 ∧ ¬e → f , e → exit1, f → exit2 },B3 = { entry1 ∨ entry2 → a } }
Parameterised exits and entries
The association of a causality condition with an exit or entry point is called a(pseudo-)causality relation. However, in contrast to a result action, action attributes
80

Chapter 5. Design concepts
a
c
b
c
b
a
Causality-Oriented-Decomposition.pdf
B
B1 B2
c
d
r
a
e
f
c
d
r
a
e
f
1
2
1
2
1
2
1
2
B
BB1 B3
B2
Entry-and-Exit-Points.pdf
B1
B2
Parameterised-points.pdf
b
ιb : N
ιc : N
c
v1 = ιbv2 = ιc
v1, v2 : N
a
ιa : [0..9] | ιa = v1 + v2
Figure 5.16: Parameterised exits and entries
can not be associated with an exit or entry point, since exit points and entry pointsdo not model activities. Instead, exit and entry points are introduced as syntacticconstructs that allow one to define a result action and (parts of) its causality conditionin different sub-behaviours.
For the situations where actions in one behaviour need to refer to the result values ofactions in another behaviour, we allow that an entry or an exit can be parameterisedwith a list of information, time or location variables. These variables should hold allinformation passed from the exit point to the entry point. These variables containa selection of the information, time and location values of the enabling actions thatcan be referred to when the causality condition associated with this entry or exit issatisfied. A requirement on the combination of an exit and an entry is that both havethe same parameter list, i.e., the same number of variables, having the same type andspecified in the same order. Only the variable names of these parameter lists maydiffer.
Consider the example of Figure 5.16. Actions b and c establish information values,and action a has to refer to the information values of b and c . For this purpose,the exit point of B1 and the entry point of B2 are extended with a parameter listconsisting of two information variables v1 and v2. The resulting causality relationsobtained with this extension are defined as follows:
B = { √ → B1 .entry1, √ → B1 .entry2, B1 .exit → B2 .entry
whereB1 = { . . . , b (ιb : N) ∧ c (ιc : N) → exit (v1,v2 : N [v1 = ιb, v2 = ιc] },B2 = { entry (v1,v2 : N) → a (ιa : N) [ιa = v1 + v2] } }
The statement B1 .exit → B2 .entry is allowed, since the parameter lists of B1 .exit andB2 .entry match. This statement implicitly defines that the parameters of B2 .entry getthe same values as the corresponding parameters of B1 .exit.
81

5.4. Behaviour Structuring
Behaviour recursion
Some behaviours in real life consist of the repeated execution of a sub-behaviour. Forexample, the behaviour of a quality control process can be considered as the repetitionof the behaviour revise quality of product, in which an instance of this behaviour iscreated each time the product is rejected. Figure 5.17 depicts the behaviour of aproduct delivery chain, in which action c models the checking of a product, action rmodels the revising and improving of a rejected product, action p models the packingof the product and action s models the sending of the product.
c0
p0
r 0
s0
c
p
r
s
c1
p1
r 1
s1
c2
p2
r 2
s2
BD
D
Repetitive-Behaviours.pdf
Figure 5.17: Repetition of a sub-behaviour
The same repetitive behaviours can be modeled using the recursive instantiation ofa behaviour. Figure 5.17 shows the graphical representation of behaviour B, whichmodels the behaviour of a product delivery chain by the recursive instantiation ofsub-behaviour D, which models the quality check and delivery of a product.
c0
p0
r 0
s0
c
p
r
s
c1
p1
r 1
s1
c2
p2
r 2
s2
BD
D
Repetitive-Behaviours.pdf
Figure 5.18: Recursive instantiation of sub-behaviour D
The textual notation of the recursive instantiation of sub-behaviour D of behaviourB is as follows:
B = { √ → D.entry
whereD = { entry → c ,
c → p ∨ r ,p → s,r → D.entry } }
82
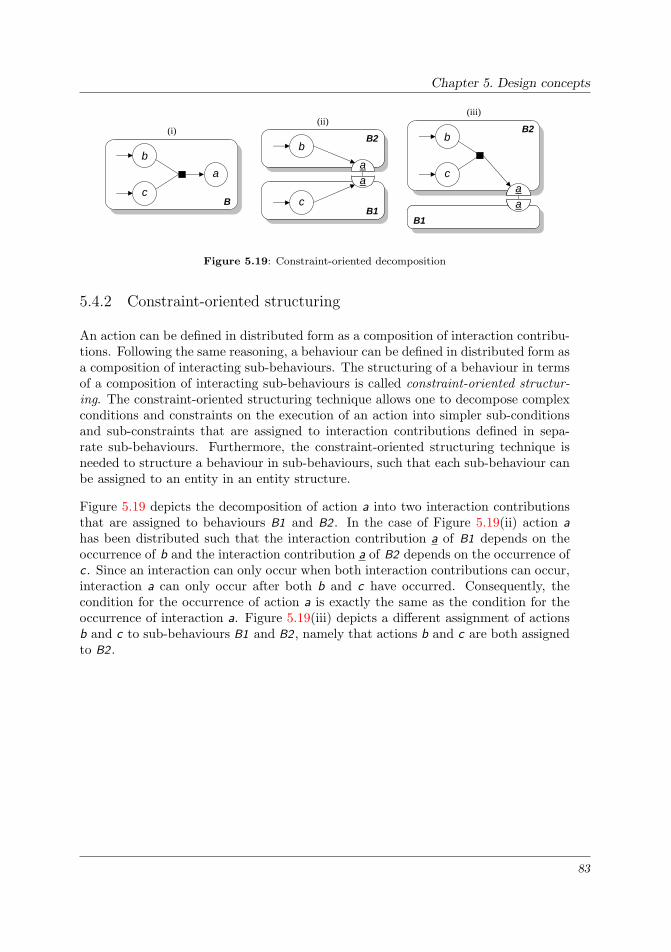
Chapter 5. Design concepts
c0
p0
r 0
s0
c
p
r
s
c1
p1
r 1
s1
c2
p2
r 2
s2
BD
D
Repetitive-Behaviours.pdf
a
c
Constraint-Oriented-Decomposition.pdf
BB1
b
B2
B1
B2
c
b
c
b
aa
(i)(ii)
(iii)
aa
aa
Figure 5.19: Constraint-oriented decomposition
5.4.2 Constraint-oriented structuring
An action can be defined in distributed form as a composition of interaction contribu-tions. Following the same reasoning, a behaviour can be defined in distributed form asa composition of interacting sub-behaviours. The structuring of a behaviour in termsof a composition of interacting sub-behaviours is called constraint-oriented structur-ing. The constraint-oriented structuring technique allows one to decompose complexconditions and constraints on the execution of an action into simpler sub-conditionsand sub-constraints that are assigned to interaction contributions defined in sepa-rate sub-behaviours. Furthermore, the constraint-oriented structuring technique isneeded to structure a behaviour in sub-behaviours, such that each sub-behaviour canbe assigned to an entity in an entity structure.
Figure 5.19 depicts the decomposition of action a into two interaction contributionsthat are assigned to behaviours B1 and B2 . In the case of Figure 5.19(ii) action ahas been distributed such that the interaction contribution a of B1 depends on theoccurrence of b and the interaction contribution a of B2 depends on the occurrence ofc . Since an interaction can only occur when both interaction contributions can occur,interaction a can only occur after both b and c have occurred. Consequently, thecondition for the occurrence of action a is exactly the same as the condition for theoccurrence of interaction a. Figure 5.19(iii) depicts a different assignment of actionsb and c to sub-behaviours B1 and B2 , namely that actions b and c are both assignedto B2 .
83

5.4. Behaviour Structuring
84

Chapter 6
The external perspective
A child on a farm sees a plane fly overhead and dreams of a faraway place.A traveller on the plane sees the farmhouse and dreams of home.
Carl Burns
This chapter introduces the so called ‘external perspective model’, which is used todefine a GSI system’s external behaviour by explicitly identifying the boundary levelinteractions in which the system and its environment participate.
The external perspective model is useful to provide a specific description of individualservices from the user’s point of view. It provides insight in the relations betweenthe system and its environment and it also serves as the basis for developing internalperspective models in subsequent design phases.
The structure of the chapter is organised as follows: section 6.1 explains basic aspectsof GSI systems and their working environments; section 6.2 describes the trajectoryto obtain a external perspective design; section 6.3 provides the necessary conceptsto create external perspective models; section 6.4 introduces some specific data typesthat are needed to handle geographic data; and section 6.5 describes the techniquesto create external perspective models according to our design trajectory and illustrateit with the simple example of a service definition.
6.1 The GSI system
Figure 6.1 shows a GSI system composed of a set of Geo-Service Providers (GSP).Each provider focuses on certain needs of one or more user communities. A user com-munity [OGC03b] is collection of people (a government agency or group of agencies, a
85

6.1. The GSI system
GI-system.pdf
sp-1GSP - Node
Geo-information market
sp-2GSP - Node
sp-NGSP - Node
GSI - system
… user communities …
DesignConcepts
Applicationdomain
Designnotation
represents
DesignMethods
manipulate
charracterises
ModelsTools
use
supported by
describe
are used to create
validate, …
Figure 6.1: The GSI as a target oriented system
profession, a group of researchers in the same discipline, corporate partners cooperat-ing in a project, etc.), who share a common digital geographic information languageand common spatial feature definitions, at least part of the time. This implies acommon view of the world as well as common abstractions, feature representations,and metadata.
Each provider has accordingly different responsibilities towards the community andtherefore its own set of requirements. Service providers may range from just dataproducers, collecting foundation data, to specialised information developers that ex-ploit data to generate tailored products to support different applications (planning,decision making, military operations, etc.) in the market.
GSI systems are therefore complex systems that encompasses multiple independententities. These entities benefit from each other’s functionality and together realise theservices of the system. Services are seen as the result of the combined effect of theactivities within the system on its surrounding environment. This means that one ormore of the system’s entities work in a coordinated manner to provide services.
To make sense of these systems, however, and for someone to properly and system-atically develop them, it is necessary to select a specific aspect of the system to beused as the basis for development. Since the overall functionality of GSI systemsvaries as explained above, we do not start capturing or gathering the overall systemrequirements, but we rather focus on the organisation and interpretation of gatheredrequirements (according to a provider) to form services. This is done by means ofexternal perspective models.
External perspective models (EP models) also called services models, represent sim-plified views of the system that are used to define a service that complies to a givenset of functional requirements. Each EP model describes only a subset of the overall
86

Chapter 6. The external perspective
functionality of the system, and therefore represents a partial system specification.
6.2 Design trajectory
During the service design phase of the GSDM methodology we concentrate on thesystem according to the point of view of the users. We use successive design stepsin a top-down design trajectory to develop external perspective (EP) models. Thedeveloped models are stored in the repository where they can be instantiated, usedas reference for developing detail specifications (internal perspective models) or usedas a building block in more complex service realisations .
We work out this development phase in two major development steps: the servicedefinition and the extended service definition (see Figure 6.2).
During the service definition development step we create a so called observable be-haviour of the system. This behaviour describes the system from the point of view ofthe user. This is done by creating an entity model that discriminates or makes a cleardistinction between the system and its environment. Such model defines the rolesof the service user entity(ies), the service provider entity, and the interconnectionstructured between the identified entities.
In certain cases the generation of a service requires the use of functions that are notthe concern of any GSI provider. Examples include, a.o., bank transactions and postal
service design
repository
externalperspective functional
requirements
externalperspective model
EP-Design-Trajectory.pdf
service definition
extended service definition
Figure 6.2: Design trajectory at the external perspective level
87

6.3. Design concepts
delivery. The extended service definition development step is used for such cases. Thepurpose of this step is to enhance the existing service definition in order to describethe existence of entities responsible for functions that are not native to the GSIsystem. These functions do not form part of the GSI core, and thus these functionsare considered foreign functionality. The entities that provide these functions arecalled auxiliary entities.
The extended service definition is therefore a refinement of the service definition inwhich the service provider entity is decomposed to show the existence of auxiliaryentities in a service realisation. In those cases where such foreign functions are notrequired then extended service definitions are not necessary.
Once the relevant entities have been identified, we proceed to fully specify the sharedboundary between these entities. This specification comprises the interactions inwhich the service user entity and the service provider entity participate, the relationsand ordering of these interactions, and the definitions of the items manipulated orexchanged in these interactions.
6.3 Design concepts
This section introduces a specialisation of some of the architectural concepts intro-duced in Chapter 5. These concepts are used in the representation of systems accord-ing to the external perspective level.
6.3.1 Functional entity
We use an entity as an abstract concept to represent (a part of) the system, or (a partof) the system’s surrounding environment capable of interacting with the system. Anentity does not exist in isolation, but rather it is embedded in an environment thatconsist of other entities. Therefore, an entity is important for what it can do for otherentities, for what functionality it can provide to its environment. The entity conceptabstracts from the characteristics of the system or system part that it represents.
Within a service definition we distinguish three different types of entities or entityroles: the service provider entity, the service user entity, and the auxiliary entity.
From the point of view of the environment the entity that provides certain function-ality is known as the service provider entity. The environment of the service providerentity consists of other entities. These environment entities are either client entitiesor auxiliary entities. An environment entity that is capable of interacting with thesystem and uses its functionality is called a service user entity. Client entities consistof people or other systems that use the functionality provided by the service entity.
For the particular cases where foreign functions may be required by the system in the
88

Chapter 6. The external perspective
service user entity
service provider entity
Entity-types.pdf
service user entity
auxiliary entity
GSI service entity(refined service provider entity)
auxiliary entity
bb-OptimumRoute
bb-Traveler
ι : ⟨ orig, dest = { city, street, number } ⟩I-init
I-route ι : ⟨ route, background ⟩
Signature-Explanation-2.pdf
Figure 6.3: Different types of functional entities
realisation of a service (say from other application domains), the service entity mayinteract with other environment entities. These entities are called auxiliary entities,they consist of other systems, e.g., a banking system, a speech recognition system,etc. Auxiliary entities in principle do no use the main functionality provided by theservice provider entity, but they rather support the service provider entity with theprovision of its functionality [Far02].
For any entity to use the functionality provided by another entity, both entities haveto interact with each other. Therefore entities are equipped with interaction pointsindicating the mechanism through which entities can interact. It is only through itsinteraction points that the functionality of an entity can be accessed. For two entitiesto interact they must form an interaction point relation.
Figure 6.3 depicts the different entity types and their interaction structure. Enti-ties are shown as non-overlapping rectangles with cut-off corners whereas interactionpoints are depicted with ovals that overlap with the entity and are connected by aline.
6.3.2 Interactions
During the creation of (extended) service definitions we describe how entities coop-erate to realise a service. This description represents collaboration between theseentities. The definition of collaboration between two entities, say a service user entityand the service provider entity, has the following implications:
1. The two entities are interconnected in a defined way so that they can exchangeinformation;
2. The two entities can affect each others functional behaviour in a defined waythrough the exchange of information;
89
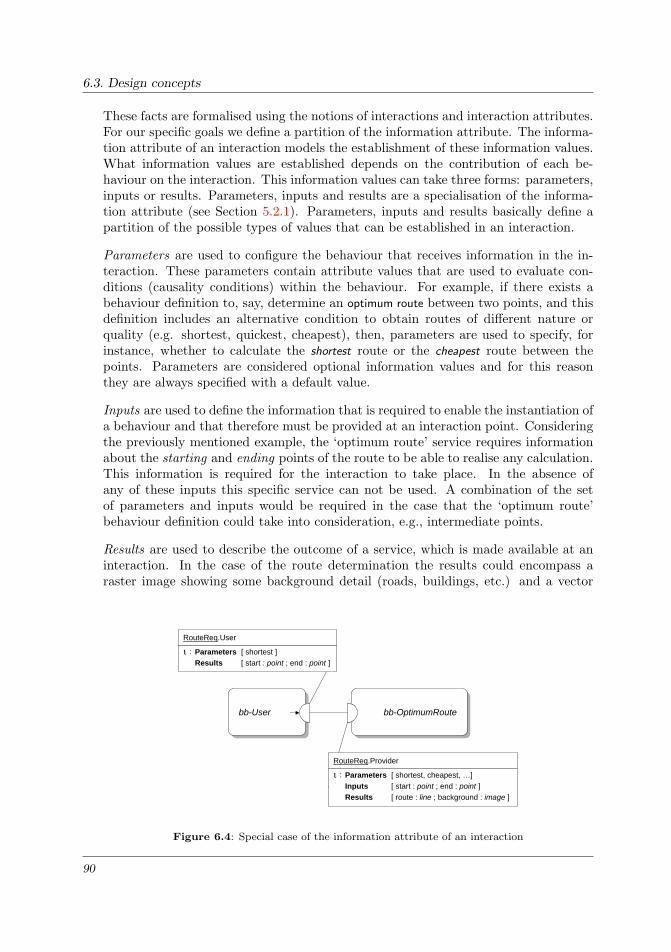
6.3. Design concepts
These facts are formalised using the notions of interactions and interaction attributes.For our specific goals we define a partition of the information attribute. The informa-tion attribute of an interaction models the establishment of these information values.What information values are established depends on the contribution of each be-haviour on the interaction. This information values can take three forms: parameters,inputs or results. Parameters, inputs and results are a specialisation of the informa-tion attribute (see Section 5.2.1). Parameters, inputs and results basically define apartition of the possible types of values that can be established in an interaction.
Parameters are used to configure the behaviour that receives information in the in-teraction. These parameters contain attribute values that are used to evaluate con-ditions (causality conditions) within the behaviour. For example, if there exists abehaviour definition to, say, determine an optimum route between two points, and thisdefinition includes an alternative condition to obtain routes of different nature orquality (e.g. shortest, quickest, cheapest), then, parameters are used to specify, forinstance, whether to calculate the shortest route or the cheapest route between thepoints. Parameters are considered optional information values and for this reasonthey are always specified with a default value.
Inputs are used to define the information that is required to enable the instantiation ofa behaviour and that therefore must be provided at an interaction point. Consideringthe previously mentioned example, the ‘optimum route’ service requires informationabout the starting and ending points of the route to be able to realise any calculation.This information is required for the interaction to take place. In the absence ofany of these inputs this specific service can not be used. A combination of the setof parameters and inputs would be required in the case that the ‘optimum route’behaviour definition could take into consideration, e.g., intermediate points.
Results are used to describe the outcome of a service, which is made available at aninteraction. In the case of the route determination the results could encompass araster image showing some background detail (roads, buildings, etc.) and a vector
bb-OptimumRoutebb-User
ι : Parameters [ shortest ]Results [ start : point ; end : point ]
RouteReq.User
ι : Parameters [ shortest, cheapest, …]Inputs [ start : point ; end : point ]Results [ route : line ; background : image ]
RouteReq.Provider
Service-Generality.pdf
Figure 6.4: Special case of the information attribute of an interaction
90
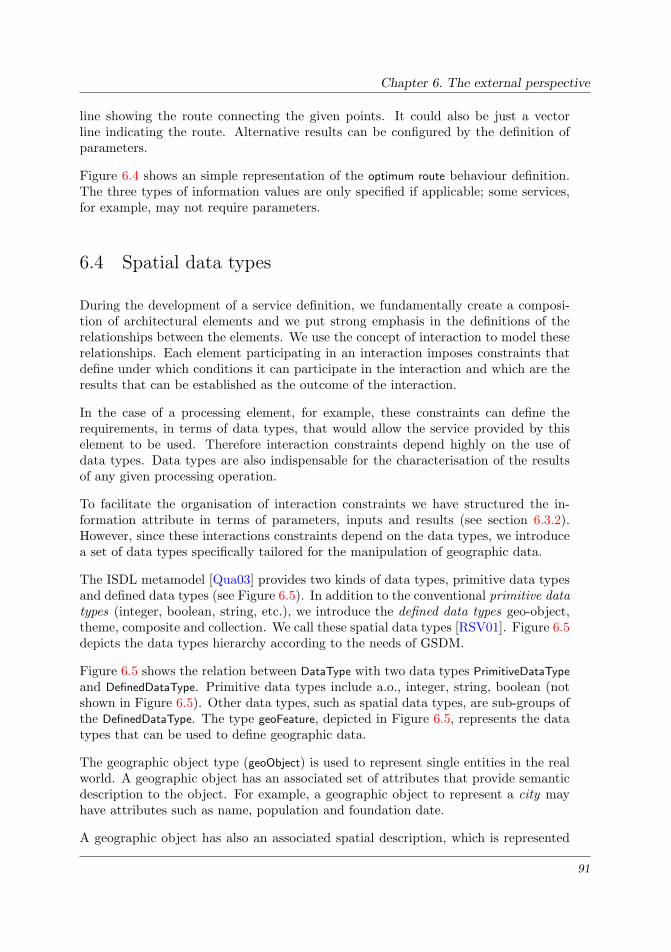
Chapter 6. The external perspective
line showing the route connecting the given points. It could also be just a vectorline indicating the route. Alternative results can be configured by the definition ofparameters.
Figure 6.4 shows an simple representation of the optimum route behaviour definition.The three types of information values are only specified if applicable; some services,for example, may not require parameters.
6.4 Spatial data types
During the development of a service definition, we fundamentally create a composi-tion of architectural elements and we put strong emphasis in the definitions of therelationships between the elements. We use the concept of interaction to model theserelationships. Each element participating in an interaction imposes constraints thatdefine under which conditions it can participate in the interaction and which are theresults that can be established as the outcome of the interaction.
In the case of a processing element, for example, these constraints can define therequirements, in terms of data types, that would allow the service provided by thiselement to be used. Therefore interaction constraints depend highly on the use ofdata types. Data types are also indispensable for the characterisation of the resultsof any given processing operation.
To facilitate the organisation of interaction constraints we have structured the in-formation attribute in terms of parameters, inputs and results (see section 6.3.2).However, since these interactions constraints depend on the data types, we introducea set of data types specifically tailored for the manipulation of geographic data.
The ISDL metamodel [Qua03] provides two kinds of data types, primitive data typesand defined data types (see Figure 6.5). In addition to the conventional primitive datatypes (integer, boolean, string, etc.), we introduce the defined data types geo-object,theme, composite and collection. We call these spatial data types [RSV01]. Figure 6.5depicts the data types hierarchy according to the needs of GSDM.
Figure 6.5 shows the relation between DataType with two data types PrimitiveDataType
and DefinedDataType. Primitive data types include a.o., integer, string, boolean (notshown in Figure 6.5). Other data types, such as spatial data types, are sub-groups ofthe DefinedDataType. The type geoFeature, depicted in Figure 6.5, represents the datatypes that can be used to define geographic data.
The geographic object type (geoObject) is used to represent single entities in the realworld. A geographic object has an associated set of attributes that provide semanticdescription to the object. For example, a geographic object to represent a city mayhave attributes such as name, population and foundation date.
A geographic object has also an associated spatial description, which is represented
91

6.4. Spatial data types
PrimitiveDataType DefinedDataType
Time Location geoFeature
Composite
geoObject
Collection
Theme
Metadata
1..*
1..*1..*
0..*
GSDM-Data-Types.pdf
gml:Geometry+property
+property
0..*
Raster
DataType DataTypeAttribute
- name : string- value : DataType
Figure 6.5: The data type concept
by its position, size, shape, orientation and reference system. The spatial descriptionof a geographic object is defined in its gml:Geometry property. The geometry of ageographic object is defined using the Geographic Markup Language (GML) baseschema [OGC03a] for the representation of feature geometries (see Appendix C foran overview of the GML feature schema).
When the spatial description of a geographic object is provided based on imagery(grided data), then the spatial description is defined in the raster property of theobject. This applies, for example, to land use or soil type objects.
The theme type (Theme) is used to represent a group of homogeneous geographicobjects that share the same structure, in terms of the set of attributes and geometry.A theme can be used to organise a group of cities, all of which exhibit the samegeometry and have consistent values for the associated attributes.
A domain is used to delimit the scope of the theme. A domain, which can be geometricor thematic, acts as a constraint and specifies which objects are allowed as membersof the theme. For example, objects of a theme have properties that distinguish themfrom objects that do not belong to this theme. For instance, one can define a city
theme with the thematic domain “more than 100000 inhabitants”, which means thatonly cities that are large enough to satisfy this constraint can become members ofthis city theme. The domain can also be geometric, such as a minimum size (area)or a predefined area of interest, for instance, within a radius of 100 km of point X.
92

Chapter 6. The external perspective
Airport : composite
Roads : theme
Runway : geoObject
Grasslands : theme
Park : geoObject
Highway : geoObject
ExclusionZone: geoobject
Object-Model.pdf
CityInfrastructure : collection
ControlTower : geoObject Hangar : geoObjectArmyBase : geoObject
Buildings : theme
Figure 6.6: The use of spatial data types
Themes can be grouped in collections, and for this purpose the collection type (Col-
lection) has been introduced. A collection can be used to represent a complete dataset, which contains a series themes, e.g., rivers, buildings, roads, etc.
The composite type (Composite) is used for the representation of groups of hetero-geneous geographic objects, that is, objects with different geometries and semanticdescriptions, but that have a specific relationships with each other. These relation-ships are application-oriented and are determined by the views of the users on thedata. Figure 6.6 a model created using the newly introduced spatial data types. TheFigure shows an airport as a complex object that is composed of other geographicobjects such as runways (roads), hangers (buildings), exclusion zones (grasslands),etc. This type of objects can be represented using the composite type. All objectswithin a composite keep their individual structure, but together they represent anspecific real world entity of interest in a particular application domain, such as, anairport.
Whenever necessary, more complex data types can be defined making use of theabstract class DefinedDataType. The definition of a new data type consists of the datatype name, and zero, one or more attributes (class Attribute), where each attributehas a name and a value of certain a type.
6.5 Service design
The design trajectory of the external perspective defines that the specification ofGSI services is done in two steps: the service definition and the extended service
93

6.5. Service design
specification. Here we describe the techniques to create these external perspectivemodels.
6.5.1 Service definition
As specified in the design trajectory, during the service definition phase the firsttask is to identify the various entities involved in the service, namely, user entity,service entity and auxiliary entities if applicable. This separates the system from itsenvironment and more importantly helps identifying the users of the service.
The TD-service is used as a running example to illustrate the different steps takenduring the service design phase. More detail on the characteristics of the TD-serviceis given as it becomes necessary.
Figure 6.7 shows a simple example of a service model. The figure depicts the taxdetermination service, TD-service for short. The TD-service deals with: registrationof tax payers for taxation, which takes place when a person acquires taxable land;the determination of taxes on exploited land; and the delivery of invoices to users onperiodical basis.
For the case of the TD-service, we have identified the so-called Taxation module asthe service provider entity and the so-called Tax-payer as the service user entity (seeFigure 6.7). The service user entity in this case is depicted in Figure 6.7 with adouble line to represent that multiple tax payers may benefit of the functionalityprovided by the service provider entity. Figure 6.7 also shows an interaction pointas the mechanism that establishes the interconnection structure between the serviceentity and the client entities.
After defining the user and service entities, the next task is to specify the interactions
Interaction-comparison.pdf
bb-User
bb-System
bb-User
bb-System
bb-AuxiliarySystem
GSI system
Taxation module(service entity)
repository
Tax payers (client entities)
Ep-model.pdf
Int-DInt-A
Int-B
Int-D’Int-A’
Int-CInt-B
Figure 6.7: TD-service definition
94

Chapter 6. The external perspective
in which these entities are involved and the relationships between these interactions.This is valid for the interactions between the service entity and the user entity(ies),as well as for the interactions between the service entity and the auxiliary entities.Therefore we explain this step in section 6.5.2 together with the description of theextended service definition step.
6.5.2 Extended service definition
There are two purposes for the extended service definition : 1. to identify all auxiliaryentities that support the service entity for the realisation of the service; and 2. todetermine all the interactions between the the service entity and the auxiliary entities.This step is only necessary if the participation of auxiliary entities is necessary in aservice realisation.
The difference between developing a GSI-service definition and its extended definitionis that in the former case we abstract from the interactions between the system andthe auxiliary entities and in the latter case we do not.
Consider, for example, the sequence of interactions as depicted in Figure 6.8right,in which the occurrence of interaction Int-A’ is followed by the occurrence of Int-B,which is followed by the occurrence of Int-C , which is followed by the occurrence ofInt-D’. This would correspond to the extended service definition. However, to specifythe service definition we would only include interactions Int-A and Int-D and therelationship between their occurrences in which the occurrence of Int-A is followed bythe occurrence of Int-D.
Therefore, the techniques used to define interactions according to both levels are thesame. The only difference resides on the type of entities being considered. Basedon this consideration, we discuss only how to identify and specify interaction pat-terns independent of whether the interactions are used on a service definition or on aextended service definition.Interaction-comparison.pdf
bb-User
bb-System
bb-User
bb-System
bb-AuxiliarySystem
GSI system
Taxation module(service entity)
repository
Tax payers (client entities)
Ep-model.pdf
Int-DInt-A
Int-B
Int-D’Int-A’
Int-CInt-B
Figure 6.8: Interactions at the service and extended service levels
95

6.5. Service design
In order to specify the interactions of a service, we have to associate a behaviourblock to each identified entity. By the end of the extended service definition phase, allparticipant entities should have a behaviour definition associated to them. However,at this level of development, these behaviour specifications only represent externalbehaviour, which fundamentally describe all border level interactions of the serviceentity, and the relationships between those interactions. The relationships betweeninteractions basically capture the order in which interactions can take place and theirinformation dependencies.
A extended service definition describes both the interactions between the service entityand its client entities; and the interactions between the service entity and any auxiliaryentities, together with their ordering. This description takes into account the externalfunctions that may be used by the service entity in order to provide its own service.Consequently, the service entity and its auxiliary entities are seen as separate entities.
6.5.3 Interaction signatures
Interaction signatures describe patterns of interaction contributions between two ormore behaviour blocks. They also facilitate the visualisation of the events in aninteraction relation. Interaction signatures are depicted as a shorthand notation thatrepresent interaction relations.
An interaction signature models the relation(s) between two or more behaviour blocksby making explicit the information passed or exchanged in the interaction, but ignoresthe conditions and constraints that govern the interaction. That is they describe howtwo or more behaviours are ‘glued together’ in a specific way, and what informationis interchanged.
To explain the use of signatures we use an example definition. Figure 6.9 shows theinteraction relation between two behaviour blocks bb-OptimumRoute and bb-Traveller.Four interactions have been defined I-init, I-rej, I-acpt and I-route. The informationattribute (ι) for the i-init and the i-route interactions has been specified as well as thespecific constraints.
However what we are interested at this moment is not in how one behaviour blockwould constraint the other, but what information would be supply as input to realisethe service, and what the outcome of the service should be. For this purpose asimplified definition would suffice (see Figure 6.10). With this information one can,later on, model a service that would be adequate for the given case, or use an exitingservice model(s) that is compatible with the case under consideration.
Figure 6.10 shows the signature for the preceding example. This definition containsthe information exchanged or passed in the identified interactions i-init and i-route, andthe interaction types. The interaction i-init, for instance, has been portrayed as anacknowledge negotiation. Interaction types are explained later in this section. Inter-action signatures, which are modelled at the behaviour domain, consists of two basic
96

Chapter 6. The external perspective
bb-OptimumRoute
I-init.OptimumRoute
[ EUcity, EUstreet ]city : EUcity;orig, dest : { str : EUstreet, number : };
Inputs
Parameters ⟨ routetype { shortest, quickest, cheapest } ⟩orig ≠ dest; orig ≠ ∅; dest ≠ ∅; #city {1..2 } ⟩
⟨ι :
bb-Traveler
I-init.Traveler
orig = { city, street, number };dest = { city, street, number } ⟩
ι : ⟨
I-route.OptimumRoute
Results ⟨ route : line; background : image ⟩
ι :
I-route.Traveler
Signature-Explanation-1.pdf
I-rej I-acpt
Figure 6.9: Interactions between two behaviour blocks
service user entity
Entity-types.pdf
service user entity
auxiliary entity
GSI service entity(refined service provider entity)
auxiliary entity
service provider entity
bb-OptimumRoute
bb-Traveler
ι : ⟨ orig, dest = { city, street, number } ⟩I-init
I-route ι : ⟨ route, background ⟩
Signature-Explanation-2.pdf
Figure 6.10: Interaction signature
97
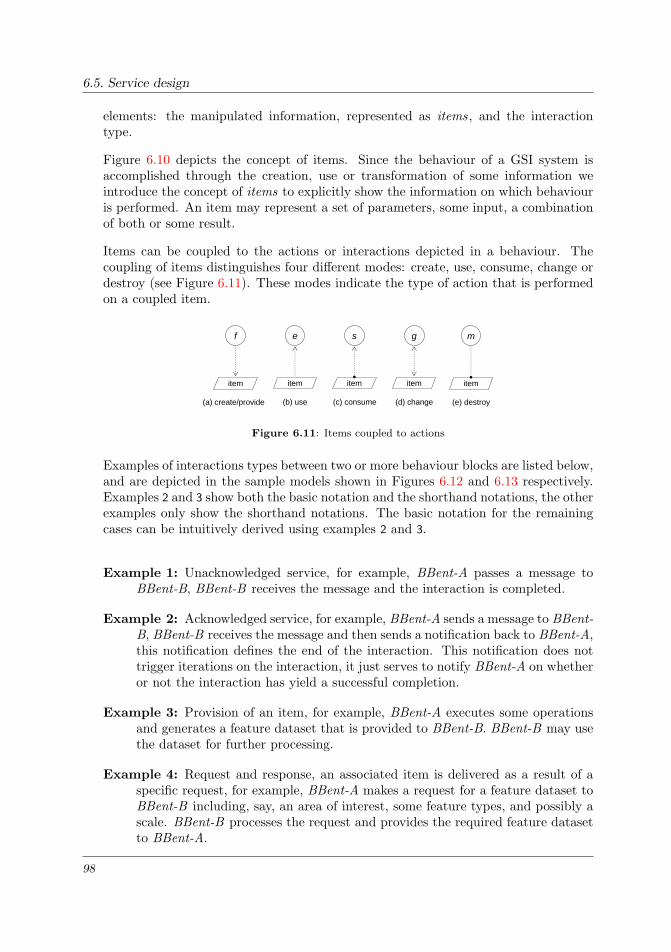
6.5. Service design
elements: the manipulated information, represented as items, and the interactiontype.
Figure 6.10 depicts the concept of items. Since the behaviour of a GSI system isaccomplished through the creation, use or transformation of some information weintroduce the concept of items to explicitly show the information on which behaviouris performed. An item may represent a set of parameters, some input, a combinationof both or some result.
Items can be coupled to the actions or interactions depicted in a behaviour. Thecoupling of items distinguishes four different modes: create, use, consume, change ordestroy (see Figure 6.11). These modes indicate the type of action that is performedon a coupled item.
Item-Modes.pdf
item
(a) create/provide
item
(b) use
item
(c) consume
item
(d) change
f e s g
item
(e) destroy
m
Figure 6.11: Items coupled to actions
Examples of interactions types between two or more behaviour blocks are listed below,and are depicted in the sample models shown in Figures 6.12 and 6.13 respectively.Examples 2 and 3 show both the basic notation and the shorthand notations, the otherexamples only show the shorthand notations. The basic notation for the remainingcases can be intuitively derived using examples 2 and 3.
Example 1: Unacknowledged service, for example, BBent-A passes a message toBBent-B, BBent-B receives the message and the interaction is completed.
Example 2: Acknowledged service, for example, BBent-A sends a message to BBent-B, BBent-B receives the message and then sends a notification back to BBent-A,this notification defines the end of the interaction. This notification does nottrigger iterations on the interaction, it just serves to notify BBent-A on whetheror not the interaction has yield a successful completion.
Example 3: Provision of an item, for example, BBent-A executes some operationsand generates a feature dataset that is provided to BBent-B. BBent-B may usethe dataset for further processing.
Example 4: Request and response, an associated item is delivered as a result of aspecific request, for example, BBent-A makes a request for a feature dataset toBBent-B including, say, an area of interest, some feature types, and possibly ascale. BBent-B processes the request and provides the required feature datasetto BBent-A.
98

Chapter 6. The external perspective
Example 1:
Example 2:
Example 3:
bb–Cbb–A bb–Cbb–A
bb–Cbb–A
(a) (b)
(a) atomic interactions (b) shorthand notation
bb–Cbb–Abb–Cbb–A
int.bb-C ι : [dataset]
int.bb-A ι : [dataset]
. . . . . . . . . . . . . . . .. . . . . . . . . . . . . . . . . . . . . . . . . . . . . . . .. . . . . . . . . . . . . . . . . . . . . . . . . .
. . . . . . . . . . . . . . . .. . . . . . . . . . . . . . . . . . . . . . . . . . . . . . . .. . . . . . . . . . . . . . . . . . . . . . . . . .
(a) (b)
Interaction-types1.pdf
[dataset]
Example 4:
bb–Cbb–A
. . . . . . . . . . . . . . . .. . . . . . . . . . . . . . . . . . . . . . . . . . . . . . . .. . . . . . . . . . . . . . . . . . . . . . . . . .
item
Figure 6.12: Examples of interaction types [1]
Example 5: Cooperative provision of a service, for example, BBent-A sends a mes-sage to BBent-C in coordination with BBent-B, which provides an item, say, adataset that is required by BBent-C for processing.
Example 6: Negotiation, for example, BBent-A and BBent-B send messages to eachother back and forth until they agree upon their corespondent constraints, atthat moment the interaction is completed, e.g., a login operation. The negotia-tion may also involved items although that is not shown in the figure.
Example 7: Processing requests of an associated item, for example, BBent-A pro-vides BBent-B with a feature dataset, BBent-B performs some processing onthe provided dataset and then gives the resulting dataset back to BBent-A.
Although most of the examples show two behaviour blocks, any number of behavioursmay participate in a single interaction. Additionally, the behaviours depicted in anyof the previous example list may be of a complex nature, and could be refined if
99

6.5. Service design
bb-C
bb-C
bb-A
bb-A
Interaction-types2.pdf
Example 5:
Example 6:
Example 7:
bb–Cbb–A
item
bb–D
item
item
. . . . . . . . . . . . . . . .. . . . . . . . . . . . . . . . . . . . . . . . . . . . . . . .. . . . . . . . . . . . . . . . . . . . . . . . . .
. . . . . . . . . . . . . . . .. . . . . . . . . . . . . . . . . . . . . . . . . . . . . . . .. . . . . . . . . . . . . . . . . . . . . . . . . .
Figure 6.13: Examples of interaction types [2]
required. That means that blocks of behaviour may be decomposed into two or moresub-behaviours with their corresponding interactions.
Due to our design objective of facilitating service chaining, our architectural styledefines an important constraint on the structure of interactions. In cases such as thosedepicted in examples 4 and 5, where a processing entity receives an input, either withor without an associated item, and after some operations delivers an item as a result,the interaction that handle the input and the output should not be modelled as partof a single interaction, but as two separate yet associated interactions.
This approach facilitates the sequential chaining of behaviours, specially in thosecases where the behaviour (Brequesting) that triggers the production of a particularitem is not the same behaviour that receives the output generated by the processingbehaviour(Bprocessing), see Figure 6.14.
100
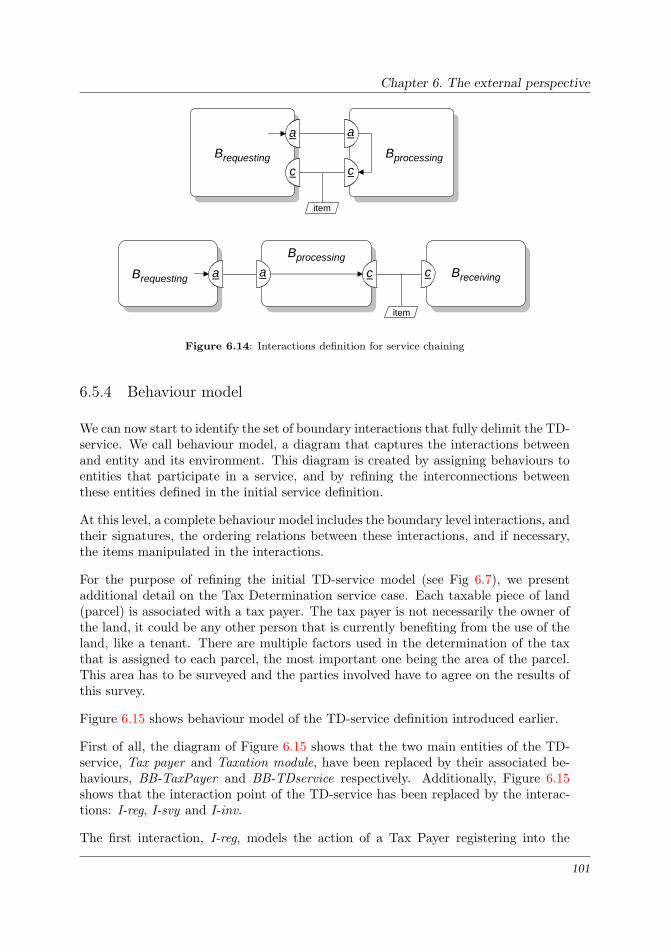
Chapter 6. The external perspective
Brequesting
BprocessingBreceiving
BB-A BB-C
entity E1 entity E2
entity domain
behaviour domain
cdaa
aa
BprocessingBrequesting
item
aa
cc
aa
item
cc
Figure 6.14: Interactions definition for service chaining
6.5.4 Behaviour model
We can now start to identify the set of boundary interactions that fully delimit the TD-service. We call behaviour model, a diagram that captures the interactions betweenand entity and its environment. This diagram is created by assigning behaviours toentities that participate in a service, and by refining the interconnections betweenthese entities defined in the initial service definition.
At this level, a complete behaviour model includes the boundary level interactions, andtheir signatures, the ordering relations between these interactions, and if necessary,the items manipulated in the interactions.
For the purpose of refining the initial TD-service model (see Fig 6.7), we presentadditional detail on the Tax Determination service case. Each taxable piece of land(parcel) is associated with a tax payer. The tax payer is not necessarily the owner ofthe land, it could be any other person that is currently benefiting from the use of theland, like a tenant. There are multiple factors used in the determination of the taxthat is assigned to each parcel, the most important one being the area of the parcel.This area has to be surveyed and the parties involved have to agree on the results ofthis survey.
Figure 6.15 shows behaviour model of the TD-service definition introduced earlier.
First of all, the diagram of Figure 6.15 shows that the two main entities of the TD-service, Tax payer and Taxation module, have been replaced by their associated be-haviours, BB-TaxPayer and BB-TDservice respectively. Additionally, Figure 6.15shows that the interaction point of the TD-service has been replaced by the interac-tions: I-reg, I-svy and I-inv.
The first interaction, I-reg, models the action of a Tax Payer registering into the
101

6.5. Service design
GSI system
Taxation module(service entity)
repository
Tax payers (client entities)
BB-TD
BB-Taxpayer
I-sv
y I-invI-reg
BB-TDservice
BB-TaxPayer
Taxation module(service entity)
Tax payer(client entity)
invoice
I-sv
y I-invI-reg
registration form
Ep-model-A.pdf
Ep-model.pdf
Figure 6.15: refinement of the TD-service definition
tax register. An input item is required for this task, which is modeled by the itemregistration form. The arrows in the interaction describe the type of interaction thatis taking place.
The second interaction, I-svy, represents the action of surveying the property that thetax payer has registered into the system. This time the interaction type shows thatthe survey interaction is a negotiation, and only completed when the two participatingentities come to an agreement, in this case, on the area and limits of the parcel underconsideration.
The last interaction, I-inv, models the action of notifying the tax payer on the valuethat has been taxed to the property or properties associated with him (the tax payer).The item invoice models the result of the service. The invoice item is shown replicatedin Figure 6.15 to show that in turn multiple invoices are sent to the tax payer. Thereasons for this are: 1. the tax payer is associated with more than one parcel; or2. according to the regulations taxes on agricultural land are charged on periodicalbasis.
In Figure 6.15 the single interaction shown before the refinement, has not been quali-fied. That is, there are no arrow heads and dots on the extremes of the line connectingthe interaction points. This shows that the interaction needs refinement.
The same holds for the relationships between interactions inside the TD-service be-haviour block, which are depicted in the figure as dashed lines. However in the latercase, although the interaction relations need refinement, arrow heads are provided toshow the ordering in which the interactions occur.
For simplicity purposes, not all the details on the interactions of the TD-service havebeen added to the service definition depicted in Figure 6.15. Interaction constraints,and interaction attributes, for example, are not shown.
102

Chapter 7
The internal perspective model
Those who do not know the conditionsof mountains and forests, hazardous defiles, marshes, and swamps
cannot conduct the march of an army.
Sun Tzu
In this chapter we concentrate on a development method to produce ‘internal per-spective models’. These are models that are closer to available implementation mech-anisms and refine the more abstract ‘external perspective models’. The chapter pro-poses a design pattern to guide and constrain the definition of architectural elements.The chapter shows how to use design concepts to represent elements of a geo-informa-tion system. The chapter also explains the process of specifying services as individualfunctions or as service chains.
The chapter is structured as follows: section 7.1 explains the principles of servicedecomposition and the criteria for the definition of architectural elements; section 7.2introduces the development steps followed to obtain internal perspective models; sec-tion 7.3 provides guidelines for the assessing the correctness of proposed developmentsteps. section 7.4 explains techniques to describe services; and section 7.5 shows anexample of the creation of internal perspective models.
7.1 Decomposition goals
The objective of the architectural design phase (see section 4.2) is to decompose asystem into a set of interacting parts, such that the system’s observable behaviour(external perspective model) is implemented by the composed behaviour of these
103

7.1. Decomposition goals
parts. We use architectural elements, as introduced in section 4.5, to represent systemparts.
System decomposition has to be performed according to certain specific criteria, likereusability of elements and the correctness of the resulting composition. In order tomake our method concrete, we prescribe the use of a decomposition pattern, referredto as the mediator pattern. Decomposition steps can be performed recursively, untila final decomposition is obtained.
7.1.1 Criteria
The main goal of a decomposition step is to define the internal structure of therequired service. This decomposition step should be performed whenever there isno single concrete element that can provide the required service as defined by theexternal perspective. The Figure 7.1 shows a decomposition step of a required service,which results in a set of related elements. In Figure 7.1 the required service and theresulting set of elements are represented as behaviour blocks. The lines connectingthe behaviour blocks of the decomposition result in Figure 7.1 denote the interactionsbetween their corresponding elements.
In the decomposition step depicted in Figure 7.1 we apply available elements, when-ever possible, or define new elements in such a way that they can be reused in otherdevelopment projects. Furthermore, each element should be defined in such a waythat it can be later replaced by another element, for example, with the same func-tionality but with an improved implementation. Figure 7.1 also shows that there aremultiple alternative decompositions that implement the required service.
In our method we aim at separating the data sharing concerns from processing con-cerns, by assigning them to different types of architectural elements, namely data andprocessing elements respectively. Although this separation is an important criterionfor defining architectural elements, we also realise that processing elements may needdata that is specific to their functionality and should not be detached from them.In this sense a processing element is self-contained, because it contains all the dataresources it needs to properly operate.
For example, one can design an architectural element that can be used to determinea route between two given points through a road network. We can specify the x andy coordinates of the two points as the only input needed. The element uses this inputand a road network from an internal storage to find the route between the points. Inthis case, such an element can only be used to determine routes based on the roadnetwork available internally in the element, for instance, the Dutch road network.
Separating data sharing concerns from processing concerns fosters reuse, since it al-lows processing and data elements to evolve independently. Accordingly, a processingelement should be designed to be independent of any context sensitive data, like datathat changes over multiple instantiations, or data that can be obtained from the en-
104

Chapter 7. The internal perspective model
e1 e2 e3e1
e5
e6
e4e1
e7e4
e6
required service
decomposition step
Alternative-Service-Realisations.pdf
Figure 7.1: Decomposition step
vironment of the element. This separation may also improve maintainability, since itpotentially simplifies processing elements.
Applying this separation criterion to the route determination element above, we coulddesign a processing element that determines routes between points, such that this ele-ment gets as input the points of interest and a corresponding transportation network.In this case, the element is context-independent and can be used in more situations,such as when the two points are located in different countries. In addition, becausethe function of the element focuses only on the determination of a route, it can evenbe used to determine a route along a railroad network, if the railway network is thekind of transportation network given as input.
Consequently, specially in the case of geo-information processing, it suffices to havestateless elements, which are architectural elements that can not make use of anystored data from previous instantiations. This means that all the data needed by theelement to operate properly should be modelled explicitly with its interactions, and,therefore, this data should be provided in each instantiation. The separation criteriaapplies at design level, which means that an implementation may still integrate aprocessing element and data element, e.g., for efficiency reasons, if these elementsbelong to the same implementation authority.
The environment of an architectural element consists of other architectural elementsand possibly the system’s environment. An architectural element should make itsservice accessible to its environment via interactions. We may have large architecturalelements that can provide useful services by themselves, but they still should havethe capability of being combined with other (large) architectural elements in the caseextended or specialised services are needed. This implies that architectural elementsshould be defined such that they can be combined with other elements solely onthe basis of the specification of their observable behaviour, namely their externalperspective model.
105

7.1. Decomposition goals
7.1.2 Decomposition pattern
Many alternative approaches can be adopted for the realisation of compositions [HBCS03,ACD+03]. Although it is possible to build up a composition wholly from already ex-isting generic services, in our approach we want to centralise the responsibility forthe provision of a service in a single element, and, furthermore, we want to shield theuse of multiple elements from the user. Therefore, we adopt a structured compositionform in which a special element is defined to coordinate the interactions between theother architectural elements, and to provide an interface to the service user. Thisleads us to the mediator pattern, in which a central element plays the role of a me-diator. Figure 7.2 depicts a decomposition that applies the mediator pattern. Themediator pattern may be implemented using mediator replicas in order to avoid thatthe mediator becomes a single point of failure.
Besides the criteria mentioned above, the adoption of this decomposition patternserves three objectives:
1. it allows us to define a set of concrete development steps for the design of GSIservices, which results in a composition of independently-designed elements;
2. it allows the organisation of a set of services into a behaviour definition thathas a single coordinating element, making the service realisation accountablefor the user;
3. it facilitates the use of workflow languages to implement the mediator behaviour,which choreographs the use of third-party services.
S1S1
E1E1
E2E2 E3E3E4E4
decompositionstep
Mediator-Pattern1.pdf
mediator-S1mediator-S1
E1E1
E2E2 E3E3E4E4
decompositionstep
mediator-E2mediator-E2
E2aE2a
E2bE2b E2cE2c
decompositionstep
mediator-E4mediator-E4
E4aE4a E4bE4b
mediator-S1mediator-S1
Mediator-Pattern.pdf
Figure 7.2: Mediated compositions
106

Chapter 7. The internal perspective model
This pattern is also being used in other architectures for service composition, like, forinstance, in compositions of Web Services (see [HBCS03]).
7.1.3 Recursive pattern application
A decomposition step may result in a structure containing architectural elements thatdo not have a realisation available. In this case we may decide to apply the medi-ator pattern again to develop these architectural elements. Therefore, we concludethat this decomposition pattern can be applied recursively, until all processing anddata elements can be either mapped onto available components or can be createdstraightforwardly.
Figure 7.3 shows that the mediator decomposition pattern can be applied recursivelyuntil proper architectural elements are obtained.
The recursive application of the mediator pattern results in a hierarchy of mediators,each one controlling their corresponding architectural elements and shielding themfrom a higher level user.
S1S1
E1E1
E2E2 E3E3E4E4
decompositionstep
Mediator-Pattern1.pdf
mediator-S1mediator-S1
E1E1
E2E2 E3E3E4E4
decompositionstep
mediator-E2mediator-E2
E2aE2a
E2bE2b E2cE2c
decompositionstep
mediator-E4mediator-E4
E4aE4a E4bE4b
mediator-S1mediator-S1
Mediator-Pattern.pdf
Figure 7.3: Recursive mediated compositions
107

7.2. Decomposition method
7.2 Decomposition method
In a decomposition step we start with an extended service definition according to theexternal perspective, and end up with a set of interconnected elements that define theinternal perspective of the required service.
7.2.1 Overview
We define a method for the development of the internal perspective of a service thatconsists of the following steps (see Figure 7.4):
1. Transformation to integrated form: in this step the required service definition istransformed to the integrated form (see section 5.3.2), by abstracting from thedistribution of responsibility for interactions between the service provider andthe service users;
IP-Design-Trajectory.pdf
architectural designarchitectural design
repositoryrepository
transformation to integrated form
transformation to integrated form
externalperspective model
internalperspective model
introduction of internal actions
introduction of internal actions
restructuring(constraint-oriented style)
restructuring(constraint-oriented style)
assignment of sub-behaviours
assignment of sub-behaviours
validate
validate
validate
Figure 7.4: Decomposition method
108

Chapter 7. The internal perspective model
2. Introduction of internal actions: in this step the behaviour of the service inintegrated form is refined by introducing internal actions;
3. Restructuring: in this step the refined behaviour is restructured according tothe constraint-oriented style (see section 5.4, i.e., such that different constraintson actions can be separated in sub-behaviours;
4. Assignment of sub-behaviours: in this step sub-behaviours of the restructuredspecification are assigned to elements.
Since we want to obtain a decomposition that consists mainly of reusable elementsfrom a repository, step 2 should be performed hand in hand with the identification ofelements that can be part of the required service. This means that we choose internalactions that on one hand relate to parts of the total functionality of the requiredservice, but on the other hand can be supported by available elements.
The final composition of elements that characterise the internal perspective has toconform with the external perspective, which implies that each step in our decompo-sition method has to be validated for correctness.
Figure 7.5 illustrates the first step of our decomposition method. We consider inFigure 7.5 a fictitious required service that can be described as a behaviour consistingof interaction S followed by interaction F. In this step the interaction contributionsfor S and F are combined, so that we obtain a behaviour consisting of actions S andF, respectively. This step is necessary because we may decide at a later stage todistribute the interaction responsibilities in a different way than originally done inthe required service.
SS FF
SS FF
aa
bb
cc
F’F’ddS’S’
Decomposition-Method-Step1.pdf
Decomposition-Method-Step2.pdf
transformation to integrated form
introduction of internal actions
S
S
F
F
Figure 7.5: Step 1: transformation to integrated form
Figure 7.6 illustrates the second step of our decomposition method. In the examplein Figure 7.6 actions a,b,c and d are inserted in the integrated behaviour, resulting ina more detailed behaviour definition. The choice for these specific actions has beendictated by the availability of elements that can perform these actions. For the sake
109

7.2. Decomposition method
of conciseness we assume that our architectural elements perform only one action, butin practice they have much more complex behaviours.
SS FF
SS FF
aa
bb
cc
F’F’ddS’S’
Decomposition-Method-Step1.pdf
Decomposition-Method-Step2.pdf
transformation to integrated form
introduction of internal actions
S
S
F
F
Figure 7.6: Step 2: introduction of internal actions
Figure 7.7 illustrates the third step of our decomposition method. In Figure 7.7 theresponsibilities for performing actions have been split, resulting in a behaviour thatis structured according to the constraint-oriented style.
aa
bb
cc
F’F’ddS’S’
bb-userbb-userbb-userbb-user
bb-Cbb-C
bb-Abb-A
bb-Dbb-D
bb-Bbb-B
i1
i1
i3
i3
i2
i2
i4
i4
bb-mediator
S’S’ F’F’
constraint-orientedstructuring
Decomposition-Method-Step3.pdf
Figure 7.7: Step 3: constraint-oriented restructuring
110

Chapter 7. The internal perspective model
assignment of sub-behaviours
Decomposition-Method-Step4.pdf
element-Mediator
element-A
int-i1
element-B
bb-Cbb-C
bb-Abb-A
bb-Dbb-D
bb-Bbb-B
i1
i1
i3
i3
i2
i2
i4
i4
bb-mediator
S’ F’
element-C element-D
Int-i3 Int-i4
Int-i2
Figure 7.8: Step 4: assignment of behaviours to elements
In the fourth step of our decomposition method, each sub-behaviour is assigned toan element or to the service user. In Figure 7.8 we show that behaviours bb-A, bb-B,bb-C and bb-D are assigned to elements Element-A, Element-B, Element-C and Element-
D respectively, and that behaviour bb-mediator is assigned to the mediator Element-
Mediator. In Figure 7.8 we omit the service users.
7.2.2 Introduction of internal behaviour
The most important step in our decomposition method is the introduction of inter-nal actions. This step is difficult to automate and is subject to designers choice,interpretation and creativity. A behaviour may be decomposed in a number of ways,by adding different alternative internal actions. Specific technical reasons normallydetermine the decomposition that is chosen in a refinement step.
111

7.2. Decomposition method
To identify the actions that can be inserted, one analyses the required service anddefines a functional partition of this service. This partition determines the functionsnecessary to realise the required service. They should be identified taken into accountthe functionality offered by the available elements from the repository. Once thesefunctions are isolated and represented as actions in the refined behaviour, indirectlya set of elements is selected for usage. Some of these elements may have already havean implementation that can be used in the realisation of the required service, butsome others may have to be built.
The choice of internal actions should also be done with the behaviour of the futuremediator in mind, or a mediator behaviour may appear naturally when sub-behavioursare identified as shown in the example of Figure 7.7. If this is not the case, theintroduction of internal actions step should be revisited such that direct relationsbetween sub-behaviours that will correspond to data and processing elements arereplaced by indirect relations via the mediator behaviour.
When assigning sub-behaviours to elements (step 4 of our method), the sub-behav-iours have to match the behaviours of the elements in the repository (external perspec-tive). This is normally not the case, which implies that the introduction of internalactions may have to be reconsidered, so that the desired matching of behaviours canbe obtained.
7.2.3 Composition structures
The way in which the required service is internally structured depends on the decisionas to how to move the data or results that are exchange between elements. Since weuse the mediator pattern to structure service definitions, there are two approachesto define the interactions of a mediator with other architectural elements: 1) Makeeach element interact with the mediator, both for the purposes of control and dataexchange; or 2) interact with the mediator for control and directly for data exchange.
bb-mediatorbb-mediator
bb-B bb-B bb-Abb-A
bb-mediatorbb-mediator
bb-B bb-B bb-A bb-A
Composition-Structures.pdf
item item
item
(a) (b)
Figure 7.9: Composition structures
112

Chapter 7. The internal perspective model
Figure 7.9 depicts these two different composition structures. Figure 7.9a shows thestructure for the first case, where all control and data (represented as an item in thefigure) flows are realised through the mediator. Figure 7.9b shows the structure forthe second case, where only the control is coordinated by the mediator but the datais allowed two be exchanged directly between processing elements.
7.3 Correctness assessment
Correctness assessment is used to validate the refinement of an abstract behaviour(e.g., an external perspective model) into a number of interrelated fine-grained be-haviours (e.g., an internal perspective model) that conform to the behaviour providedby the abstract behaviour. We refer to a behaviour and its corresponding refinedspecification as abstract and concrete behaviours respectively. A concrete behaviouris correct with respect to an abstract behaviour if it preserves all properties of theabstract behaviour.
In a correctness assessment process, the activity units (actions and interactions) thatare modelled in the abstract behaviour are called abstract activity units (abstractaction and abstract interaction), while the activity units modelled with the corre-sponding concrete behaviour(s) are called concrete activity units (concrete action andconcrete interaction). Abstract behaviours are exhibited by system parts, which arecalled abstract system parts.
Two main requirements have to be observed when refining an abstract behaviour intoa concrete behaviour [Qua98, Sin95, FP94]:
• Preservation of relations. The relations between actions in the abstract be-haviour should be preserved by the relations between their corresponding ac-tions in the concrete behaviour.
• Preservation of action values. The values established in actions in the abstractbehaviour should be preserved by the values established in their correspondingactions in the concrete behaviour.
Figure 7.10 shows the correctness assessment method that we adopt. The left of thefigure depicts an abstract behaviour, represented as an oval, that is refined into aconcrete behaviour, represented as circles. Relations between concrete behaviours arerepresented as straight lines. The right of the figure shows an abstracted behaviourthat is obtained from a composition of the concrete behaviour.
To assess the correctness of the refinement of an abstract behaviour into a concretebehaviour, our method has the following steps [Qua98, FP94]:
1. Identification of reference activity units and inserted activity units in the con-crete behaviour. Reference activity units are activity units in the concrete be-
113

7.3. Correctness assessment
abstractbehaviour
abstractedbehaviour
concrete behaviour concrete behaviour
refinementabstraction
equivalence
Refinement-Assessment.pdf
Figure 7.10: Correctness assessment
haviour that correspond to activity units in the abstract behaviour. Insertedactivity units are activity units in the concrete behaviour that do not correspondto activity units in the abstract behaviour, i.e. they are activity units that havebeen inserted during refinement;
2. Abstraction from all of the inserted activity units. This requires for each insertedactivity unit (action) i: a) the replacement of each causality condition in whichi occurs by an equivalent causality condition in which i does not occur; b) thereplacement of each reference relation defined in terms of values established ini by an equivalent reference relation in which these values do not occur.
3. Replacement of each group of reference activity units by an abstract activityunit. Each group of reference activity units whose occurrence corresponds to theoccurrence of a single abstract activity units should be replaced by the abstractactivity unit.
4. Comparison of the abstraction of the concrete behaviour to the original abstractbehaviour. The concrete behaviour only conforms to the abstract behaviourif the abstracted concrete behaviour and the abstract behaviour comply to acertain correctness relation. This correctness relation can be:
• an equivalence relation which defines that the abstracted concrete be-haviour should preserve all properties of the abstract behaviour (e.g., foraction values this means that all action values possible for an abstractaction are also possible for the corresponding concrete actions), or
• a partial order relation which defines that the abstracted concrete be-haviour should preserve a subset of the properties of the abstract behaviour(e.g., for action values this means that a subset of the action values possi-ble for an abstract action are also possible for the corresponding concreteactions).
114

Chapter 7. The internal perspective model
The proposed strategy, especially step 3, assumes that in the behaviour refinementprocess each abstract activity unit is replaced by a single concrete reference activityunit. This means that when we perform the introduction of internal actions in thedecomposition method (see section 7.2.2), all issues related to interface refinementhave been considered before.
This strategy is based on the recognition that the refinement of an abstract behaviourcan result in many alternative concrete behaviours, whereas the abstraction of a con-crete behaviour is unique. Therefore, the method requires the assessment of confor-mance by comparing the abstraction of the concrete behaviour to the original abstractbehaviour.
Consider for example, the diagram depicted in Figure 7.11. The model depicts theabstract behaviour bb-A, which includes four interactions represented by: int1, int2,int3 and int4. The model states that int1 is followed by int2, and that int2 is followedby int3 and int4.
We have various possibilities for the refinement of the abstract behaviour bb-A intotwo more concrete behaviours, bb-A1 and bb-A2 . We have chosen two alternativescenarios for the assignment of the interactions from the abstract behaviour to themore concrete behaviours. In the first scenario the reference interaction correspondingto int1 is assigned to bb-A1 , while the reference interactions corresponding int2, int3
and int4 are assigned to bb-A2 . In the second scenario, the reference interactionscorresponding to int1 and int4 are assigned to bb-A1 , while the reference interactionscorresponding to int2 and int3 are assigned to bb-A2 .
Figure 7.12 shows the representation of the refinement of the abstract behaviour bb-A
according to the first assignment scenario. Interactions int1’, int2’, int3’ and int4’ arereference interactions that correspond to int1, int2, int3 and int4. Interaction int5 is aninserted interaction in the concrete behaviour.
Interaction int1’ has been assigned to the concrete behaviour bb-A1 , while interactionsint2’, int3’ and int4’ have been assigned to the concrete behaviour bb-A2 . According tothe abstract definition, interaction int2 is only allowed to occur after the occurrenceof int1. This relation has to be kept after the assignment of the concrete reference
bb-A bb-A
int1 int2 int3
int4
bb-A
int1 int2 int3
int4
int5
bb-A2 bb-A1
int2’ int3’
int4’
int5
bb-A2 bb-A1
int2’ int3’
int4’
int5
int6
Interaction-Refinement-abs.pdf
int1’
int1’
Figure 7.11: Abstract behaviour
115

7.3. Correctness assessment
bb-A bb-A
int1 int2 int3
int4
bb-A
int1 int2 int3
int4
int5
bb-A2 bb-A1
int2’ int3’
int4’
int5
bb-A2 bb-A1
int2’ int3’
int4’
int5
int6
Interaction-Refinement-abs.pdf
int1’
int1’Figure 7.12: Refinement of an abstract behaviour into two concrete behaviours
interactions to the concrete behaviours. Therefore, there should be a relationshipbetween interactions int1’ and int2’, which are now assigned to separate behaviourblocks. This relationship is accomplished by introducing interaction int5, which definesa constrained relation between the two concrete behaviours bb-a1 and bb-A2 . As aresult int1’ is followed by int5, which is followed by int2’.
The refinement of the abstract behaviour bb-A according to the second assignmentscenario is shown in Figure 7.13. In this case, interactions int1’ and int4’ have been as-signed to concrete behaviour bb-A1 , and interactions int2’ and int3’ have been assignedto concrete behaviour bb-A2 .
In this refinement, interactions int1’ and int2’ as well as int2’ and int4’ have to berelated. This relations are kept by introducing two interactions int5 and int6. Theseinteractions allow behaviours bb-A1 and bb-A2 to exchange information that was pre-viously centralised.
For simplicity reasons we have not introduced internal activity units, neither havewe defined sub-behaviours for the concrete components. According to the correctnessassessment steps introduced earlier, to assess whether or not the abstract behaviourwas correctly refined, we have to merge the concrete behaviours, abstracting from
bb-A bb-A
int1 int2 int3
int4
bb-A
int1 int2 int3
int4
int5
bb-A2 bb-A1
int2’ int3’
int4’
int5
bb-A2 bb-A1
int2’ int3’
int4’
int5
int6
Interaction-Refinement-abs.pdf
int1’
int1’
Figure 7.13: Alternative refinement of an abstract behaviour into two concrete behaviours
116

Chapter 7. The internal perspective modelAssignment-Assessment.pdf
bb-A2 bb-A1
int2’ int3’
int4’
int5
int6
int1’
bb-A’
int2’ int3’
int4’
int5
int6
int1’
Figure 7.14: Alternative refinement of an abstract behaviour into two concrete behaviours
inserted interactions, to produce an abstracted behaviour than can be compared withthe original abstract behaviour.
In the case of the second scenario, when we abstract from the inserted interactions thatrelate the two concrete behaviours bb-A1 and bb-A2 , we have to remove interactionint5, and then make the condition for interaction int5, which is int1’, a condition forinteraction int2’. Similarly, we remove interaction int6, and make its condition, whichis int2’, a condition for interaction int4’. The result is then an abstracted behaviourthat can be compared to the abstract behaviour (see Figure 7.14).
7.4 Service descriptions
A GSI service is an accessible piece of functionality that requires an adequate de-scription to facilitate its discovery. These service descriptions should convey enoughinformation such that one can find and use required services. Service descriptionshave two main sections, a general section that applies to all services, and a specificsection that depends on the nature of the elements that provide the service.
The general metadata section is explained in detail in appendix A.3. The followingtwo sections describe the specific issues on service description for data and processing
117

7.4. Service descriptions
elements, respectively.
7.4.1 Data descriptions
Data elements represent sources of data. Examples of data elements include a docu-ment, an image, a data collection, application specific information (e.g., today’s trafficdata). In GSDM awareness about the nature and characteristics of the data repre-sented is of primary importance, because data need not only to be discovered but alsocombined and transformed. Data may also need to be moved from the location whereit is stored to the location where it is used, normally by, a processing element.
Metadata elements are used to describe geographic data. Metadata elements, alsocalled referential attributes, provide a meaningful description of the data, which fa-cilitates its discovery, access and use. Metadata enables one to determine whetherparticular geographic data is useful for a particular application. We use metadata todescribe collections (complete datasets), individual geographic objects (geoObjects),themes, and composites. This metadata describes the semantics of the data and pre-scribes the form in which this data can be exchange. Figure 6.5 in section 6.4 shows therelation between geographic features and metadata elements. A geographic featurecan contain a number of metadata elements that convey its descriptive information.
Figure 7.15 shows the metadata schema for describing geographic data, which de-fines a set of metadata elements. Typically only a subset of the elements showed inFigure 7.15 is used. This subset of the elements is known as core metadata since itcomprises the minimum metadata elements required to identify a dataset. These ele-ments are the Identifier and the Creator. Other elements, like the TemporalResolution orCollectionDate are not considered core elements, and as such they are not compulsorybut they should be provided, whenever possible, in order to increase the potential of
Metadata
SpatialRepresentation
ReferenceSystem
SpatialExtent
SpatialResolution Quality
Distribution Content
Identifier
TemporalResolution CollectionDate
Creator
1..*
0..1
0..*
0..*
0..*0..*
0..*
0..*
0..*
0..*
1..*
Metadata-Elements.pdf
Figure 7.15: Metadata elements
118

Chapter 7. The internal perspective model
re-usability of the data.
7.4.2 Processing descriptions
Processing services perform actions on data, that is, they use, modify, create or destroydata resources as they carry out their intended tasks. Processing services representdistinct, identifiable and independent units of processing.
These units of processing could address a multiplicity of operations of different na-ture. In order to properly structure these service descriptions, we provide a semanticclassification of services into service groups. We based the classification on the OGCservice taxonomy domains [OGC02, OGC03b]. The classification presented here isused to facilitate the organisation, discovery and manipulation of processing services.
We organise our service groups based on the structure of the content that they operateon (e.g., features, images), the type of contents either consume or produce (e.g., roads,parcels), the spatial and temporal resolution of these contents (e.g., 6 months, twoyears, or 1:2000, 1:500), and other descriptors such as area of validity, contents sources,quality of service, etc. We identify five different service groups:
1. Retrieval services, which provide access to collections of data or geodata inrepositories and databases, i.e., feature access services, coverage access services,sensor collection services and archive services;
2. Value-added services, which operate on (geo)data and add value to it. They canperform large computations and transform, combine, or create new (geo)data,i.e., coordinate transformation services, geocoder services, gazetteer services,geoparser services, reverse geocoder services and route determination services;
3. Visualisation services, which enable the rendering and portrayal of information,e.g., given one or more inputs, they produce cartographically portrayed maps,perspective views of terrain, annotated images, views of dynamically changingfeatures in space and time, etc.;
4. Application services, which support managing user interfaces, graphics, multi-media, and presenting compound documents, i.e., data association and cross-referencing, imagery exploitation, location-based services;
5. Catalogue services, which are used to classify, register, describe, search, maintainand access descriptions of services available on the infrastructure.
These descriptions are illustrate the specific functionality provided by a service, andconsequently can be used for searching, finding and possibly selecting suitable services.The actual service definition of each of these services in terms of the external andinternal perspectives of the service is stored and structured according to the repository(see section 4.4). The schema for this repository is shown in Appendix B.
119

7.5. Design example
7.5 Design example
Figure 7.16 shows the EP model of the Simple Route service. The model includestwo behaviour blocks identified as bb-Traveller and bb-SimpleRoute. The two behaviourblocks have a constrained relationship defined by the interactions I-init and I-route.The model also describes the items exchanged by the two behaviours. This model isused in this section to illustrate the development of internal perspective models.
The internal perspective of a required service is developed through the successiverefinement steps that aim at the replacement of the abstract behaviour of the requiredservice by a concrete behaviour specification (see section 7.2).
Figure 7.16 shows a causality relation between the interaction contributions I-init andI-route of the behaviour bb-SimpleRoute.
We start by transforming the specified interactions to their integrated form, whichmeans abstracting from the individual interaction contributions of the involved en-
TravelerTraveler
GSI providerGSI provider
EP-SimpleRoute.pdf
bb-SimpleRoutebb-SimpleRoute
bb-Travelerbb-Traveler
ι : ⟨ orig, dest = { x, y } ⟩I-init
I-route ι : ⟨ sRoute, backgroud ⟩
assignment
Serviceentity structure
Figure 7.16: Simple route service EP model
120

Chapter 7. The internal perspective model
init route
init’ route’
genAOI featSel pathCalc
Simple-Refinement.pdf
introduction of internal actions
(a)
(b)
Figure 7.17: Introduction of internal actions to the SimpleRoute behaviour
tities. Figure 7.17a shows the abstract behaviour that models the function of theservice provider in an integrated form. It consists of two actions init and route, withinit being a condition for route. The textual notation of this behaviour is as follows:
SimpleRoute : { √ → init〈orig, dest〉,init〈...〉 → route〈path, backg | sRoute7→fbound(orig,dest)〉 }
7.5.1 Introduction of internal actions
In order to identify the different data and processing elements necessary to realisethe required service, as defined by the external perspective model, we apply stepwiserefinement to the abstract behaviour to determine internal service actions and theirrespective causality relations.
For the purpose of the refinement process we shortly explain the service walkthrough.Three major steps can be identified for the determination of the route between twopoints. First identification the geographical area where the two points (origin anddestination) are located, second obtention of the road network that correspond tothat area, and third, determination of a route between the points.
We this knowledge we can refine the abstract behaviour by introducing three actions,viz. the internal actions genAOI, featSel, and pathCalc. Figure 7.17b depicts the result-ing behaviour. Action genAOI models the identification of the area of interest, that isthe geographical zone that contains the origin and destination points. Action featSel
models the extraction of the features of the transportation network to be used in thecalculation. Action pathCalc models the actual determination of the route betweenthe given points.
121

7.5. Design example
aoi tnet
init route
init’ route’
genAOI featSel pathCalc
Simple-Refinement.pdf
orig,dest
init’ genAOI featSel pathCalc route’
IP-Items.pdf
path,backg
sRoute
Figure 7.18: Item representation of the SimpleRoute behaviour
Actions genAOI, featSel and pathCalc represent a distribution of part of the processingrequired to perform the route calculation function. This processing is controlled bythe attribute constraints of action route’. These constraints are the responsibilityof the service provider and therefore should be enforced in the refined behaviour.Consequently, the refined behaviour in this case could be defined as follows:
SimpleRoute : { √ → init’〈orig, dest〉,init’〈...〉 → genAOI 〈aoi,[orig,dest] | aoi 7→contains(orig,dest)〉,genAOI〈...〉 → featSel〈tnet,[orig,dest,aoi]〉,featSel〈...〉 → pathCalc〈path,backg | path7→fbeg(orig),path7→fend(dest)〉,pathCalc〈...〉 → route’〈sRoute,[backg] | sRoute7→fnodes(path)〉 }
The causality relation of the abstract behaviour is preserved in the refined behavioursince the latter defines that init’ is a condition for genAOI, genAOI is a condition forfeatSel, featSel is a condition for pathCalc and pathCalc is a condition for route’. Theconcatenation of functions should yield the same result. If fbound = fnodes.(fbeg,fend),then the attribute values of the abstract behaviour are preserved in the refined be-haviour. This can be validated by substituting references to values of network and calc
by their values or constraints. By applying this rule to the values of route we concludethat sRoute = fnodes(path) can be substituted by sRoute = fnodes(fbeg(orig),fend(dest)).
The textual notation represents actions in italics followed by a list of attributes andconstraints between diagonal brackets. Variables to contain attribute values estab-lished by the action are simply separated by commas. Variables of previous actionsthat are retained by an action (and thus can be referred to by subsequent actions)are shown between square brackets. Attribute constraints are separated by a verticalbar. Functions are shown in plain italics, followed by a list of parameters betweenround brackets.
Figure 7.18 shows the graphical representation of the attribute information manipu-lated in the SimpleRoute service represented in terms of items.
122

Chapter 7. The internal perspective model
EP-ExtRoute.pdf
bb-ExtRoute
ι : ⟨ orig,int1,int2,…,dest : { EUcity,EUstreet,number }; mobType(car,bike,foot) ⟩
I-init
I-route ι : ⟨ sRoute, backg ⟩
I-init.OptimumRoute
[ EUcity, EUstreet ]city : EUcity;orig, dest : { str : EUstreet, number : };
Inputs
Parameters ⟨ routetype (shortest, quickest, cheapest ) ⟩orig ≠ dest; orig ≠ ∅; dest ≠ ∅; #city {1..2 } ⟩
⟨ι :
Figure 7.19: Extended route service EP model
7.5.2 Restructuring
Up to now, we have analysed the simple route problem as a single service that acceptstwo points and determines a route between these points. However, to increase thedegree of reusability of the service, we can study similar types of services and introduceinto the design additional elements that could handle any extra needed functionality.
To illustrate this we modify the initial version of the route determination service.Figure 7.16 showed the external perspective of the SimpleRoute service. The modelincludes the interaction I-init associated with an item that represents the informationthat is needed to initiate the service. In that case the information attribute refersto two points as the only data required for the service. These points are the originand the destination, modeled as orig and dest, which are defined as pairs of x and ycoordinates.
Although, pairs of x and y coordinates is what is required to determine a route, thegeographical awareness of most users (travelers) is normally expressed in terms ofaddresses and not coordinates. This represents a limitation to the usability of thisservice. Additionally, there could be cases in which intermediate points along theroute might also be of interest for the user.
To address this scenarios we introduce a service with a higher degree of reusabilitycalled the extended route service. Figure 7.19 shows the external perspective model ofthe bb-ExtRoute service. This model also defines the interaction I-init, which refers tothe origin and destination points, modeled as orig and dest as well, but in this case theorigin and destination points are defined in terms of addresses, that is a city name,a street name and a number, and nor x and y coordinates. In addition, interactionI-init refers to a serie of intermediate points that should be included in the routedetermination. Moreover, interaction I-init refers to yet another value, the so-calledmobility type modeled as mobType, which represents a parameter that specifies thetype of transport means to be used in order to go from the origin to the destination.
123

7.5. Design example
bb-ExtRoute
I-init’ I-reject
featSel
lastpnt = false
pathCalc
swap
Join
I-route'
lastpnt = false
Process-View.pdf
check geocode defAOI
Figure 7.20: Extended route service process flow
This new ExtRoute design could be based on the same set of actions defined with theSimpleRoute service, given that the addresses of the later case are converted into thex and y coordinates suitable for the former case. Figure 7.20 shows the behaviourdefinition of the ExtRoute service as a single function.
This behaviour definition contains a series of actions and causality relations that com-plement the SimpleRoute service definition presented earlier. Action check for example,models the verification of whether an AddressPoint value is contained within the citiesthat limit the geographical scope of the service. Acceptable addresses should belongto the subset of European cities as defined by the class EUcity. Action geocode modelsthe transformation of an AddressPoint value into a RoutePoint value. That is, it convertsa valid address into a pair of x and y coordinates.
The behaviour definition also includes a series of loops, which in this case are in-troduced as an extension mechanism of the service. For instance, interaction I-init
is followed by action check, which in turn is followed by action geocode. After ac-tion geocode a choice ‘♦’ appears with an attribute causality condition defined aslastpnt = false. This condition makes the process iterate until all given AddresPoints
have been checked and converted to coordinates. This basically allows for the check-ing and geocoding of a list (more that two) of points, which can be used to determinea route with multiple vertices. This enables the service to accept not only initial andfinal points, but also intermediate points.
In addition to the general process flow we also define the different data elements thatform part of the service. Here we can make use of both primitive data types, suchas, integer, char, etc., and defined data types, such as, geoObject, theme, etc. (seeSection 6.4). Figure 7.21 shows a simplified class diagram that represents some ofthe data-elements of the ExtRoute service. The diagram includes one aggregated classRoute that represents the result of the service. Each instance of this data elementencloses the set of streets that form a route.
The diagram also defines that a given address point, which complies with the defined
124

Chapter 7. The internal perspective model
EUcity1..*
StreetNumber1..*
AddressPoint
Route
starts ends
RoutePoint
Road WalkPath BicyclePath
+type
0..*
EUstreet
Data-Elements-Diagram.pdf
Figure 7.21: Data elements diagram of the extended route determination service
structure of the class AddressPoint, is associated with a route point that is part of theclass (RoutePoint). Furthermore, a route point is part of a route, and it can be eitherthe origin point, the destination point or an intermediate point of the route.
These associations, however, apart from representing the relations between the dataclasses, they represent processing associations between classes as well. That is theassociations are realised through the transformation of data. For example a Routepoint
result from applying a geocoding operation to an Addrespoint.
7.5.3 Assignment of sub-behaviours
From the behaviour definition of the service ExtRoute shown in Figure 7.20 we candiscriminate phases as explained in section 7.2.2. This enables the introduction ofthe mediator element, and the assignment of independent services to separate archi-tectural elements if applicable. In this case, for example, five distinctive independentphases are recognised as necessary to realise the service: 1) Validation of input points.2) Transformation of input points. 3) Identification and retrieval of the features, inthis case road features. 4) Determination of the actual route. 5) Graphic representa-tion of the results.
Figure 7.22 shows the specification of the ExtRoute service with the inclusion of amediator. In this case we have called the mediator element Routing. In additionout of the five recognise phases, only two other independent elements have beenidentify, namely, Geocoding and Feature selection. The behaviours of these elements
125
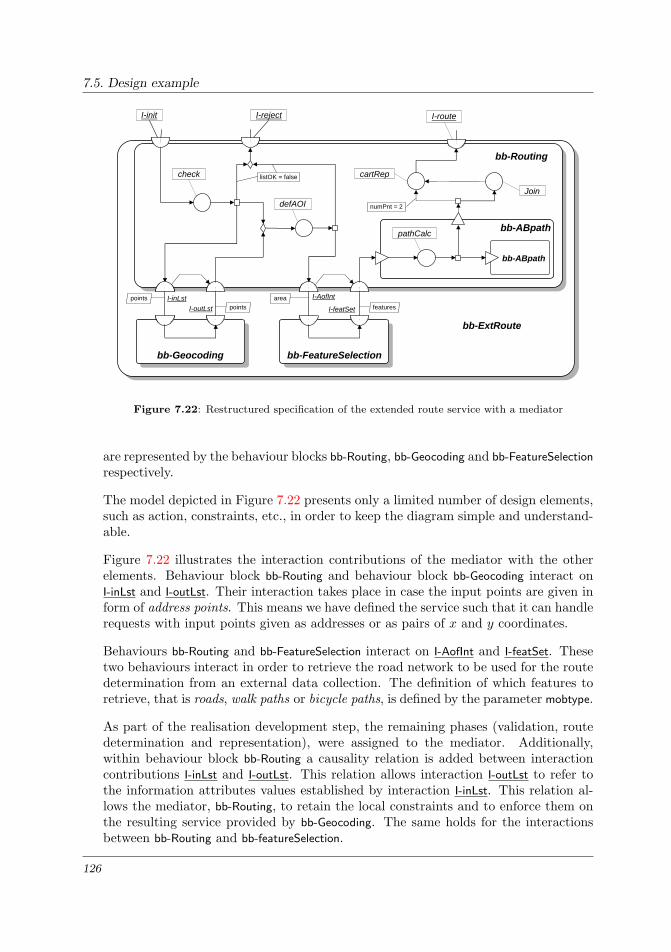
7.5. Design example
I-init I-reject
check
points I-inLstI-outLst points
defAOI
area I-AofInt
I-featSet features
pathCalcbb-ABpath
bb-ABpath
bb-Geocoding bb-FeatureSelection
cartRep
I-route
bb-Routing
bb-ExtRoute
ExtRoute-Process-View.pdf
listOK = false
Join
numPnt = 2
Figure 7.22: Restructured specification of the extended route service with a mediator
are represented by the behaviour blocks bb-Routing, bb-Geocoding and bb-FeatureSelection
respectively.
The model depicted in Figure 7.22 presents only a limited number of design elements,such as action, constraints, etc., in order to keep the diagram simple and understand-able.
Figure 7.22 illustrates the interaction contributions of the mediator with the otherelements. Behaviour block bb-Routing and behaviour block bb-Geocoding interact onI-inLst and I-outLst. Their interaction takes place in case the input points are given inform of address points. This means we have defined the service such that it can handlerequests with input points given as addresses or as pairs of x and y coordinates.
Behaviours bb-Routing and bb-FeatureSelection interact on I-AofInt and I-featSet. Thesetwo behaviours interact in order to retrieve the road network to be used for the routedetermination from an external data collection. The definition of which features toretrieve, that is roads, walk paths or bicycle paths, is defined by the parameter mobtype.
As part of the realisation development step, the remaining phases (validation, routedetermination and representation), were assigned to the mediator. Additionally,within behaviour block bb-Routing a causality relation is added between interactioncontributions I-inLst and I-outLst. This relation allows interaction I-outLst to refer tothe information attributes values established by interaction I-inLst. This relation al-lows the mediator, bb-Routing, to retain the local constraints and to enforce them onthe resulting service provided by bb-Geocoding. The same holds for the interactionsbetween bb-Routing and bb-featureSelection.
126

Chapter 7. The internal perspective model
A fourth behavioural element, called bb-ABpath, has been defined in order to handlethe calculation of the various sections of a route in the case where intermediate pointsare provided. This last behaviour block however, is not designed as an independent el-ement, but as an internal sub-behaviour that belongs to behaviour bb-Routing becauseit only represents a repetitive task that in this case only concerns the mediator.
The service example portrayed in Figure 7.22 describe the usefulness of separatingelements of a service that are independent from each other. For instance, behaviourblock bb-featureSelection represents any third-party service that retrieves a set of vectorfeatures, road features in this case, from a data collection, and makes it available forthe bb-routing behaviour. This should enable the service to be specialised for differentgeographical areas, other than Europe, by just replacing the Feature Selection servicewith another service that provides road features of South America, for instance. Thetextual specification of the ExtRoute service is as follows:
service element 4bb-ExtRouteattributes
· · ·data elements
PointList : array(1..n)RoutePointAddressList : array(1..n)AddressPointRoute : geoObject(line)· · ·
included processing elementsbb-Geocodingbb-FeatureSelection
mediator behaviour
bb-Routing : { √ → init〈PointList[0..n]; mobType(car,bike,foot) | orig 6=dest〉,I-init〈... |PointList7→oftype(AddressPoint)〉 → check〈listOK〉,defAOI ∨ check〈... | listOK=false〉 → I-reject〈...〉,check〈...〉 → I-inLst〈...〉,I-inLst〈...〉 → I-OutLst〈...〉,I-outLst ∨ check〈... | listOK=true〉 → defAOI 〈...〉,defAOI〈...〉 → I-AofInt〈...〉,I-AofInt〈...〉 → bb-ABpath.entry[1]〈...〉,bb-ABpath.entry[1]〈...〉 → pathCalc〈...〉,pathCalc〈...〉〈... | lastSect=true〉 → bb-ABpath.exit[1]〈...〉,bb-ABpath.exit[1]〈...〉 → cartRep〈... | numPnt=2〉,bb-ABpath.exit[1]〈...〉 → join〈...〉,join〈...〉 → cartRep〈...〉 }
· · ·bb-Routing, bb-Geocoding interact on I-inLst, I-outLstbb-Routing, bb-FeatureSelection interact on I-AofInt, I-featSet
end ;
127

7.5. Design example
128

Chapter 8
Case study: land information service
This chapter presents the case study of the land information service, which we used toillustrate the use of our design methodology. The chapter is structured as follows: sec-tion 8.1 introduces of the case, section 8.2 describes informally the behaviour of theservice, section 8.3 presents the external perspective model, and section 8.4 presentsthe internal perspective model.
8.1 Overview
The land information service, LI-service for short, is a service centred on the gener-ation of information about a piece of land. This includes, a.o., the actual use, theownership, location and size. The main objective of the service is to determine theprice and taxes of specific areas of land. The LI-service is the responsibility of theLand Information Agency.
Every taxable piece of land (parcel) is associated with a tax payer, who can be theowner or the tenant of the land. The tenant is the person that is currently exploitingthe land. There are multiple factors used in the determination of the tax that isassigned to each parcel, the most important factors being the area of the parcel andits current use. Taxes are to be charged to the tax payers twice a year.
The taxation regulation states that the tax pertaining to a parcel should be calculatedas a function of three main aspects: 1) land use, 2) productivity and 3) infrastructure.The land use determines the base tax percentages for a parcel. A parcel may currentlyhave more than one type of use, or may not be used in its totality for production.Productivity is a function of type the land use, area, and production conditions (e.g.,temperature, rainfall, etc.). Infrastructure has to do with the location of the field,that is distance to urban centres, road network, etc.
Multiple types of raw data are required for the execution of this service, for instance,timely imagery covering the areas of interest for the taxation period under consid-eration, geometric features describing parcel boundaries and nearby infrastructure,
129

8.2. Service walkthrough
weather data, etc. In addition to this raw data, specialised processing tasks areneeded to extract from the raw data, the necessary information for the tax calcula-tion. Examples include, a.o., image processing and geo-referencing.
The Land Information Agency does not count with all the data and processing re-sources necessary to make the service possible. Furthermore, the Land InformationAgency neither has the expertise required to implement and maintain the completeservice, nor the responsibility for generating and maintaining much of the necessarydata. Nonetheless, the Land Information Agency is responsible for the tax calcu-lation, and therefore has to identify a mechanism to realise it. This is achieved bydesigning a collaborative system to allow the Land Information Agency to make use ofspecialised services from other geo-service providers whose expertise are in line withthe particular needs of the LI-service.
In this specific example, certain data (meteorological data for example) does nothave to be produced by the Land Information Agency, but rather obtained fromthe responsible provider, even though some processing may be necessary to derivethe values as required for the tax calculation; and, periodic information about landuse requires the exploitation of raw data (satellite images) from which the land usedata for the specific period can be extracted, this data can obtained by means of anadditional service that complies with the particular requirements for this case.
8.2 Service walkthrough
The LI-service is initiated every time the Land Information Agency receives a re-quest from the government to determine the taxes for a group of taxable parcels.Four major steps can be identified in the execution of the LI-service. The first stepencompasses the activities that lead to the obtention of the necessary data to startany processing. These activities focus on: 1) accessing data repositories to obtain,a.o., 1) the geometric features that correspond to the parcels registered as taxable,and 2) up-to-date imagery data corresponding to the areas where the set of taxableparcels are located.
Collected data is then converted into a format that is suitable for the calculationprocess. This implies, for example, that uncontrolled imagery has to be converted intosufficiently geo-referenced imagery, that is with the positional accuracy and qualityneeded to be in conformance with the LI-service. This could involve the measurementof control points and ground points if necessary.
The second major step is to utilise the imagery and any other sources to extract theinformation about current use of the land for the areas of interest. Included hereare activities of image classification and change detection to assign to each parcel thecurrent use or uses of the land. This step finishes when all the information on landuse for the parcels in the area(s) of interest has been obtained.
130

Chapter 8. Case study: land information service
The third step involves the collection of information regarding productivity, such astemperature and rainfall, and regarding infrastructure such as, proximity to cities,roads, railways, etc.
In the fourth step, which is the real competence of the Land Information Agency, theresults of previous steps (the geometry of parcels, the types of land uses, the weatherdata, the infrastructure data) are used in the actual calculation of the taxes.
8.3 External perspective model
We start the development by creating a service definition from the external per-spective. According to the external perspective, we use a single functional entity,LIS (short for Land Information System), to represent the overall system. This entityplays the role of the service provider entity. This entity is associated with a behaviour,which in this case we have called LI-Service.
Figure 8.1 depicts the external perspective model of the Land Information Service.The model was developed based on the description provided in section 8.2. Thebehaviour block LI-Service is introduced to capture the interaction contributions ofthe system for this particular service. Two interactions are defined, tpList and tForm.
Interaction tpList represents the reception by the Land Information Agency of a tax-ation request including, a list of tax payers, and the identification numbers of thetaxable parcels associated with each tax payer. The list of tax payers correspondsto a specific region whose taxes are calculated during the current period. InteractiontForm represents the delivery of the set of invoices one for each of the tax payers listedin the initial request. According to this behaviour definition, interaction tpList is fol-lowed by interaction tForm. The textual representation of the behaviour depicted inFigure 8.1 is listed below:
LI-service
tpList
tForm
ι : [ TaxPayer, Field ]⟨ payer : TaxPayer | #payer (1..*),
parcel : Field | #parcel = #payer, parcel ↔ payer ⟩
ι : [ TaxForm]⟨ invoice : TaxForm | #invoice = #payer ⟩
TI-Service-EP.pdf
Figure 8.1: The Land Information Service external perspective
131

8.3. External perspective model
LI-Service : { √→ tpList 〈 ι = payer : TaxPayer | ]payer(1..*),parcel : ParcelNo | ]invoice≥ ]payer 〉;
tpList → tForm 〈 ι = invoice:TaxForm | ]invoice= ]payer 〉 }
In Figure 8.1, the information attribute of interaction tpList, ιtpList, is depicted asan item that contains two lists. The list of tax payers, which is represented by thevariable payer of typeTaxPayer , and the list of associated parcels, which is representedby the variable parcel of type ParcelNo. There is a condition on the number of taxpayers, represented by the constraint ]payer(1..∗), which defines that the list of taxpayer should contain at least on member. There is a condition on the list of parcels,represented by the constraint ]parcel≥ ]payer, which indicates that the number ofparcels should be at least the same as the number of tax payers. There is also acondition on the list of parcels, represented by the constraint ]parcel↔ ]payer, statingthat each parcel should be associated with a tax payer.
The information attribute of interaction tForm, ιtForm, is represented with an itemthat contains a list of invoices. This list is represented by the variable invoice oftypeTaxForm. There is a condition on the number of tax payers, represented by theconstraint ]invoice = ]payer, which defines that there should be one invoice for eachtax payer.
For each of the interactions defined in the service definition, one or more informationdiagrams are developed to capture the information used or established during theexecution of the interaction. For example, Figure 8.2a illustrates the informationdiagram developed for the item associated with the interaction tpList. InteractiontpList requires an input, TaxRequest, that represents the information used. TaxRequest
is composed of a two sets of information, Payer and Parcel. This information representsthe details of the parcels to be taxed and their associated tax payers. Similarly,Figure 8.2b illustrates the information diagram for interaction tpForm.
TaxRequest
TaxPayer(payerID)
name : stringaddress : string
Field(parcelID)
cadastralNumber : ID1..*
EP-Information-Model.pdf
Invoice(payerID)
date : datetax : real
1..*1..*
TaxCalculation
Field(parcelID)
cadastralNumber : IDrainfallCategory : inttemperureCategory : intproductivityTax : realinfrastructureTax : reallanduseTax : realsnapshot : image
1..*
1..*TaxPayer(payerID)
name : stringaddress : string
LandUse(useID)
area : realusetype : CropTypecroptax : string
1..*
1..*
(a) (b)
tpList parcelFeature
imageProcessing
changeDetection
featureExtraction
weatherData featureSelection
taxation tForm
LI-Service-IP-1.pdf
imagery
Figure 8.2: Information diagram for the interactions tpList (a) and tForm (b)
132

Chapter 8. Case study: land information service
8.4 Internal perspective
The internal perspective is developed in three steps. In the first step, we refine theservice definition and identify a number of architectural elements. In the second stepwe create a behaviour specification that defines the relations between these architec-tural elements and the corresponding constraints. In the third step, we specify theinternal behaviour of the architectural elements.
8.4.1 Introduction of internal actions
Our methodology prescribes a decomposition based on functionality in order to iden-tify the services required to assemble the LI-service. Using the behaviour walkthroughpresented in section 8.2, we identify the following set of required services.
1. A Parcel Feature Service is used to obtain boundaries of parcels. The Cadas-
tralNumbers of the parcels is provided as input to the service and the result isa theme that contains the polygons that define the shape and location of theparcels.
2. An Imagery Service uses the coordinates from the geometric extent (limits) ofthe parcel’s theme, and the dates of the taxable period to obtain the satellite im-ages covering the areas where the parcels are located. These images correspondto the starting and ending dates of the taxable period.
3. An Image Processing Service is used to geo-reference the satellite imagesand obtain a mosaic of the area of interest. The input to this service is the setof satellite images, and the result is the geo-referenced image mosaic.
4. A Change Detection Service compares images to identify the areas withinthe parcels that have had a change in the landuse.
5. An Feature Extraction Service is used to define the different types of landusewithin the taxable parcels.
6. A Weather Data Service is used to obtain the information regarding tem-perature, rainfall, etc. of the area of interest during the taxable period.
7. A Feature Selection Service is used to obtain information about nearbyinfrastructure.
8. A Taxation Service is used to determine each parcel’s tax and deliver theinvoices.
Figure 8.3 depicts the general process flow for the LI-Service based on the eight dis-tinctive independent services identified above. This process flow represents a set ofsteps to realise the service. Optimality in this sense this process represents the best
133

8.4. Internal perspective
TaxRequest
TaxPayer(payerID)
name : stringaddress : string
Field(parcelID)
cadastralNumber : ID1..*
EP-Information-Model.pdf
Invoice(payerID)
date : datetax : real
1..*1..*
TaxCalculation
Field(parcelID)
cadastralNumber : IDrainfallCategory : inttemperureCategory : intproductivityTax : realinfrastructureTax : reallanduseTax : realsnapshot : image
1..*
1..*TaxPayer(payerID)
name : stringaddress : string
LandUse(useID)
area : realusetype : CropTypecroptax : string
1..*
1..*
(a) (b)
tpList parcelFeature
imageProcessing
changeDetection
featureExtraction
weatherData featureSelection
taxation tForm
LI-Service-IP-1.pdf
imagery
Figure 8.3: General service process
approach to solve the problem given the current status of the system. The objec-tive here is to identify independent tasks that can be executed separately, if possiblein parallel and which functionality can be obtained from different resources (archi-tectural elements) within the infrastructure. That is, since services are in principleindependent of each other, they may exist within one organisation or they may besupplied by an external service provider. They are specified in a way such that theycan be used in a service realisation in spite of their physical location or specific imple-mentation The identification and definition of these independent services facilitatesthe sharing of services and the reuse of functionality.
8.4.2 Restructuring
With the general process flow described we can proceed to the definition of the me-diator element. For this purpose we discriminate all independent elements and thenwe define the relations between these elements and the mediator, such that the LI-service can be realised. In this case the mediator is called service-handler. This elementis responsible not only for the interface to the client application, and for hiding theexistence of the other elements from the user, but it also plays the connector role toconnect and control the relations between the other elements.
Figure 8.4 shows a behaviour definition including all of the elements identified beforeand their corresponding interconnections. At this level of abstraction we depict therelations between elements as single interactions. These interactions need to be refinedin order to fully specify the relations they represent.
Figure 8.5 shows the refined definition of the interaction between the elements weath-
erData and serviceHandler. The Weather Data Service is an independent service thatprovides weather information for specific periods of time. The service requires asinputs two dates and an area of interest. These inputs are modeled in Figure 8.5as startDate, endDate, and region respectively. The service also allows the provision ofparameters to specify which type of weather data is being requested. If no parameter
134

Chapter 8. Case study: land information service
LI-service
tpList
tForm
ι : [ TaxPayer, Field ]⟨ payer : TaxPayer | #payer (1..*),
parcel : Field | #parcel ≥ #payer, parcel ↔ payer ⟩
ι : [ TaxForm]⟨ invoice : TaxForm | #invoice = #payer ⟩
LI-Service-EP.pdf
LI-service
tpList
parcel feature
service-handler
featureselection
weatherdata
imageprocessing
changedetection
featureextraction taxation
tForm
imagery
LI-Service-IP-2.pdf
Figure 8.4: Initial internal perspective design
is provided the Weather Data Service generates only temperature data. The defaultoption of the parameter, temperature, is shown underlined.
The serviceHandler element interacts with the weatherData element at interactions wdReq
and wdResp. The serviceHandler element asks the weatherData element for the necessaryweather data through the interaction wdReq. The information attribute of interactionwdReq.serviceHandler consists of three elements, startDate, endDate, and region, and thelist of parameters, e.g., temperature and rainfall. These are used by the Weather DataService to retrieve the corresponding weather data. The interaction wdReq is followedby the interaction wdResp, which delivers the requested data.
WeatherData-Interaction-Diagram.pdf
weatherData
serviceHandler
ι : Parameters ⟨ temperature, rainfall ⟩Results ⟨ startDate : date;
endDate : date;region : geoObject ⟩
Req.serviceHandler
ι : Parameters ⟨ temperature, rainfall, humidity, … ⟩Inputs ⟨ startDate : date;
endDate : date;region : geoObject ⟩
Req.weatherDataι : Results ⟨ tempList : list;
rainfallList : list;humidity : list ⟩
Resp.weatherData
ι : Inputs ⟨ tempList : list; rainfallList : list ⟩
Resp.serviceHandler
Figure 8.5: WeatherData service interaction diagram
135

8.4. Internal perspective
tpList
parcel feature
service-handler
featureselection weatherData imagery
genAOI
genAOI-action.pdf
wdReq
wdResp
Figure 8.6: Introduction of the genAOI action
At the start of the LI-service the information corresponding to the area of interestis not known. The only information known are the identifiers of the parcels to betaxed. Therefore, before interaction wdReq.serviceHandler can take place it is necessaryto determine this area of interest such that the region element of the informationattribute of wdReq.serviceHandler can be provided.
To determine the area of interest we have to obtain the polygons corresponding to theparcels being taxed. These polygons are obtained through the Parcel Feature Service.To define the area of interest we introduce the action genAOI (see Figure 8.6).
The process of refining the interactions to define interaction contributions and insert-ing actions to carry out any additional task needed to enable the connections betweentwo elements is repeated for all the other interactions defined for the service. In thediagram of Figure 8.6, the relationships between interactions are refined through theinsertion of actions. Nevertheless, the ordering in which interactions should be exe-cuted is preserved. For simplicity reasons we have only shown the refinement of theinteraction between the serviceHandler and the weatherData elements.
8.4.3 Assignment of sub-behaviours
In this example we assume that the services provided by the ImageProcessing elementand the FeatureExtratction element are unavailable. This in order to illustrate theiterative nature of the methodology. We refined imageProcessing behaviour block byinserting a number of relevant actions that are executed by the system as a result ofthe occurrence of the initial interaction of Image Processing Service, which is calledimageList.
136
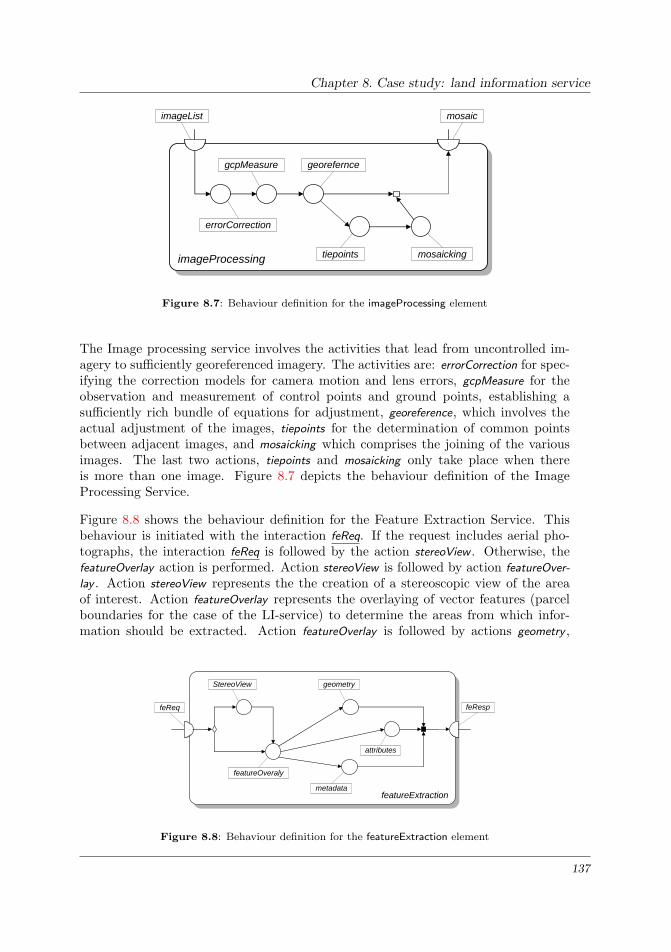
Chapter 8. Case study: land information service
tpList
parcel feature
service-handler
featureselection weatherData imagery
genAOI
genAOI-action.pdf
wdReq
wdResp
imageProcessing
mosaicimageList
gcpMeasure georefernce
errorCorrection
tiepoints mosaicking
ImageProcessing-Behaviour.pdf
Figure 8.7: Behaviour definition for the imageProcessing element
The Image processing service involves the activities that lead from uncontrolled im-agery to sufficiently georeferenced imagery. The activities are: errorCorrection for spec-ifying the correction models for camera motion and lens errors, gcpMeasure for theobservation and measurement of control points and ground points, establishing asufficiently rich bundle of equations for adjustment, georeference, which involves theactual adjustment of the images, tiepoints for the determination of common pointsbetween adjacent images, and mosaicking which comprises the joining of the variousimages. The last two actions, tiepoints and mosaicking only take place when thereis more than one image. Figure 8.7 depicts the behaviour definition of the ImageProcessing Service.
Figure 8.8 shows the behaviour definition for the Feature Extraction Service. Thisbehaviour is initiated with the interaction feReq. If the request includes aerial pho-tographs, the interaction feReq is followed by the action stereoView . Otherwise, thefeatureOverlay action is performed. Action stereoView is followed by action featureOver-
lay . Action stereoView represents the the creation of a stereoscopic view of the areaof interest. Action featureOverlay represents the overlaying of vector features (parcelboundaries for the case of the LI-service) to determine the areas from which infor-mation should be extracted. Action featureOverlay is followed by actions geometry ,
featureExtraction
FeatureExtraction-Behaviour.pdf
StereoView
featureOveraly
geometry
attributes
metadata
feReq feResp
Figure 8.8: Behaviour definition for the featureExtraction element
137

8.4. Internal perspective
attributes and metadata. These activities represent the discovery of features, the ex-traction of their geometry and attributes, and the generation of the associated meta-data according to the extraction specifications. These last three actions are followedby interaction feResp that represents the end of the process and the delivery of theextracted information.
Figures 8.7 and 8.8 represent the refinements of the imageProcessing and featureExtrac-
tion behaviours respectively. We generated this refinement in one single step, mainlybecause of the relatively simple nature of the services. For the case of a more elab-orated service this refinement can be generated in a series of consecutive refinementsteps.
138

Chapter 9
Conclusions
This chapter presents the most important conclusions reached throughout our re-search. The chapter also summarises the main contributions of the work, and outlinessome directions for further research.
9.1 General considerations
Making geo-information services available as flexible distributed applications comple-mentary to exiting geographic data sharing facilities has lately drawn the attention ofgeo-information scientists. Designing this type of systems presents various challengesdue to the complex nature of their requirements and internal structures.
Some of the main concerns around the design of these systems are, a.o.: how to specifyand describe their overall functionality; how to specify and describe the functionalityof these systems internal components; how to facilitate reuse and customisation ofthese systems.
In this thesis we show that a model-driven design approach can provide an adequateway of coping with these issues. We explain how models can be used as a means todesign the system, and to properly describe its functionality to facilitate reuse.
We emphasise that, in order to use models efficiently in the design of geo-informationsystems, these models should capture the correct and necessary detail to describethe system. We achieve this with the use of a structured methodology to guide thedevelopment of these models.
We propose a methodology for the architectural design of geo-information systemsthat is organised around system perspectives. These perspectives allow the separationof different concerns throughout the design process and the stepwise development ofa number of related system specifications.
The methodology comprises a set of design concepts and specialisations thereof, to
139

9.2. Main contributions
be used in the creation of models. We identify a set of architectural elements to rep-resent the different types of components of geo-information systems. We also definedan architectural style and a development trajectory that facilitate identification of ar-chitectural elements, and the definition of services as combinations of these elements.
Our methodology also makes use of models to facilitate the sharing of functionalityamong multiple systems and the design of elaborated services by reusing this func-tionality. This capability resides in the incorporation of a repository that allows toorganise the creation, updating, validation, accessing and sharing of service modelsand service instances. This allows the arrangement of elementary services into elabo-rated combinations for richer functionality capable of providing specialised and moreclient specific services.
9.2 Main contributions
The process of designing and creating geo-information systems that support cooper-ative work among multiple geo-service providers has, up to now, been done withoutthe support and guidance of an adequate methodology. A drawback of the approachesused by geo-information designers is that they mainly focus on the informational as-pects of the system and they have limited mechanisms for expressing or specifyingbehaviour. This can be explained by the complexity of the data structures needed tomanipulate geographic data, therefore great emphasis was placed on this aspect.
We have developed a methodology that enables the modelling of both behaviouraland informational aspects of geo-information systems in an integrated way. To derivethe methodology we first identified the specific characteristics and nature of geo-in-formation systems and studied the needs of distributed geo-information processing.
Based on this study we introduced the concept the Geo-information Service Infras-tructure (GSI). The GSI concept clearly highlights the characteristics and needs ofmodern geo-information processing. The GSI builds on the existing principles fordata sharing of the Geo-information Infrastructure concept. We use the term GSIto refer to a type of geo-information provision system from which specialised infor-mation products and services can be obtained by exploiting the artefacts of a set ofcollaborating geo-service providers. We also present a supporting architecture for thedeployment of GSI services.
Conventional geo-information systems are commonly bound to the provision of dataas their only service. The exploitable artefacts of a GSI include, in addition to data,operations, processes, value-added products and resources. These are referred to aselementary services. Within the GSI a common method is used to describe theseelementary services and their interfaces, such that they can be accessed, combinedand managed to create compound services. These services are defined to handle moreelaborated and specialised geo-processing tasks.
140

Chapter 9. Conclusions
To support the design of these type of system and more specifically of the servicesthey provide, we have developed GSDM, a methodology to guide theses systems designprocess. GSDM proposes the design of GSI services according to different levels ofconcern. Concern levels are organised into two system perspectives, the internalperspective and the internal perspective. Different specifications of the system can bedeveloped according to a stepwise approach based on these interrelated perspectives.
The external perspective aims at identifying and explicitly delimiting the scope of thesystem under development and helps determining the objectives of the developmentprocess. The internal perspective aims at describing the internal system structurein terms of compositions of simpler or more elementary architectural elements. Ar-rangements of these architectural elements form so-called service specifications. Aservice specification identifies a group of architectural elements and describes howthese elements interact to provide a required service.
GSDM distinguishes three types of architectural elements, viz. data elements, process-ing elements and connecting elements. The data elements represent the informationthat is used, manipulated and/or generated by the system. The process elementsrepresent the geo-processing capabilities of the system, which can perform transfor-mations on data elements. The connecting elements or mediators coordinate theinteractions between the other architectural elements, and provide an interface to theservice user.
Our methodology uses the so-called mediator pattern to structure compositions ofarchitectural elements. This results in the organisation of a set of services into abehaviour definition that has a single coordinating element. Among other benefits,this approach makes the service realisation accountable for the user, and facilitates theuse of workflow languages to implement the mediator behaviour, which choreographsthe use of third-party services.
The use of perspectives, stepwise refinement and the mediator pattern allows fora better control over the design process of a GSI system, such that the designercan maintain the integrity and conformance of the design itself with respect to thesuccessive transformations that an abstract design must undergo, until a concretedesign suitable for realisation is obtained.
We introduce general design concepts, based on ISDL, to represent the different ar-chitectural elements. Based on these concepts, specification techniques and guidelinesare presented. These specification techniques are targeted to the characteristics of theparticular concerns addressed in each perspective. An architectural style to guide therefinement process is also presented based on the design concepts and specificationtechniques.
At the centre of a GSI system lies the repository service. This repository allows toorganise the creation, updating, validation, accessing and sharing of service modelsand service instances. We emphasise the use of models as the mechanism to discloseinformation about services and to design more elaborated services out of combinations
141

9.3. Further Research
of existing elementary services. For this approach to work, models need not only to beinterchanged between participants, but they also have to be understood by all partiesinvolved. This is achieved by defining a metamodel on which all service models arebased. We introduce a metamodel that provides a rigourous abstract syntax fordefining models. The metamodel is used here to define a set of design concepts andtheir relationships, which one can use to produce models according to the GSI specificobjectives.
The ideas introduced in this thesis provide a reference point for future attempts toestablish geo-information infrastructures at local, regional or national level. Dataproducers and geo-service providers count with an approach and a set of guidelinesto help them establish a collaborative infrastructure, which they can use to generatevalue-added services. Those who have information infrastructures already in oper-ation can make use of these ideas to envision the next evolutionary steps for theirinfrastructures. Geo-service providers can use the method and concepts presented inthis work to specify and share each others functions and turn them into combined,distributed, collaborative services.
9.3 Further Research
The work discussed in this thesis represents the initial stages on the establishmentof a much needed methodology for the design of distributed geo-information services,and therefore, it can be continued in a number of ways. We identify a number issuesthat require further investigation: the expansion of the methodology scope, the in-corporation of quality of service criteria, the provision of automated support for thesuccess of large scale development projects, the study of the relationships betweenour methodology and the OGC reference model [OGC03b].
The scope of the methodology presented in this work concentrates on the design of geo-information systems, at the so called internal and external perspectives. These twoperspectives address the service specification and design phases of the developmentprocess. An additional contribution could be to investigate and develop harmoniousdesign trajectories and views for the business or enterprise perspective, and for thedeployment and management perspectives.
Another step forward is to identify appropriate design concepts to specify quality ofservice. We have proposed a method to enable the design of specialised tasks that areachieved by combining elementary services that together provide a desired function-ality. Since there are multiple possible configurations of elements that could complyto the same requirements, it is still necessary to identify which quality parametersshould be embedded in the designs, such that it is possible to determine the suitabilityof different designs against specific project constraints, like time or cost.
In the same way one could further investigate the use workflow management systemsto choreograph the execution of actual service instances. By mapping the designs
142

Chapter 9. Conclusions
obtained with our methodology to an adequate workflow model it would be possibleto optimise the use of resources, and to manage effectively the collaboration betweenmembers of a service infrastructure.
Automated support for the execution of large development projects, such as a fully-fledge GSI system are another area of interest. Tools to automate validation of andconformance assessment of specifications are being currently developed. Some othertools could be developed to manage the service repositories that support a GSI, forinstance, for version control.
An interesting use of automation lies in the transformation of models. We targetour methodology to facilitate the integration of distributed geo-services via the de-velopment of general models across various phases of the system lifecycle. Thesemodels are system ‘or platform’ independent. The transformation and specialisationof these models into platform specific would improve the capability of our method-ology increasing specially the potential of the service repository. In this regard onecan investigate the relationship of our methodology with the Model Driven Architec-ture [OMG01b] initiative of the Object Management Group (OMG).
Recently, the OpenGIS Consortium (OGC) [Ope04] has released a framework knownas the OGC Reference Model [OGC03b]. The main goal of this framework is tosupport the specification and implementation of interoperable solutions and applica-tions for geospatial services, data, and applications. To a certain extent, the ideabehind our methodology is similar to the OGC Refrence Model. In both cases anattempt is made to capture system information before the specification of the systemitself, although in our case we partially address issues of the business domain andwe do not address the technology domain at all. Further, both aim at producingplatform-independent specifications that can be later specialised accordingly. Finally,both rely on the use of models as a mechanism to disclose information on the sys-tem and to facilitate the chaining of services. Still, additional investigation is neededto combine the best of both approaches or to define how they can influence each other.
143

Appendix A
Services metadata
You will never be able to discover new oceansunless you have the courage to lose sight of the shore.
Hannah Whitall Smith
A.1 Service descriptions
A service represents the contribution of a system or part thereof to its surroundingenvironment that is of value to the end-user. In our case, this contribution correspondsto some functionality that is provided by a geo-information system over a network.
These services, which range in size from small low-level services that represent singleunits of functionality, to high-level services that fuse lower-level services for process-ing to provide more elaborated functions to users, encompass a serie of networkedresources.
To facilitate the search and discovery of these services, an adequate description inthe form standardised descriptive metadata has to be associated with them (see sec-tion 7.4). These service descriptions should be reach enough to convey enough infor-mation, which clients can use to discover and utilise such services. Such representa-tions should be both human and machine readable, to not only facilitate discoveryand use but also to ease their integration in elaborated end-user applications.
In our case this metadata encompasses a set of metadata elements based on the DublinCore Metadata Initiative (DCMI) [DCM03a].
The Dublin Core metadata standard is a simple yet effective element set for describinga wide range of networked resources. The Dublin Core metadata element set is astandard for cross-domain information resource description. The DCMI defines aninformation resource to be “anything that has identity”, there are no fundamentalrestrictions to the types of resources to which Dublin Core metadata can be assigned.
145

A.2. The metadata elements
A.2 The metadata elements
In this section we introduce and explain the set of metadata elements for the generaldescription of GSI services. Specific metadata elements, such as those which are onlyrelated to data services for example, are not listed here.
This metadata deals only with descriptive information about a service, the actualservice definitions are store in the repository (see appendix B).
Element Name : TitleDefinition : A name given to the resource.Comment : The element provides a name by which the resource is for-
mally known and could be identified, e.g., “Movement track-ing, guidance and control”, “Landsat TM datasets of Overi-jssel, The Netherlands”
Element Name : CreatorDefinition : The entity primarily responsible for making the content of
the resourceComment : This element should be used to indicate the person or organ-
isation that put the service together, e.g., “Alvarez Casallas,Luisa Liliana”, “Institute for Environmental studies”, “DutchTopographic Service”
Element Name : DateDefinition : A date of an event in the lifecycle of the resource.Comment : Typically this element is associated with the creation or avail-
ability of the resource.
Element Name : IdentifierDefinition : An unambiguous reference to the resource within a given con-
text.Comment : Recommended best practice is to identify the resource by
means of a string or number conforming to a formal identifi-cation system.
Element Name : DescriptionDefinition : An account of the content of the resourceComment : Some sort of explanation of what the resource does, or what
it is useful for.
Element Name : FormatDefinition : The physical or digital manifestation of the resourceComment : Typically, Format may include the media-type or dimensions
of the resource. Format may be used to identify the software,hardware, or other equipment needed to display or operatethe resource. Examples of dimensions include size and dura-tion, e.g., “image/tiff 12MB”.
146

Chapter A. Services metadata
Element Name : CoverageDefinition : The extent or scope of the content of the resource.Comment : Typically, Coverage will include spatial location (a place
name or geographic coordinates), temporal period (a periodlabel, date, or date range) or jurisdiction (such as a namedadministrative entity), for example, Thesaurus of GeographicNames of Colombia [TGNC]). Named places or time periodsshould be used in preference to numeric identifiers such assets of coordinates or date ranges.
Element Name : CategoryDefinition : A topic of the content of the resource.Comment : Subject is expressed as keywords, key phrases or classification
codes that describe a topic of the resource. Recommendedbest practice is to select a value from a controlled vocabularyor formal classification scheme, e.g. “Visualisation service”,
Element Name : RightsDefinition : Information about rights held in and over the resource.Comment : Rights information often encompasses Intellectual Property
Rights, Copyright, and various other Property Rights. If theRights element is absent, no assumptions may be made aboutany rights held in or over the resource.
Element Name : LanguageDefinition : A language of the intellectual content of the resource.Comment : Recommended best practice is to use RFC3066 which, in con-
junction with ISO639 [ISO03] define two and three primarylanguage tags with optional subtags. Examples include ”en”or ”eng” for English, ”akk” for Akkadian”, and ”en-GB” forEnglish used in the United Kingdom.
A.3 Service metadata schema
Existing approaches to the implementation of service and resource descriptions overa network include, a.o., the Web Service Description Language (WSDL) [W3C01a],the Universal Description Discovery and Integration (UDDI) standard service reg-istry [BCE+02], the Dublin Core Metadata Initiative (DCMI) [DCM03a], the servicerepresentation approach to support agent communication (AIGA) [Nol03, AIG03], theSemantic Web [BLHL01, DCM03b], the Darpa Agent Markup Language for Services(DAML-S) [DHM+01, DAM03], the Metadirectory Service (MDS) for Grid comput-ing [CFFK01]. All of these approaches define different mechanisms to encode infor-mation about network resources.
We have selected the Resource Description Framework (RDF) [W3C99] for the rep-resentation of service descriptions, and the eXtensible Markup Language (XML)
147

A.3. Service metadata schema
[W3C01b] for the encoding these descriptions. The Resource Description Frame-work (RDF) and the eXtensible Markup Language (XML) are both World Wide WebConsortium (W3C) [W3C03] recommendations for sharing information over the web.
The schema presented below includes the elements that we have defined as metadata.The schema also includes elements to encode specific information about the servicethat are based on the definition of the service repository and its associated metamodel(see section 4.4). These later elements include, a.o., inputs, parameters, results, theircorresponding data types.
For each GSI service the above information stored in XML and made available acrossthe network. When a user needs to locate a service providing a particular type offunctionality, it can search the metadata trough traditional means using any XMLenable search engine. The service metadata schema is listed below. To identify how aparticular service provider realise a service, a user can search through the informationprovided in XML containing the actual service specification (see Appendix B).
<?xml version="1.0" encoding="UTF-8"?>
<!-- ============================= -->
<!-- GSI Services Metadata -->
<!-- ============================= -->
<!-- International Institute -->
<!-- for Geo-Information Science -->
<!-- and -->
<!-- Earth Observation (ITC) -->
<!-- ============================= -->
<!-- University of Twente (UT) -->
<!-- Centre for Telematics -->
<!-- and Information Technology -->
<!-- ============================= -->
<!-- Enschede, The Netherlands -->
<!-- ============================= -->
<!-- ============jmmg============= -->
<!-- ============================= -->
<rdf:RDF xml:lang="en"
xmlns:rdf="http://www.w3.org/1999/02/22-rdf-syntax-ns#"
xmlns:rdfs="http://www.w3.org/TR/1999/PR-rdf-schema-19990303"
xmlns:wdxml="http://www.w3.org/TR/2000/WD-xmlschema-2-20000407"
xmlns:dc="http://purl.org/dc"
xmlns:gsi="http://www.itc.nl/morales/gsi/schemas">
<rdf:Description about="">
<dc:Title>Description for GSI Services definitions</dc:Title>
<dc:Creator>Javier Morales</dc:Creator>
<dc:Date>2002-11-14</dc:Date>
<dc:Format>text/xml</dc:Format>
<dc:Description>Description for GSI Services definitions</dc:Description>
<dc:Subject>Geo-information services</dc:Subject>
</rdf:Description>
<!-- =========================== -->
<!-- General service information -->
<!-- =========================== -->
148

Chapter A. Services metadata
<rdf:Description ID="Service">
<rdf:type resource="rdfs:#Class"/>
<rdfs:subClassOf rdf:resource="rdfs:#Resource"/>
<rdfs:comment>GSI services main abstract class</rdfs:comment>
</rdf:Description>
<rdf:Description ID="name">
<rdf:type resource="rdfs:#Property"/>
<rdfs:domain rdf:resource="#Service"/>
<rdfs:range rdf:resource="wdxml#string"/>
<rdfs:comment>The name of the service</rdfs:comment>
</rdf:Description>
<rdf:Description ID="creator">
<rdf:type resource="rdfs:#Property"/>
<rdfs:domain rdf:resource="#Service"/>
<rdfs:range rdf:resource="wdxml#string"/>
<rdfs:comment>The creator (e.g., company, person) of the service</rdfs:comment>
</rdf:Description>
<rdf:Description ID="version">
<rdf:type resource="rdfs:#Property"/>
<rdfs:domain rdf:resource="#Service"/>
<rdfs:range rdf:resource="wdxml#string"/>
<rdfs:comment>The version of the service</rdfs:comment>
</rdf:Description>
<rdf:Description ID="description">
<rdf:type resource="rdfs:#Property"/>
<rdfs:domain rdf:resource="#Service"/>
<rdfs:range rdf:resource="wdxml#string"/>
<rdfs:comment>A human readable description of the service.</rdfs:comment>
</rdf:Description>
<rdf:Description ID="category">
<rdf:type resource="rdfs:#Property"/>
<rdfs:domain rdf:resource="#Service"/>
<rdfs:range rdf:resource="wdxml#string"/>
<rdfs:comment>A class representing geospatial processing functions.</rdfs:comment>
</rdf:Description>
<rdf:Description ID="documentation">
<rdf:type resource="rdfs:#Property"/>
<rdfs:domain rdf:resource="#Service"/>
<rdfs:range rdf:resource="wdxml#string"/>
<rdfs:comment>A URL to documentation on the service.</rdfs:comment>
</rdf:Description>
<rdf:Description ID="inputDataType">
<rdf:type resource="rdfs:#Property"/>
<rdfs:domain rdf:resource="#DataType"/>
<rdfs:comment>The input data type that the service requires.</rdfs:comment>
</rdf:Description>
<rdf:Description ID="resultDataType">
<rdf:type resource="rdfs:#Property"/>
<rdfs:domain rdf:resource="#DataType"/>
149

A.3. Service metadata schema
<rdfs:comment>The result data type that the service produces.</rdfs:comment>
</rdf:Description>
<rdf:Description ID="numInputs">
<rdf:type resource="rdfs:#Property"/>
<rdfs:domain rdf:resource="#Service"/>
<rdfs:range rdf:resource="wdxml#integer"/>
<rdfs:comment>The number of inputs that the service requires.</rdfs:comment>
</rdf:Description>
<rdf:Description ID="numResults">
<rdf:type resource="rdfs:#Property"/>
<rdfs:domain rdf:resource="#Service"/>
<rdfs:range rdf:resource="wdxml#integer"/>
<rdfs:comment>The number of results produced by the service.</rdfs:comment>
</rdf:Description>
<rdf:Description ID="parameter">
<rdf:type resource="rdfs:#Property"/>
<rdfs:domain rdf:resource="#Service"/>
<rdfs:range rdf:resource="#Parameter"/>
<rdfs:comment>A parameter used by the service.</rdfs:comment>
</rdf:Description>
<rdf:Description ID="numParameters">
<rdf:type resource="rdfs:#Property"/>
<rdfs:domain rdf:resource="#Service"/>
<rdfs:range rdf:resource="wdxml#integer"/>
<rdfs:comment>The number of parameters required by the service.</rdfs:comment>
</rdf:Description>
<rdf:Description ID="dependantUpon">
<rdf:type resource="rdfs:#Property"/>
<rdfs:domain rdf:resource="#Service"/>
<rdfs:comment>Any dependancy that the service needs
prior to processing.</rdfs:comment>
</rdf:Description>
<rdf:Description ID="numItems">
<rdf:type resource="rdfs:#Property"/>
<rdfs:domain rdf:resource="#Service"/>
<rdfs:range rdf:resource="wdxml#integer"/>
<rdfs:comment>The number of items that the service requires.</rdfs:comment>
</rdf:Description>
<rdf:Description ID="item">
<rdf:type resource="rdfs:#Property"/>
<rdfs:domain rdf:resource="#Service"/>
<rdfs:comment>The items manipulated by the service.</rdfs:comment>
</rdf:Description>
<rdf:Description ID="GeoOperation">
<rdf:type resource="rdfs:#Class"/>
<rdfs:subClassOf rdf:resource="#Service"/>
<rdfs:comment>A class representing geo-spatial
processing functions.</rdfs:comment>
</rdf:Description>
150

Chapter A. Services metadata
<!-- ===================== -->
<!-- Data type information -->
<!-- ===================== -->
<rdf:Description ID="DataType">
<rdf:type resource="rdfs:#Class"/>
<rdfs:comment>An abstract class for data</rdfs:comment>
</rdf:Description>
<rdf:Description ID="ImageData">
<rdf:type resource="rdfs:#Class"/>
<rdfs:subClassOf rdf:resource="#DataType"/>
<rdfs:comment>A class representing image data</rdfs:comment>
</rdf:Description>
<rdf:Description ID="geoFeature">
<rdf:type resource="rdfs:#Class"/>
<rdfs:subClassOf rdf:resource="#DataType"/>
<rdfs:comment>A class representing geospatial data</rdfs:comment>
</rdf:Description>
<rdf:Description ID="geoObject">
<rdf:type resource="rdfs:#Class"/>
<rdfs:subClassOf rdf:resource="#GeoFeature"/>
<rdfs:comment>A class representing geographic objects</rdfs:comment>
</rdf:Description>
<rdf:Description ID="Theme">
<rdf:type resource="rdfs:#Class"/>
<rdfs:subClassOf rdf:resource="#GeoFeature"/>
<rdfs:comment>A class representing geographic objects
of the same type</rdfs:comment>
</rdf:Description>
<rdf:Description ID="Composite">
<rdf:type resource="rdfs:#Class"/>
<rdfs:subClassOf rdf:resource="#GeoFeature"/>
<rdfs:comment>A class representing gropus of geographic objects
of any type</rdfs:comment>
</rdf:Description>
<rdf:Description ID="Collection">
<rdf:type resource="rdfs:#Class"/>
<rdfs:subClassOf rdf:resource="#GeoFeature"/>
<rdfs:comment>A class representing groups of geographic themes</rdfs:comment>
</rdf:Description>
<rdf:Description ID="Integer">
<rdf:type resource="rdfs:#Class"/>
<rdfs:subClassOf rdf:resource="#DataType"/>
<rdfs:range rdf:resource="wdxml#integer"/>
<rdfs:comment>The integer value</rdfs:comment>
</rdf:Description>
<rdf:Description ID="Float">
<rdf:type resource="rdfs:#Class"/>
<rdfs:subClassOf rdf:resource="#DataType"/>
<rdfs:range rdf:resource="wdxml#float"/>
151

A.3. Service metadata schema
<rdfs:comment>The float value</rdfs:comment>
</rdf:Description>
<rdf:Description ID="Double">
<rdf:type resource="rdfs:#Class"/>
<rdfs:subClassOf rdf:resource="#DataType"/>
<rdfs:range rdf:resource="wdxml#double"/>
<rdfs:comment>The double value</rdfs:comment>
</rdf:Description>
<rdf:Description ID="Short">
<rdf:type resource="rdfs:#Class"/>
<rdfs:subClassOf rdf:resource="#DataType"/>
<rdfs:range rdf:resource="wdxml#short"/>
<rdfs:comment>The short value</rdfs:comment>
</rdf:Description>
<rdf:Description ID="Long">
<rdf:type resource="rdfs:#Class"/>
<rdfs:subClassOf rdf:resource="#DataType"/>
<rdfs:range rdf:resource="wdxml#long"/>
<rdfs:comment>The long value</rdfs:comment>
</rdf:Description>
<rdf:Description ID="Byte">
<rdf:type resource="rdfs:#Class"/>
<rdfs:subClassOf rdf:resource="#DataType"/>
<rdfs:range rdf:resource="wdxml#byte"/>
<rdfs:comment>The byte value</rdfs:comment>
</rdf:Description>
<rdf:Description ID="Boolean">
<rdf:type resource="rdfs:#Class"/>
<rdfs:subClassOf rdf:resource="#DataType"/>
<rdfs:range rdf:resource="wdxml#boolean"/>
<rdfs:comment>The boolean value</rdfs:comment>
</rdf:Description>
<rdf:Description ID="String">
<rdf:type resource="rdfs:#Class"/>
<rdfs:subClassOf rdf:resource="#DataType"/>
<rdfs:range rdf:resource="wdxml#string"/>
<rdfs:comment>The short value</rdfs:comment>
</rdf:Description>
<!-- ===================== -->
<!-- Parameter information -->
<!-- ===================== -->
<rdf:Description ID="Parameter">
<rdf:type resource="rdfs:#Class"/>
<rdfs:subClassOf rdf:resource="rdfs:#Resource"/>
<rdfs:comment>A class representing input parameter necessary to configure
the service.</rdfs:comment>
</rdf:Description>
</rdf:RDF>
152

Appendix B
Repository schema
In the same way as the with service metadata, we have selected the Resource De-scription Framework (RDF) and the eX- tensible Markup Language (XML) to encodeservice definitions.
Service definitions encompass the behavioural and structural vies of a service as de-fined in their corresponding internal and external perspective models. The GML (seeAppendix C) is used for the encoding of any spatial features or spatial feature defini-tions associated with a service. Table B.1 shows the structure of an XML documentthat depicts a service definition.
Table B.1: Structure of the GSDM repository documents
Section Description
Metadata Information about the service including: the creator,date of creation, general description, etc. (see sec-tion A.3)
Member elements All processing and data elements that form part of theservice, if any.
Behavioural description The behavioural definition, which corresponds to the in-ternal perspective of the service. This section describeshow the various associated elements and internal oper-ations (proper to the particular service) are assembledand cooperate to realise the corresponding service.
The metadata section represents metadata about the GSI service that can be if use fordetermining what the service does, who owns the service, when it was created, whenit was last modified, etc. (see section A.3). The metadata section also represents theinputs and the results obtained from the service.
The architectural elements section represent the necessary processing and data el-ements that form part of the current service and that are necessary to realise theservice function. This is essentially a listing of the elements required and not theorder in which they are used or associated.
153

The behavioural description represents the behaviour definition corresponding to theinternal perspective model of the service. It includes the exact arrangement of archi-tectural elements including relationships and constraints. This is considered the bestapproach that a service provider can offer to solve a problem.
Figures B.1, B.2 and B.3 depict the graphical representation of the repository schema.The complete XML repository schema is listed after the figures. The schema conformsto the metamodel for the GSI repository that was introduced in section 4.4.
154

Chapter B. Repository schema
D:\Jmmg\PhD-Thesis\Schemas\GsiIsdla.xsd 11/21/03 09:12:00
©1998-2003 Altova GmbH http://www.xmlspy.com Page 1Registered to ITC (ITC)
��������
����
∞1..
��� ���������������
���� �������� �������������
������������������
����
���������������������
����
∞0..∞1..
���������������
����
��������������������������
����
∞0..
�����������������
����
∞0..
����������������
����
∞0..
�������������
����
∞0..
�����������������������
����
���������������
����
∞1..∞0..
�����������
����
�����������
����
���������������
����
�� �����
����
���������
����
�����
����
�� �!���
����
"�� �������������
���� ����������
#�����������������
����
#���
����
$���������������
����
������������
����
������
����
∞1..
#��������������������
����
∞1..
����������������
����
Figure B.1: Repository schema - part I
155

D:\Jmmg\PhD-Thesis\Schemas\GsiIsdla.xsd 11/21/03 02:26:49
©1998-2003 Altova GmbH http://www.xmlspy.com Page 1Registered to ITC (ITC)
Attribute gsi:DataType
∞0..
gsi:DataTypeAttribute
Name
type xs:string
Value
type gsi:anyDataType
DefinedDataType
geoFeature
Composite
∞1..
gsi:geoObject
Theme gsi:geoObject
∞1..
geoObject
∞1..
∞1..
gml:_Geometry
type gml:AbstractGeometryType
gml:LineString
type gml:LineStringType
gml:LinearRing
type gml:LinearRingType
gml:MultiLineString
type gml:MultiLineStringType
gml:MultiPoint
type gml:MultiPointType
gml:MultiPolygon
type gml:MultiPolygonType
gml:Point
type gml:PointType
gml:Polygon
type gml:PolygonType
Raster
type gsi:Image
Metadata
type gsi:MetadataType
PrimitiveDataType
type xs:anyType
InformationAttribute
Item
LocationAttribute
TimeAttribute
Figure B.2: Repository schema - part II
156

Chapter B. Repository schemaD:\Jmmg\PhD-Thesis\Schemas\GsiIsdla.xsd 11/21/03 09:09:52
©1998-2003 Altova GmbH http://www.xmlspy.com Page 1Registered to ITC (ITC)
��������
����
∞1..
��� ���������������
���� �������� �������������
������������������
����
����������������
����
∞1..
�������������
���� ������������� �����
∞1..
�����������
����
∞1..
������������������
����
∞1..
����������������
����
∞1..
���������������������
����
∞0..∞1..
���������������
����
��������������������������
����
∞0..
�����������������
����
∞0..
����������������
����
∞0..
�������������
����
∞0..
�����������������������
����
Figure B.3: Repository schema - part III
<?xml version="1.0" encoding="UTF-8"?>
<!-- ============================= -->
<!-- GSI Repository Schema -->
<!-- ============================= -->
<!-- International Institute -->
<!-- for Geo-Information Science -->
<!-- and -->
<!-- Earth Observation (ITC) -->
<!-- ============================= -->
<!-- University of Twente (UT) -->
<!-- Centre for Telematics -->
<!-- and Information Technology -->
<!-- ============================= -->
<!-- Enschede, The Netherlands -->
<!-- ============================= -->
<!-- ============jmmg============= -->
<!-- ============================= -->
<xs:schema
targetNamespace="http://www.itc.nl/morales/gsi/schemas"
xmlns:gsi="http://www.itc.nl/morales/gsi/schemas"
xmlns:xs="http://www.w3.org/2001/XMLSchema"
157

xmlns:gml="http://www.opengis.net/gml"
elementFormDefault="qualified"
attributeFormDefault="unqualified">
<xs:import
namespace="http://www.opengis.net/gml"
schemaLocation="http://www.opengis.net/gml/feature.xsd"/>
<!-- ============= -->
<!-- Main Elements -->
<!-- ============= -->
<xs:element name="Service">
<xs:complexType>
<xs:sequence>
<xs:element ref="gsi:Behaviour" maxOccurs="unbounded"/>
</xs:sequence>
</xs:complexType>
</xs:element>
<xs:group name="ElementGroup">
<xs:sequence>
<xs:choice minOccurs="0" maxOccurs="unbounded">
<xs:element ref="gsi:Behaviour"/>
</xs:choice>
</xs:sequence>
</xs:group>
<xs:element name="Behaviour">
<xs:complexType>
<xs:all maxOccurs="unbounded">
<xs:element ref="gsi:FunctionalEntity"/>
</xs:all>
<xs:attribute name="eID" type="xs:ID"/>
<xs:attribute name="eName" type="xs:string"/>
</xs:complexType>
</xs:element>
<xs:element
name="MonolithicBehaviour"
type="gsi:MonolithicBehaviourType"
substitutionGroup="gsi:Behaviour"/>
<xs:element
name="StructuredBehaviour"
substitutionGroup="gsi:Behaviour">
<xs:complexType>
<xs:sequence maxOccurs="unbounded">
<xs:element ref="gsi:Behaviour" maxOccurs="unbounded"/>
<xs:element ref="gsi:Interaction" maxOccurs="unbounded"/>
<xs:element ref="gsi:CausalityCondition"
minOccurs="0" maxOccurs="unbounded"/>
</xs:sequence>
</xs:complexType>
</xs:element>
<xs:element name="ActivityUnit">
<xs:complexType>
158

Chapter B. Repository schema
<xs:sequence minOccurs="0" maxOccurs="unbounded">
<xs:element ref="gsi:Attribute"/>
</xs:sequence>
<xs:attribute name="eID" type="xs:ID"/>
<xs:attribute name="eName" type="xs:string"/>
</xs:complexType>
</xs:element>
<xs:element name="Action" substitutionGroup="gsi:ActivityUnit"/>
<xs:element name="Interaction" type="gsi:InteractionType"/>
<xs:element name="InteractionContribution" substitutionGroup="gsi:ActivityUnit"/>
<xs:element name="CausalityCondition">
<xs:complexType>
<xs:sequence maxOccurs="unbounded">
<xs:element ref="gsi:AlternativeCausalityCondition"/>
</xs:sequence>
</xs:complexType>
</xs:element>
<xs:element name="BasicCausalityCondition"/>
<xs:element name="StartCondition"
substitutionGroup="gsi:BasicCausalityCondition"/>
<xs:element name="EnablingCondition"
substitutionGroup="gsi:BasicCausalityCondition"/>
<xs:element name="DisablingCondition"
substitutionGroup="gsi:BasicCausalityCondition"/>
<xs:element name="Attribute">
<xs:complexType>
<xs:sequence>
<xs:element ref="gsi:DataType"/>
</xs:sequence>
</xs:complexType>
</xs:element>
<xs:element name="InformationAttribute" substitutionGroup="gsi:Attribute"/>
<xs:element name="LocationAttribute" substitutionGroup="gsi:Attribute"/>
<xs:element name="TimeAttribute" substitutionGroup="gsi:Attribute"/>
<xs:element name="Item" substitutionGroup="gsi:InformationAttribute"/>
<xs:element name="DataType">
<xs:complexType>
<xs:sequence minOccurs="0" maxOccurs="unbounded">
<xs:element ref="gsi:DataTypeAttribute"/>
</xs:sequence>
</xs:complexType>
</xs:element>
<xs:element name="DataTypeAttribute">
<xs:complexType>
<xs:sequence>
<xs:element name="Name" type="xs:string"/>
<xs:element name="Value" type="gsi:anyDataType"/>
</xs:sequence>
159

</xs:complexType>
</xs:element>
<xs:element name="PrimitiveDataType" type="xs:anyType"
substitutionGroup="gsi:DataType"/>
<xs:element name="DefinedDataType" substitutionGroup="gsi:DataType"/>
<xs:element name="FunctionalEntity" type="gsi:FunctionalEntityType"/>
<xs:element name="geoFeature" substitutionGroup="gsi:DefinedDataType"/>
<xs:element name="geoObject" substitutionGroup="gsi:geoFeature">
<xs:complexType>
<xs:choice maxOccurs="unbounded">
<xs:sequence maxOccurs="unbounded">
<xs:element ref="gml:_Geometry"/>
</xs:sequence>
<xs:sequence>
<xs:element name="Raster" type="gsi:Image"/>
</xs:sequence>
<xs:element name="Metadata" type="gsi:MetadataType"/>
</xs:choice>
</xs:complexType>
</xs:element>
<xs:element name="Theme" substitutionGroup="gsi:geoFeature">
<xs:complexType>
<xs:sequence>
<xs:element ref="gsi:geoObject" maxOccurs="unbounded"/>
</xs:sequence>
<xs:attribute name="Semantic" type="xs:string"/>
</xs:complexType>
</xs:element>
<xs:element name="Collection">
<xs:complexType>
<xs:sequence>
<xs:element ref="gsi:Theme" maxOccurs="unbounded"/>
</xs:sequence>
</xs:complexType>
</xs:element>
<xs:element name="Composite" substitutionGroup="gsi:geoFeature">
<xs:complexType>
<xs:all maxOccurs="unbounded">
<xs:element ref="gsi:geoObject"/>
</xs:all>
</xs:complexType>
</xs:element>
<!-- =============== -->
<!-- Primitive Types -->
<!-- =============== -->
<xs:complexType name="ElementContainer">
<xs:choice>
<xs:group ref="gsi:ElementGroup"/>
</xs:choice>
</xs:complexType>
160

Chapter B. Repository schema
<xs:complexType name="MonolithicBehaviourType">
<xs:complexContent>
<xs:extension base="gsi:AbstractElementType">
<xs:sequence>
<xs:element ref="gsi:CausalityCondition" minOccurs="0"/>
<xs:element ref="gsi:ActivityUnit" maxOccurs="unbounded"/>
</xs:sequence>
</xs:extension>
</xs:complexContent>
</xs:complexType>
<xs:complexType name="InteractionType">
<xs:complexContent>
<xs:extension base="gsi:AbstractElementType">
<xs:sequence>
<xs:element ref="gsi:InteractionContribution"
minOccurs="2" maxOccurs="unbounded"/>
</xs:sequence>
</xs:extension>
</xs:complexContent>
</xs:complexType>
<xs:complexType name="anyDataType"/>
<xs:complexType name="Image"/>
<xs:complexType name="FunctionalEntityType">
<xs:complexContent>
<xs:extension base="gsi:AbstractElementType"/>
</xs:complexContent>
</xs:complexType>
<xs:complexType name="MetadataType">
<xs:sequence>
<xs:element name="Identifier" maxOccurs="unbounded"/>
<xs:element name="Creator"/>
<xs:sequence>
<xs:element name="Content" minOccurs="0" maxOccurs="unbounded"/>
<xs:element name="CollectionDate" minOccurs="0" maxOccurs="unbounded"/>
<xs:element name="SpatialExtent" minOccurs="0" maxOccurs="unbounded"/>
<xs:element name="Quality" minOccurs="0" maxOccurs="unbounded"/>
<xs:element name="ReferenceSystem" minOccurs="0" maxOccurs="unbounded"/>
<xs:element name="SpatialResolution" minOccurs="0" maxOccurs="unbounded"/>
<xs:element name="TemporalResolution" minOccurs="0" maxOccurs="unbounded"/>
<xs:element name="SpatialRepresentation" minOccurs="0" maxOccurs="unbounded"/>
<xs:element name="Distribution" minOccurs="0"/>
</xs:sequence>
</xs:sequence>
</xs:complexType>
<xs:complexType name="BehaviourType">
<xs:complexContent>
<xs:extension base="gsi:AbstractElementType"/>
</xs:complexContent>
</xs:complexType>
<xs:element name="AlternativeCausalityCondition">
<xs:complexType>
161
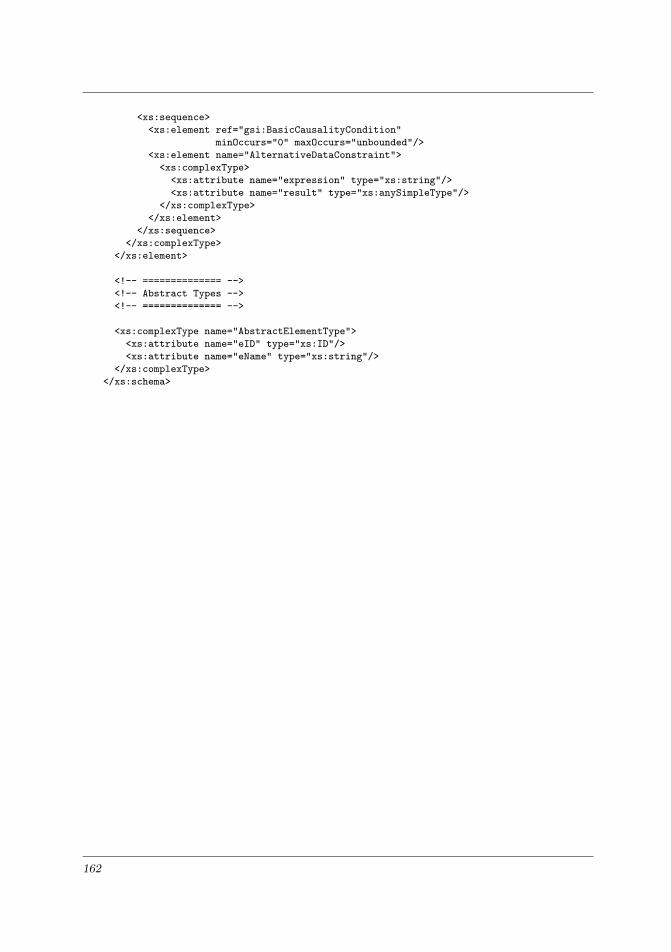
<xs:sequence>
<xs:element ref="gsi:BasicCausalityCondition"
minOccurs="0" maxOccurs="unbounded"/>
<xs:element name="AlternativeDataConstraint">
<xs:complexType>
<xs:attribute name="expression" type="xs:string"/>
<xs:attribute name="result" type="xs:anySimpleType"/>
</xs:complexType>
</xs:element>
</xs:sequence>
</xs:complexType>
</xs:element>
<!-- ============== -->
<!-- Abstract Types -->
<!-- ============== -->
<xs:complexType name="AbstractElementType">
<xs:attribute name="eID" type="xs:ID"/>
<xs:attribute name="eName" type="xs:string"/>
</xs:complexType>
</xs:schema>
162

Appendix C
GML Overview
We adopted GML for the encoding of geographic features, therefore, here we providea short description of the most important features of GML. The Geography MarkupLanguage (GML) is an XML encoding for the transport and storage of geographicinformation, including both the spatial and non-spatial properties of geographic fea-tures. The GML specification [OGC03a] defines the XML Schema syntax, mecha-nisms, and conventions that:
• Enable the creation and maintenance of linked geographic application schemasand datasets;
• Support the storage and transport of application schemas and data sets;
• Support the description of geospatial application schemas for specialised do-mains and information communities;
• Increase the ability of organisations to share geographic application schemasand the information they describe.
• Provide an open, vendor-neutral framework for the definition of geospatial ap-plication schemas and objects;
• Allow profiles that support proper subsets of GML framework descriptive capa-bilities;
GML was developed with a number of explicit design goals, a few of which overlapthe objectives of XML itself:
• provide a means of encoding spatial information for both data transport anddata storage, especially in a wide-area Internet context;
• be sufficiently extensible to support a wide variety of spatial tasks, from por-trayal to analysis;
163

• establish the foundation for Internet GIS in an incremental and modular fashion;
• allow for the efficient encoding of geo-spatial geometry (e.g. data compression);
• provide easy-to-understand encodings of spatial information and spatial rela-tionships;
• be able to separate spatial and non-spatial content from data presentation(graphic or otherwise);
• permit the easy integration of spatial and non-spatial data, especially for casesin which the non-spatial data is XML-encoded;
• be able to readily link spatial (geometric) elements to other spatial or non-spatialelements.
• provide a set common geographic modeling objects to enable interoperability ofindependently-developed applications.
The encoding of spatial features using GML requires is based on two XML Schemas:the GML Feature Schema and the GML Geometry Schema; with these two simpleschemas it is possible to encode a wide variety of geospatial information.
The GML Geometry schema includes type definitions for both abstract geometryelements, concrete (multi) point, line and polygon geometry elements, as well ascomplex type definitions for the underlying geometry types. Figures C.1 and C.3depict the GML Geometry schema.
In the feature schema, the link of a feature with a geometry is modeled as an associa-tion class called, geometric property. The Feature schema uses the ¡include¿ elementto bring in the definitions and declarations contained in the Geometry schema, anduse them for the definitions of the features’ geometry property. Figure C.2 shows arepresentation of the GML Feature schema.
164

Chapter C. GML Overview
AbstractGeometry
Point
GeometryAssociation
4..*
LineString
Box
LinearRing
Coord
1 2..*
2
Polygon
-innerBoundaryls 0..* -outerBoundaryls1
AbstractGeometryCollection
GeometryCollection
AssociationAttributeGroup
MultiPoint
MultiLineString
MultiPolygon
0..1
1..*
GML-Geometry-Schema.pdf
Figure C.1: GML Geometry schema (class representation)
BoundingSpace
AbstractGeometry
PointProperty
LineStringProperty
PolygonProperty
GeometryProperty
MultiPointProperty
MultiLineStringProperty
MultiPolygonProperty
AbstractFeature
FeatureAssociation
AssociationAttributeGroup0..1
0..1
0..*
AbstractFeatureCollection
-_geometryProperty
-featureMember
AbstractFeatureCollectionBase
*
GML-Feature-Schema.pdf
Figure C.2: GML Feature schema (class representation)
165

D:\Jmmg\PhD-Thesis\Schemas\feature.xsd 11/25/03 01:10:45
©1998-2003 Altova GmbH http://www.xmlspy.com Page 1Registered to ITC (ITC)
geometryProperty
type gml:GeometryPropertyType
gml:GeometryPropertyType
gml:_Geometry
type gml:AbstractGeometryType
gml:LineString
type gml:LineStringType
gml:LineStringType
gml:coord
type gml:CoordType
∞2..
gml:coordinates
type gml:CoordinatesType
gml:LinearRing
type gml:LinearRingType
gml:MultiLineString
type gml:MultiLineStringType
gml:MultiPoint
type gml:MultiPointType
gml:MultiPointType
pointMember
∞1..
gml:MultiPolygon
type gml:MultiPolygonType
gml:MultiPolygonType
polygonMember
∞1..
gml:Polygon
type gml:PolygonType
gml:Point
type gml:PointType
gml:PointType
gml:coord
type gml:CoordType
gml:coordinates
type gml:CoordinatesType
gml:Polygon
type gml:PolygonType
gml:PolygonType
outerBoundaryIsgml:LinearRing
type gml:LinearRingType
innerBoundaryIs
∞0..
Figure C.3: GML Geometry schema
166

Bibliography
[AC03] Luisa Liliana Alvarez Casallas. Geoinformation Virtual Enterprises De-sign and Process Management. Master’s thesis, International Institutefor Geo-Information Science and Earth Observation ITC, Enschede, TheNetherlands, March 2003.
[ACD+03] Tony Andrews, Francisco Curbera, Hitesh Dholakia et al. Business Pro-cess Execution Language: for Web Services (BPEL4WS). BEA Sys-tems, International Business Machines Corporation, Microsoft Corpora-tion, SAP AG, Siebel Systems., May 2003. Version 1.1.
[AD97] T. Adams and S. Dworkin. WfMC Workflow Handbook, chapter WorkflowInteroperability Between Businesses, pages 211–221. John Wiley & Sons,1997.
[Ade01] Martin Ader. WfMC: Workflow handbook 2001, chapter Technologiesfor the Virtual Enterprise, pages 19–38. Future Strategies Inc., Florida,United States of America, 2001.
[AG96] Robert Allen and David Garlan. ‘A case study in architectural modelling:The aegis system.’ In Proceedings of the Eighth International Workshopon Software Specification and Design (IWSSD-8), pages 6–15. Paderborn,Germany, March 1996.
[AHPW97] G. Abeysinghe, P. Henderson, K. Phalp and R. Walters. ‘An audiencecentred approach to modelling for business process reengineering.’ In5th International Conference on ReTechnologies for Information Systems(ReTIS 97). Klagenfurt, Austria, 1997.
[AIG03] ‘Agent-based Imagery and Geospatial Processing Architecture (AIGA).’aiga.cs.gmu.edu, accessed on January 2003.
[Ala01] N. Alameh. Scalable and Extensible Infrastructures for Distributing In-teroperable Geographic Information Services on the Internet. Ph.D. the-sis, Massachusetts Institute of Technology (MIT), Massachussets, UnitedStates of America, 2001.
167

Bibliography
[All97] Robert J. Allen. A Formal Approach to Software Architecture. Ph.D.thesis, School of Computer Science, Carnegie Mellon University, Pitsburg,United States of America, May 1997. CMU-CS-97-144.
[AN01] Jim Arlow and Ila Neustadt. UML and the Unified Process: PracticalObject-Oriented Analysis and Design. Object Technology Series. Addi-son-Wesley Pub. Co., Reading, Massachusetts, 1st edition, 2001. ISBN0-201-77060-1.
[ANZ02] ‘The spatial information council (ANZLIC).’ www.anzlic.org.au, ac-cessed on October 2002. Australia & New Zealand.
[Aro95] Stan Aronoff. Geographic Information Systems: A Management Perspec-tive. WDL Publications, Ottawa, Canada, 1995. ISBN 0-92184-91-1.
[ARR96] Colin G. Armistead, Philip Rowland and A. P. Rowland. Managing Busi-ness Processes: BPR and Beyond. John Wiley & Sons Ltd., London,United Kingdom, October 1996. ISBN 0-471-95490-X.
[BB90] Barry Boehm and Frank Belz. ‘Experiences with the spiral model as aprocess model generator.’ In Proceedings of the 5th international softwareprocess workshop on Experience with software process models, pages 43–45. IEEE Computer Society Press, Kennebunkport, Maine, United Statesof America, 1990.
[BB94] O. Biberstein and D. Buchs. ‘An object-oriented specification languagebased on hierarchical algebraic Petri nets.’ In Working papers of the in-ternational Workshop on Information System Correctness and ReusabilityIS-CORE’94, edited by R. Wieringa and R. Feenstra, pages 47–62. Ams-terdam, The Netherlands, 1994.
[BB95] Alex Bakman and Alexander Bakman. How to Deliver Client/Server Ap-plications That Work. Prentice-Hall International, Great Britain, 1995.ISBN 0-13-304601-X.
[BBG97] Olivier Biberstein, Didier Buchs and Nicolas Guelfi. ‘Object-oriented netswith algebraic specifications: The CO-OPN/2 formalism.’ In Advances inPetri Nets on Object-Orientation, edited by G. Agha and F. De Cindio.Springer-Verlag, 1997.
[BBS+02] Christoph Brox, Yaser Bishr, Kristian Senkler, Katharina Zens andWerner Kuhn. ‘Toward a geospatial data infrastructure for Northrhine-Westphalia.’ Computers, Environment and Urban Systems, Vol. 26(1):19–37, 2002.
[BCE+02] Tom Bellwood, Luc Clement, David Ehnebuske et al. Universal Descrip-tion, Discovery and Integration (UDDI). Published specification, Accen-ture, Ariba, Inc., Commerce One, Inc., Fujitsu Limited, Hewlett-PackardCompany, i2 Technologies, Inc., Intel Corporation, International BusinessMachines Corporation, Microsoft Corporation, Oracle Corporation, SAPAG, Sun Microsystems, Inc., and VeriSign, Inc., July 2002. Version 3.0.
168

Bibliography
[BCK03] Len Bass, Paul Clements and Rick Kazman. Software Architecture inPractice. Addison-Wesley Pub. Co., Reading, Massachusetts, 2nd edition,April 2003. ISBN 0-321-15495-9.
[Ber96] Alex Berson. Client/Server Architecture. McGraw Hill, New York, UnitedStates of America, 2nd edition, 1996. ISBN 0-07-005664-1.
[BFH03] Fran Berman, Geoffrey Fox and Tony Hey. Grid Computing: Makingthe Global Infrastructure a Reality. Wiley Series in Communications &Distributed Systems. John Wiley & Sons Ltd., West Sussex, England,April 2003. ISBN 0-470-85319-0.
[BG00] Didier Buchs and Nicolas Guelfi. ‘A formal specification framework forobject-oriented distributed systems.’ IEEE Transactions on Software En-gineering, Vol. 26(No. 7):635–651, July 2000.
[Bib97] Olivier Biberstein. An Object-Oriented Formalism for the Specification ofConcurrent Systems. Ph.D. thesis, University of Geneva, Geneve, Switzer-land, July 1997. Ph.D. Thesis, no. 2919.
[Bis97] Yaser Bishr. Semantic Aspects of Interoperable GIS. Ph.D. thesis, Wa-geningen Agricultural University, Wageningen, The Netherlands, Novem-ber 1997. ITC Dissertation No. 47.
[BKR99] Y. Bishr, W. Kuhn and M. Radwan. Interoperating Geographic Informa-tion Systems, chapter Probing the semantic content of information com-munities – a first step toward semantic interoperability, pages 211–221.Kluwer Academic Publishers, 1999. ISBN 0792384369.
[BLHL01] Tim Berners-Lee, James Hendler and Ora Lassila. ‘The semantic web.’Scientific American, May 2001.
[BN96] Peter Bernus and Laszlo Nemes. ‘Modelling and methodologies for en-terprise integration.’ In Proceedings of the International Federation forInformation Processing (IFIP) Conference on Models and Methodologiesfor Enterprise Integration. Chapman & Hall, 1996.
[Boe88] Barry W. Boehm. ‘A spiral model of software development and enhance-ment.’ In Computer, volume 21, pages 61–72. IEEE Computer SocietyPress, 1988.
[Boe96] Barry Boehm. ‘Anchoring the software process.’ IEEE Software,Vol. 13(No. 4):73–82, July 1996.
[Boo94] Grady Booch. Object-Oriented Analysis and Design with Applications.Addison-Wesley Pub. Co., 2nd edition, February 1994. ISBN 0-8053-5340-2.
[Bra94] Michael H. Brackett. Data Sharing: Using A Common Data Architecture.John Wiley & Sons Ltd., New York, United States of America, March1994. ISBN 0-471-30993-1.
169

Bibliography
[Bra01] Eric J. Braude. Software Engineering: An Object-Oriented Perspective.John Wiley & Sons Ltd., New York, United States of America, 2001. ISBN0-471-32208-3.
[Bro04] Alan Brown. ‘An introduction to Model Driven Architecture part I: MDAand todays systems.’ The Rational Edge, February 2004.
[BRP97] Yaser Bishr, Mostafa Radwan and J. Pandya. ‘SemWeb - a prototypefor seamless sharing of geoinformation on the World Wide Web in aclient/server architecture.’ In Proceedings of the Joint European Con-ference and Exhibition on Geographical Information, volume Vol. 1, pages145–154. Vienna, Austria, April 1997.
[BSC94] Rosalinda Barden, Susan Stepney and David Cooper. Z in Practice.Prentice-Hall International, Great Britain, 1994. ISBN 0-13-124934-7.
[By91] Rolf A. de By. The Integration of Specification Aspects in Database Design.Ph.D. thesis, University of Twente, Enschede, The Netherlands, October1991.
[By01] Rolf A. de By (editor). Principles of Geographic Information Systems. ITCEducational Textbook Series. International Institute for Geo-InformationScience and Earth Observation ITC, Enschede, The Netherlands, 2001.ISBN 90-6164-184-5.
[Cai96] Luıs Caires. ‘A language for the logical specification of processes andrelations.’ In Proceedings of the Algebraic and Logic Programming Inter-national Conference ALP’96, edited by Michael Hanus, volume 6, pages150–164. Springer-Verlag, 1996.
[CD00] John Cheesman and John Daniels. UML Components: A Simple Pro-cess for Specifying Component-Based Software. The Component SoftwareSeries. Addison-Wesley Pub. Co., New Jersey, United States of America,2000. ISBN 0-201-70851-5.
[CDK01] George Coulouris, Jean Dollimore and Tim Kindberg. Distributed Sys-tems: Concepts and Design. International Computer Science Series. Ad-dison-Wesley Pub. Co., Harlow, England, 3rd edition, 2001. ISBN 0201-61918-0.
[CFFK01] Karl Czajkowskiy, Steven Fitzgeraldz, Ian Fosterx and Carl Kesselman.‘Grid information services for distributed resource sharing.’ In Proceedingsof the 10th IEEE Symposium on High Performance Distributed Comput-ing, pages 181–194. IEEE Press, August 2001.
[Cod70] E. F. Codd. ‘A relational model of data for large shared data banks.’ Com-munications of the ACM, Vol. 13(No. 6):377–387, June 1970. Associationfor Computing Machinery, Inc.
170

Bibliography
[CZ96] Edward Chan and Rupert Zhu. ‘Ql/g - a query language for geometricdata bases.’ In Proceedings of the 1st International Conference on GISin Urban Regional and Environment Planning, pages 271–286. Samos,Greece, April 1996.
[DAM03] ‘Darpa Agent Markup Language for Services (DAML-S).’ www.daml.org/services, accessed on September 2003.
[Dav93] Thomas H. Davenport. Process Innovation: Reengineering Work ThroughInformation Technology. Harvard Business School Press, Boston, Mas-sachusetts, 1993. ISBN 0-87584-366-2.
[Dav99] Georgia Davanelou. Simulation of Business Process Scenarios for theEvaluatin of Cadastral Operations. Master’s thesis, International Institutefor Geo-Information Science and Earth Observation ITC, Enschede, TheNetherlands, February 1999.
[DCM03a] ‘Dublin Core Metadata Initiative.’ dublincore.org, accessed on Septem-ber 2003.
[DCM03b] ‘The Semantic Web community portal.’ www.semanticweb.org, accessedon November 2003.
[DDT02] H. M. Deitel, P. J. Deitel B. Duwaldt and L. K. Trees. Web Services:A Technical Introduction. DeitelTM Developer Series. Prentice-Hall In-ternational, New Jersey, United States of America, August 2002. ISBN0-13-046135-0.
[Dem00] Michael N. Demers. Fundamentals od Geographic Information Systems.John Wiley & Sons Ltd., New York, United States of America, 2nd edition,2000. ISBN 0-471-31423-4.
[DH00] Scott A. DeLoach and Thomas C. Hartrum. ‘A theory-based representa-tion for object-oriented domain models.’ IEEE Transactions on SoftwareEngineering, Vol. 26(No. 6):500–517, June 2000.
[DHM+01] G. Denker, J.R. Hobbs, D. Martin, S. Narayana and R. Waldinger. ‘Ac-cessing information and services on the daml-enabled web.’ In The SecondInternational Workshop on the Semantic Web. 2001.
[Dil94] Antoni Diller. Z An introduction to Formal Methods. John Wiley & SonsLtd., Chichester, England, 2nd edition, 1994. ISBN 0-471-93973-0.
[DM99] Giovana Di Marzo. Stepwise Refinment of Formal Specifications on LogicalFormulae: From CO-OPN/2 specifications to Java programs. Ph.D. thesis,Department d’Informatique, Ecole Polytechnique Federale de Lausanne,Lausanne, Switzerland, January 1999. Ph.D. Thesis, no. 1931.
[Dou01] Nebert D. Douglas. Developing Spatial Data Infrastructures: The SDICookbook. Technical report, Global Spatial Data Infrastructure Organi-zation, May 2001.
171

Bibliography
[D’S01] Desmond D’Souza. ‘Model-driven architecture and integration: Opportu-nities and challenges.’ www.kinetium.com, March 2001.
[Dur92] R. C. J. Dur. Business Reengineering in Information Intensive Organisa-tions. Ph.D. thesis, Technical University Delft, Delft, The Netherlands,1992.
[DW99] Desmond Francis D’Souza and Alan Cameron Wills. Objects, Compo-nents and Frameworks with UML: The Catalysis Approach. The Addison-Wesley object technology series. Addison-Wesley Pub. Co., Reading, Mas-sachusetts, 1999. ISBN 0-201-31012-0.
[EJL+99] Henk Eertink, Wil Janssen, Paul Oude Luttighuis, Wouter B. Teeuw andChris A. Vissers. ‘A business process design language.’ In World Congresson Formal Methods (1), pages 76–95. 1999.
[EN00] Ramez Elmasri and Shamkant B. Navathe. Fundamentals of DatabaseSystems. Addison-Wesley Pub. Co., Reading, Massachusetts, 3rd edition,2000. ISBN 0-8053-1755-4.
[EP98] Hans-Erik Eriksson and Magnus Penker. UML Toolkit. John Wiley &Sons Ltd., Toronto, Canada, 1998. ISBN 0-471-19161-2.
[Far02] Clever Ricardo Guareis de Farias. Architectural Design of Groupware Sys-tems: a Component-Based Approach. Ph.D. thesis, University of Twente,Enschede, The Netherlands, May 2002. Ph.D. Thesis, no. 01-38.
[FGD98] Content Standard for Digital Geospatial Metadata (CSDGM). FGDC-STD-001-1998, Federal Geographic Data Committee (FGDC), Washing-ton, D.C., June 1998.
[FGD03] ‘National Spatial Data Infrastructure (NSDI).’ www.fgdc.gov, accessedon February 2003. Federal Geographic Data Committee (FGDC), UnitedStates of America.
[FH93] Peter Feiler and Watts Humphrey. ‘Software process development andenactment concepts and definitions.’ In Proceedings of the 2nd Interna-tional Conference on the Software Process, pages 28–40. IEEE ComputerSociety Press, Berlin, Germany, February 1993.
[Fie00] Roy Thomas Fielding. Architectural Styles and the Design of Network-based Software Architectures. Ph.D. thesis, University of California, Irvine,California, 2000.
[Fis00] Layna Fischer. Excellence in Practice: Innovation and Excellence inWorkflow Process and Knowledge Management, volume III. Future Strate-gies Inc., Lighthouse Point, Florida, 2000. ISBN 0-9640233-8-5.
[Fis01] —. WfMC: Workflow handbook 2001. Future Strategies Inc., Florida,United States of America, 2001. ISBN 0-9703509-0-2.
172

Bibliography
[FP94] Luıs Ferreira Pires. Architectural Notes: a Framework for DistributedSystems Development. Ph.D. thesis, University of Twente, Enschede, TheNetherlands, September 1994. Ph.D. Thesis, no. 94-01.
[FPSFAA03] Luıs Ferreira Pires, Marten van Sinderen, Clever Ricardo Guareis deFarias and Joao Paulo Andrade Almeida. Use of Models and ModellingTechniques for Service Development. Centre for Telematics and Infor-mation Technology, University of Twente, Enschede, The Netherlands,September 2003. Technical report.
[Fra96] L. Franken. Quality of Service Management: A Model-Bases Approach.Ph.D. thesis, Centre for Telematics and Information Technology, TwenteUniversity, Enschede, The Netherlands, 1996.
[FS00] Martin Fowler and Kendall Scott. UML Distilled: A Brief Guide to theStandard Object Modelling Language. Object Technology Series. AWpc,New Jersey, United States of America, 2nd0 edition, 2000. ISBN 0-201-65783-X.
[FSJ99] Mohamed E. Fayad, Douglas C. Smith and Ralph E. Johnson. Implement-ing Application Frameworks: Object-Oriented Frameworks at Work. JohnWiley & Sons Ltd., New York, United States of America, 1999. ISBN0-471-25201-8.
[FWQFP97] H. M. Franken, M. K. de Weger, D. A. C. Quartel and L. Ferreira Pıres.‘On engineering support for business process modelling and redesign.’ InModelling Techniques for Business Process Re-engineering and Bench-marking, edited by Guy Doumeingts and Jim Browne, chapter 10, pages103–120. Chapman & Hall, London, UK, 1st edition, 1997. ISBN 0-412-78910-8.
[Gar95] David Garlan. ‘What is style?’ In Proceedings of the Dagstuhl Workshopon Software Architecture. Saarbruecken, Germany, February 1995.
[GDI02] ‘Geodateninfrastruktur Nordrhein-Westfalen (GDI-NRW).’ gdi-nrw.uni-muenster.de/index.html, accessed on December 2002.
[GHS95] Dimitrios Georgakopoulos, Mark F. Hornick and Amit P. Sheth. ‘Anoverview of workflow management: From process modelling to workflowautomation infrastructure.’ In Distributed and Parallel Databases, vol-ume 3, pages 119–153. Kluwer Publishers, United States of America, 1995.
[GM00] Richard Groot and John McLaughlin. Geospatial Data Infrastructure:Concepts, cases and good practice. Oxford University Press, New York,United States of America, 2000. ISBN 0-19-823381-7.
[Gra01] Ian Graham. Object-Oriented Methods: Principles and Practice. TheAddison-Wesley object technology series. Addison-Wesley Pub. Co., Read-ing, Massachusetts, 3rd edition, 2001. ISBN 0-201-61913-X.
173

Bibliography
[GS93] David Garlan and Mary Shaw. ‘An introduction to software architecture.’In Advances in Software Engineering and Knowledge Engineering, editedby V. Ambriola and G. Tortora, pages 1–39. World Scientific PublishingCompany, Singapore, 1993.
[GTM99] James E. Goldman, Rawles Phillip T. and Julie R. Mariga. Client/ServerInformation Systems: A Business-Oriented Apporach. John Wiley & SonsLtd., New York, United States of America, 1999. ISBN 0-471-29654-6.
[Haw01] Igor Hawryszkiewycz. Introduction to Systems Analysis and Design.Prentice-Hall International, 5th edition, February 2001. ISBN 1740092805.
[HBCS03] Richard Hull, Michael Benedikt, Vassilis Christophides and Jianwen Su.‘E-services: A look behind the curtain.’ In Proceedings of the twentysecond ACM SIGMOD-SIGACT-SIGART symposium on principles ofdatabase systems, pages 1–14. ACM Press, San Diego, California, June2003.
[HC01] Michael Hammer and James A. Champy. Reengineering the Corporation:A Manifesto for Business Revolution. HarperBusiness, New York, UnitedStates of America, revised edition, June 2001. ISBN 0-06-662112-7.
[Hee94] K. M. van Hee. Information System Engineering: a Formal Approach.Cambridge University Press, New York, United States of America, 1994.ISBN 0-521-45514-6.
[HENN97] H. James Harrington, Erik K. C. Esseling, Harm van Nimwegen and Nicovan Nimwegen. Business Process Improvement Workbook: Documenta-tion, Analysis, Design, and Management of Business Process Improve-ment. McGraw-Hill Trade, April 1997. ISBN 0-07-026779-0.
[HGS95] Ralf Hartmut Guting and Markus Schneider. ‘Realm-based spatial datatypes: The ROSE algebra.’ VLDB Journal, Vol. 4(No. 2):243–286, 1995.
[Hil99] Rich Hilliard. ‘Views and viewpoints in software systems architecture.’ InFirst Working IFIP Conference on Software Architecture. San Antonio,1999.
[HK01] H. Hayami and M. Katsumata. WfMC: Workflow handbook 2001, chap-ter Interworkflow: A challenge for Business-to-Business Electronic Com-merce. Future Strategies Inc., Florida, United States of America, 2001.ISBN 0-9703509-0-2.
[Hoq00] Faisal Hoque. e-Enterprise: Business, Models,Architectues and Compo-nents. Breakthroughs in Application Development Series. Cambridge Uni-versity Press, New York, United States of America, 2000. ISBN 0-521-77487-X.
[ICD02] ‘Infraestructura Colombiana de Datos Espaciales (ICDE).’ codazzi4.igac.gov.co/icde, accessed on June 2002. Colombia.
174

Bibliography
[IEE00] IEEE Computer Society. IEEE Recommended Practice for ArchitecturalDescription of Software-Intensive Systems. Technical report, The Insti-tute of Electrical and Electronics Engineers, Inc., September 2000.
[ISO96a] ISO/IEC. 10746-2: Information Technology − Open Distributed Process-ing − Reference Model: Foundations. Draft International Standard, Inter-national Organization for Standardization, Geneve, Switzerland, Septem-ber 1996.
[ISO96b] —. 10746-3: Information Technology − Open Distributed Processing −Reference Model: Architecture. Draft International Standard, Interna-tional Organization for Standardization, Geneve, Switzerland, December1996.
[ISO98a] —. 10746-1: Information Technology − Open Distributed Processing −Reference Model: Overview. Draft International Standard, InternationalOrganization for Standardization, Geneve, Switzerland, December 1998.
[ISO98b] —. 10746-4: Information Technology − Open Distributed Processing −Reference Model: Architecture semantics. Draft International Standard,International Organization for Standardization, Geneve, Switzerland, De-cember 1998.
[ISO01a] ISO/DIS 19110: Geographic information − Feature cataloguing method-ology. Draft International Standard, ISO/TC 211, Geneve, Switzerland,December 2001.
[ISO01b] ISO/DIS 19119: Geographic information − Services. Draft InternationalStandard, ISO/TC 211, Geneve, Switzerland, December 2001.
[ISO01c] ISO/FDIS 19115: Geographic information − Metadata. Final Draft In-ternational Standard, ISO/TC 211, Geneve, Switzerland, December 2001.
[ISO02] ISO 19101: Geographic information − Reference model. InternationalStandard, ISO/TC 211, Geneve, Switzerland, December 2002.
[ISO03] ‘ISO 639.2 – codes for the representation of names of languages.’ www.loc.gov/standards/iso639-2/langhome.html, accessed on November 2003.
[JBR99] Ivar Jacobson, Grady Booch and James Rumbaugh. The Unified SoftwareDevelopment Process. The Addison-Wesley object technology series. Addi-son-Wesley Pub. Co., Reading, Massachusetts, 1999. ISBN 0-201-57169-2.
[JCJ92] Ivar Jacobson, Magnus Christerson and Patrik Jonsson. Object-OrientedSoftware Engineering - A Use Case Driven Approach. Addison-WesleyPub. Co., Boston, Massachusetts, June 1992. ISBN 0-201-54435-0.
[JF96] Henk Jonkers and Henry M. Franken. ‘Quantitative modelling and analy-sis of business processes.’ In Simulation in Industry: Proceedings of the 8th
European Simulation Symposium, volume Vol. I, pages 175–179. Bruzzoneand E.Ker-ckho’s eds., 1996.
175

Bibliography
[JOS94] Peter Jaescje, Andreas Oberweis and Wolffried Stucky. ‘Deriving com-plex structured object types for business process modelling.’ In Proceed-ings of the 13th International Conference on the Entity-Relationship Ap-proach, edited by P. Loucopoulos, pages 28–45. Springer-Verlag, Manch-ester, United Kingdom, 1994.
[Kar99] James Samuel Karioki. A Structured Methodology and ImplementationStrategy for Business Process Reengineering in Geo-information Produc-tion. Master’s thesis, International Institute for Geo-Information Scienceand Earth Observation ITC, Enschede, The Netherlands, June 1999.
[Kaw91] Peter Kawalek. Process Modelling Cookbook: Version 1. Technical re-port, University of Manchester and British Telecommunications, UnitedKingdom, September 1991.
[KFM99] J. Kanet, W. Faisst and P. Mertens. ‘Application of information technol-ogy to a virtual enterprise broker: The case of bill epstein.’ InternationalJournal of Production Economics, 62:23–32, 1999.
[KG96] David Kinny and Michael Georgeff. ‘Modelling and design of multi-agentsystems.’ In Intelligent Agents III: Proceedings of the Third InternationalWorkshop on Agent Theories, Architectures, and Languages (ATAL-96).LNAI 1193. Springer-Verlag: Heidelberg, Germany, Budapest, 1996.
[KH96] Haim Kilov and William Harvey. Object-Oriented Behavioral Specifica-tions. Kluwer Academic Publishers, Boston, United States of America,1996. ISBN 0-7923-9778-9.
[KK97] Peter Kueng and Peter Kawalek. ‘Goal-based business process models:creation and evaluation.’ Business Process Management Journal, Vol.3(No. 1):17–38, 1997.
[Kot99] C. Kottman. Interoperating geographic Information Systems, chapterThe OpenGIS Consurtium and progress Toward Interoperability in GIS.Kluwer Academic Publishers, 1999.
[KR03] James F. Kurose and Keith W. Ross. Computer Networking: A Top-DownApprpach Featuring the Internet. Addison-Wesley Pub. Co., New York,United States of America, 2nd edition, 2003. ISBN 0-201-97699-4.
[Kru99] Philippe Kruchten. The rational unified process. The Addison-Wesley ob-ject technology series. Addison-Wesley Pub. Co., Reading, Massachusetts,1999. ISBN 0-201-60459-0.
[KVZ99] K. Kosanke, F. Vernadat and M. Zelm. ‘CIMOSA: Enterprise engineeringand integration.’ Computers in Industry, Vol. 40(No. 2-3):83–97, 1999.
[KWB03] Anneke Kleppe, Jos Warmer and Wim Bast. MDA Explained: TheModel Driven Architecture Practice and Promise. The Addison-Wesley ob-ject technology series. Addison-Wesley Pub. Co., Reading, Massachusetts,April 2003. ISBN 0-321-19442-X.
176

Bibliography
[Laa97] P. Laarakker. IT-2000: Steps to the Future of the Netherlands Cadastre.Technical report, Cadastre and Public Register Agency, Apeldoorn, TheNetherlands, 1997.
[Lar02] Graig Larman. Applying UML and Patterns: An Introduction to Object-Oriented Aanalysis and Design and the Unified Process. Prentice-HallInternational, New Jersey, United States of America, 2nd edition, 2002.ISBN 0-13-092569-1.
[Lew94] Paul Lewis. Information-Systems Development. Pitman Publishing, Lon-don, England, 1994. ISBN 0-273-03107-4.
[LGMR01] Paul A. Longley, Michael F. Goodchild, David J. Maguire and David W.Rhind. Geographic Information Systems and Science. John Wiley & SonsLtd., West Sussex, England, 2001. ISBN 0-471-89275-0.
[Lig01] David Lightfoot. Formal Specification Using Z. Grassroots. Palgrave Pub-lishers Ltd., New York, United States of America, 2nd edition, 2001. ISBN0-333-76327-0.
[LK99] Thomas M. Lillesand and Ralph W. Kiefer. Remote Sensing and ImageInterpretation. John Wiley & Sons Ltd., New York, United States ofAmerica, 4th edition, 1999. ISBN 0-471-25515-7.
[LL02] Kenneth C. Laudon and Jane P. Laudon. Essentials of Management In-formation Systems. Prentice-Hall International, 5th edition, May 2002.ISBN 0-13-008734-3.
[Mar00] Chris Marshall. Enterprise Modelling with UML. The Addison-Wesley ob-ject technology series. Addison-Wesley Pub. Co., Boston, Massachusetts,2000. ISBN 0-201-43313-3.
[MB02] Stephen J. Mellor and Marc J. Balcer. Executable UML: A Foundationfor Model Driven Architecture. Object Technology Series. Addison-WesleyPub. Co., Reading, Massachusetts, May 2002.
[MFPS02] Javier Morales, Luıs Ferreira Pires and Marten van Sinderen. ‘Modeldriven geo-information systems development.’ In Proceedings of the SixthInternational Enterprise Distributed Object Computing Conference EDOC2002, pages 155–166. IEEE Computer Society, Lausanne, Switzerland,September 2002.
[MG01] Javier M. Morales G. ‘On the design of geoinformation provision systems.’In Proceedings of the 5th Global Spatial Data Infrastructure Conference.Cartagena, Colombia, May 2001.
[MJ82] D. D. McCraken and M. A. Jackson. ‘Life cycle concept considered harm-ful.’ ACM Software Engineering Notes, Vol. 7(No. 2):28–32, 1982.
177

Bibliography
[MMP+95] Richard J. Mayer, Christopher P. Menzel, Michael K. Painter et al. In-formation Integration for Concurrent Engineering (IICE): IDEF3 ProcessDescription Capture Method Report. Technical report, Knowledge BasedSystems, Incorporated, September 1995.
[MOL+80] Harlan D. Mills, D. O’Neill, R. C. Lynger, M. Dyer and R. E. Quinnan.‘The management of software engineering: Parts i to v.’ IBM SystemsJournal, Vol. 24(No. 2):414–477, 1980.
[Mol98] Martien Molenaar. An Introduction to the Theory of Spatial Object Mod-elling for GIS. Research Monographs in GIS series. Taylor & Francis,West Sussex, England, 1998. ISBN 0-7484-0774-X.
[Mor98] Javier Morales. A Workflow Oriented Design of “on-line” Geoinforma-tion Services. Master’s thesis, International Institute for Geo-InformationScience and Earth Observation ITC, Enschede, The Netherlands, July1998.
[MR02a] Mark W. Maier and Eberhardt Rechtin. The Art of Systems Architecting.CRC Press LLC, Florida, United States of America, 2nd edition, 2002.ISBN 0-8493-0440-7.
[MR02b] Javier Morales and Mostafa Radwan. ‘Extending geoinformation services:A virtual architecture for spatial data infrastructures.’ In Proceedings ofthe Joint International Symposium on GeoSpatial Theory, Processing andApplications of the ISPRS Commission IV. Ottawa, Canada, July 2002.
[MRS00] Javier Morales, Mostafa Radwan and Rosilah Sani. ‘A methodology forarchitectural modelling of spatial information production processes in thecontext of business process reengineering.’ In Proceedings of the XIXth
congress of the International Society for Photogrammetry and RemoteSensing. Amsterdam, the Netherlands, July 2000.
[MW85] Merriam-Webster. Webster’s Ninth New Collegiate Dictionary. Merriam-Webster Inc., Massachusetts, United States of America, 1985. ISBN 0-87779-508-8.
[NGD02] ‘National Geospatial Data Framework (NGDF).’ www.ngdf.org.uk, ac-cessed on November 2002. United Kingdom.
[Nis99] Nimal Nissanke. Introductory Logic and Sets foe Computer Scientists.Addison-Wesley Pub. Co., Essex, England, 1999. ISBN 0-201-17957-1.
[Nol03] James J. Nolan. An Agent-Based Architecture for Distributed Imagery andGeospatial Computing. Ph.D. thesis, George Mason University, Fairfax,Virginia, United States of America, April 2003.
[Oak97] Les A. Oakshott. Business Modelling and Simulation. Pitman Publishing,August 1997. ISBN 0273612514.
178

Bibliography
[OGC99] The OpenGIS Abstract Specification Overview. Version 4, Open GIS Con-sortium, Inc., June 1999.
[OGC02] The OpenGIS Abstract Specification Topic 12: OpenGIS Service Archi-tecture. Version 4.3, Open GIS Consortium, Inc., January 2002. Editor:George Percivall.
[OGC03a] Geography Markup Language (GML) 3.0. OpenGIS implementation spec-ification, OpenGIS Consortium, Inc., January 2003. Editors: Simon Cox,Paul Daisey, Ron Lake, Clemens Portele and Arliss Whiteside.
[OGC03b] OpenGIS Reference Model. Version: 0.1.2, No. OGC 03-040, Open GISConsortium Inc., March 2003. Editor: Kurt Buehler.
[OGC03c] OpenGIS Web Services Architecture. Discussion paper, Version: 0.3, No.OGC 03-025, Open GIS Consortium Inc., January 2003. Editor: JoshuaLieberman.
[OMG01a] OMG - Architecture Board. Model Driven Architecture: A technical Per-spective. Draft version 00-17, Object Management Group, January 2001.
[OMG01b] —. Model Driven Architecture (MDA). Technical report, Object Manage-ment Group, July 2001.
[OMG01c] OMG - Object Management Group. Common Warehouse Metamodel(CWM) Specification. Technical Report Version 1.0, Object ManagementGroup, February 2001.
[OMG01d] —. Unified Modeling Language Specification. Technical Report Version1.4, Object Management Group, September 2001.
[OMG02] —. Meta Object Facility (MOF) Specification. Technical Report Version1.4, Object Management Group, April 2002.
[OMG03a] OMG - Architecture Board. MDA Guide. Version 1.0.1, Object Manage-ment Group, January 2003.
[OMG03b] OMG - Object Management Group. Unified Modeling Language Specifi-cation. Technical Report Version 2.0, Object Management Group, August2003.
[OMG03c] —. XML Metadata Interchange (XMI) Specification. Technical ReportVersion 2.0, Object Management Group, May 2003.
[Ons02] Harlan J. Onsrud. ‘Survey of national and regional spatial data infras-tructure activities around the globe.’ www.spatial.maine.edu/∼onsrud/GSDI.htm, accessed on January 2002.
[Ope04] ‘Open GIS consortium.’ www.opengis.org, accessed on February 2004.
179

Bibliography
[OS96] Andreas Oberweis and Peter Sander. ‘Information system behavior spec-ification by high-level Petri nets.’ ACM Transactions on InformationSystems, Vol. 14(No. 4):380–420, October 1996.
[OV99] M. Tamer Ozsu and Patrick Valduriez. Principles of Distributed DatabaseSystems. Prentice-Hall International, New Jersey, United States of Amer-ica, 2nd edition, 1999. ISBN 0-13-659707-6.
[Per97] Dewayne E. Perry. ‘Directions in process technology – an architecturalperspective.’ In Workshop on Research Directions in Process Technology.Nancy, France, July 1997.
[Pol00] Rudolf Wolfgang van der Pol. Knowledge-based Query Formulation inInformation Retrieval. Ph.D. thesis, Maastricht University, Maastricht,the Netherlands, September 2000. Dissertation Series No. 2000-5.
[Pre97] Roger S. Pressman. Software Engineering: A Practitioners Approach.McGraw-Hill Series on Computer Science. McGraw Hill, New York,United States of America, 4th edition, 1997. ISBN 0-07-052182-4.
[Put01] Janis R. Putman. Architechting with RM-ODP. Software ArchitectureSeries. Prentice Hall PTR, New Jersey, United States of America, 2001.ISBN 0-13-019116-7.
[PW92] Dewayne E. Perry and Alexander L. Wolf. ‘Foundations for the study ofsoftware architecture.’ ACM SIGSOFT Software Engineering Notes, Vol.17(No. 4):40–52, 1992.
[QFPS02] Dick Quartel, Luıs Ferreira Pires and Marten van Sinderen. ‘On archi-tectural support for behaviour refinement in distributed systems design.’Transactions of the SDPS Journal of Integrated Design and Process Sci-ence, Vol. 6(No. 1):1–30, March 2002.
[Qua98] Dick Quartel. Action Relations: Basic design concepts for behaviour mod-elling and refinement. Ph.D. thesis, University of Twente, Enschede, TheNetherlands, February 1998. Ph.D. Thesis, no. 98-18.
[Qua03] —. ‘ISDL meta-model and repository.’ Draft, Enschede, The Netherlands,July 2003. Arco project No. Arco/WP1/N001/V01.
[RAOM03] M. Mostafa Radwan, Liliana Alvarez, Richard Onchaga and JavierMorales. ‘Designing an integrated enterprise model to support partner-ships in the geo-information industry.’ In Proceedings of the 2nd AnnualAsian Conference and Exhibition in the field of GIS, GPS, Aerial Pho-tography and Remote Sensing (Map Asia 2003). Kual Lumpur, Malasya,October 2003.
[RAV02] ‘Netwerk voor Geo-informatie (RAVI).’ www.ravi.nl/index.htm, ac-cessed on December 2002. The Netherlands.
180

Bibliography
[RBP+91] James Rumbaugh, Michael Blaha, William Premerlani, Frederick Eddyand William Lorenson. Object-Oriented Modelling and Design. EnglewoodCliffs, Prentice-Hall International, New Jersey, United States of America,1st edition, 1991. ISBN 0-13-629841-9.
[Rey99] Carla Reyneri. ‘Operational building blocks for business process mod-elling.’ Computers in Industry, Vol. 40(No. 2-3):115–123, 1999.
[RFC03] ‘Tags for the identification of languages, internet rfc 3066.’ www.ietf.org/rfc/rfc3066.txt, accessed on November 2003.
[Rig93] Darrell K. Rigby. ‘The secret history of process reengineering.’ PlanningReview, March/April 1993.
[RJB98] James Rumbaugh, Ivar Jacobson and Grady Booch. The Unified Mod-elling Language Reference Manual. Object Technology Series. Addison--Wesley Pub. Co., Reading, Massachusetts, December 1998. ISBN 0-201-30998-X.
[ROM01] Mostafa Radwan, Richard Onchaga and Javier Morales. A Structural Ap-proach to the Management and Optimization of Geoinformation Processes.Official publication no. 41, European Organization for Experimental Pho-togrammetric Research (OEEPE), Frankfurt, Germany, 2001.
[Roy70] W. W. Royce. ‘Managing the development of large software systems:concepts and techniques.’ In Proceedings of the IEEE Western ElectronicShow and Convention (WESCON), pages 1–9. IEEE Computer SocietyPress, Los Angeles, California, United States of America, 1970.
[Roy87] —. ‘Managing the development of large software systems: concepts andtechniques.’ In Proceedings of the 9th international conference on SoftwareEngineering, pages 328–338. IEEE Computer Society Press, Monterey,California, United States of America, 1987.
[RS97] Luz Angela Rocha Salamanca. Applying concepts of business process re-design and operations management in a geoinformation production orga-nization: case study “Instituto Geografico Agustin Codazzi”, Colombia.Master’s thesis, International Institute for Geo-Information Science andEarth Observation ITC, Enschede, The Netherlands, June 1997.
[RSV01] Philippe Rigaux, Michel Scholl and Agnes Voisard. Spatial Databases:with Application to GIS. Morgan Kaufman Publishers, San Francisco,California, 2001. ISBN 1-55860-588-6.
[San98] Rosilah Sani. Dynamic Modelling in the Reengineering of GeoinformationProduction Processes. Master’s thesis, International Institute for Geo-Information Science and Earth Observation ITC, Enschede, The Nether-lands, July 1998.
[Sco02] Kendall Scott. The Unified Process Explained. Addison-Wesley Pub. Co.,Reading, Massachusetts, 2002. ISBN 0-201-74204-7.
181

Bibliography
[SH96] Pablo A. Straub and Carlos A. Hurtado. ‘Understanding behavior ofbusiness process models.’ In Coordination Models and Languages, pages440–443. 1996.
[SHL95] Pablo A. Straub and Carlos Hurtado L. Behavioral Consistency in Busi-ness Process Models. Technical Report RT-PUC-DCC-95-4, Catholic Uni-versity of Chile, Computer Science Department, May 1995.
[Sho03] Yasser Shohoud. Real World XML Web Services. The DevelopMentorSeries. Addison-Wesley Pub. Co., Boston, United States of America, 2003.ISBN 0-201-77425-9.
[Sim94] Oliver Sims. Business Objects: Delivering Cooperative Objects for Client-Server. The IBM McGraw-Hill Series. McGraw Hill, 1994. ISBN 0-07-707957-4.
[Sin95] Marten van Sinderen. On the Design of Application Protocols. Ph.D.thesis, University of Twente, Enschede, The Netherlands, March 1995.Ph.D. Thesis, no. 95-04.
[SNI02] ‘Centro Nacional de Informacao Geografica (SNIG).’ snig.igeo.pt, ac-cessed on February 2002. Portugal.
[Szy02] Clemens Szyperski. Component Software: Beyond Object-Oriented Pro-gramming. Addison-Wesley Pub. Co., Essex, England, 2nd edition, 2002.ISBN 0-201-74572-0.
[The92] The RAISE Language Group. The RAISE Specification Language. BCSPractitioner Series. Prentice-Hall International, London, Great Britain,1992. ISBN 0-13-752833-7.
[TP96] Daniel Tkach and Richard Puttick. Object Technology in Application De-velopment. Addison-Wesley Pub. Co., New York, United States of Amer-ica, 2nd edition, 1996. ISBN 0-201-49833-2.
[UU01] U.S. Geological Survey and U.S. Department of Interior. The NationalMap: Topographic Mapping for the 21st Century. Technical report, Officeof the Associate Director for Geography, U.S. Geological Survey, Reston,Va., United States of America, November 2001. Cooperative TopographicMapping Program.
[Vel98] Daan Velthausz. Cost-Effective Network-Based Multimedia InformationRetrieval. Ph.D. thesis, University of Twente, Enschede, The Netherlands,November 1998. Telematica Instituut Fundamental Research Series, No.003.
[VFPQS99] Chris Vissers, Luıs Ferreira Pires, Dick A. C. Quartel and Marten J.van Sinderen. The architectural design of distributed systems: Reader forthe Design of Telematic Systems. University of Twente, Enschede, TheNetherlands, January 1999.
182
Bibliography
[Vli00] Hans van Vliet. Software Engineering: Principles and Practice. JohnWiley & Sons Ltd., West Sussex, England, 2nd edition, 2000. ISBN 0-471-97508-7.
[W3C99] Resource Description Framework (RDF) Model and Syntax Specification.W3C recommendation, World Wide Web Consortium, Cambridge, MA,February 1999. Editors: Ora Lassila and Ralph R. Swick.
[W3C01a] Web Services Description Language (WSDL) 1.1. W3C recommendation,World Wide Web Consortium, Cambridge, MA, March 2001. Editors:Erik Christensen, Francisco Curbera, Greg Meredith and Sanjiva Weer-awarana.
[W3C01b] XML Schema Part 1: Structures. W3c recommendation, World Wide WebConsortium, Cambridge, MA, May 2001. Editors: Henry S. Thompson,David Beech, Murray Maloney and Noah Mendelsohn.
[W3C01c] XML Schema Part 2: Datatypes. W3C recommendation, World WideWeb Consortium, Cambridge, MA, May 2001. Editors: Paul V. Bironand Ashok Malhotra.
[W3C03] ‘The World Wide Web consortium.’ www.w3.org, accessed on November2003.
[WD96] Jim Woodcock and Jim Davies. Using Z: Specification, Refinement andProof. Prentice-Hall International Series in Computer Science. Prentice-Hall International, Great Britain, 1996. ISBN 0-13-948472-8.
[Weg98] Marten K. de Weger. Structuring of Business Processes: An architecturalapproach to system development and its application to business processes.Ph.D. thesis, University of Twente, Enschede, The Netherlands, January1998. Ph.D. Thesis, no. 98-17.
[Wil02] A. Denise Williams (editor). Proceedings of the Sixth International Enter-prise Distributed Object Computing Conference EDOC 2002. Ecole Poly-technique Fedeerale de Laussane (EPFL), IEEE Computer Society, Lau-sanne, Switzerland, September 2002. ISBN 0-7695-1742-0.
[WJK99] Michael Wooldridge, Nicholas R. Jennings and David Kinny. ‘A method-ology for agent-oriented analysis and design.’ In Proceedings of the 3rd
International Conference on Autonomous Agents (Agents’99), edited byOren Etzioni, Jorg P. Muller and Jeffrey M. Bradshaw, pages 69–76. ACMPress, Seattle, WA, USA, 1999.
[WKRG99] Brian Warboys, Peter Kawelek, Ian Robertson and Robert Greenwood.Business Information Systems: a Process Approach. Information SystemsSeries. McGraw Hill, Great Britain, 1999. ISBN 0-07-709464-6.
[Wor95] Michael F. Worboys. GIS: A Computing Perspective. Taylor & FrancisLtd., London, United Kingdom, 1995. ISBN 0-7484-0065-6.
183

Bibliography
[Zei99] Michael Zeiler. Modelling Our World: The ESRI Guide to GeodatabaseDesign. Environmental Systems Research Institute, Inc., Redlans, Cali-fornia, 1999. ISBN 1-879102-62-5.
184

Index
Aabstraction . . . . . . . . . . . . . . . . . . . . 35, 37
levels of . . . . . . . . . . . . . . . . . . . . . . . 37action . . . . . . . . . . . . . . . . . . . . . 58, 63, 112
abstract. . . . . . . . . . . . . . . . . . . . . .113atomicity of . . . . . . . . . . . . . . . . . . . 64attribute . . . . . . . . . . . . . . . . . . 58, 64attribute constraint. . . . . . . .67, 71concrete . . . . . . . . . . . . . . . . . . . . . 113decomposotion . . . . . . . . . . . . . . . . 77disabling . . . . . . . . . . . . . . . . . . . . . . 68distribution . . . . . . . . . . . . . . . . . . . 77enabling . . . . . . . . . . . . . . . . . . . . . . 68initial . . . . . . . . . . . . . . . . . . . . . 67, 68inserted . . . . . . . . . . . . . . . . . . . . . . 114internal . . . . . . . . . . . . . . . . . . . . . . 112reference . . . . . . . . . . . . . . . . . . . . . 113relation . . . . . . . . . . . . . . . . . . . . . . . 67target . . . . . . . . . . . . . . . . . . . . . . . . . 67
activity . . . . . . . . . . . . . . . . . . . . . . . . . . . . 63architectural element . 54, 59, 104, 153
connecting element . . . . . . . 60, 106data element . . . . . . . . . . . . . 60, 118processing element . . . . . . . 60, 119
attributecausality condition . . . . . . . . . . . . 75reference relation. . . . . . . . . . . . . .73value domain. . . . . . . . . . . . . . . . . .73value establishment . . . . . . . . . . . 66
Bbehaviour . . . . . . . . . . . . . . . . . . . . . . . . . 63
abstract. . . . . . . . . . . . . . . . . . . . . .113concrete . . . . . . . . . . . . . . . . . . . . . 113definition . . . . . . . . . . . . . . . . . . . . . 68recursion . . . . . . . . . . . . . . . . . . . . . . 82structuring . . . . . . . . . . . . . . . . . . . . 78
causality-oriented . . . . . . . . . . . 78constraint-oriented . . . . . . . . . . 83
CCatalysis
development method . . . . . . . . . . 45causality condition . . . . . . . . . 58, 67, 75
conjunction . . . . . . . . . . . . . . . . . . . 69disjunction . . . . . . . . . . . . . . . . . . . . 70
causality relation. . . . . . . . . . . . . . .67, 68decomposition of . . . . . . . . . . . . . . 78
class . . . . . . . . . . . . . . . . . . . . . . . . . . . . . . . 25diagram. . . . . . . . . . . . . . . . . . . . . . .25
collections . . . . . . . . . . . . . . . . . . . . . . . . . 93composite . . . . . . . . . . . . . . . . . . . . . . . . . 93composition structures. . . . . . . . . . . .112conceptual schema . . . . . . . . . . . . . . . . . 24correctness assessment . . . . . . . 113, 122
method . . . . . . . . . . . . . . . . . . . . . . 113
Ddata sharing . . . . . . . . . . . . . . . . . . . . . . . 15decomposition . . . . . . . . . . . . . . . . 76, 104design
concepts . . . . . . . . . . . . . . . . . . . . 9, 61methodology . . . . . . . . . . . . . . . . . . . 9
development process . . . . . . . . . . . . . . . 34disabling condition . . . . . . . . . . . . . . . . 68
Eenabling condition . . . . . . . . . . . . . . . . . 68entity. . . . . . . . . . . . . . . . . . . . . . . . . . . . . .62
auxiliary . . . . . . . . . . . . . . . . . . . . . . 89auxiliary entity. . . . . . . . . . . . . . . .88decomposotion . . . . . . . . . . . . . . . . 76functional . . . . . . . . . . . . . . . . . . . . . 88service provider . . . . . . . . . . . . . . . 87service user . . . . . . . . . . . . . . . . . . . 87
185

Index
external perspective . . . . . . . . . . . 85–102design trajectory . . . . . . . . . . . . . . 87model . . . . . . . . . . . . . . . . . . . . . . . . . 94
Ffunctionality . . . . . . . . . . . . . . . . . . . . . . . 63
GGDI . . . . . . . . . . . . . . . . . . . . . . . . . . . . . . . 14
components . . . . . . . . . . . . . . . . . . . 15geo-information . . . . . . . . . . . . . . . . . . . . . 6
Infrastructure . . . . . . . . . . . see GDIservice
walktrough . . . . . . . . . . . . . . . . 121Service Infrastructure . . . . see GSIservices . . . . . . 29, 53, 57, 106, 119systems . . . . . . . . . . . . . . . . . . . . . . . . 7
Geo-Services Design Methodology . seeGSDM
geographic data . . . . . . . . . . . . . . . . . . . 17Geographic fields . . . . . . . . . . . . . . . . . . 17geographic information . . . . . . . . . . . . see
geo-informationgeographic object . . . . . . see geoObjectGeographic objects . . . . . . . . . . . . . . . . 17Geography Markup Language . . . . . see
GMLgeoObject . . . . . . . . . . . . . . . . . . . . . . . . . 91Geospatial Data Infrastructure . . . . see
GDIGML . . . . . . . . . . . . . . . . . . . . . . . . . . . . . 163
geometry schema. . . . . . . . . . . . .164GSDM . . . . . . . . . . . . . . . . . . . . 49–60, 118
decompositioncriteria . . . . . . . . . . . . . . . . . . . . 104goals . . . . . . . . . . . . . . . . . . . . . . 104method . . . . . . . . . . . . . . . . . . . . 108pattern . . . . . . . . . . . . . . . . . . . . 106
external perspective . . . . . . . 51, 85internal perspective . . . . . . 51, 103metamodel . . . . . . . . . . . . . . . . . . . . 56phases . . . . . . . . . . . . . . . . . . . . . . . . 51
GSI . . . . . . . . . . . . . . . . . . . . . . . . 29, 56, 85
Iinteraction . . . . . . . . . . . . . . . . . . . . . 58, 65
contribution . . . . . . . . . . . . . . . 65, 66
integrated . . . . . . . . . . . . . . . . . . . . . 77point. . . . . . . . . . . . . . . . . . . . . . . . . .62signatures . . . . . . . . . . . . . . . . . . . . . 96
internal behaviour . . . . . . . . . . . . . . . . 111internal perspective . . . . . . . . . . 103–127
design trajectory . . . . . . . . . . . . . 108ISDL . . . . . . . . . . . . . . . . . . . . . . . . . . . . . . 10
metamodel . . . . . . . . . . . . . . . . . . . . 56item . . . . . . . . . . . . . . . . . . . . . . . . . . . . . . . 98
MMDA. . . . . . . . . . . . . . . . . . . . . . . . . . . . . . 46mediator. . . . . . . . . . . . . . . . . . . . .113, 125mediator pattern . . . . . . . . . . . . . . . . . 106
recursive . . . . . . . . . . . . . . . . . . . . . 107metadata . . . . . . . . . . . . . 15, 26, 117, 153
levels of . . . . . . . . . . . . . . . . . . . . . . . 27standards . . . . . . . . . . . . . . . . . . . . . 28
metamodel . . . . . . . . . . . . . . . . . . . . . 54, 91model . . . . . . . . . . . . . . . . . . . . . . . . . . . . . 53
role in GSDM. . . . . . . . . . . . . . . . . 53Model Driven Architecture. .see MDAmodelling dimensions . . . . . . . . . . . . . . 59models . . . . . . . . . . . . see system models
Ppreservation of relations . . . . . . . . . . 113processing descriptions . . . . . . . . . . . 119
Rraster-based representations . . . . . . . 22refinement . . . . . . . . . . . . . . . . . . . . 38, 115repository . . . . . . . . . . . . . . . . . . . . 56, 112
schema . . . . . . . . . . . . . . . . . . . . . . 153
Sservice definition . . . . . 87, 94, 127, 153
extended. . . . . . . . . . . . . . .88, 89, 95inputs. . . . . . . . . . . . . . . . . . . . . . . . .90parameteres . . . . . . . . . . . . . . . . . . . 90results . . . . . . . . . . . . . . . . . . . . . . . . 90
service description . . . . . . . . . . . 117, 145services . . see geo-information servicesspatial data types. . . . . . . . . . . . . . . . . .91system . . . . . . . . . . . . . . . . . . . . . . . . . . 8, 34
architecting . . . . . . . . . . . . . . . . . . . 33development process . . . . . . . . . . 34
186

Index
incremental model . . . . . . . . . . 41object-oriented. . . . . . . . . . . . . .42spiral model . . . . . . . . . . . . . . . . 41waterfall model . . . . . . . . . . . . . 40
models . . . . . . . . . . . . . . . . . . . . . . . . 36
Ttheme . . . . . . . . . . . . . . . . . . . . . . . . . . . . . 92
UUnified Process . . . . . . . . . . . . . . . . . . . . 43
Vvector-based representations . . . . . . . 20viewpoints . . . . . . . . . . . . . . . . . . . . . . . . . 39
RM-ODP . . . . . . . . . . . . . . . . . . . . . 40views . . . . . . . . . . . . . . . . . . . . . . . . . . . . . . 38
187

Index
188

Summary
This thesis presents a method for the development of distributed geo-information sys-tems. The method is organised around the design principles of modularity, reuse andreplaceability. The method enables the modelling of both behavioural and informa-tional aspects of geo-information systems in an integrated way.
This thesis introduces the concept the Geo-information Service Infrastructure (GSI).The GSI concept adheres to the characteristics and needs of modern geo-informa-tion processing. The GSI builds on the existing principles for data sharing of theGeospatial Data Infrastructure concept. The term GSI is used to refer to a type ofgeo-information provision system from which specialised information products andservices can be obtained by exploiting the elementary services (resources, processesand data) of a set of collaborating geo-service providers. This thesis presents a sup-porting architecture for the deployment of GSI services.
An important idea underlying a GSI system is that services available in an informationinfrastructure should be composable. The method presented in this thesis is used todescribe these elementary services and their interfaces, such that they can be accessed,combined and managed to create compound required services. These later servicesare defined to handle elaborated and specialised geo-processing tasks.
Services are specified according to two perspectives namely the external perspectiveand the internal perspective. The external perspective specifies the observable be-haviour of a service. This specification is used by designers for the developmentof the internal perspective and for the assessment of the resulting internal servicespecification. A service specification according to the external perspective also pro-vides potential users with a description of the service functionality and its interfacingmechanisms.
The internal perspective describes internal structure of a required service in termsof compositions of simpler or more elementary services. This internal structure isdefined in terms of architectural elements. Three types of architectural elements aredistinguished, viz. data elements, processing elements and connecting elements. Thedata elements represent the information that is used, manipulated and/or generatedby the system. The process elements represent the geo-processing capabilities of
189

Summary
the system, which can perform transformations on data elements. The connectingelements or mediators coordinate the interactions between the other architecturalelements, and provide an interface to the service user. All specifications, according toboth the external and the internal perspectives, are defined using ISDL (InteractionSystems Design Language) concepts.
At the centre of a GSI system lies the repository service. The repository allows toorganise the creation, updating, validation, accessing and sharing of service modelsand service instances. We emphasise the use of models as the mechanism to discloseinformation about services and to design more elaborated services out of combinationsof existing elementary services. The repository is defined according to a metamodelon which all service models are based. The metamodel provides a rigourous abstractsyntax for defining models. The metamodel is used here to define a set of designconcepts and their relationships, which one can use to produce models according tothe GSI specific objectives.
This thesis introduces and motivates the so-called mediator pattern to be used tostructure compositions of architectural elements. This results in the organisation of aset of services into a behaviour definition that has a single coordinating element. Oneof the benefits of this approach is that it makes the service realisation accountablefor the user. Another benefit is that it facilitates the use of workflow languages toimplement the mediator behaviour, which choreographs the use of third-party services.
190

Samenvatting
Dit proefschrift presenteert een methode voor het ontwikkelen van gedistribueerdegeo-informatie systemen. Deze methode is gebaseerd op ontwerpprincipes zoals modu-lariteit, hergebruik en onderhoudbaarheid. De methode ondersteunt het gecombineerdmodelleren van zowel gedrags- als informatieaspecten van geo-informatie systemen
Dit proefschrift introduceert het begrip ‘Geo-information Service Infrastructure’(GSI). Het GSI begrip sluit aan op de eigenschappen van en de eisen aan geavan-ceerde geo-informatie verwerking. GSI steunt op bestaande principes voor ‘data sha-ring’ zoals toegepast in een traditionele ‘Geospatial Data Infrastructure’. De termGSI wordt gebruikt om een geo-informatie dienstensysteem aan te duiden waarmeegespecialiseerde informatieproducten en -diensten verkregen kunnen worden door ele-mentaire diensten (middelen, processen en data) van een verzameling samenwerkendegeo-dienstenaanbieders te exploiteren. Dit proefschrift presenteert een ondersteundearchitectuur voor het uitrollen van GSI diensten.
Een funderende notie voor een GSI systeem is dat beschikbare diensten van een in-formatie infrastructuur compositioneel moeten zijn. De methode gepresenteerd in ditproefschrift is gebruikt om deze elementaire diensten en hun interfaces te beschrijven,zodat ze toegankelijk zijn, en gecombineerd en beheerd kunnen worden voor het sa-menstellen van de vereiste diensten. De resulterende diensten kunnen complexere engespecialiseerde geo-verwerkingstaken ondersteunen.
Diensten worden gespecificeerd volgens twee gezichtspunten, namelijk het externeen het interne gezichtspunt. Het externe gezichtspunt definieert het observeerbaregedrag van een dienst. Deze specificatie wordt gebruikt door ontwerpers als uitgangs-punt voor het ontwikkelen van het interne gezichtspunt, en voor de evaluatie van deresulterende dienstspecificatie volgens het interne gezichtspunt. Een dienstspecifica-tie volgens het externe gezichtspunt voorziet tevens de potentiele gebruikers van debeschrijving van de functionaliteit en de interface mechanismen van de dienst.
Het interne gezichtspunt beschrijft een interne structuur van de vereiste dienst als eensamenstelling van eenvoudiger en meer elementaire diensten. Deze interne structuurwordt gedefinieerd in termen van architecturale elementen. Drie soorten architectura-le elementen worden onderscheiden, namelijk data elementen, verwerkingselementen
191

Samenvatting
en verbindingselementen. Data elementen representeren informatie die gebruikt, ge-manipuleerd en/of gegenereerd wordt door het systeem. Verwerkingselementen repre-senteren de geo-verwerkingsmogelijkheden van het systeem, waarmee transformatiesuitgevoerd kunnen worden op data elementen. Verbindingselementen of ‘mediators’coordineren de interacties tussen de andere architecturale elementen en bieden eeninterface aan de dienstgebruiker. Alle specificaties, volgens zowel het externe alsinterne gezichtspunt, worden gedefinieerd met gebruik van de specificatietaal ISDL(‘Interaction Systems Design Language’).
De kern van een GSI systeem wordt gevormd door de ‘repository’ dienst. Deze dienstondersteunt het creeren, verversen, valideren, toegankelijk maken en delen van dienst-modellen en -instanties. Wij benadrukken het gebruik van modellen als mechanismenom informatie over diensten beschikbaar te stellen en om complexere diensten sa-men te stellen uit combinaties van bestaande elementaire diensten. De ‘repository’ isgedefinieerd op basis van een metamodel waarop tevens alle dienstmodellen zijn ge-baseerd. Dit metamodel biedt een precieze abstracte syntaxis voor het definieren vanmodellen. Het metamodel wordt hier gebruikt om een verzameling ontwerpconceptenen hun relaties te definieren, zodat deze gebruikt kunnen worden voor het producerenvan modellen voor GSI-specifieke doeleinden.
Dit proefschrift introduceert en motiveert het zogenaamde ‘mediator’ patroon, datgebruikt wordt voor het structureren van composities van architecturale elementen.Dit resulteert in een structuur waarin een verzameling diensten worden gecoordineerddoor een enkel coordinerend element. Een van de voordelen van deze benadering is datde verantwoording aan de gebruiker ten aanzien van de dienstrealisatie wordt gegevenvia een enkel element. Een ander voordeel van deze benadering is dat ‘workflow’ talenop een natuurlijke manier toegepast kunnen worden voor het implementeren van het‘mediator’ gedrag dat het gebruik van diensten van derden regisseert.
192

Curriculum Vitae
Javier Marcelino Morales Guarin was born on the 16th January, 1968, in Bogota,Colombia. In 1992 he obtained his bachelor’s degree in forestry engineering fromthe Distrital University ‘Francisco Jose de Caldas’ in Bogota, Colombia. In 1998he obtained his Master of Science degree in Geo-information Science from the Inter-national Institute for Geo-Information Science and Earth Observation in Enschede,the Netherlands. He was part-time lecturer at the faculty of civil engineering of theUniversity of Santo Tomas in Bogota. He has worked as a consultant in the areas ofGIS and information technology, and he has also worked for more than 14 years inthe geo-information industry with the national mapping organisation of Colombia inthe areas of data acquisition, geographic information systems, map production andgeo-information infrastructures. He is also member of the Architecture Group of theTelematics Services and Systems cluster of the faculty of Computer Science at theUniversity of Twente. His present research interests are in design methods, archi-tectures for distributed (geo-information) systems and spatial data infrastructures.
193

194
ITC Dissertations
[1] Akinyede, Joseph O., 1990, Highway Cost Modelling and Route SelectionUsing a Geotechnical Information System, Delft University of Technology.
[2] Pan, Ping He, 1990, A Spatial Structure Theory in Machine Vision and Ap-plications to Structural and Textural Analysis of Remotely Sensed Images, Uni-versity of Twente, 90-9003757-8.
[3] Bocco Verdinelli, Gerardo H. R., 1990, Gully Erosion Analysis Using Re-mote Sensing and Geographic Information Systems: A Case Study in CentralMexico, Universiteit van Amsterdam.
[4] Sharif, Massoud, 1991, Composite Sampling Optimization for DTM in theContext of GIS , Wageningen Agricultural University.
[5] Drummond, Jane E., 1991, Determining and Processing Quality Parametersin Geographic Information Systems, University of Newcastle.
[6] Groten, Susanne, 1991, Satellite Monitoring of Agro-ecosystems in the Sahel ,Westfalische Wilhelms-Universitat.
[7] Sharifi, Ali, 1991, Development of an Appropriate Resource Information Sys-tem to Support Agricultural Management at Farm Enterprise Level , WageningenAgricultural University, 90-6164-074-1.
[8] van der Zee, Dick, 1991, Recreation Studied from Above: Air Photo Interpre-tation as Input into Land Evaluation for Recreation, Wageningen AgriculturalUniversity, 90-6164-075-X.
[9] Mannaerts, Chris, 1991, Assessment of the Transferability of LaboratoryRainfall-runoff and Rainfall—Soil Loss Relationships to Field and CatchmentScales: A Study in the Cape Verde Islands, University of Ghent, 90-6164-085-7.
[10] Wang, Ze Shen, 1991, An Expert System for Cartographic Symbol Design,Utrecht University, 90-3930-333-9.
[11] Zhou, Yunxuan, 1991, Application of Radon Transforms to the Processing ofAirborne Geophysical Data, Delft University of Technology, 90-6164-081-4.
195

ITC Dissertations
[12] de Zuvirıa, Martın, 1992, Mapping Agro-topoclimates by Integrating Topo-graphic, Meteorological and Land Ecological Data in a Geographic InformationSystem: A Case Study of the Lom Sak Area, North Central Thailand , Univer-siteit van Amsterdam, 90-6164-077-6.
[13] van Westen, Cees J., 1993, Application of Geographic Information Systemsto Landslide Hazard Zonation, Delft University of Technology, 90-6164-078-4.
[14] Shi, Wenzhong, 1994, Modelling Positional and Thematic Uncertainties in In-tegration of Remote Sensing and Geographic Information Systems, UniversitatOsnabruck, 90-6164-099-7.
[15] Javelosa, R., 1994, Active Quaternary Environments in the Philippine MobileBelt , Utrecht University, 90-6164-086-5.
[16] Lo, King-Chang, 1994, High Quality Automatic DEM, Digital ElevationModel Generation from Multiple Imagery , University of Twente, 90-9006-526-1.
[17] Wokabi, S. M., 1994, Quantified Land Evaluation for Maize Yield Gap Anal-ysis at Three Sites on the Eastern Slope of Mt. Kenya, University Ghent, 90-6164-102-0.
[18] Rodrıguez Parisca, O. S., 1995, Land Use Conflicts and Planning Strategiesin Urban Fringes: A Case Study of Western Caracas, Venezuela, University ofGhent.
[19] van der Meer, Freek D., 1995, Imaging Spectrometry & the Ronda Peri-dotites, Wageningen Agricultural University, 90-5485-385-9.
[20] Kufoniyi, Olajide, 1995, Spatial Coincidence: Automated Database Updatingand Data Consistency in Vector GIS , Wageningen Agricultural University, 90-6164-105-5.
[21] Zambezi, P., 1995, Geochemistry of the Nkombwa Hill Carbonatite Complexof Isoka District, North-east Zambia, with Special Emphasis on Economic Min-erals, Vrije Universiteit Amsterdam.
[22] Woldai, Tsehaie, 1995, The Application of Remote Sensing to the Study of theGeology and Structure of the Carboniferous in the Calanas Area, Pyrite Belt,South-west Spain, Open University, United Kingdom.
[23] Verweij, Pita A., 1995, Spatial and Temporal Modelling of Vegetation Pat-terns: Burning and Grazing in the Paramo of Los Nevados National Park,Colombia, Universiteit van Amsterdam, 90-6164-109-8.
[24] Pohl, Christine, 1996, Geometric Aspects of Multisensor Image Fusion forTopographic Map Updating in the Humid Tropics, Universitat Hannover, 90-6164-121-7.
[25] Bin, Jiang, 1996, Fuzzy Overlay Analysis and Visualization in GeographicInformation Systemes, Utrecht University, 90-6266-128-9.
196

ITC Dissertations
[26] Metternicht, Graciela I., 1996, Detecting and Monitoring Land Degrada-tion Features and Processes in the Cochabamba Valleys, Bolivia. A SynergisticApproach, University of Ghent, 90-6164-118-7.
[27] Chu Thai Hoanh, 1996, Development of a Computerized Aid to IntegratedLand Use Planning (CAILUP) at Regional Level in Irrigated Areas: A CaseStudy for the Quan Lo Phung Hiep region in the Mekong Delta, Vietnam, Wa-geningen Agricultural University, 90-6164-120-9.
[28] Roshannejad, A., 1996, The Management of Spatio-Temporal Data in a Na-tional Geographic Information System, University of Twente, 90-9009-284-6.
[29] Terlien, Mark T. J., 1996, Modelling Spatial and Temporal Variations inRainfall-triggered Landslides: The Integration of Hydrologic Models, Slope Sta-bility Models and GIS for the Hazard Zonation of Rainfall-triggered Landslideswith Examples from Manizales, Colombia, Utrecht University, 90-6164-115-2.
[30] Mahavir, J., 1996, Modelling Settlement Patterns for Metropolitan Regions:Inputs from Remote Sensing , Utrecht University, 90-6164-117-9.
[31] Al-Amir, Sahar, 1996, Modern Spatial Planning Practice as Supported by theMulti-applicable Tools of Remote Sensing and GIS: The Syrian Case, UtrechtUniversity, 90-6164-116-0.
[32] Pilouk, M., 1996, Integrated Modelling for 3D GIS , University of Twente,90-6164-122-5.
[33] Duan, Zengshan, 1996, Optimization Modelling of a River-Aquifer Systemwith Technical Interventions: A Case Study for the Huangshui River and theCoastal Aquifer, Shandong, China, Vrije Universiteit Amsterdam, 90-6164-123-3.
[34] de Man, W. H. E., 1996, Surveys: Informatie als Norm: Een Verkenningvan de Institutionalisering van Dorp-surveys in Thailand en op de Filippijnen,University of Twente, 90-9009-775-9.
[35] Vekerdy, Zoltan, 1996, GIS-based Hydrological Modelling of Alluvial Regions:Using the Example of the Kisafld, Hungary , Lorand Eotvos University of Sci-ences, 90-6164-119-5.
[36] Gomes Pereira, Luisa M., 1996, A Robust and Adaptive Matching Procedurefor Automatic Modelling of Terrain Relief , Delft University of Technology, 90-407-1385-5.
[37] Fandino Lozano, M. T., 1996, A Framework of Ecological Evaluation orientedat the Establishment and Management of Protected Areas: A Case Study of theSantuario de Iguaque, Colombia, Universiteit van Amsterdam, 90-6164-129-2.
[38] Toxopeus, Bert, 1996, ISM: An Interactive Spatial and Temporal ModellingSystem as a Tool in Ecosystem Management: With Two Case Studies: CibodasBiosphere Reserve, West Java Indonesia: Amboseli Biosphere Reserve, KajiadoDistrict, Central Southern Kenya, Universiteit van Amsterdam, 90-6164-126-8.
197

ITC Dissertations
[39] Wang, Yiman, 1997, Satellite SAR Imagery for Topographic Mapping of TidalFlat Areas in the Dutch Wadden Sea, Universiteit van Amsterdam, 90-6164-131-4.
[40] Saldana Lopez, Asun, 1997, Complexity of Soils and Soilscape Patterns onthe Southern Slopes of the Ayllon Range, Central Spain: a GIS Assisted Mod-elling Approach, Universiteit van Amsterdam, 90-6164-133-0.
[41] Ceccarelli, T., 1997, Towards a Planning Support System for Communal Ar-eas in the Zambezi Valley, Zimbabwe; A Multi-criteria Evaluation Linking FarmHousehold Analysis, Land Evaluation and Geographic Information Systems,Utrecht University, 90-6164-135-7.
[42] Peng, Wanning, 1997, Automated Generalization in GIS , Wageningen Agri-cultural University, 90-6164-134-9.
[43] Mendoza Lawas, M. C., 1997, The Resource Users’ Knowledge, the NeglectedInput in Land Resource Management: The Case of the Kankanaey Farmers inBenguet, Philippines, Utrecht University, 90-6164-137-3.
[44] Bijker, Wietske, 1997, Radar for Rain Forest: A Monitoring System for LandCover Change in the Colombian Amazon, Wageningen Agricultural University,90-6164-139-X.
[45] Farshad, Abbas, 1997, Analysis of Integrated Soil and Water ManagementPractices within Different Agricultural Systems under Semi-arid Conditions ofIran and Evaluation of their Sustainability , University of Ghent, 90-6164-142-X.
[46] Orlic, B., 1997, Predicting Subsurface Conditions for Geotechnical Modelling ,Delft University of Technology, 90-6164-140-3.
[47] Bishr, Yaser, 1997, Semantic Aspects of Interoperable GIS , Wageningen Agri-cultural University, 90-6164-141-1.
[48] Zhang, Xiangmin, 1998, Coal fires in Northwest China: Detection, Monitor-ing and Prediction Using Remote Sensing Data, Delft University of Technology,90-6164-144-6.
[49] Gens, Rudiger, 1998, Quality Assessment of SAR Interferometric Data, Uni-versity of Hannover, 90-6164-155-1.
[50] Turkstra, Jan, 1998, Urban Development and Geographical Information: Spa-tial and Temporal Patterns of Urban Development and Land Values Using In-tegrated Geo-data, Villaviciencio, Colombia, Utrecht University, 90-6164-147-0.
[51] Cassells, Craig James Steven, 1998, Thermal Modelling of UndergroundCoal Fires in Northern China, University of Dundee.
[52] Naseri, M. Y., 1998, Monitoring Soil Salinization, Iran, Ghent University,90-6164-195-0.
198

ITC Dissertations
[53] Gorte, Ben G. H., 1998, Probabilistic Segmentation of Remotely Sensed Im-ages, Wageningen Agricultural University, 90-6164-157-8.
[54] Ayenew, Tenalem, 1998, The Hydrological System of the Lake District Basin,Central Main Ethiopian Rift , Universiteit van Amsterdam, 90-6164-158-6.
[55] Wang, Donggen, 1998, Conjoint Approaches to Developing Activity-BasedModels, Technical University of Eindhoven, 90-6864-551-7.
[56] Bastidas de Calderon, Marıa, 1998, Environmental Fragility and Vulnera-bility of Amazonian Landscapes and Ecosystems in the Middle Orinoco RiverBasin, Venezuela, University of Ghent.
[57] Moameni, A., 1999, Soil Quality Changes under Long-term Wheat Cultivationin the Marvdasht Plain, South-central Iran, University of Ghent.
[58] van Groenigen, J.W., 1999, Constrained Optimisation of Spatial Sampling:A Geostatistical Approach, Wageningen Agricultural University, 90-6164-156-X.
[59] Cheng, Tao, 1999, A Process-oriented Data Model for Fuzzy Spatial Objects,Wageningen Agricultural University, 90-6164-164-0.
[60] Wolski, Piotr, 1999, Application of Reservoir Modelling to Hydrotopes Iden-tified by Remote Sensing , Vrije Universiteit Amsterdam, 90-6164-165-9.
[61] Acharya, B., 1999, Forest Biodiversity Assessment: A Spatial Analysis of TreeSpecies Diversity in Nepal , Leiden University, 90-6164-168-3.
[62] Abkar, Ali Akbar, 1999, Likelihood-based Segmentation and Classification ofRemotely Sensed Images, University of Twente, 90-6164-169-1.
[63] Yanuariadi, Tetra, 1999, Sustainable Land Allocation: GIS-based DecisionSupport for Industrial Forest Plantation Development in Indonesia, WageningenUniversity, 90-5808-082-X.
[64] Abu Bakr, Mohamed, 1999, An Integrated Agro-Economic and Agro-Ecological Framework for Land Use Planning and Policy Analysis, WageningenUniversity, 90-6164-170-5.
[65] Eleveld, Marieke A., 1999, Exploring Coastal Morphodynamics of Ameland(The Netherlands) with Remote Sensing Monitoring Techniques and DynamicModelling in GIS , Universiteit van Amsterdam, 90-6461-166-7.
[66] Hong, Yang, 1999, Imaging Spectrometry for Hydrocarbon Microseepage, DelftUniversity of Technology, 90-6164-172-1.
[67] Mainam, Felix, 1999, Modelling Soil Erodibility in the Semiarid Zone ofCameroon, University of Ghent, 90-6164-179-9.
[68] Bakr, Mahmoud I., 2000, A Stochastic Inverse-Management Approach toGroundwater Quality , Delft University of Technology, 90-6164-176-4.
199

ITC Dissertations
[69] Zlatanova, Siyka, 2000, 3D GIS for Urban Development , Graz University ofTechnology, 90-6164-178-0.
[70] Ottichilo, Wilber K., 2000, Wildlife Dynamics: An Analysis of Change inthe Masai Mara Ecosystem, Wageningen University, 90-5808-197-4.
[71] Kaymakci, Nuri, 2000, Tectono-stratigraphical Evolution of the Cankori Basin(Central Anatolia, Turkey), Utrecht University, 90-6164-181-0.
[72] Gonzalez, Rhodora, 2000, Platforms and Terraces: Bridging Participationand GIS in Joint-learning for Watershed Management with the Ifugaos of thePhilippines, Wageningen University, 90-5808-246-6.
[73] Schetselaar, Ernst, 2000, Integrated Analyses of Granite-gneiss Terrain fromField and Multisource Remotely Sensed Data. A Case Study from the CanadianShield , University of Delft, 90-6164-180-2.
[74] Mesgari, M. Saadi, 2000, Topological Cell-Tuple Structure for Three-Dimensional Spatial Data, University of Twente, 90-3651-511-4.
[75] de Bie, Cees A. J. M., 2000, Comparative Performance Analysis of Agro-Ecosystems, Wageningen University, 90-5808-253-9.
[76] Khaemba, Wilson M., 2000, Spatial Statistics for Natural Resource Manage-ment , Wageningen University, 90-5808-280-6.
[77] Shrestha, Dhruba, 2000, Aspects of Erosion and Sedimentation in theNepalese Himalaya: Highland-lowland Relations, Ghent University, 90-6164-189-6.
[78] Asadi Haroni, Hooshang, 2000, The Zarshuran Gold Deposit Model Appliedin a Mineral Exploration GIS in Iran, Delft University of Technology, 90-6164-185-3.
[79] Raza, Ale, 2001, Object-Oriented Temporal GIS for Urban Applications, Uni-versity of Twente, 90-3651-540-8.
[80] Farah, Hussein O., 2001, Estimation of Regional Evaporation under DifferentWeather Conditions from Satellite and Meteorological Data. A Case Study inthe Naivasha Basin, Kenya, Wageningen University, 90-5808-331-4.
[81] Zheng, Ding, 2001, A Neuro-Fuzzy Approach to Linguistic Knowledge Ac-quisition and Assessment in Spatial Decision Making , University of Vechta,90-6164-190-X.
[82] Sahu, B. K., 2001, Aeromagnetics of Continental Areas Flanking the IndianOcean; with Implications for Geological Correlation and Gondwana Reassembly ,University of Capetown, South Africa.
200

ITC Dissertations
[83] Alfestawi, Yahia Ahmed M., 2001, The Structural, Paleogeographical andHydrocarbon Systems Analysis of the Ghadamis and Murzuq Basins, WestLibya, with Emphasis on Their Relation to the Intervening Al Qarqaf Arch,Delft Technical University, 90-6164-198-5.
[84] Liu, Xuehua, 2001, Mapping and Modelling the Habitat of Giant Pandas inFoping Nature Reserve, China, Wageningen University, 90-5808-496-5.
[85] Oindo, Boniface Oluoch, 2001, Spatial Patterns of Species Diversity inKenya, Wageningen University, 90-5808-495-7.
[86] Carranza, Emmanuel John M., 2002, Geologically-constrained Mineral Po-tential Mapping: Examples from the Philippines, Technical University of Delft,90-6164-203-5.
[87] Rugege, Denis, 2002, Regional Analysis of Maize-based Land Use Systems forEarly Warning Applications, Wageningen University, 90-5808-584-8.
[88] Liu, Yaolin, 2002, Categorical Database Generalization in GIS , WageningenUniversity, 90-5808-648-8.
[89] Ogao, Patrick, 2002, Scientific Visualization, Utrecht University, 90-6164-206-X.
[90] Abadi, Abdulbaset Musbah, 2002, Tectonics of the Sirt Basin: Inferencesfrom Tectonic Subsidence Analysis, Stress Inversion and Gravity Modeling ,Vrije Universiteit Amsterdam, 90-6164-205-1.
[91] Geneletti, Davide, 2002, Ecological Evaluation for Environmental Impact As-sessment , Vrije Universiteit Amsterdam, 90-6809-337-1.
[92] Sedogo, Laurent D., 2002, Integration of Local Participatory and RegionalPlanning for Resources Management Using Remote Sensing and GIS , Wagenin-gen University, 90-5808-751-4.
[93] Montoya, Ana Lorena, 2002, Urban Disaster Management: A Case Studyof Earthquake Risk Assesment in Cartago, Costa Rica, Utrecht University, 90-6164-2086.
[94] Mobin-ud Din, Ahmad, 2002, Estimation of Net Groundwater Use in Irri-gated River Basins Using Geo-information Techniques: A Case Study in RechnaDoab, Pakistan, Wageningen University, 90-5808-761-1.
[95] Said, Mohammed Yahya, 2003, Multiscale Perspectives of Species Richnessin East Africa, Wageningen University, 90-5808-794-8.
[96] Schmidt, Karen S., 2003, Hyperspectral Remote Sensing of Vegetation SpeciesDistribution in a Saltmarsh, Wageningen University, 90-5808-830-8.
[97] Lopez Binnquist, Citlalli, 2003, The Endurance of Mexican Amate Paper:Exploring Additional dimensions to the Sustainable Development Concept , Uni-versity of Twente, 90-3651-900-4.
201

ITC Dissertations
[98] Huang, Zhengdong, 2003, Data Integration for Urban Transport Planning ,Utrecht University, 90-6164-211-6.
[99] Cheng, Jianquan, 2003, Modelling Spatial and Temporal Urban Growth,Utrecht University, 90-6164-212-4.
[100] Campos dos Santos, Jose Laurindo, 2003, A Biodiversity InformationSystem in an Open Data-Metadatabase Architecture, University of Twente,9061642140.
[101] Hengl, Tomislav, 2003, Pedometric Mapping: Bridging the Gaps BetweenConventional and Pedometric Approaches, Wageningen University.
[102] Barrera Bassols, Narciso, 2003, Symbolism, Knowledge and management ofSoil and Land Resources in Indigenous Communities: Ethnopedology at Global,Regional and Local Scales, University of Ghent.
[103] Zhan, Qingming, 2003, A Hierarchical Object-based Approach for Urban Land-use Classification from Remote Sensing Data, Wageningen University, 90-5808-917-7.
[104] Daag, Arturo Santos, 2003, Modelling the Erosion of the Pyroclastic FlowDeposits and the Occurrences of Lahars at Mt. Pinatubo, Philipines, UtrechtUniversity, 90-6164-218-3.
[105] Bacic, Ivan Luiz Zilli, 2003, Demand Driven Land Evaluation: With CaseStudies in Santa Catarina, Brazil , Wageningen University, 90-5808-902-9.
[106] Murwira, Amon, 2003, Scale matters! A New Approach to Quantify SpatialHeterogeneity for Predicting the Distribution of Wildlife, Wageningen Univer-sity.
[107] Mazvimavi, Dominic, 2003, Estimation of Flow Characteristics of UngaugedCatchments: A Case Study in Zimbabwe, Wageningen University, 90-5808-950-9.
[108] Tang, Xinming, 2004, Spatial Object Modeling in Fuzzy Topological Spaces:With Applications to Land Cover Change, University of Twente, 90-6164-2205.
[109] Kariuki, Patrick C., 2004, Spectroscopy to measure the swelling potential ofexpansive soils, University of Delft, 90-6164-221-3.
202