Embed Size (px)
Citation preview

The 14th IFToMM World Congress, Taipei, Taiwan, October 25-30, 2015 DOI Number: 10.6567/IFToMM.14TH.WC.PS17.005
Model Establishment and Performance Assessment for Active Regenerative Braking System of Electric Vehicles
Y. H. Hung1, C. C. Chang2 C. H. Wu3 P. Y. Chen4 National Taiwan Normal University National Formosa University Industrial Technology Research Institute
Taipei City, Taiwan, R.O.C Yunlin County, Taiwan, R.O.C Hsinchu County, Taiwan, R.O.C
Abstract: The objective of this study was to research and develop a braking system for electric vehicles by using modeling and experiment methods as well as to assess the performance of this system. First, vehicle dynamic information was employed to develop components for various braking systems. Subsequently, the components were used to develop active brake and passive brake models, and regenerative energy was optimized using rule-based control. Finally, the regenerative efficiency was analyzed. Regarding passive brakes, mechanical braking was adopted to stop vehicles, and the shortages of braking force were compensated using regenerative braking. Conversely, concerning active brakes, regenerative braking was employed to stop vehicles, and the shortages of braking force were compensated using mechanical braking. Physical models developed in this study included high-power motors, high-power lithium batteries, mechanical braking models, and regenerative braking models. To prevent exceedingly high power during the regeneration process from reducing battery life, a regenerative power protection mechanism was created using the iteration method. The global search method was adopted to identify the optimal regenerative braking power. Brake data measurements made using the chassis dynamometer and simulation comparisons showed that the deviation between the actual and simulation braking energy was merely 1.14%, indicating that the physical model developed in this study can represent actual braking systems. To assess the energy recovery efficiency of active regenerative braking, two types of driving cycle, namely the Economic Commission of Europe (ECE) and the federal test procedure (FTP) of the United States Environmental Protection Agency, were used in simulations in this study. For the FTP-type driving cycle, the energy recovery efficiency were 24.05% and 3.489% for active and passive brakes, respectively. For the ECE-type driving cycles, the energy recovery efficiency were 32.92% and 2.786% for active and passive brakes, respectively. These results revealed that the active brake designed in this study features benefits such as optimal energy recovery and can extend the travel distance of electric vehicles. Keywords: Terms—electric vehicle, optimization, regenerative braking
[email protected] [email protected] [email protected] [email protected]
I . Introduction In recent years, because of the increase in environmental
awareness and advocacy of energy conservation and carbon reduction by the government, people have begun to substitute electric energy for traditional gasoline to power vehicles. This has lead to the emergence of the electric vehicle industry. However, although electric vehicles create no environmental pollution, they present disadvantages such as short travel distance as the primary deterrence to commercialization. Therefore, the efficient use of electric energy has become the most critical task in the research and development of electric vehicles. Among the methods that facilitate the efficient use of electric energy, the regenerative braking mechanism features benefits such as energy recycling and extended vehicle cruising range.
Cikanek [1] used a regenerative braking system to provide negative torque to driving wheels, which then transformed the kinetic energy into electric energy to charge batteries. In this study, in addition to examining the regenerative braking control mechanism, we added the regenerative power protection mechanism to prevent an exceedingly high regenerative current from damaging batteries. Dixon [2] connected an ultracapacitor with a main battery by using a direct current-direct current (DC-DC) power converter. A contour plot that measured motor efficiency was employed to calculate the optimal driving efficiency of vehicles, creating a superior design and enabling vehicles to be driven under the favorable conditions. Gao [3] applied the neural network control strategy on a switched reluctance motor to recover energy from regenerative braking. The strategy enabled users to calculate regenerative braking at a specific motor rotational speed. However, the strategy was not optimized. Wicks [4] calculated the fuel consumption of vehicles by simulating the energy used in aerodynamics and rolling resistance and defining the driving cycle of municipal buses. In this study, the energy recovery ratio (ERR) of moving vehicles was assessed using driving cycles. Cao [5] devised a control strategy by applying a robust control to prevent battery failure caused by an exceedingly high regenerative current. Bailey et al. [6] employed an antilock braking system (ABS) and the antilock/traction control/regenerative (ATR) system in hardware-in-the- loop simulations to reduce sensor noise and problems between software and hardware. Lee [7] estimated the energy of the input batteries by examining the power regenerated from wheels and compared the effect of power and energy on rotating inertia between two-wheel an all-wheel drive vehicles during propulsion and regenerative braking. In this current study, dynamic analysis was performed on each wheel to assess the
effectiveness of regenerative braking. Zhang [8] engaged in vehicle development by using Saturn SL1 and devised parallel regenerative braking as well as safe braking control strategies to achieve the objective of maximal energy recovery and ensuring the safety of drivers and passengers. In this current study, the optimal energy recovery efficiency was evaluated using an innovative braking system, and a battery protection mechanism was added. Bird [9] investigated the regenerative braking strategies of two energy recovery systems, one of which used independent DC power sources and the other used power supplied to the DC link of the system. Peng [10] adjusted the hydraulic braking torque and regenerative braking torque by applying the logic threshold control strategy and fuzzy logic control strategy (FCS), respectively. The sum of the two brake/braking torques signified the total brake force. In this current study, the total brake force was obtained before braking commands were issued to optimize mechanical and regenerative braking.
Various vehicle braking-related innovations have been discussed in essays and patented. Mikami [11], Crombez [12], Asanuma [13], Ibaraki [14], Davis [15], and Tanaka [16] have primarily emphasized brake control. In this current study, brake torque was optimized using controllers, and a regenerative power protection mechanism was established on currents to prevent exceedingly high regenerative power from damaging batteries. In addition, Ito [17], Fox [18], and Tsuchiya [19] have tested the regenerative braking mechanism on electric vehicles to assess its energy recovery rate.
The largest difference between the method applied in this study and those proposed in the aforementioned studies was the use of rule-based control to optimize regenerative braking energy. Concerning brake compensation, the rotation-to-transmission/rotation to linear motion (RTT) mechanism was controlled using stepper motors to enable master cylinders to properly allocate the brake force to tires, supplying the required brake force and maintaining maximal regenerative energy. ERR was subsequently defined and quantified to facilitate assessment.
II. System ArchitectureA. Braking System Actuation Mechanism
In this study, the brake-by-wire system was used as thebraking system. Currently, most brake-by-wire systems determine the magnitude of the brake force allocated to each wheel by detecting the speed at which drivers step on the pedal as well as the distance of travel. In addition, control systems such as the ABS and electronic power steering system were added to calculate the hydraulic brake pressure required to stop each tire. This enabled the hydraulic pressure required by cylinders to be allocated to each wheel [20].
The brake-by-wire system employed in this study is shown in Fig. 1. The system was divided into two parts, namely mechanical braking and regenerative braking. Regarding mechanical braking, pedal depth signals were input into the vehicle control unit (VCU), which then allocated a reasonable amount of braking energy to facilitate mechanical braking (by hydraulic pressure) and
regenerative braking. Regarding mechanical braking, VCU control signals were input into stepper motors, which then activated the RTT mechanism, inputting the stepping amount of brake fluid into the brake master cylinder. This created the total mechanical brake force. The hydraulic brake actuate component then distributed an appropriate amount of brake force to each wheel according to the hydraulic cylinder pressure proportions. Regarding regenerative braking, after inputting the torque control into the motor control unit and attaining the motor rotational speed, the appropriate regenerative braking force could be obtained. The sum of the mechanical and regenerative braking energy was called the total braking energy.
Fig. 1. Architectural diagram of the braking system.
B. Vehicle Dynamics and the Regenerative Braking Model
Regarding vehicle dynamics and the regenerative braking model, models were created for the dynamics of electric vehicles, such as motor drive torque, brake force control, vehicle dynamics, and regenerative braking efficiency, which are described as follows:
B1. Drive Motor and Hydraulic Brake Control: Drive Motor and Hydraulic Brake Control: To control motors and brake signals, module design of the proportional-integral-derivative (PID) controller was made. Inputs for the module comprised actual vehicle velocity ( xV ) and reference vehicle velocity (refV ), which were
used to derive the deviation in vehicle velocity, . These values were then sent to the PID controller to limit the output values. The output values subsequently obtained represented the motor drive torque commands and braking commands. The formulas used to calculate the braking
command ( cmdbrk,τ ) and motor drive torque command
( cmdmtr,τ ) are presented as follows:
−≡∆
∆+∆=
=
∫refx
t
bIbpbrk
brkbrkcmdbrk
VVV
VdtKVK
G
0,,
,
(%)α
ατ
(1)
∫ ∆
+∆=
= t
mImpmtr
mtrmtrcmdmtrVdtK
VK
G
0,,
,
(%)αατ
(2)
where brkG and mtrG are the gain values; bpK , and
mpK , denote the proportional gain control value; bIK ,
and mIK , signify the integral gain control values; brkαand mtrα represent the degree of opening of the brakes
and degree of opening of the throttle, respectively. After obtaining the braking or drive torque command values, a limit range was set for the output values.
The relationship between commands and actual output values is described as follows: For vehicle braking, the brake torque ratio (BTR) was defined. The BTR formula is shown as follows:
cmdbrk
cmdregBTR,
,
ττ
≡ (3)
When BTR equaled 1, it signified that the braking command value equaled the regenerative braking command value; in other words, regenerative braking was responsible for all of the braking energy generated. When BTR equaled 0, it meant that the regenerative braking command value equaled 0; in other words, mechanical braking was responsible for all of the braking energy created. After the regenerative braking torque commands and motor rotational speeds were input into the regenerative braking module, the motor rotational speeds could be used to obtain the corresponding maximal motor torque
( ( )rpmmotorregcmdreg max,max,, τττ == ). By comparing
the maximal motor torque with the command values, a minimal value was obtained. This minimal value represented the actual power generation torque of the motor, which is represented by the formula
( )),min( max,,, rpmregcmdregregbrk τττ = . Subsequently, by
subtracting the regenerative braking torque from the braking command, the mechanical brake torque was derived, as shown in the formula below:
regbrkcmdbrkmechbrk ,,, τττ −= (4)
Concerning the drive motor controller, steps similar to the regenerative braking module were used. The motor rotational speeds were input into the maximum
torque curve ( ( )rpmmotormtrcmdmtr max,max,, τττ == ), and
comparisons were made to obtain the minimal value, which represented the actual drive torque of the motor. The formula is presented as follows:
( )),min( max,, rpmmtrcmdmtrmotor τττ = .
B2. Motor Drive and Regenerative Braking Efficiency: Inputs for the module comprised motor rotational speed, motor drive torque, and brake torque. Comparisons were made with the T-N efficiency chart of the motor to obtain the discharge efficiency of the motor and regenerative braking efficiency, which is represented by the formula below:
=
=
),(
),(
,,,
,,,
motorregbrkchamcham
motordrvmtrdismdism
ωτηηωτηη
(5)
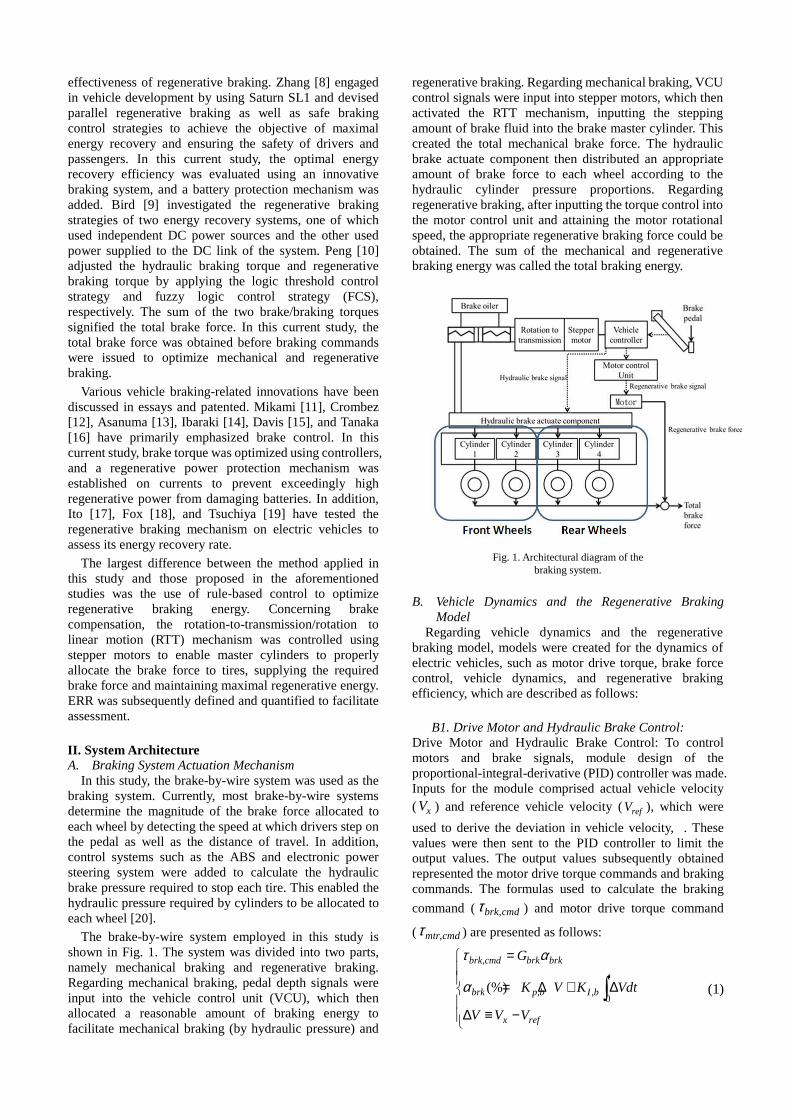
B3. Lithium battery system: For the batteries used in this study, the internal resistance method [21] was adopted (Fig. 2). The lithium battery module was an inner resistance model with a first order dynamic state-of-charge (SOC). For this model, motor drive and regenerative braking efficiency power were used as system inputs, and the SOC of batteries and charge and discharge current of batteries were used as system outputs. The first step of the calculation was to determine the discharge resistance (or charging resistance) and open circuit voltage that were to be used, which were all functions of , shown as follows:
=
=
<=
)(
0≥,)(
0,)(
,,
,,
bOCOC
bbdisbdisb
bbchabchab
SOCVV
PSOCRR
PSOCRR
(6)
where bP was the charge and discharge power of the
lithium battery (the method by which these values were obtained are explained below). When 0<bP , the
battery was charging; when 0≥bP , the battery was
discharging. chabR , represents the charging resistance,
disbR , represents the discharge resistance, and OCV
represents the open circuit voltage. The dynamic equation used to calculate the lithium battery charge and discharge current is shown below:
( ) ( ))(2
)(42
bb
bbbbOCbOCb SOCR
SOCRPSOCVSOCVI
−−= (7)
where was the charge and discharge current of the battery and was the battery resistance. The terminal voltage of the batteries can be expressed as follows:
( ) ( ) ( )bbbbOCbb SOCRISOCVSOCV −= (8)
The dynamic equation for the module used to calculate changes in the SOC of lithium batteries was derived by applying the integral of the electric charge, as shown below:
( )b
t
tt
b
ibb Q
dttI
SOCtSOC
∫=+= 0
)(
, (9)
Fig. 2. Circuit diagram of the inner resistance model.
B4. Energy Recovery Calculation Module: To obtain the optimal energy recovery efficiency, the amount of energy supplied by batteries during charge
and discharge must be calculated. However, to obtain the amount of energy supplied by batteries during charge and discharge, the charge and discharge power of batteries must be determined. The charge power
regbP , was calculated by multiplying the regenerative
braking power ( chamP , ) of the motor by the regenerative
braking efficiency ( cham,η ) of the motor, as shown
below:
),( ,,,, motorregbrkchamchamregb PP ωτη×= (10)
Regarding motor drive, the discharge power (disbP , )
of the battery was calculated by dividing the motor
drive power ( dismP , ) by the discharge efficiency of the
motor ( dism,η ), as follows
),(/ ,,,, motordrvmtrdismdismdisb PP ωτη= (11)
The battery current was calculated by substituting (10) and (11) into (7), and the total energy from charging and discharging was obtained by applying the
integral of regbP , and bdisP, . By dividing the charge
energy ( regE ) by the discharge energy (disE ), the
quantitative indicator of recycling efficiency defined in this study (i.e., the ERR), was obtained.
( ) ( )( )dttP
dttP
E
EERR
disb
chab
dis
cha
∫
∫==,
,% (12)
The higher the ERR (%), the more efficient the regenerative braking is in recovering drive energy.
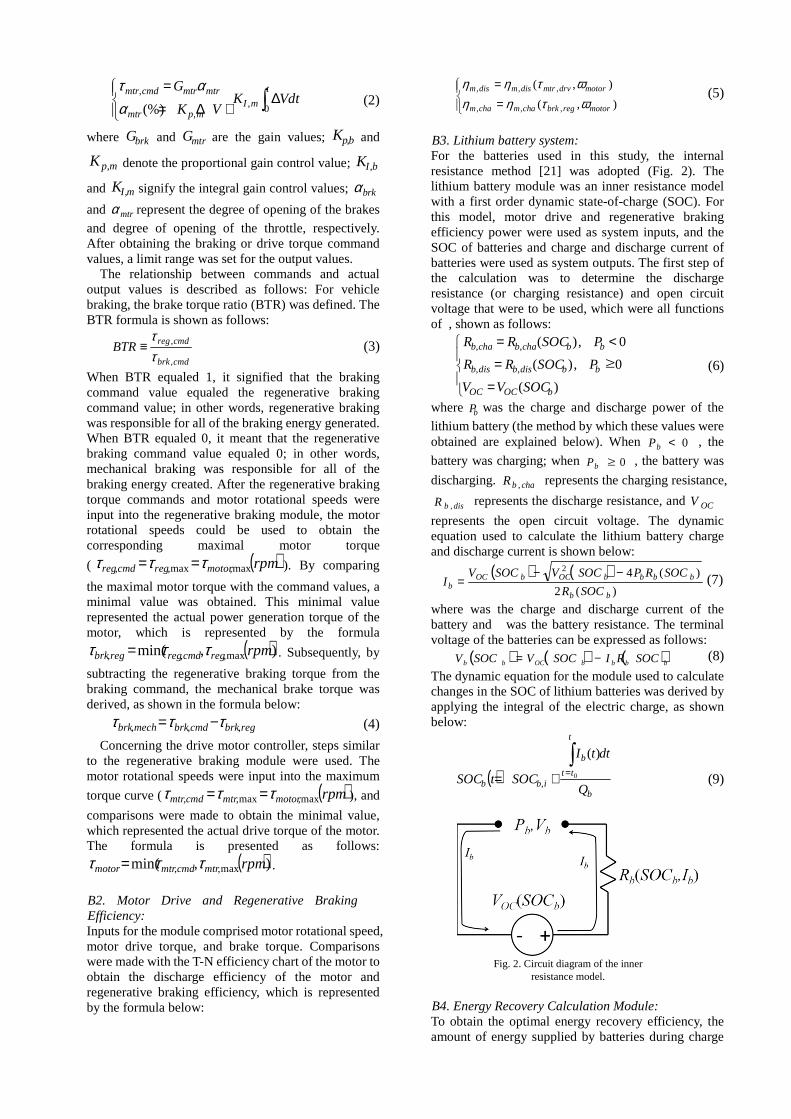
B5. Dynamic Control Module of Vehicles: The vehicle dynamics examined in this study were changes in first order vehicle velocity caused by vehicle mass. Inputs for the module consisted of motor drive and brake torque, which were calculated to produce vehicle velocities and motor rotational speeds. Regarding vehicle dynamics, vehicles moving forward at a velocity of v produce a total driving force of Fdrv. However, moving vehicles are subject to influence from wind resistance (Fwind) and rolling resistance, which consumes part of the total kinetic energy. When vehicles brake, a brake torque (brkτ ) moving in the
direction opposite to tire rotation is created, reducing vehicle speed.
Fig. 3. Diagram of forces exerted on the vehicle.
The vehicle dynamic equation can be expressed as follows:
windrollwbrkdrvvv FFRFdtdvmF −−−=⋅= // τ (13) v was identified by applying the integral of (13):
dtm
FFRFv
v
windrollwbrkdrv∫
−−⋅−= τ (14)
where drvF signifies the driving force, brkτrepresents the brake torque, rollF denotes the rolling
resistance, windF indicates the wind resistance, wRis the tire radius, and vm is the vehicle mass. After
obtaining the vehicle velocity and vehicle radius, the rotational speeds of the tires were obtained.
dtRm
FFRF
R
v
wv
windrollwbrkdrv
ww ∫ ⋅
−−⋅−== τω (15)
The various resistances listed in (13) were represented using a formula. The dynamic equation of rolling resistance is shown below:
gmF vroll µ= (16)The dynamic equation of wind resistance is presented as follows:
2
2
1VACF fdawind ρ= (17)
where µ is the coefficient of friction, aρ is the air
density, dC is the wind resistance coefficient, andfAis the frontal area.
III. Optimal Regenerative Braking ControlA. Rule-Based Control for Active and Passive Brakes
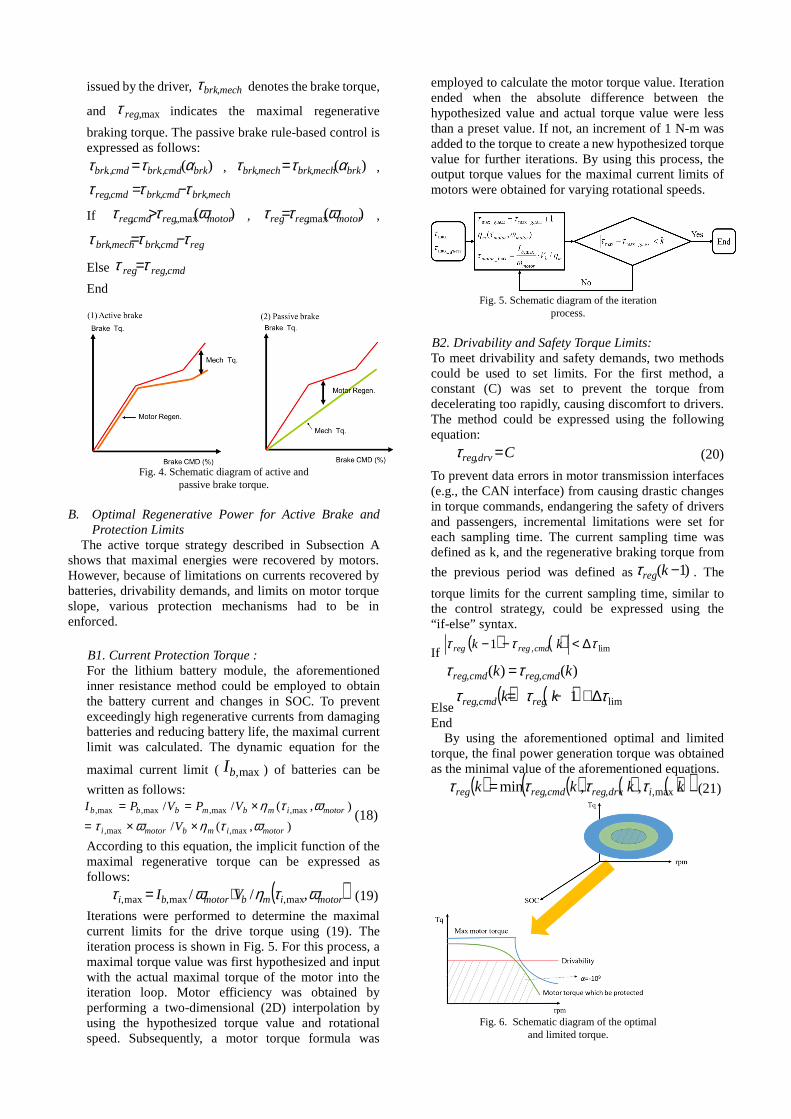
To assess the ERR from braking by using the method developed in this study, the ERR of the active brake module was compared with that of the passive brake module. Fig. 4 shows the schematic diagram of active and passive brake controls. The active brake control strategy is detailed as follows: When drivers stepped on the brake pedal, they created a degree of opening of the brakes ( brkα ). This degree of opening of the brake was converted
to a brake torque command. By sending the brake torque command to the regenerative braking control module, the regenerative braking torque was obtained. The regenerative braking torque was compared with the total brake torque. Shortages in the regenerative braking torque were compensated using the mechanical brake. Conversely, the passive brake control strategy is detailed as follows: A mechanical structure in which drivers continuously stepped on the brake pedal was used which created a mechanical torque proportional to the degree of opening of the brakes. Shortages in the mechanical torque was compensated using the regenerative brake. The “if-else” rule-based control for active brake is expressed as follows:
)(.,., brkcmdbrkcmdbrk αττ = ,
If )(max,, motorregcmdbrk ωττ ≤ , cmdbrkreg ,ττ = , 0, =mechbrkτ ,
regabrk ττ =,
Elseif )(max,, motorregcmdbrk ωττ > , )(max, motorregreg ωττ = ,
)(max,,, motorregcmdbrkmechbrk ωτττ −= ,
where cmdbrk,τ signifies the brake torque command
issued by the driver, mechbrk,τ denotes the brake torque,
and max,regτ indicates the maximal regenerative
braking torque. The passive brake rule-based control is expressed as follows:
)(.,., brkcmdbrkcmdbrk αττ = , )(,, brkmechbrkmechbrk αττ = ,
mechbrkcmdbrkcmdreg ,,, τττ −=
If )(max,,, motorregcmdreg ωττ > , )(max, motorregreg ωττ = ,
regcmdbrkmechbrk τττ −= ,,
Else cmdregreg ,ττ =End
Fig. 4. Schematic diagram of active and passive brake torque.
B. Optimal Regenerative Power for Active Brake and Protection Limits
The active torque strategy described in Subsection A shows that maximal energies were recovered by motors. However, because of limitations on currents recovered by batteries, drivability demands, and limits on motor torque slope, various protection mechanisms had to be in enforced.
B1. Current Protection Torque : For the lithium battery module, the aforementioned inner resistance method could be employed to obtain the battery current and changes in SOC. To prevent exceedingly high regenerative currents from damaging batteries and reducing battery life, the maximal current limit was calculated. The dynamic equation for the
maximal current limit ( max,bI ) of batteries can be
written as follows:
),(/
),(//
max,max,
max,max,max,max,
motorimbmotori
motorimbmbbb
V
VPVPI
ωτηωτωτη
××=×==
(18)
According to this equation, the implicit function of the maximal regenerative torque can be expressed as follows:
( )motorimbmotorbi VI ωτηωτ ,// max,max,max, ⋅= (19)
Iterations were performed to determine the maximal current limits for the drive torque using (19). The iteration process is shown in Fig. 5. For this process, a maximal torque value was first hypothesized and input with the actual maximal torque of the motor into the iteration loop. Motor efficiency was obtained by performing a two-dimensional (2D) interpolation by using the hypothesized torque value and rotational speed. Subsequently, a motor torque formula was
employed to calculate the motor torque value. Iteration ended when the absolute difference between the hypothesized value and actual torque value were less than a preset value. If not, an increment of 1 N-m was added to the torque to create a new hypothesized torque value for further iterations. By using this process, the output torque values for the maximal current limits of motors were obtained for varying rotational speeds.
Fig. 5. Schematic diagram of the iteration process.
B2. Drivability and Safety Torque Limits: To meet drivability and safety demands, two methods could be used to set limits. For the first method, a constant (C) was set to prevent the torque from decelerating too rapidly, causing discomfort to drivers. The method could be expressed using the following equation:
Cdrvreg =,τ (20)
To prevent data errors in motor transmission interfaces (e.g., the CAN interface) from causing drastic changes in torque commands, endangering the safety of drivers and passengers, incremental limitations were set for each sampling time. The current sampling time was defined as k, and the regenerative braking torque from
the previous period was defined as )1( −kregτ . The
torque limits for the current sampling time, similar to the control strategy, could be expressed using the “if-else” syntax.
If ( ) ( ) lim,1 τττ ∆<−− kk cmdregreg
)()( ,, kk cmdregcmdreg ττ =
Else( ) ( ) lim, 1 τττ ∆+−= kk regcmdreg
End
By using the aforementioned optimal and limited torque, the final power generation torque was obtained as the minimal value of the aforementioned equations.
( ) ( ) ( ) ( )( )kkkk idrvregcmdregreg max,,, ,,min ττττ = (21)
Fig. 6. Schematic diagram of the optimal and limited torque.
IV. Experiment Simulation Results and DiscussionThe results from the mechanical braking experiment
were measured using vehicle chassis dynamometers. Model vehicles described in Section II were compared with actual vehicles to determine the level of accuracy. Verified vehicle models were then integrated with the active and passive braking system, and the regenerative energy and efficiency were simulated and evaluated using two types of driving cycle. Finally, a results discussion was provided.
A. Experiment Results Measured Using the Chassis Dynamometer and Comparisons from Simulations
To obtain the brake force data of actual vehicles, vehicle parameters were entered into the chassis dynamometer to facilitate tests. The various vehicle parameters are shown in Table 1.
Table 1. Vehicle parameters
Parameter Value Vehicle Weight 1400 kg Frontal Area 3 m2 Tire Radius 0.27 m Rolling Resistance Coefficient 0.085 Wind Resistance Coefficient 0.4
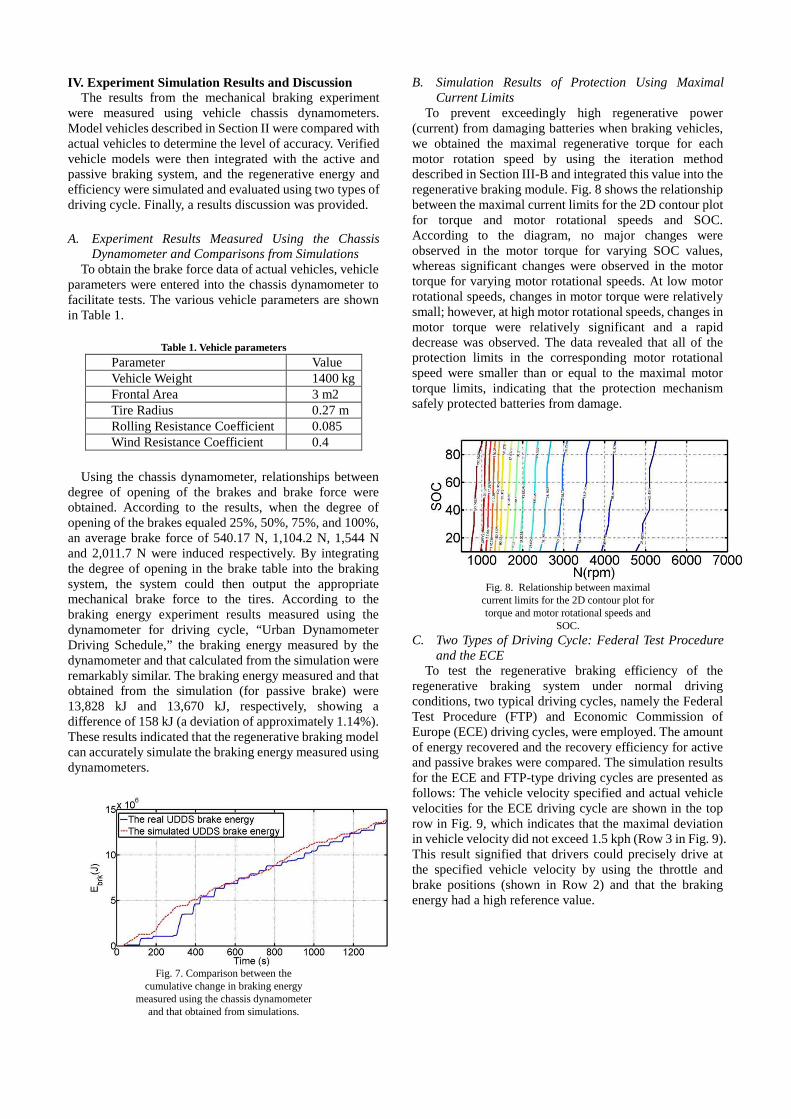
Using the chassis dynamometer, relationships between degree of opening of the brakes and brake force were obtained. According to the results, when the degree of opening of the brakes equaled 25%, 50%, 75%, and 100%, an average brake force of 540.17 N, 1,104.2 N, 1,544 N and 2,011.7 N were induced respectively. By integrating the degree of opening in the brake table into the braking system, the system could then output the appropriate mechanical brake force to the tires. According to the braking energy experiment results measured using the dynamometer for driving cycle, “Urban Dynamometer Driving Schedule,” the braking energy measured by the dynamometer and that calculated from the simulation were remarkably similar. The braking energy measured and that obtained from the simulation (for passive brake) were 13,828 kJ and 13,670 kJ, respectively, showing a difference of 158 kJ (a deviation of approximately 1.14%). These results indicated that the regenerative braking model can accurately simulate the braking energy measured using dynamometers.
Fig. 7. Comparison between the cumulative change in braking energy
measured using the chassis dynamometer and that obtained from simulations.
B. Simulation Results of Protection Using Maximal Current Limits
To prevent exceedingly high regenerative power (current) from damaging batteries when braking vehicles, we obtained the maximal regenerative torque for each motor rotation speed by using the iteration method described in Section III-B and integrated this value into the regenerative braking module. Fig. 8 shows the relationship between the maximal current limits for the 2D contour plot for torque and motor rotational speeds and SOC. According to the diagram, no major changes were observed in the motor torque for varying SOC values, whereas significant changes were observed in the motor torque for varying motor rotational speeds. At low motor rotational speeds, changes in motor torque were relatively small; however, at high motor rotational speeds, changes in motor torque were relatively significant and a rapid decrease was observed. The data revealed that all of the protection limits in the corresponding motor rotational speed were smaller than or equal to the maximal motor torque limits, indicating that the protection mechanism safely protected batteries from damage.
Fig. 8. Relationship between maximal current limits for the 2D contour plot for torque and motor rotational speeds and
SOC.
C. Two Types of Driving Cycle: Federal Test Procedure and the ECE
To test the regenerative braking efficiency of the regenerative braking system under normal driving conditions, two typical driving cycles, namely the Federal Test Procedure (FTP) and Economic Commission of Europe (ECE) driving cycles, were employed. The amount of energy recovered and the recovery efficiency for active and passive brakes were compared. The simulation results for the ECE and FTP-type driving cycles are presented as follows: The vehicle velocity specified and actual vehicle velocities for the ECE driving cycle are shown in the top row in Fig. 9, which indicates that the maximal deviation in vehicle velocity did not exceed 1.5 kph (Row 3 in Fig. 9). This result signified that drivers could precisely drive at the specified vehicle velocity by using the throttle and brake positions (shown in Row 2) and that the braking energy had a high reference value.
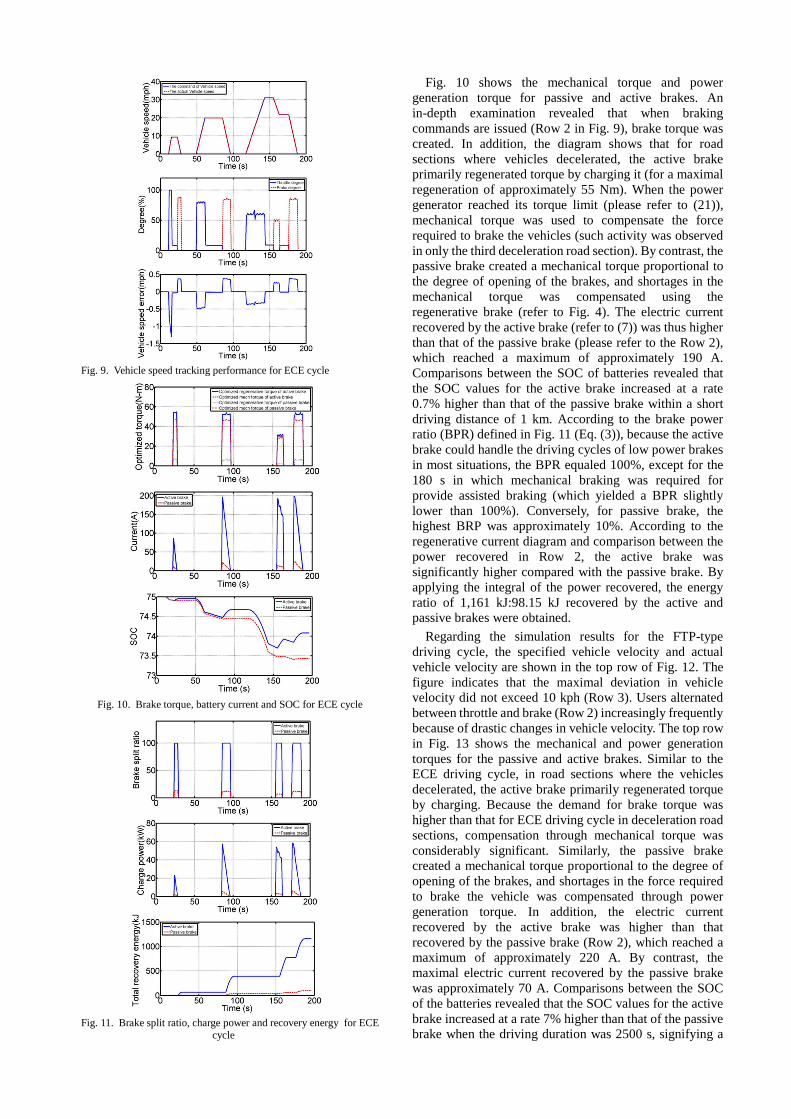
Fig. 9. Vehicle speed tracking performance for ECE cycle
Fig. 10. Brake torque, battery current and SOC for ECE cycle
Fig. 11. Brake split ratio, charge power and recovery energy for ECE cycle
Fig. 10 shows the mechanical torque and power generation torque for passive and active brakes. An in-depth examination revealed that when braking commands are issued (Row 2 in Fig. 9), brake torque was created. In addition, the diagram shows that for road sections where vehicles decelerated, the active brake primarily regenerated torque by charging it (for a maximal regeneration of approximately 55 Nm). When the power generator reached its torque limit (please refer to (21)), mechanical torque was used to compensate the force required to brake the vehicles (such activity was observed in only the third deceleration road section). By contrast, the passive brake created a mechanical torque proportional to the degree of opening of the brakes, and shortages in the mechanical torque was compensated using the regenerative brake (refer to Fig. 4). The electric current recovered by the active brake (refer to (7)) was thus higher than that of the passive brake (please refer to the Row 2), which reached a maximum of approximately 190 A. Comparisons between the SOC of batteries revealed that the SOC values for the active brake increased at a rate 0.7% higher than that of the passive brake within a short driving distance of 1 km. According to the brake power ratio (BPR) defined in Fig. 11 (Eq. (3)), because the active brake could handle the driving cycles of low power brakes in most situations, the BPR equaled 100%, except for the 180 s in which mechanical braking was required for provide assisted braking (which yielded a BPR slightly lower than 100%). Conversely, for passive brake, the highest BRP was approximately 10%. According to the regenerative current diagram and comparison between the power recovered in Row 2, the active brake was significantly higher compared with the passive brake. By applying the integral of the power recovered, the energy ratio of 1,161 kJ:98.15 kJ recovered by the active and passive brakes were obtained.
Regarding the simulation results for the FTP-type driving cycle, the specified vehicle velocity and actual vehicle velocity are shown in the top row of Fig. 12. The figure indicates that the maximal deviation in vehicle velocity did not exceed 10 kph (Row 3). Users alternated between throttle and brake (Row 2) increasingly frequently because of drastic changes in vehicle velocity. The top row in Fig. 13 shows the mechanical and power generation torques for the passive and active brakes. Similar to the ECE driving cycle, in road sections where the vehicles decelerated, the active brake primarily regenerated torque by charging. Because the demand for brake torque was higher than that for ECE driving cycle in deceleration road sections, compensation through mechanical torque was considerably significant. Similarly, the passive brake created a mechanical torque proportional to the degree of opening of the brakes, and shortages in the force required to brake the vehicle was compensated through power generation torque. In addition, the electric current recovered by the active brake was higher than that recovered by the passive brake (Row 2), which reached a maximum of approximately 220 A. By contrast, the maximal electric current recovered by the passive brake was approximately 70 A. Comparisons between the SOC of the batteries revealed that the SOC values for the active brake increased at a rate 7% higher than that of the passive brake when the driving duration was 2500 s, signifying a
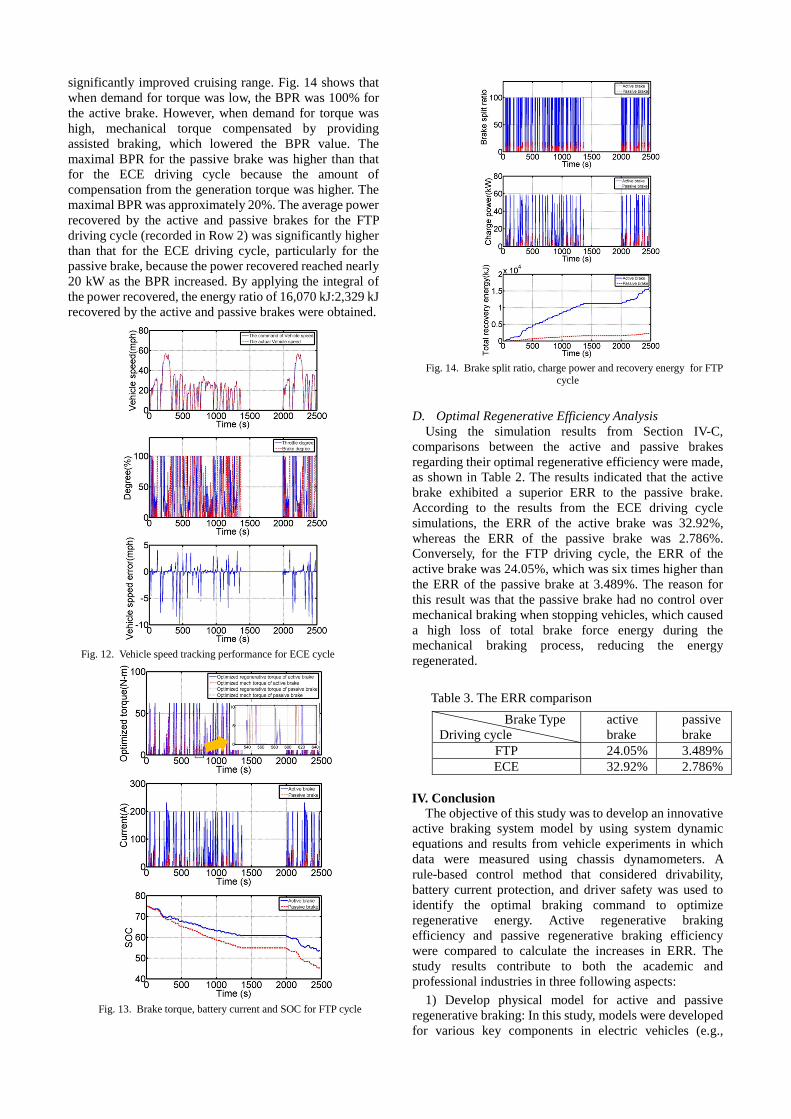
significantly improved cruising range. Fig. 14 shows that when demand for torque was low, the BPR was 100% for the active brake. However, when demand for torque was high, mechanical torque compensated by providing assisted braking, which lowered the BPR value. The maximal BPR for the passive brake was higher than that for the ECE driving cycle because the amount of compensation from the generation torque was higher. The maximal BPR was approximately 20%. The average power recovered by the active and passive brakes for the FTP driving cycle (recorded in Row 2) was significantly higher than that for the ECE driving cycle, particularly for the passive brake, because the power recovered reached nearly 20 kW as the BPR increased. By applying the integral of the power recovered, the energy ratio of 16,070 kJ:2,329 kJ recovered by the active and passive brakes were obtained.
Fig. 12. Vehicle speed tracking performance for ECE cycle
Fig. 13. Brake torque, battery current and SOC for FTP cycle
Fig. 14. Brake split ratio, charge power and recovery energy for FTP cycle
D. Optimal Regenerative Efficiency Analysis Using the simulation results from Section IV-C,
comparisons between the active and passive brakes regarding their optimal regenerative efficiency were made, as shown in Table 2. The results indicated that the active brake exhibited a superior ERR to the passive brake. According to the results from the ECE driving cycle simulations, the ERR of the active brake was 32.92%, whereas the ERR of the passive brake was 2.786%. Conversely, for the FTP driving cycle, the ERR of the active brake was 24.05%, which was six times higher than the ERR of the passive brake at 3.489%. The reason for this result was that the passive brake had no control over mechanical braking when stopping vehicles, which caused a high loss of total brake force energy during the mechanical braking process, reducing the energy regenerated.
Table 3. The ERR comparison
IV. ConclusionThe objective of this study was to develop an innovative
active braking system model by using system dynamic equations and results from vehicle experiments in which data were measured using chassis dynamometers. A rule-based control method that considered drivability, battery current protection, and driver safety was used to identify the optimal braking command to optimize regenerative energy. Active regenerative braking efficiency and passive regenerative braking efficiency were compared to calculate the increases in ERR. The study results contribute to both the academic and professional industries in three following aspects:
1) Develop physical model for active and passiveregenerative braking: In this study, models were developed for various key components in electric vehicles (e.g.,
Brake Type Driving cycle
active brake
passive brake
FTP 24.05% 3.489% ECE 32.92% 2.786%

batteries, drive motor, and braking system) and low-ordered longitudinal dynamics. By performing actual tests by using the vehicle chassis dynamometer and engaging in parameter estimates, the deviation between theoretical models and actual experiment results can be reduced to 1.14%.
2) Facilitate optimal energy recovery and control: Byusing rule-based control, an active and passive-type dynamic distribution mechanism for generative and mechanical braking can be developed. The mechanism will be able to consider maximal current protection (obtained by iteration calculations), drivability, and safety.
3) Assess energy recovery efficiency: By defining theBPR and performing simulations by using the ECE and FTP driving cycles, the ERR values can be obtained. For the ECE driving cycle, the ERR for the active and passive brakes was 32.92% and 2.786%, respectively. For the FTP driving cycle, the ERR for the active and passive brakes was 24.05% and 3.489%, respectively. These results confirm that the active brake designed in this study features benefits such as optimal energy recovery and can extend the travel distance of electric vehicles.
The innovative active braking system will be installed on target vehicles in the future for further tests. The objective is to substantially enhance the cruising range and efficiency of electric vehicles.
Acknowledgements The authors would like to thank National Science
Council of the Republic of China, Taiwan for their financially support to this research under Contract No.: NSC 99-2221-E-003-008-, NSC 99-2221-E-003-007- and MOST 103-2218-E-150-002-MY2, respectively.
References [1] Cikanek, S.R., and Bailey, K. E. 2002. Regenerative Braking System
For A Hybrid Electric Vehicle. Proceedings of American Control Conference. 4: 3129-3134.
[2] Dixon, J.W., and Ortuzar, M.E. 2002. Ultracapacitors + DC-DC converters in regenerative braking system. IEEE Aerospace and Electronic Systems Magazine. 17: 16-21.
[3] Gao H., Gao Y., and Ehsani, M. 2001. A neural network based SRM drive control strategy for regenerative braking in EV and HEV. IEEE Int.Electric Machines and Drives Conference: 571 - 575
[4] Wicks, F., and Donnelly, K. 1997. Modeling regenerative braking and storage for vehicles. Intersociety Energy Conversion Engineering Conference. 3: 2030-2035.
[5] Cao, B., Bai, Z., and Zhang, W. 2005. Research on control for regenerative braking of electric Vehicle. Proceedings of IEEE International Conference on Vehicular Electronics and Safety: 14-16.
[6] Bailey, K.E. 1998. ABS/Traction Assist regenerative Braking Application of Hardware-in the-Loop. Proceedings of the 1998 American Control Conference. 1: 503-507.
[7] Lee, J., and Nelson, D.J. 2005. Rotating Inertia Impact on Propulsion and Regenerative Braking for Electric Motor Driven Vehicles. 2005 IEEE Conference, Vehicle Power and Propulsion.
[8] Zhang, J., Song, B., and Niu, X. 2008. Optimization of parallel regenerative braking control strategy. IEEE. Vehicle Power and Propulsion Conference:1-4.
[9] Bird, B.M., and Mehta, P. 1972. Regenerative braking in slip-power-recovery systems. Proceedings of the Institution of Electrical Engineers. 119: 1343-1344.
[10] Peng, D., Zhang, Y., Yin, C. L., and Zhang, J. W. 2008. Combined control of a regenerative braking and antilock braking system for hybrid electric vehicles. International Journal of Automotive Technology. 9(6): 749-757.
[11] Mikami, T., and Taga, Y. 1998. Apparatus for controlling electric generator of hybrid drive vehicle to control regenerative brake
depending upon selected degree of drive source brake application. U.S. Patent No. US5839533A.
[12] Crombez., D.S., and Napier, S.L. 2004. Combined regenerative and friction braking system for a vehicle. U.S. Patent No. US006687593B1.
[13] Asanuma, N., Ohno, A, and Toyota, H. 1994. Electric vehicle regenerative and friction braking control system. U.S. Patent No. US005322352A.
[14] Ibaraki, R., and Taga, Y. 1999. Regenerative brake controller for controlling value of regenerative braking torque simulating engine braking torque. U.S. Patent No. US5915801A.
[15] Davis, R.I. 1994 . Adaptive controller for regenerative and friction braking system. European Patent No. EP0361708B1.
[16] Tanaka, K., and Shima, T. 1994. Regenerative braking system for car. European Patent No. EP0366088B1.
[17] Ito, M., Kawahata, F., Nakamura, K., Ohkubo, M., Otomo, A., and Sakai, A. 1999. Brake apparatus for an electric vehicle to maximize regenerative energy. U.S. Patent No. US5895100A
[18] Fox, A. M., and Morton, J. 1989. Regenerative braking systems. European Patent No. EP0280478A3.
[19] Tsuchiya, Y., and Kurabayashi, K. 1995. Energy recovery system for motor vehicle. European Patent No. EP0418995B1.
[20] Chen, C.C., Hsieh, S.H., and Luo, M.F. 2007. The Study and Experiment of Vehicle Stability Control for Brake by Wire System. NSC 95-2218-E-006-039.
[21] Sato, S., and Kawamura, A. 2002. A new estimation method of state of charge using terminal voltage and internal resistance for lead acid battery. Proceedings of the Power Conversion Conference. 2: 565 - 570.

![REGENERATIVE BRAKING SYSTEM IN ELECTRIC VEHICLES · REGENERATIVE BRAKING SYSTEM IN ELECTRIC VEHICLES ... REGENERATIVE BRAKING SYSTEM ... Regenerative action during braking[9]](https://img.pdfslide.net/doc/110x75/5adccef67f8b9a1a088c7cf0/regenerative-braking-system-in-electric-vehicles-braking-system-in-electric-vehicles.jpg)