Embed Size (px)
Citation preview

(IJACSA) International Journal of Advanced Computer Science and Applications,
Vol. 12, No. 3, 2021
156 | P a g e
www.ijacsa.thesai.org
Model for Predicting Customer Desertion of
Telephony Service using Machine Learning
Carlos Acero-Charaña1, Erbert Osco-Mamani
2
Universidad Nacional Jorge Basadre Grohmann
E.P. Informatica y Sistemas, Tacna-Peru
Tito Ale-Nieto3
Universidad Privada de Tacna
E.P. de Sistemas, Tacna-Peru
Abstract—In the present study, it is observed that many
people are affected by the services provided by telephony, who
leave the service for different reasons, for which the use of a
model based on decision trees is proposed, which allows
predicting potential dropouts from Customers of a
telecommunications company for telephone service. To verify the
results, several algorithms were used such as neural networks,
support vector machine and decision trees, for the design of the
predictive models the KNIME software was used, and the quality
was evaluated as the percentage of correct answers in the
predicted variable. The results of the model will allow acting
proactively in the retention of clients and improves the services
provided. A data set with 21 predictor variables that influence
customer churn was used. A dependent variable (churn) was
used, which is an identifier that determines if the customer left =
1, did not leave = 0 the company's service. The results with a test
data set reach a precision of 91.7%, which indicates that decision
trees turn out to be an attractive alternative to develop prediction
models of customer attrition in this type of data, due to the
simplicity of interpretation of the results.
Keywords—Software KNIME; Support Vector Machine (SVM);
neural networks; decision trees
I. INTRODUCTION
The study of churn or customer drop-out is an area in which large resources are invested year after year. Always, with the intention of being able to discover in advance, whether a customer will decide to switch from a company to their competition.
In particular, in the area of telecommunications, it has become increasingly necessary to study customer flight, given the high competitiveness that is developing globally. In the telecommunications industry from 2008 to 2010, customer leakage became 30% annual [13, 15] (pre-numerical portability studies). The objective of this article is to build mathematical models based on data to estimate the probability of customer desertion from telephone companies conditioned on the value of their individual and/or network attributes and/or since it has survived a given time in the company.
From the above, it follows that customer loss is an industry problem and where it becomes necessary to apply advanced tools that allows predicting and describe in some way, which customers have the greatest risk potential to change companies.
A classification tree allows you to visually set the conditions that a client must have to enter a dropout condition, while a neural network only eventually reports the result of the
prediction. Such differences are crucial when implementing preventive actions to prevent leakage [2]. In other words, the predictive model must not only perform well in classification, but also be interpretable to identify actions for customer tenure in the organization.
The mining technique selected for the design of the proposed predictive model is the classification type decision tree, because it is a predictive technique and the data available for model development correspond to categorical and discrete variables, which conform to the characteristics of a decision tree, in addition to the feasibility of interpreting the information obtained graphically [8].
The result of the application of the algorithm, allows build a decision tree which has the advantage of being easy to interpret and allows quickly and easily to the user, determine if a client, given a set of attributes that defines their historical behavior, is at risk of leaving the service [3].
On the other hand, data mining delivers promising results, we test models based on algorithms such as Neural Networks (ANN), Support Vector Machines (SVM) and Decision Tree, which our based model is expected to improve the limitations of traditional models.
II. THEORETICAL FRAMEWORK
A. Basics and Types of Customer Leakage
Customer flight, within telecommunications, occurs when a customer cancels the service provided by the company [10]. In such cancellation, the client can decide to resign from the company (voluntary), or the company can expel him (involuntary).
In particular, the connotation of churn refers to customer flight, so for the purposes of this study, churn is counted based on the customer's decision to leave the company by canceling a service. Also, churn can be understood as that term used to collectively describe the termination of services of a customer's subscription, where the customer is someone who has joined the company for at least a period of time ... a churner or fugitive is a customer who has left the company [6]. The main types of fugue according to [6, 12] are:
Absolute: subscribers who have unlinked on the total database in a period.
From line or service: This type of churn the number of discontinued services on the total database.
(IJACSA) International Journal of Advanced Computer Science and Applications,
Vol. 12, No. 3, 2021
157 | P a g e
www.ijacsa.thesai.org
Primary: Regarding the number of failures Secondary: Decrease in traffic volume.
Package leak: This leak is characterized by the fact that plans and / or products change within the company [6].
Company flight: Undoubtedly the most expensive, in this case the client escapes towards the competition, therefore, not only is the income not received, but also the company's prestige expressed in the participation of competing market.
B. Predictive Models
Predictive analysis model is a name given to a collection of mathematical techniques with the common goal of finding a mathematical relationship between an objective, response or dependent variable and various predictive factors and independent variables, with the objective of measuring future values of these predictor factors and inserting them into the mathematical relationship to predict future values of the target variable. Since these relationships are never perfect in practice, it is desirable to give a measure of uncertainty in predictions [4].
To identify those factors that intervene in the prediction, they can be grouped into three categories: those that have little possibility of affecting the result, those with some certainty to affect the results and must be considered in the model and those that are in the middle, which may or may not influence the final result, being necessary to identify through a series of techniques whether they should be included in the model [4].
1) Tree decision model: Decision trees are defined as a
recursive procedure, in which an 'N' number of instances are
progressively divided into groups, according to a division rule
that maximizes the homogeneity or purity of the response
variable or class variable [6]. An advantage of decision trees is
their easy interpretation, due to the graphic model that can be
rescued from the result of the recursive partition.
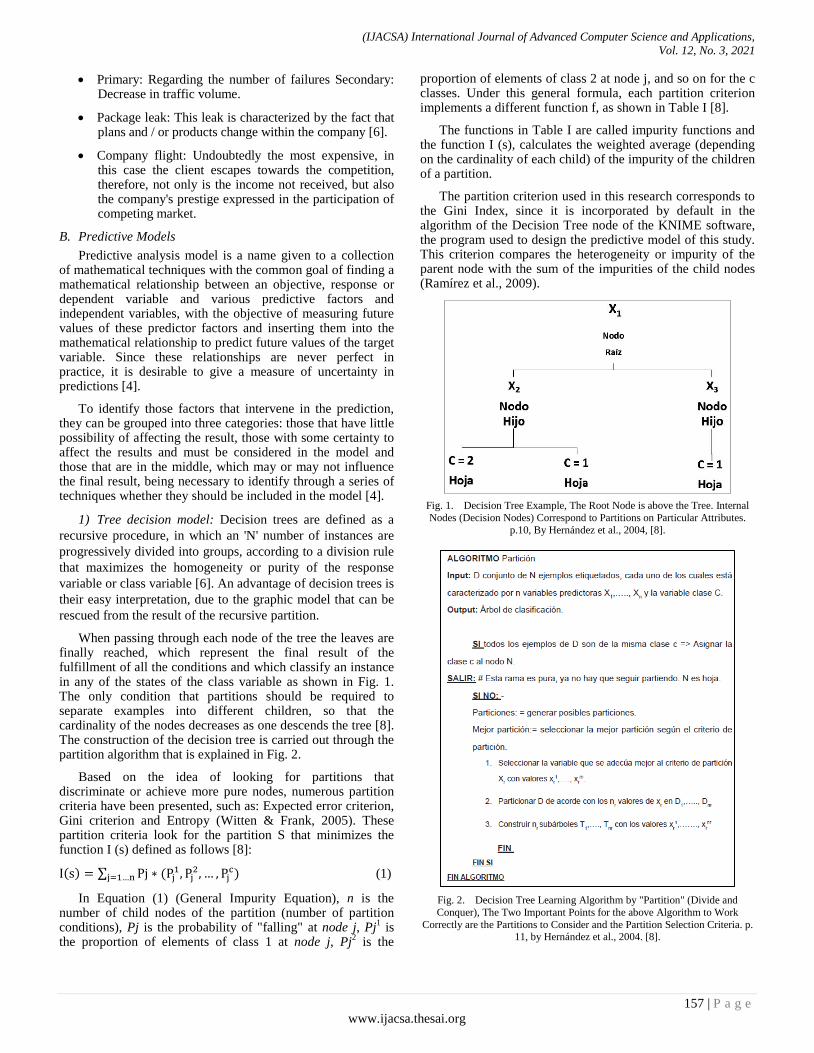
When passing through each node of the tree the leaves are finally reached, which represent the final result of the fulfillment of all the conditions and which classify an instance in any of the states of the class variable as shown in Fig. 1. The only condition that partitions should be required to separate examples into different children, so that the cardinality of the nodes decreases as one descends the tree [8]. The construction of the decision tree is carried out through the partition algorithm that is explained in Fig. 2.
Based on the idea of looking for partitions that discriminate or achieve more pure nodes, numerous partition criteria have been presented, such as: Expected error criterion, Gini criterion and Entropy (Witten & Frank, 2005). These partition criteria look for the partition S that minimizes the function I (s) defined as follows [8]:
( ) ∑ (
) (1)
In Equation (1) (General Impurity Equation), n is the number of child nodes of the partition (number of partition conditions), Pj is the probability of "falling" at node j, Pj
1 is
the proportion of elements of class 1 at node j, Pj2 is the
proportion of elements of class 2 at node j, and so on for the c classes. Under this general formula, each partition criterion implements a different function f, as shown in Table I [8].
The functions in Table I are called impurity functions and the function I (s), calculates the weighted average (depending on the cardinality of each child) of the impurity of the children of a partition.
The partition criterion used in this research corresponds to the Gini Index, since it is incorporated by default in the algorithm of the Decision Tree node of the KNIME software, the program used to design the predictive model of this study. This criterion compares the heterogeneity or impurity of the parent node with the sum of the impurities of the child nodes (Ramírez et al., 2009).
Fig. 1. Decision Tree Example, The Root Node is above the Tree. Internal
Nodes (Decision Nodes) Correspond to Partitions on Particular Attributes.
p.10, By Hernández et al., 2004, [8].
Fig. 2. Decision Tree Learning Algorithm by "Partition" (Divide and
Conquer), The Two Important Points for the above Algorithm to Work
Correctly are the Partitions to Consider and the Partition Selection Criteria. p. 11, by Hernández et al., 2004. [8].

(IJACSA) International Journal of Advanced Computer Science and Applications,
Vol. 12, No. 3, 2021
158 | P a g e
www.ijacsa.thesai.org
TABLE I. IMPURITY FUNCTION FOR EACH PARTITION CRITERION
Criterion ( )
expected error ( )
GINI ∑( )
Entropy ∑ ( )
Note: Impurity criteria functions for the Decision Tree search algorithm. by Ramirez et al., 2009 [8].
Partitions are a set of exhaustive and exclusive conditions. The more partitions that are allowed, the more expressive and precise the decision trees are. However, the more partitions the complexity of the algorithm is greater. [8].
2) Artificial Neural Network-ANN model: This data
mining model is one of the most popular strategies for
supervised learning and classification. However, due to its
complexity, it is not possible to know exactly the origin of its
results, which is a difficulty when explaining its operation. In
a direct sense, an artificial neural network (or simply called
neural network, or ANN) “consists of processing elements
(called neurons) and the connections between them with
coefficients (weights) linked to the connections, which
constitute a neural structure, and a training and reminder
algorithms attached to the structure ”[14], which in simple
words can be described as“ a pool of simple processing units
that communicate by sending signals between them over a
large number of weighted connections” [1]. The following is a
general diagram of this model in Fig. 3.
In neural networks, the multilayer Perceptron is one of the most used architectures for problem solving, due to its capacity as a fundamental approximation and its ease of use and applicability. This does not mean that it is a perfect implementation since it also has different problems and limitations, such as the learning process for complex problems with a large number of variables.
As an example of this we have the problem of classifying the binary function XOR. If we represent this function in space and carry out the projection of the points as shown in Fig. 4, we can verify that we achieve that these input data are linearly separable, and therefore with it an adequate classification of their patterns.
a) Multilayer neural network function: The computation
performed in this type of neural network to extract the output
yi assuming a network with a single hidden layer would be as
follows:
(∑ ) (∑ ( (∑
))
) (2)
Here we have that wij is the synaptic weight of the connection between the output unit i and the hidden processing unit j. L would be the number of processing units in the hidden layer; g1 would be the transfer function for the process units of the output layer, which can be the identity function, the hyperbolic tangent or a logistic function; tjr is the synaptic weight connecting process unit j of the hidden layer with input r. Finally, we have the function g2 which is the transfer function of the processing units of the hidden layer,
which can also be of the type previously mentioned for the processing units of the output layer.
b) Delta rule or backpropagation algorithm: The aim of
this algorithm is to achieve the smallest error made for each
desired output, in this way we want the expected outputs to be
as similar to the desired output. What it intends is the
determination of the synaptic weights so that the total error
committed is the minimum:
∑ ∑ ( ( ) ( ))
(3)
The backpropagation algorithm uses the descending gradient method and that makes use of the gradient vector, being one of the most used for this type of algorithm.
3) Model Support Vector Machine (SVM): These methods
are properly related to classification and regression problems.
Given a set of training examples (of samples) we can label the
classes and train an SVM to build a model that predicts the
class of a new sample. Intuitively, an SVM is a model that
represents the sample points in space, separating the classes to
2 spaces as wide as possible by means of a separation
hyperplane defined as the vector between the 2 points, of the 2
classes, closest to the which is called a support vector. When
the new samples are put into correspondence with said model,
depending on the spaces to which they belong, they can be
classified into one or the other class [18].
* ( ) +
* + ( ) * ( ) ( ) ( ) + (4)
Fig. 3. Structural Model of a Neural Network, por Hernández et al., 2004
[8].
Fig. 4. Projecting the Input Patterns, por Hernández et al., 2004 [8].

(IJACSA) International Journal of Advanced Computer Science and Applications,
Vol. 12, No. 3, 2021
159 | P a g e
www.ijacsa.thesai.org
Types of Kernel functions
a) Polynomial-homogeneous: ( ) ( )
function interpreted graphically as shown in Fig. 5.
Fig. 5. Polynomial Function – Homogeneous, B. Kröse and P. van der
Smagt., 1996 [1].
b) Perceptron: ( ) ‖ ‖ function
interpreted graphically as shown in Fig. 6.
Fig. 6. Perceptron Function, B. Kröse and P. Van Der Smagt., 1996. [1].
c) Gaussian radial basis function: separated by a
hyperplane in the transformed space as shown in Fig. 7.
( ) ( ( ) ( ) )
Fig. 7. Gaussian Radial basis Function, B. Kröse and P. Van Der Smagt.,
1996. [1].
C. Evaluation Metrics
The technical evaluation measures that are generally used are based on a contingency Table II that describes the predicted hit and miss instances. This contingency table is called a confusion matrix that "contains information about current and predicted classifications, carried out by a classification system" [7]. The scheme of this for a case of binary classification is:
Based on this table, the following metrics of the following equations (5), (6), (7), (8) and (9) of a technical nature [9] are defined:
TABLE II. BINARY CASE CONFUSION TABLE SCHEMA
Current Class
Categories 0 1
Hypothetical Class 0 TN FN
1 FP TP
Total Columns N=FP+TN P=TP+FN
Note: Impurity criteria functions for the Decision Tree search algorithm. by Ramirez et al., 2009 [8].
Precision
With the precision metric we can measure the quality of the machine learning model in classification tasks (5).
(5)
Recall
The completeness metric will inform us about the amount that the machine learning model is able to identify.
(6)
Accuracy
Accuracy measures the frequency with which the classifier makes a correct prediction. It is the relationship between the number of correct predictions and the total number of predictions (7). Its general formula is the following [9]:
(7)
f-measure
It is the measure of precision that a test has and is usually used in the testing phase of search algorithms and information retrieval and document classification (8) and (9) [9].
(8)
(9)
a) Roc curves: They are curves that show the ability of
the classifier to position the true instances with respect to the
false ones [9]. In a more accurate definition, it can be said that
the ROC Curves are those that measure the ratio of the rate of
true positives (correct predictions) versus the rate of false
positives (wrong predictions). The positive being the one
referring to the leakage class when it comes to a binary
classification problem. These curves do not have an associated
formula. However, they do have a metric, which is called
“Area Under the curve” (AUC), which is defined as the area
under the ROC Curve, in addition, it has the following
statistical property: “The AUC of a classifier is equivalent to
the probability that the classifier will position a positive
random instance better than a negative random instance" [16,
17].

(IJACSA) International Journal of Advanced Computer Science and Applications,
Vol. 12, No. 3, 2021
160 | P a g e
www.ijacsa.thesai.org
III. RELATED JOBS
Customer churn is a critical problem and one of the most important concerns for large telcos, various approaches were applied to predict customer churn, using data mining and machine learning approaches. Most of the related work focused on applying just one data mining method to extract knowledge, and the others focused on comparing various strategies to predict attrition.
J. Wang and Gavril et al. [11, 19] presented an advanced data mining methodology to predict the loss of prepaid customers using a data set for the call details of 3,333 customers with 21 functions and a dependent loss parameter with two values: Yes / No. Some Features include information on the number of incoming and outgoing messages and voicemail for each customer. The author applied the "PCA" principal component analysis algorithm to reduce the dimensions of the data. Three machine learning algorithms were used: Neural Networks, Support Vector Machine, and Bayes Networks to predict the churn factor. The author used AUC to measure the performance of the algorithms. The AUC values were 99.10%, 99.55%, and 99.70% for Bayes Networks, Neural networks, and support vector machine, respectively. The data set used in this study is small and there were no missing values.
Huang et al. [20] studied the problem of customer loss on the big data platform. The researchers' goal was to show that big data greatly improves the rotation prediction process based on the volume, variety and speed of the data. Dealing with the data from the operational support department and the business support department of the largest telecommunications
company in China needed a big data platform to design the fractures. The Random Forest algorithm was used and evaluated using AUC.
Makhtar et al. [21] proposed a model for the prediction of abandonment using the approximate set theory in telecommunications. As mentioned in this article, the Rough Set classification algorithm outperformed other algorithms such as Linear Regression, Decision Tree, and Voted Perception Neural Network.
IV. EXPERIMENTATION
Different prediction models were proposed for the data set, the most accurate was chosen using the precision evaluation metric generated by each model. The model for predicting the abandonment of telephone service customers is shown below in Fig. 8.
A. Modelo Decisión Tree
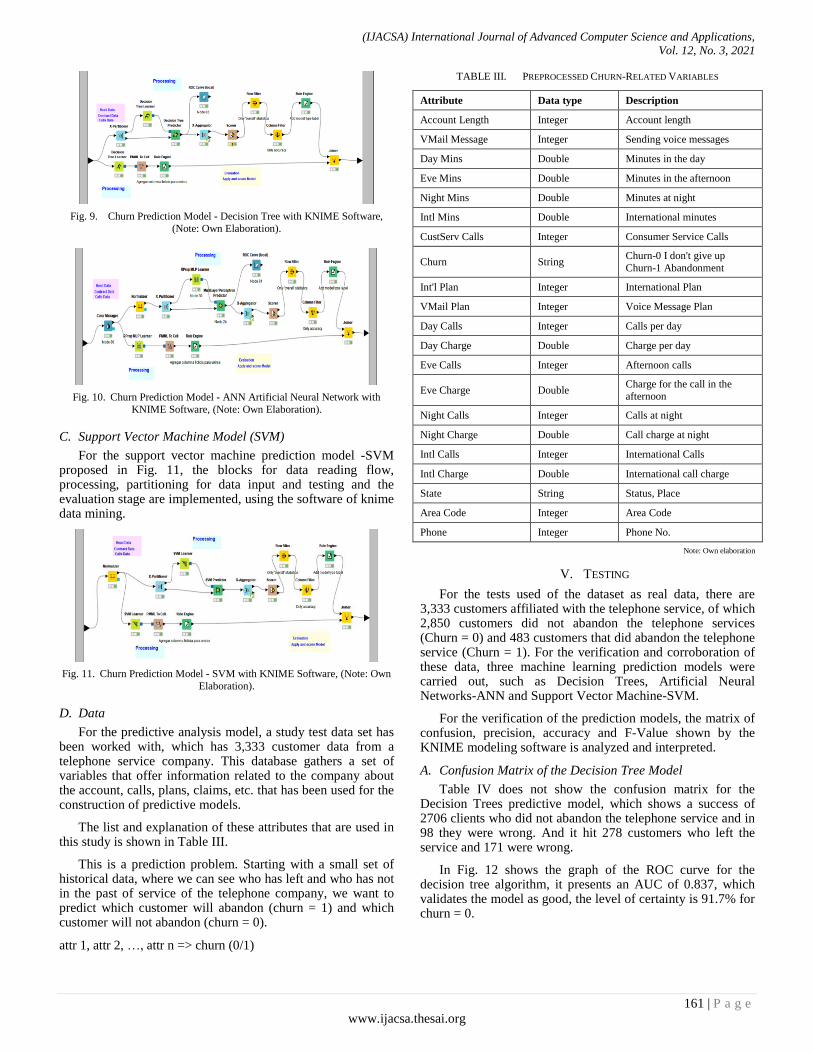
For the proposed model, the blocks for data reading flow, processing, partitioning for data input and testing and the evaluation stage are implemented, using the knime data mining software. Fig. 9 shows the nodes of the flow of the decision tree prediction model.
B. Artificial Neural Network Model – ANN
For the neural network prediction model, we proceed with data processing (normalization, training partition and data testing); Neural network data analytics nodes are used for processing; For the evaluation stage, the model evaluation score nodes are used, using the knime data mining software. Fig. 10 shows the nodes of the flow of the artificial neural network prediction model.
Fig. 8. General Churn Prediction Model with KNIME Software, (Note: Own elaboration)
(IJACSA) International Journal of Advanced Computer Science and Applications,
Vol. 12, No. 3, 2021
161 | P a g e
www.ijacsa.thesai.org
Fig. 9. Churn Prediction Model - Decision Tree with KNIME Software,
(Note: Own Elaboration).
Fig. 10. Churn Prediction Model - ANN Artificial Neural Network with
KNIME Software, (Note: Own Elaboration).
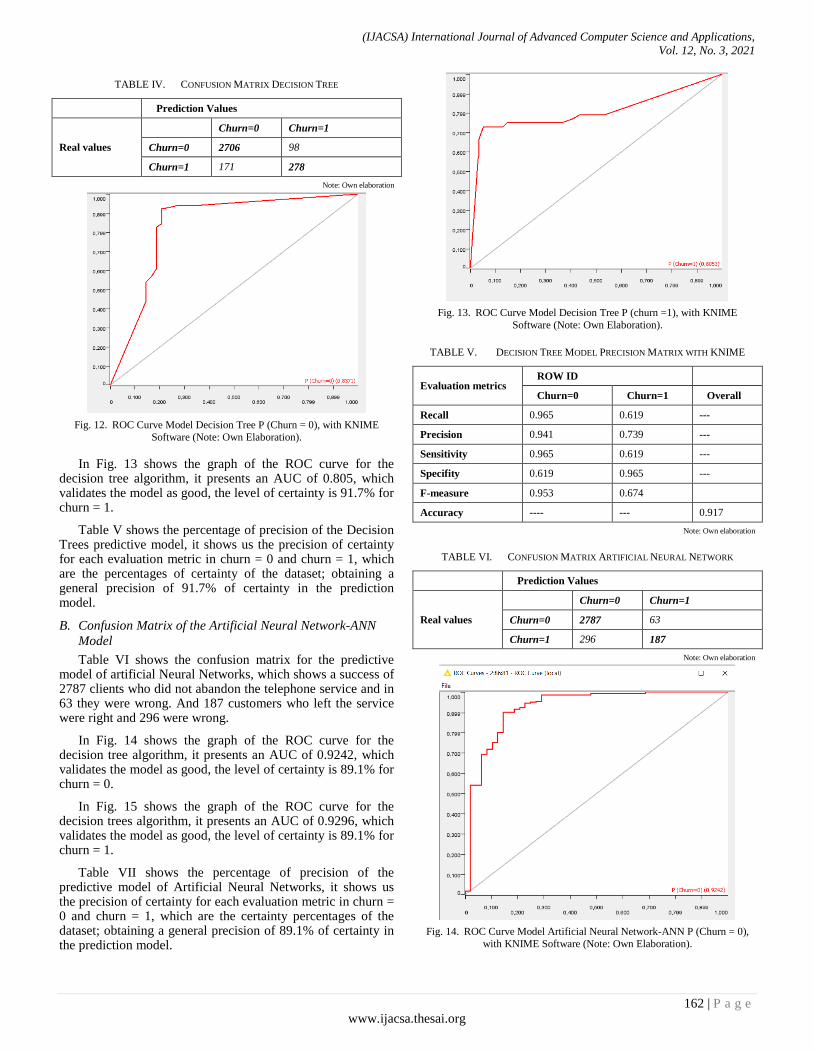
C. Support Vector Machine Model (SVM)
For the support vector machine prediction model -SVM proposed in Fig. 11, the blocks for data reading flow, processing, partitioning for data input and testing and the evaluation stage are implemented, using the software of knime data mining.
Fig. 11. Churn Prediction Model - SVM with KNIME Software, (Note: Own
Elaboration).
D. Data
For the predictive analysis model, a study test data set has been worked with, which has 3,333 customer data from a telephone service company. This database gathers a set of variables that offer information related to the company about the account, calls, plans, claims, etc. that has been used for the construction of predictive models.
The list and explanation of these attributes that are used in this study is shown in Table III.
This is a prediction problem. Starting with a small set of historical data, where we can see who has left and who has not in the past of service of the telephone company, we want to predict which customer will abandon (churn = 1) and which customer will not abandon (churn = 0).
attr 1, attr 2, …, attr n => churn (0/1)
TABLE III. PREPROCESSED CHURN-RELATED VARIABLES
Attribute Data type Description
Account Length Integer Account length
VMail Message Integer Sending voice messages
Day Mins Double Minutes in the day
Eve Mins Double Minutes in the afternoon
Night Mins Double Minutes at night
Intl Mins Double International minutes
CustServ Calls Integer Consumer Service Calls
Churn String Churn-0 I don't give up
Churn-1 Abandonment
Int'l Plan Integer International Plan
VMail Plan Integer Voice Message Plan
Day Calls Integer Calls per day
Day Charge Double Charge per day
Eve Calls Integer Afternoon calls
Eve Charge Double Charge for the call in the
afternoon
Night Calls Integer Calls at night
Night Charge Double Call charge at night
Intl Calls Integer International Calls
Intl Charge Double International call charge
State String Status, Place
Area Code Integer Area Code
Phone Integer Phone No.
Note: Own elaboration
V. TESTING
For the tests used of the dataset as real data, there are 3,333 customers affiliated with the telephone service, of which 2,850 customers did not abandon the telephone services (Churn = 0) and 483 customers that did abandon the telephone service (Churn = 1). For the verification and corroboration of these data, three machine learning prediction models were carried out, such as Decision Trees, Artificial Neural Networks-ANN and Support Vector Machine-SVM.
For the verification of the prediction models, the matrix of confusion, precision, accuracy and F-Value shown by the KNIME modeling software is analyzed and interpreted.
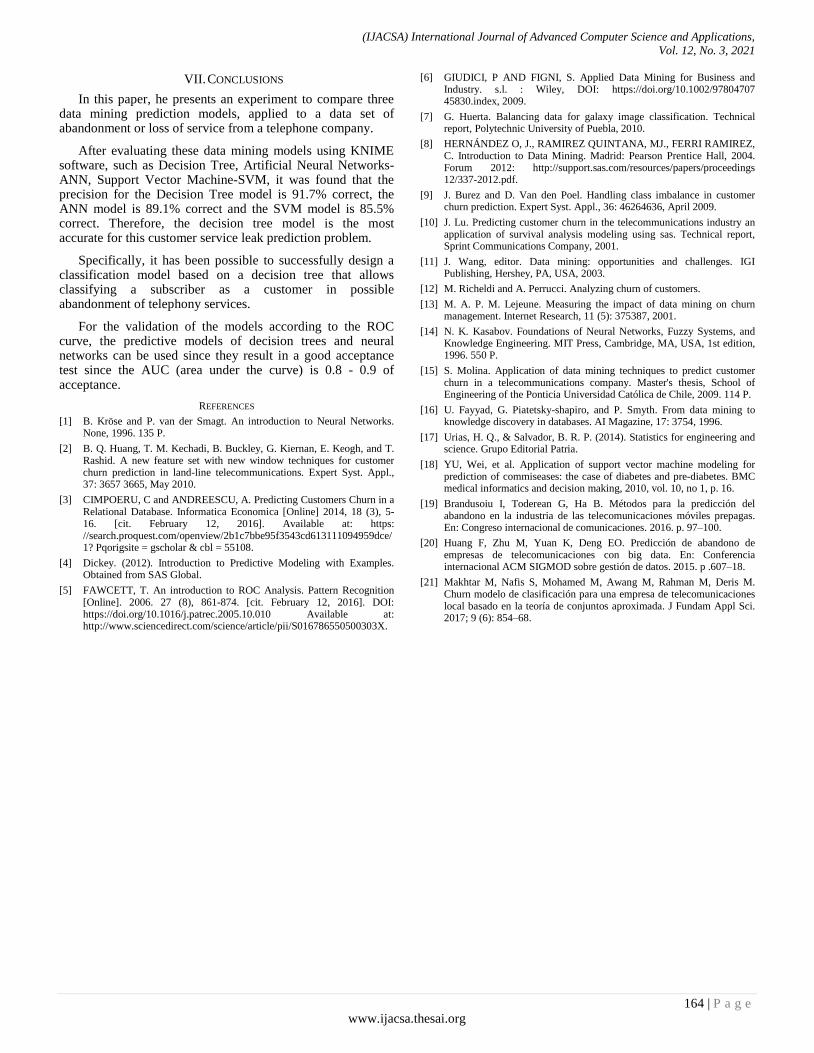
A. Confusion Matrix of the Decision Tree Model
Table IV does not show the confusion matrix for the Decision Trees predictive model, which shows a success of 2706 clients who did not abandon the telephone service and in 98 they were wrong. And it hit 278 customers who left the service and 171 were wrong.
In Fig. 12 shows the graph of the ROC curve for the decision tree algorithm, it presents an AUC of 0.837, which validates the model as good, the level of certainty is 91.7% for churn = 0.
(IJACSA) International Journal of Advanced Computer Science and Applications,
Vol. 12, No. 3, 2021
162 | P a g e
www.ijacsa.thesai.org
TABLE IV. CONFUSION MATRIX DECISION TREE
Prediction Values
Real values
Churn=0 Churn=1
Churn=0 2706 98
Churn=1 171 278
Note: Own elaboration
Fig. 12. ROC Curve Model Decision Tree P (Churn = 0), with KNIME
Software (Note: Own Elaboration).
In Fig. 13 shows the graph of the ROC curve for the decision tree algorithm, it presents an AUC of 0.805, which validates the model as good, the level of certainty is 91.7% for churn = 1.
Table V shows the percentage of precision of the Decision Trees predictive model, it shows us the precision of certainty for each evaluation metric in churn = 0 and churn = 1, which are the percentages of certainty of the dataset; obtaining a general precision of 91.7% of certainty in the prediction model.
B. Confusion Matrix of the Artificial Neural Network-ANN
Model
Table VI shows the confusion matrix for the predictive model of artificial Neural Networks, which shows a success of 2787 clients who did not abandon the telephone service and in 63 they were wrong. And 187 customers who left the service were right and 296 were wrong.
In Fig. 14 shows the graph of the ROC curve for the decision tree algorithm, it presents an AUC of 0.9242, which validates the model as good, the level of certainty is 89.1% for churn = 0.
In Fig. 15 shows the graph of the ROC curve for the decision trees algorithm, it presents an AUC of 0.9296, which validates the model as good, the level of certainty is 89.1% for churn = 1.
Table VII shows the percentage of precision of the predictive model of Artificial Neural Networks, it shows us the precision of certainty for each evaluation metric in churn = 0 and churn = 1, which are the certainty percentages of the dataset; obtaining a general precision of 89.1% of certainty in the prediction model.
Fig. 13. ROC Curve Model Decision Tree P (churn =1), with KNIME
Software (Note: Own Elaboration).
TABLE V. DECISION TREE MODEL PRECISION MATRIX WITH KNIME
Evaluation metrics ROW ID
Churn=0 Churn=1 Overall
Recall 0.965 0.619 ---
Precision 0.941 0.739 ---
Sensitivity 0.965 0.619 ---
Specifity 0.619 0.965 ---
F-measure 0.953 0.674
Accuracy ---- --- 0.917
Note: Own elaboration
TABLE VI. CONFUSION MATRIX ARTIFICIAL NEURAL NETWORK
Prediction Values
Real values
Churn=0 Churn=1
Churn=0 2787 63
Churn=1 296 187
Note: Own elaboration
Fig. 14. ROC Curve Model Artificial Neural Network-ANN P (Churn = 0),
with KNIME Software (Note: Own Elaboration).

(IJACSA) International Journal of Advanced Computer Science and Applications,
Vol. 12, No. 3, 2021
163 | P a g e
www.ijacsa.thesai.org
Fig. 15. ROC Curve Model Artificial Neural Network-ANN P (Churn = 1),
with KNIME Software (Note: Own Elaboration).
TABLE VII. PRECISION MATRIX OF THE NEURONAL NETWORK MODEL
WITH KNIME
Evaluation metrics ROW ID
Churn=0 Churn=1 Overall
Recall 0.977 0.383 ---
Precision 0.903 0.74 ---
Sensitivity 0.977 0.383 ---
Specificity 0.383 0.977 ---
F-measure 0.939 0.505
Accuracy ---- --- 0.891
Note: Own elaboration
C. Support Vector Machine Model-SVM Confusion Matrix
Table VIII shows the confusion matrix for the predictive model of Support Vector Machines-SVM, which does not present reliability in the prediction of the data since it predicted that 2850 did not leave the service and a null value of the customers who left the service.
Table IX shows the percentage of precision of the predictive model of the Support Vector Machine-SVM, which does not show reliable data to predict the certainty of abandonment or not of the clients in the telephone service.
TABLE VIII. CONFUSION MATRIX ARTIFICIAL NEURAL NETWORK
Prediction Values
Real values
Churn=0 Churn=1
Churn=0 2850 0
Churn=1 483 0
Note: Own elaboration
TABLE IX. SUPPORT VECTOR MACHINE MODEL PRECISION MATRIX-SVM
WITH KNIME
Evaluation metrics ROW ID
Churn=0 Churn=1 Overall
Recall 1 0 ---
Precision 0.855 --- ---
Sensitivity 1 0 ---
Specifity 0 1 ---
F-measure 0.922 --- ---
Accuracy ---- --- 0.855
Note: Own elaboration
VI. RESULTS EVALUATION
In Fig. 16 and 17 the 3 predictive models were analyzed giving a precision of 91.7% for the Decision Trees model, 89.1% precision for the Neural Networks model and 85.5% for the Support Vector Machine model.
Fig. 16. Comparison of the Proposed Model, with KNIME Software (Note:
Own Elaboration).
Fig. 17. Churn General Prediction Model, with KNIME Software (Note: Own
Elaboration).
(IJACSA) International Journal of Advanced Computer Science and Applications,
Vol. 12, No. 3, 2021
164 | P a g e
www.ijacsa.thesai.org
VII. CONCLUSIONS
In this paper, he presents an experiment to compare three data mining prediction models, applied to a data set of abandonment or loss of service from a telephone company.
After evaluating these data mining models using KNIME software, such as Decision Tree, Artificial Neural Networks-ANN, Support Vector Machine-SVM, it was found that the precision for the Decision Tree model is 91.7% correct, the ANN model is 89.1% correct and the SVM model is 85.5% correct. Therefore, the decision tree model is the most accurate for this customer service leak prediction problem.
Specifically, it has been possible to successfully design a classification model based on a decision tree that allows classifying a subscriber as a customer in possible abandonment of telephony services.
For the validation of the models according to the ROC curve, the predictive models of decision trees and neural networks can be used since they result in a good acceptance test since the AUC (area under the curve) is 0.8 - 0.9 of acceptance.
REFERENCES
[1] B. Kröse and P. van der Smagt. An introduction to Neural Networks. None, 1996. 135 P.
[2] B. Q. Huang, T. M. Kechadi, B. Buckley, G. Kiernan, E. Keogh, and T. Rashid. A new feature set with new window techniques for customer churn prediction in land-line telecommunications. Expert Syst. Appl., 37: 3657 3665, May 2010.
[3] CIMPOERU, C and ANDREESCU, A. Predicting Customers Churn in a Relational Database. Informatica Economica [Online] 2014, 18 (3), 5-16. [cit. February 12, 2016]. Available at: https: //search.proquest.com/openview/2b1c7bbe95f3543cd613111094959dce/1? Pqorigsite = gscholar & cbl = 55108.
[4] Dickey. (2012). Introduction to Predictive Modeling with Examples. Obtained from SAS Global.
[5] FAWCETT, T. An introduction to ROC Analysis. Pattern Recognition [Online]. 2006. 27 (8), 861-874. [cit. February 12, 2016]. DOI: https://doi.org/10.1016/j.patrec.2005.10.010 Available at: http://www.sciencedirect.com/science/article/pii/S016786550500303X.
[6] GIUDICI, P AND FIGNI, S. Applied Data Mining for Business and Industry. s.l. : Wiley, DOI: https://doi.org/10.1002/97804707 45830.index, 2009.
[7] G. Huerta. Balancing data for galaxy image classification. Technical report, Polytechnic University of Puebla, 2010.
[8] HERNÁNDEZ O, J., RAMIREZ QUINTANA, MJ., FERRI RAMIREZ, C. Introduction to Data Mining. Madrid: Pearson Prentice Hall, 2004. Forum 2012: http://support.sas.com/resources/papers/proceedings 12/337-2012.pdf.
[9] J. Burez and D. Van den Poel. Handling class imbalance in customer churn prediction. Expert Syst. Appl., 36: 46264636, April 2009.
[10] J. Lu. Predicting customer churn in the telecommunications industry an application of survival analysis modeling using sas. Technical report, Sprint Communications Company, 2001.
[11] J. Wang, editor. Data mining: opportunities and challenges. IGI Publishing, Hershey, PA, USA, 2003.
[12] M. Richeldi and A. Perrucci. Analyzing churn of customers.
[13] M. A. P. M. Lejeune. Measuring the impact of data mining on churn management. Internet Research, 11 (5): 375387, 2001.
[14] N. K. Kasabov. Foundations of Neural Networks, Fuzzy Systems, and Knowledge Engineering. MIT Press, Cambridge, MA, USA, 1st edition, 1996. 550 P.
[15] S. Molina. Application of data mining techniques to predict customer churn in a telecommunications company. Master's thesis, School of Engineering of the Ponticia Universidad Católica de Chile, 2009. 114 P.
[16] U. Fayyad, G. Piatetsky-shapiro, and P. Smyth. From data mining to knowledge discovery in databases. AI Magazine, 17: 3754, 1996.
[17] Urias, H. Q., & Salvador, B. R. P. (2014). Statistics for engineering and science. Grupo Editorial Patria.
[18] YU, Wei, et al. Application of support vector machine modeling for prediction of commiseases: the case of diabetes and pre-diabetes. BMC medical informatics and decision making, 2010, vol. 10, no 1, p. 16.
[19] Brandusoiu I, Toderean G, Ha B. Métodos para la predicción del abandono en la industria de las telecomunicaciones móviles prepagas. En: Congreso internacional de comunicaciones. 2016. p. 97–100.
[20] Huang F, Zhu M, Yuan K, Deng EO. Predicción de abandono de empresas de telecomunicaciones con big data. En: Conferencia internacional ACM SIGMOD sobre gestión de datos. 2015. p .607–18.
[21] Makhtar M, Nafis S, Mohamed M, Awang M, Rahman M, Deris M. Churn modelo de clasificación para una empresa de telecomunicaciones local basado en la teoría de conjuntos aproximada. J Fundam Appl Sci. 2017; 9 (6): 854–68.


![Factors that Influence Undergraduate University Desertion … · 2018. 12. 31. · University desertion is multifactorial [9]. It comprises academic, personal, social, institutional](https://img.pdfslide.net/doc/110x75/60381cfafdb38b78086b7bdd/factors-that-influence-undergraduate-university-desertion-2018-12-31-university.jpg)