Embed Size (px)
Citation preview

HAL Id: hal-00538108https://hal.archives-ouvertes.fr/hal-00538108
Submitted on 21 Nov 2010
HAL is a multi-disciplinary open accessarchive for the deposit and dissemination of sci-entific research documents, whether they are pub-lished or not. The documents may come fromteaching and research institutions in France orabroad, or from public or private research centers.
L’archive ouverte pluridisciplinaire HAL, estdestinée au dépôt et à la diffusion de documentsscientifiques de niveau recherche, publiés ou non,émanant des établissements d’enseignement et derecherche français ou étrangers, des laboratoirespublics ou privés.
Model for the prediction of 3D surface topography in5-axis milling
Sylvain Lavernhe, Yann Quinsat, Claire Lartigue
To cite this version:Sylvain Lavernhe, Yann Quinsat, Claire Lartigue. Model for the prediction of 3D surface topographyin 5-axis milling. International Journal of Advanced Manufacturing Technology, Springer Verlag, 2010,51 (9), pp.915-924. �10.1007/s00170-010-2686-3�. �hal-00538108�

1
Model for the prediction of 3D surface topography in 5-axis milling
Sylvain Lavernhe
LURPA - ENS de Cachan - Université Paris Sud 11
61 avenue du Président Wilson
94235 Cachan cedex – France
tel: +33 1 47 40 29 85
fax: +33 1 47 40 22 20
Yann Quinsat
LURPA - ENS de Cachan - Université Paris Sud 11
61 avenue du Président Wilson
94235 Cachan cedex – France
tel: +33 1 47 40 22 13
fax: +33 1 47 40 22 20
Claire Lartigue
LURPA - ENS de Cachan - Université Paris Sud 11
61 avenue du Président Wilson
94235 Cachan cedex – France
IUT de Cachan - Université Paris Sud 11
9 avenue de la Division Leclerc
94234 Cachan cedex – France
tel: +33 1 47 40 29 86
fax: +33 1 47 40 22 20
Abstract:
The paper deals with the prediction of the 3D surface topography obtained in 5-axis milling in
function of the machining conditions. For this purpose, a simulation model for the prediction of
machined surface patterns is developed based on the well-known N-buffer method. As in
sculptured surface machining the feed rates locally vary, the proposed model can be coupled to a
feed rate prediction model. Thanks to the simulation model of 3D surface topography, the
influence of the machining strategy on resulting 3D surface patterns is analyzed through an
experimental design. Results enhance the major influence of the tool inclination on 3D
topography. Surface parameters used in the study are strongly affected by the variation of the yaw
angle. The effect of the feed rate is also significant on amplitude parameters. Finally, the analysis
brings out the interest of using surface parameters to characterize 3D surface topography obtained
in 5-axis milling.
Keywords:
Surface topography, surface patterns, 5 axis machining, machining strategy
2
Introduction
Within the field of aeronautics, mold and die, or automotive industries, 3D
sculptured surfaces are now widely used for the design of complex workpieces.
To reach high surface quality, sculptured surfaces are generally obtained using a
High-Speed Machining (HSM) process. Due to the shape complexity, multi-axis
milling is more often used. Moreover, the tool trajectory is generated via CAM
software which offers various machining strategies depending on the geometry of
the surface to be machined. The machined surface quality thus results from the
choice of the strategy and the corresponding cutting parameters.
As surface quality is concerned, some works have emphasized the importance of
3D surface topography, in particular in engineering applications [1]. 3D surface
topography influences mechanical and physical properties of contacting parts, and
plays a major role in surface integrity thus affecting fatigue life. Surface
topography characterization highlights two major issues of same importance: the
definition of relevant parameters characterizing 3D surface patterns resulting from
multi-axis HSM, and the evaluation of the relationships linking the machining
strategy (cutting conditions, machining direction and tool inclination) with the
surface topography.
Concerning the first issue, the definition of parameters accounting for the 3D
nature of the surface roughness has become necessary. A standardized project
[ISO 25178-2:2007] proposes such parameters as a 3D extension of the classical
2D parameters, with a similar definition of those defined by the standard [ISO
12085:1996]. Among all, 12 parameters are more often used, which have been
classified into 4 main families: amplitude parameters, spatial parameters,
functional parameters and hybrid parameters (table 1). Some works focus on the
characterization of the surface geometry using fractal dimensions [2] [3]. Fractal
dimension is a well known indicator of the surface complexity: the fractal
dimension increases following the surface roughness. Other authors propose
models to describe surface topography by introducing conformal equivalent
structure [4][5], this notion is introduced by comparing the slope or gradient
distributions of surface topography.
Tab. 1 3D surface parameters
Surface parameters
Amplitude parameters Sq, Sz, Ssk, Sku
Functional parameters Sci, Svi, Sbi
Spatial parameters Sal, Std, Str, Sds
Hybrid parameters S!q
However, a few studies try to link the surface roughness with the surface
functionality through the 3D surface roughness parameters. For friction in servo
hydraulic assemblies, surfaces with negative skewness, low kurtosis values, and
high valley fluid retention index were found to have lower frictional
characteristics [6]. The functionality of automotive cylinder bores is partially
characterized by oil consumption and blow-by. For this application, Sq, Sk, Svk,
Sds, Sbi are more significant to describe oil consumption whereas Sv, Svi are
well-adapted for blow-by [7]. Concerning the fatigue limit, it seems more
interesting to consider Sq, Std and Sal [8]. The use of 3D parameters to

3
characterize 3D surface topography is now efficient. Nevertheless, due to the lack
of known information binding parameters to the function of the surface, the
description of the 3D pattern obtained after machining remains essential.
Few formalized studies exist on the evaluation of the relationships linking
machining strategy with surface topography [9]. Studies are generally performed
considering an experimental standpoint or a simulation standpoint.
Concerning the experimental standpoint most results are qualitative, aiming at
linking the surface quality with machining parameters. For instance, Ramos et al.
[10] present observations concerning the influence of the machining direction on
the surface quality after the machining of a boat propeller. In [11] authors present
various topographies obtained on surfaces machined using different tool
orientations. After the analysis of pattern 2D pictures, authors suggest avoiding
upward and downward milling. Indeed, machining in the slope direction involves
more marks on the part. Baptista and Antune Simoes [12] determine a model
linking the feed rate, the transversal step and the surface roughness Ra=F(fz,p).
The model obtained from experiments is only adapted for ball-end machining of
aluminium alloy parts. Other works extend the model by adding the influence of
the part geometry, such as the surface orientation [13] [14]. Results obtained show
a variation of the surface quality according to the feed rate and the orientation.
But these variations are not significant compare with measurement errors [15]. To
summarize, experimental studies lead to results for which the field of validity is
strongly linked with experimental conditions. None of them propose to clearly
link the machining strategy with the surface topography.
In comparison, theoretical models offer a larger field of validity. Most models
attempt to predict the surface roughness in function of the cutting conditions. The
objective is to find the best cutting conditions leading to the required surface
quality. Kim and Chu [16] describe the texture obtained in milling using the
texture superposition model. A generalized cutter model is adopted introducing
the effect of the fillet radius. In this approach, authors investigate the influence of
the feed rate, the cutter type and the runout effect. As a conclusion, authors
highlight the interest of using a filleted end-mill to reach better surface quality
when the path interval is under a critical value. Bouzakis et al. take the influence
of the tool orientation into account and focus on the motion of the cutting edge.
The cutting flute is segmented into elementary linear sections of constant width.
Simulations show the influence of the tool orientation, the transversal step and the
feed rate on the surface quality [17]. Toh supplements this work by defining the
best direction to machine an inclined plane [18]. The prediction model proposed
by Chen et al. relies on the mathematical description of the cutting edge locus
during ball-end machining [19]. Authors focus on the influence of the feed/pick
ratio, the tool inclination and the initial cutting edge entrance angle. They
highlight the importance of the feed interval in HSM. Moreover an optimisation
of the feed rate is proposed according to the tool inclination. Liu et al. detail a
method based on the solid modelling of each cutter flute [20]. The workpiece
surface is discretized in the (XY) plane by parallel lines (called spikes) to the Z
axis (tool axis). The cutter tool model generates a volume which truncates the
spikes. The remaining parts of the reference spikes provide a good approximation
of the surface finish which can be linked with the cutting parameters. Only a few
studies try to link 3D parameters with the machining strategy with the objective of

4
optimizing machining parameters [21].
Regarding the integration of the machine tool defaults in surface topography
prediction, different research works are proposed. Ehmann et al. [22] introduced
the notion of surface shaping system. Using homogeneous transformation from
the machine frame to the local cutting edge frame, authors propose a generic
model of simulation which includes the tool geometry and the machine tool
kinematics. This model is efficient to predict the runout effect on surface
topography but no feed rate and force prediction model are proposed. Moreover,
no experiment validation is proposed. More recently Li et al. [23] proposed a
model of flute movement description in the workpiece coordinate system using
homogeneous transformation. Such approach leads to the prediction of the surface
topography including cutter revolving precision and static stiffness. However, the
real feed rate and the real geometry of the cutting edge are not taken into account.
Few works handle the case of 5-axis milling. Starting from the expression of the
trajectory equation of the cutting edge relative to the workpiece and the tool paths,
Zhang et al introduced a new and general iterative method to simulate roughness
in multi-axis ball-end milling [24] [25]. This method has the advantage of
simplicity and is a mesh-independent direct computing method.
Effects of the tool
inclination and of the cutting mode are in particular investigated. Authors also
bring out that surface roughness remains quite unchanged beyond a limit
inclination angle. More interesting, the proposed algorithm is used to simulate
surface finish of sculptured surfaces, highlighting the effect of the cutting mode
on surface roughness. However, the roughness is only apprehended through the
Rz parameter, which does not account for the 3D effect observed in the
simulations.
The prediction of the 3D surface topography in function of the machining
conditions remains an important issue in 5-axis machining. Hence, the study
presented here aims at formalizing the influence of the cutting conditions on
resulting 3D surface patterns. This is performed thanks to a simulation model
based on the well-known N-buffer method. As in sculptured surface machining
the feed rates locally vary, the model we proposed is coupled to a velocity
prediction model. In order to enhance the effect of both the tool inclination and
the cutting parameters, an experimental design is defined taking advantage of the
simulation model. The experimental design seeks to characterize factor effects on
the resulting 3D topography through surface parameters. One objective is also to
bring out surface parameters that best characterize machined patterns in 5-axis
machining.
Prediction of the surface topography
Simulation model
The material removal simulation relies on the well-known N-buffer method. This
requires the modeling of the surface, the modeling of the tool geometry and the
definition of the actual tool trajectory [26]. The workpiece surface is discretized in
the (XY) by lines directed along the local normal to the surface. The “hedgehog”
so generated is truncated by the cutter tool according to the tool trajectory (figure

5
1). The remaining part of the hedgehog defines the 3D topography of the
machined surface. The quality of the part modelling is strongly linked with the
choice of the sampling parameter. In general, the sampling step chosen is equal to
2 !m.
Fig. 1 N-buffer simulation
For its part, the tool is supposed to be rigid, and is approximated by a local
meshing (STL format). Only active cutting edges are considered. To ensure a
correct approximation of the tool surface, the meshing is performed with a chord
error equal to 0.1µm (figure 2).
Fig. 2 modeling of the tool geometry
Concerning the tool trajectory, one difficulty is the integration of effects linked to
5-axis machining within a context of high velocities. Indeed, the use of two
additional rotational axes leads to two main difficulties during trajectory
execution: the computation of the Inverse Kinematical Transformation in real time
to define set points corresponding to tool postures, and the synchronization of the
rotational axes with the translational ones [27]. Due to kinematical axis capacities,
axis velocities vary leading to local feed rate fluctuations which can alter the 3D
pattern. Indeed, the programmed feed rate is seldom reached. In the proposed
approach, the simulation of the 3D surface micro-geometry accounts for local
variations of the velocity during actual machining. Indeed, the entry of the
material simulation model is the actual tool trajectory expressed as a set of tool
postures and corresponding feed rates. Actual feed rates can be calculated thanks
to a model of velocity prediction developed in a previous work which gives a
good estimation of the local feed rate of the tool-teeth [27]. The inputs of the
velocity prediction model are the CL file and the characteristics of the machine
tool. The CL file gives the set of tool postures defining the trajectory in the part
coordinate system (PCS) and the programmed feed rate Vfprog; tool postures are
defined by the coordinates of the tool tip {Xp,Yp,Zp} and the axis tool direction
components {I,J,K}. The machine tool characteristics are its architecture, the
kinematical axis performances and several CNC parameters (interpolator cycle
time, look ahead, rounding parameters…). Given these data, the velocity
prediction model generates a set of tool postures with corresponding local feed

6
rates {Xpi,Yp
i,Zp
i,I
i,J
i,K
i,Vf
i} (figure 3).
Fig. 3 Prediction of local tool postures and feed rates [27]
Starting from the actual trajectory, the model of material removal simulation thus
consists of two steps: calculation of the spindle angular position at each tool
posture and trajectory sampling preceding the Nbuffer computation. Given tool
postures belonging to the trajectory and corresponding local feed rates, each
displacement separating two tool postures is modeled based on the linear
interpolation of the feed rate to evaluate its duration. Hence, the time interval
separating two postures is calculated as follows:
Eq. (1)
in each one the local feed rate Vf is linearly interpolated (figure 4). If the rotational
velocity of the spindle "spindle is supposed equal to the programmed one, the angular
positions of the tool axis {#i} are given by:
Eq. (2)
Fig. 4 Computation of spindle angular positions
Once the spindle angular positions are calculated, the trajectory sampling
preceding the Nbuffer computation is performed. The elementary trajectory
defined between two tool postures is sampled, considering an angular fixed step,
d# (figure5).

7
Eq. (3)
The value of d# is chosen so that the envelope of the tool movement is entirely
represented, and the tool track is not affected by the sampling step. Therefore, the
sampling of the position is based on the spindle velocity and on the local predicted
feed rates. Based on the angular fixed step, d#, the equivalent temporal sampling
period, dt, is calculated using the following equation:
Eq. (4)
For each sampling point (N*), the local feed rate is thus expressed by:
Eq. (5)
This yields to the calculation of the sampled tool locations along the elementary
trajectory (figure 5):
Eq. (6)
Fig. 5 computation of sampled tool locations
Finally, the simulated machined surface is obtained by computing the
intersections between the normal lines of the “hedgehog” and the tool for each
configuration {Xp*,Yp
*,Zp
*,I
*,J
*,K
*,#
*} (figure 5).
A first illustration of the material removal simulation is presented in figure 6. The
colorbar indicates the gap, in millimeters, between the mathematical surface used
to compute the tool path and the simulated one after machining. The example
concerns the machining of a plane surface using a filleted end milling tool
(R=5mm, rc=1.5mm) considering a maximum scallop height allowed of hc =
8
0.005mm. The tool inclination is defined according to figure 7 by the yaw angle
(0°) and the tilt angle (1°). To enhance the effect of local variations of the feed per
tooth, a linear evolution of the feed rate is set from 4 m/min, at the beginning of
the pass, to 0.5m/min at the end. This influence is clearly visible on the resulting
surface topography: the pattern becomes thinner as the feed rate decreases (figure
6). This illustration brings out the major effect of the actual local feed rate in the
simulation of machined surface topographies.
Fig. 6 Topography simulation considering variable local feed rates along a pass
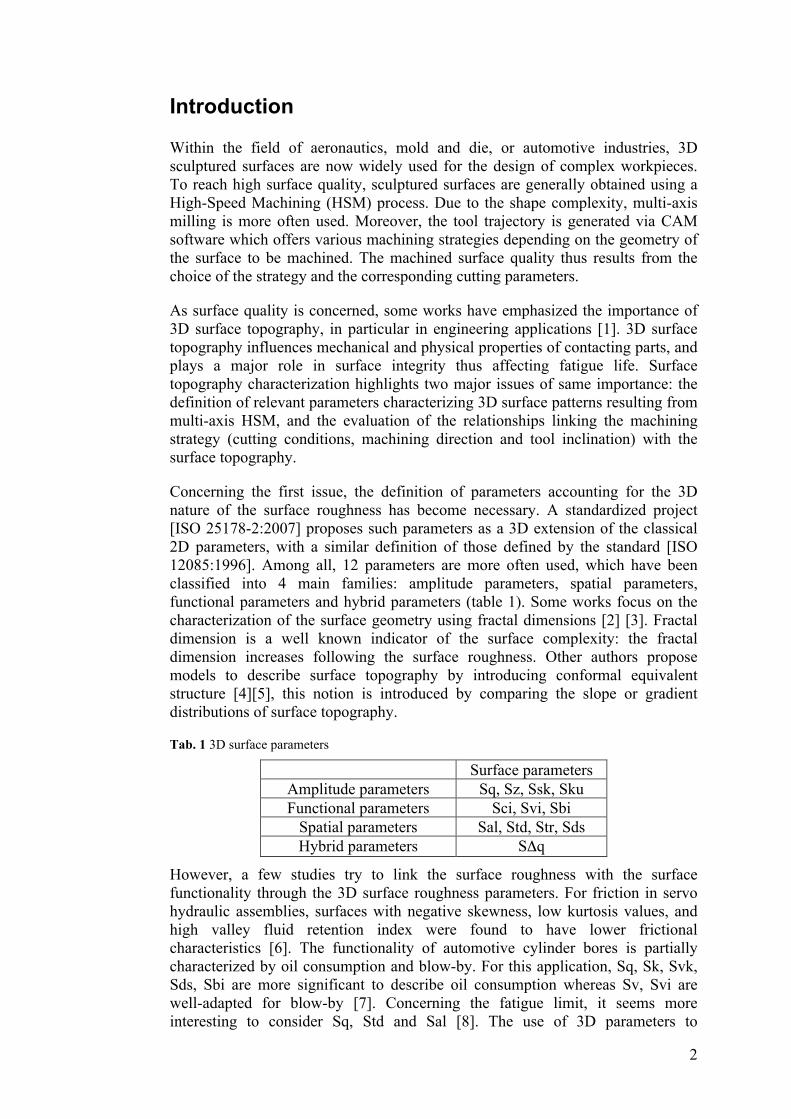
The second illustration is dedicated to the machining of a complex surface in 5-
axis milling (figure 7) using a filleted end tool (R=5mm, rc=1.5mm). The surface
is defined as an extrusion of a parabola curve (z = -a.x2+d, with a=0.004 mm
-1,
d=0.1mm) along the y direction. Cutting conditions are constant: Vf = 5 m/min,
hc = 0.01mm, rotational velocity, " = 15 000 rpm, yaw angle = 0°, and tilt angle
= 5°. The machining is performed in a parallel plane mode at 45° in the X-Y
plane. As shown in figure 7, the resulting pattern is affected by the surface
curvature combined with the tool orientation.
Fig. 7 Topography simulation of a complex surface

9
Assessment of the 3D surface topography simulation model
In order to assess the model, a series of trials is carried out (figure 8), with the aim
of comparing various 3D surface patterns obtained by simulations to actual ones.
Fig. 8 Description of the trials and tool inclination parameters
For this purpose, a series of plane sweepings of an aluminum alloy with a filleted-
end mill tool is performed according to variable cutting parameters (table 2). The
actual machining is performed on a 5-axis HSM milling centre using a filleted-end
milling tool (R=5mm, rc=1.5mm) with a unique tooth in order to control the
geometry of the tooth which contributes to the final imprint.
Tab. 2 Cutting parameters
Test Yaw (°) Tilt (°) Scallop height (mm) Feedrate (m/min)
1 0 1 0,005 2
2 0 1 0,005 4
3 0 10 0,01 4
4 20 10 0,01 4
The machined surfaces are measured using an optical instrument (Wyko NT1100
- http://www.veeco.com/). The use of 3D surface parameters is relevant as the
topography is clearly anisotropical and tridimensional. To characterize the
obtained pattern, the 3D amplitude parameters defined in the standard [ISO
25178] are used. Sz corresponds to the maximum height of the surface and Sq is
the root mean square height of the surface. The functional parameter Std
corresponds to the texture direction of the surface. For all cases, 3D patterns and
defect amplitudes issued from simulation match the measured ones (figures 9 and
10; table 3). For most cases, deviations are less than 5% and for a few ones the
deviation can reach 9% due to not optimal cutting conditions, in particular for
high values of the yaw and tilt angles.
Tab. 3 Comparison between measured and simulated patterns
Test Sz (µm) Sq (µm) Trans. step
(mm)
Long. step
(mm)
Std (°)

10
1 4,77 4,95 1.44 1.4 2.76 2.63 0.13 0.133 2.27° -2.19°
2 8.88 9.22 1.84 1.98 2.71 2.62 0.269 0.266 -3.92° -3.94°
3 14.9 13,5 3.06 2.97 1.21 1.18 0.267 0.266 0.02° -0.01°
4 6.15 5.6 1.2 1.25 0.46 0.43 0.264 0.266 -18.5° -26.4°
However, the longitudinal step as well as the transversal step obtained using the
simulated patterns are consistent with those obtained with the measured ones. The
longitudinal step is directly linked to the programmed feed per tooth. The
transversal step is linked with the programmed scallop height and also with the
effective cutting radius.
Fig. 9 Simulated (left) and measured (right) 3D patterns (tests 3 and 4)
Fig. 10 Simulated and measured profiles (case 3)
Concerning the surface topography, small deviations between simulated and
measured data can be observed and may come from the actual tool geometry
or/and the cutting process. Despite these comments, the model proposed to predict
3D surface topography is efficient. Hence, the analysis of influent parameters on
the surface topography can be conducted through simulations. Furthermore, the
use of 3D parameters to characterize surface finish is relevant as they clearly
reflect effects observed.

11
3D surface topography vs machining parameters
In this section, an experimental design is proposed with the aim of formalizing the
influence of the tool axis orientation and the cutting conditions on resulting 3D
surface patterns. The objective is also to highlight surface parameters that best
characterize machined patterns. The experimental design consists of 4 factors at 2
levels (table 4). The tilt angle and the yaw angle characterize the influence of the
tool inclination, whereas the scallop height and the feed rate are the cutting
parameters commonly investigated in finish surface studies. The values are
representative of classical milling of sculptured surfaces in high-speed machining.
Tab. 4 Parameters of the experimental design
Factors Levels
Tilt angle (°) 1 – 10
Yaw angle (°) 0 - 20
Scallop height (mm) 0.005 – 0.01
Feed rate (mm/min) 2000 - 4000
Let MFij be the mean value of the responses of the factor Fi at the level j, and M be
the mean value of all the responses, the factor effect at the level j is given by:
EFij = Mij – M Eq. (7)
The evolution of the factor effect at the first level is reported in figure 11 for each
surface parameter. As unit and magnitude of the parameters are obviously
different, each effect is divided by the mean value.
EFi1 = (MFi1– M)/M Eq. (8)
As the graph distinctly highlights, the yaw angle is the most influent factor on
surface topography. This is an interesting result; the tool inclination is definitively
the major factor controlling the surface topography. The scallop height is
especially significant for amplitude parameters. The feed rate is a secondary
parameter, as it actually conditions spatial parameters. Therefore, modifications of
feed rate during machining generally affect the 3D surface finish (as shown in
figure 6). It is thus essential to integrate local variations of the feed rate in the
simulation as proposed in our simulation model. Indeed, when milling sculptured
surfaces in 5-axis HSM, the feed rate is seldom the programmed one due to
kinematics limits linked to the part geometry (curvature modifications, abrupt
variations of tangency…) [27]. Note that some surface parameters are minor as
Sku and Sci. Besides, the study of the experimental design shows no correlation
between parameters.

12
Fig. 11 Factor effects at the first level
The geometry of the pattern, in particular the shape of the valleys is linked to the
ratio “corner radius”/”tool radius. This effect is not investigated in this study.
Nevertheless, as the influence of the yaw angle is predominant, a specific analysis
is developed. A new experimental design is performed considering the same 4
factors as previously. In this design, the levels for the tilt angle, the scallop height
and the feed rate remain unchanged, unlike the yaw angle for which the number of
levels is modified to 6: (0°, 2°, 5°, 10°, 15°, 20°). The evolution of the effects of
the yaw angle is reported in figure 8. Only the surface parameters the most
sensitive to the yaw angle effect are considered.
Fig. 12 Effect of the yaw angle
Results enhance the major effect at low values of the yaw angles for most
parameters: beyond 2°, the effect is the same. Only the texture direction Std is
affected by large yaw angle values. This is not surprising as the texture direction
is very sensitive to the slightest change in pattern direction.
Therefore, in 5-axis milling using a tapered-end tool, the resulting pattern is given
by the tool geometry and the tool inclination. In particular, the yaw angle is the
major factor affecting the topography. Nevertheless, its influence decreases
beyond 2°. Hence, to control the amplitude parameters such as Sz and Sq, it is
necessary to first set the yaw angle, then the feed rate and the scallop height next.
This enhances the importance of the feed rate prediction all trajectory long, as the

13
amplitude parameters of the surface finish are very sensitive to feed rate
variations. As the spatial parameters are concerned, Sds and Str are mostly
affected by the feed rate and the tilt angle. Functional parameters are in turn not
sensitive to the factor in this study. Indeed, functional parameters are mainly
controlled by the tool geometry.
Conclusion
The influence of the machining strategy in 5-axis milling (cutting parameters and
tool inclination) on machined surface topography has been investigated in the
paper through an experimental design. The surface topography is simulated thanks
to a predicting model based on the material removal simulation. The model
accounts for variations of the local feed rate which is usual in 5-axis milling of
sculptured surfaces using a tapered-end tool. Usually the maximum scallop height
allowed is one of the parameters the most used in CAM software to define the 3D
surface topography. Results have highlighted that a non null yaw angle provides a
pattern for which the notion of cusp only has no more significance. The yaw angle
turns out to be the most significant influencing factor. Furthermore, the
experiment enhances the influence of the feed rate on amplitude parameters. It is
thus important to predict its evolution all trajectory long. We can also conclude on
the interest of using surface parameters to describe the surface topography. The
step afterwards is the link of such parameters to the workpiece function.
Nevertheless, according to the surface parameter retained to characterize the 3D
pattern, the experiment gives information on the influencing machining
parameters. The user is thus able to make a choice as regards the expected
geometrical surface quality. Further work concerns the integration of the tool run
out in the model. The application of the model to the prediction of surface
topography on free-form surfaces is also in progress.
Acknowledgements:
This work was carried out within the context of the working group Manufacturing 21 which
gathers 16 French research laboratories. The topics approached are:
- modeling of the manufacturing process,
- virtual machining,
- emerging manufacturing methods.
References
[1] Dong WP, Sullivan PJ, Stout KJ (1994)
Comprehensive study of parameters for characterizing three dimensional surface topography IV:
Parameter for characterising spatial and hybrid properties. Wear. 178, 45-60
[2] Ganti S, Bhushan B (1995)
Generalized fractal analysis and its applications to engineering surfaces. Wear. 180, 17-34
[3] Thomas TR, Rosen BG, Amini N (1999)
Fractal Characterisation of the anisotropy of rough surfaces. Wear. 232, 41-50

14
[4] Roques-Carmes C, Bodin N, Monteil G, Quiniou JF (2001a)
Description of rough surface using conformal equivalent structure concept. Part 1: Stereological
Approach. Wear. 248, 82-91
[5] Roques-Carmes C, Bodin N, Monteil G, Quiniou JF (2001b)
Description of rough surface using conformal equivalent structure concept. Part 2: Numerical
approach. Wear. 248, 92-99
[6] Saravanakumar P, Manesh KK, Singaperumal M, Ramamoorthy B (2009)
Modelling of fluid continuum considering 3D surface parameters in hydraulic assemblies.
Precision Engineering. 33, 99-106
[7] Blunt L, Jiang X, (2003)
Advanced techniques for assessment surface topography: Development of a basis for 3D surface
texture standards “surfstand”. Kogan Page science, ISBN 1903996112
[8] Novovic D, Dewes RC, Aspinwall DK, Voice W, Bowen P (2004)
The effect of machined topography and integrity on fatigue life. International Journal of Machine
Tools and Manufacture. 44,125-134
[10] Ramos AM, Relvas C, Simões A (2003)
The influence of finishing milling strategies on texture roughness and dimensional deviations on
the machining of complex surface. Journal of Materials Processing Technology. 136, 209-216
[9] Benardos PG, Vosniakos GC (2003)
Predicting surface roughness in machining: a review. International Journal of Machine Tools and
Manufacture. 43, 833-844
[11] Kang MC, Kim KK, Lee DW, Kim JS, Kim NK (2001)
Characteristics of inclined Planes According to the Variations of the cutting direction in high-
speed ball-end milling. International Journal of Advanced Manufacturing Technology. 17, 323-329
[12] Baptista R, Antune Simoes JF (2000)
Three and five axes milling of sculptured surfaces. Journal of Materials Processing Technology.
103, 398-403
[13] Axinte DA, Dewes RC, (2002)
Surface integrity of hot work tool steel after high speed milling-experimental data and empirical
models. Journal of Materials Processing Technology. 127, 325-335
[14] Ko TJ, Kim HS, Lee SS (2001)
Selection of the machining inclination angle in high-speed ball end milling. International Journal
of Advanced Manufacturing Technology. 17, 163-170
[15] Jung JY, Kim CM, Ko TJ, Chung WJ (2004)
Optimization for improvement of surface roughness in high speed machining. Current Advances in
Mechanical Design and Production. 8, 953-960
[16] Kim BH, Chu CN (1999)
Texture prediction of milled surfaces using texture superposition method. Computer-Aided
Design. 31, 485-494
[17] Bouzakis KD, Aichouh P, Efstahiou K (2003)
Determination of the chip geometry, cutting force and roughness in free form surfaces finishing
milling, with ball end tools. International Journal of Machine Tools and Manufacture. 43, 499-514
[18] Toh CK (2004)
Surface topography analysis in high speed finish milling inclined hardened steel. Precision
Engineering. 28, 386-398
[19] Chen JS, Huang YK, Chen MS (2005)

15
A study of the surface scallop generating mechanism in the ball-end milling process. International
Journal of Machine Tools and Manufacture. 45, 1077-1084
[20] Liu N, Loftus M, Whitten A (2005)
Surface finish in high speed, ball nose milling applications. International Journal of Machine Tools
and Manufacture. 45, 1152-1161
[21] Quinsat Y, Sabourin L, Lartigue C (2008)
Surface topography in ball en milling process: Description of a 3D surface roughness parameter.
Journal of Materials Processing Technology. 195,135-143
[22] Ehmann KF, Hong MS (1994)
A Generalized Model of the Surface Generation Process in Metal Cutting. CIRP Annals -
Manufacturing Technology. 43, 483-486
[23] Li SJ, Liu RS, Zhang AJ (2002)
Study on an end milling generation surface model and simulation taking into account of the main
axle's tolerance. Journal of Materials Processing Technology. 129, 86-90
[24] Gao T, Zhang WH, Qiu K, Wan M. (2006)
Numerical Simulation of Machined Surface Topography and Roughness in Milling Process.
Journal of Manufactruing Science and Engineering. 128, 96-103
[25] Zhang WH, Tan G, Wan M, Gao T, Bassir D (2008)
A new algorithm for the numerical simulation of machined surface topography in Multi axis ball-
end milling. Journal of Manufacturing Science and Engineering. 130, 11003-1/11003-11
[26] Lavernhe S, Quinsat Y, Lartigue C, Meyer R (2008a)
NC-simulation for the prediction of surface finish in 5-axis High-Speed Machining, 3rd CIRP
International Conference on High Performance Cutting, Dublin (Ireland), 1, pp 387-396, 12-13
June 2008
[27] Lavernhe S, Tournier C, Lartigue C (2008b)
Kinematical performance prediction in multi-axis machining for process planning optimization.
International Journal of Advanced Manufacturing Technology. 37, 534-54
Appendix
Experimental design
Test Yaw angle (°) Tilt angle (°) Scallop height (mm) Feedrate (m/min)
1 0 1 0,005 2
2 0 1 0,005 4
3 0 1 0,01 2
4 0 1 0,01 4
5 0 10 0,005 2
6 0 10 0,005 4
7 0 10 0,01 2
8 0 10 0,01 4
9 20 1 0,005 2
10 20 1 0,005 4
11 20 1 0,01 2
12 20 1 0,01 4
13 20 10 0,005 2
14 20 10 0,005 4
15 20 10 0,01 2

16
16 20 10 0,01 4