Embed Size (px)
Citation preview
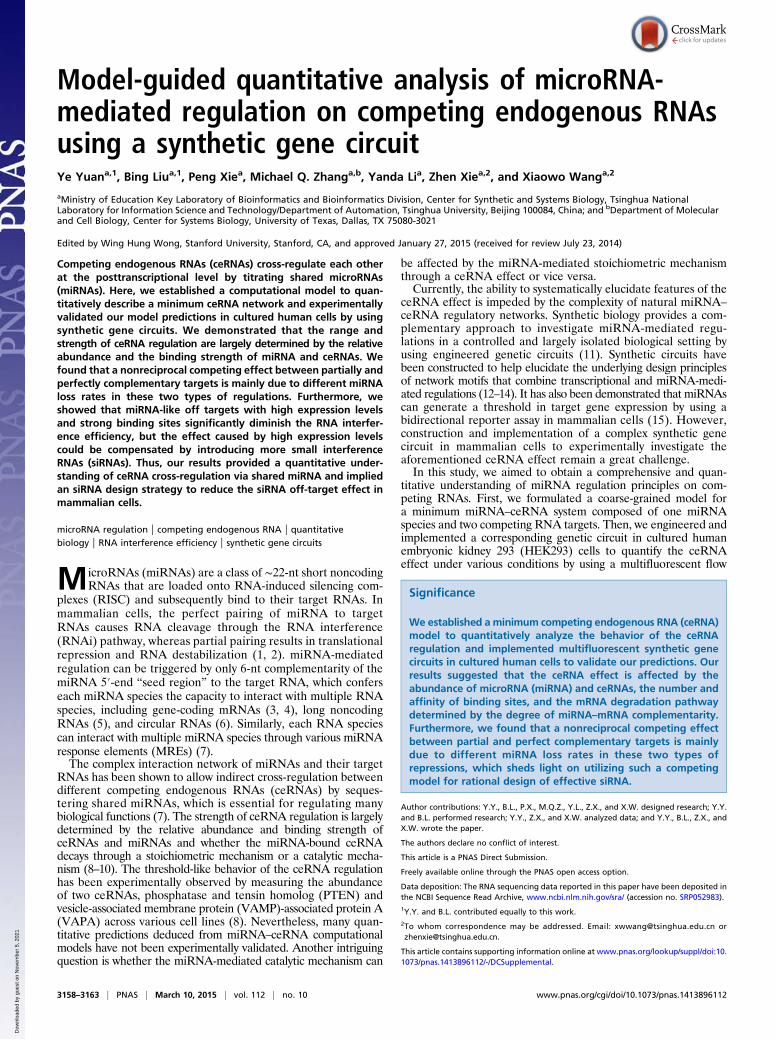
Model-guided quantitative analysis of microRNA-mediated regulation on competing endogenous RNAsusing a synthetic gene circuitYe Yuana,1, Bing Liua,1, Peng Xiea, Michael Q. Zhanga,b, Yanda Lia, Zhen Xiea,2, and Xiaowo Wanga,2
aMinistry of Education Key Laboratory of Bioinformatics and Bioinformatics Division, Center for Synthetic and Systems Biology, Tsinghua NationalLaboratory for Information Science and Technology/Department of Automation, Tsinghua University, Beijing 100084, China; and bDepartment of Molecularand Cell Biology, Center for Systems Biology, University of Texas, Dallas, TX 75080-3021
Edited by Wing Hung Wong, Stanford University, Stanford, CA, and approved January 27, 2015 (received for review July 23, 2014)
Competing endogenous RNAs (ceRNAs) cross-regulate each otherat the posttranscriptional level by titrating shared microRNAs(miRNAs). Here, we established a computational model to quan-titatively describe a minimum ceRNA network and experimentallyvalidated our model predictions in cultured human cells by usingsynthetic gene circuits. We demonstrated that the range andstrength of ceRNA regulation are largely determined by the relativeabundance and the binding strength of miRNA and ceRNAs. Wefound that a nonreciprocal competing effect between partially andperfectly complementary targets is mainly due to different miRNAloss rates in these two types of regulations. Furthermore, weshowed that miRNA-like off targets with high expression levelsand strong binding sites significantly diminish the RNA interfer-ence efficiency, but the effect caused by high expression levelscould be compensated by introducing more small interferenceRNAs (siRNAs). Thus, our results provided a quantitative under-standing of ceRNA cross-regulation via shared miRNA and impliedan siRNA design strategy to reduce the siRNA off-target effect inmammalian cells.
microRNA regulation | competing endogenous RNA | quantitativebiology | RNA interference efficiency | synthetic gene circuits
MicroRNAs (miRNAs) are a class of ∼22-nt short noncodingRNAs that are loaded onto RNA-induced silencing com-
plexes (RISC) and subsequently bind to their target RNAs. Inmammalian cells, the perfect pairing of miRNA to targetRNAs causes RNA cleavage through the RNA interference(RNAi) pathway, whereas partial pairing results in translationalrepression and RNA destabilization (1, 2). miRNA-mediatedregulation can be triggered by only 6-nt complementarity of themiRNA 5′-end “seed region” to the target RNA, which conferseach miRNA species the capacity to interact with multiple RNAspecies, including gene-coding mRNAs (3, 4), long noncodingRNAs (5), and circular RNAs (6). Similarly, each RNA speciescan interact with multiple miRNA species through various miRNAresponse elements (MREs) (7).The complex interaction network of miRNAs and their target
RNAs has been shown to allow indirect cross-regulation betweendifferent competing endogenous RNAs (ceRNAs) by seques-tering shared miRNAs, which is essential for regulating manybiological functions (7). The strength of ceRNA regulation is largelydetermined by the relative abundance and binding strength ofceRNAs and miRNAs and whether the miRNA-bound ceRNAdecays through a stoichiometric mechanism or a catalytic mecha-nism (8–10). The threshold-like behavior of the ceRNA regulationhas been experimentally observed by measuring the abundanceof two ceRNAs, phosphatase and tensin homolog (PTEN) andvesicle-associated membrane protein (VAMP)-associated protein A(VAPA) across various cell lines (8). Nevertheless, many quan-titative predictions deduced from miRNA–ceRNA computationalmodels have not been experimentally validated. Another intriguingquestion is whether the miRNA-mediated catalytic mechanism can
be affected by the miRNA-mediated stoichiometric mechanismthrough a ceRNA effect or vice versa.Currently, the ability to systematically elucidate features of the
ceRNA effect is impeded by the complexity of natural miRNA–
ceRNA regulatory networks. Synthetic biology provides a com-plementary approach to investigate miRNA-mediated regu-lations in a controlled and largely isolated biological setting byusing engineered genetic circuits (11). Synthetic circuits havebeen constructed to help elucidate the underlying design principlesof network motifs that combine transcriptional and miRNA-medi-ated regulations (12–14). It has also been demonstrated that miRNAscan generate a threshold in target gene expression by using abidirectional reporter assay in mammalian cells (15). However,construction and implementation of a complex synthetic genecircuit in mammalian cells to experimentally investigate theaforementioned ceRNA effect remain a great challenge.In this study, we aimed to obtain a comprehensive and quan-
titative understanding of miRNA regulation principles on com-peting RNAs. First, we formulated a coarse-grained model fora minimum miRNA–ceRNA system composed of one miRNAspecies and two competing RNA targets. Then, we engineered andimplemented a corresponding genetic circuit in cultured humanembryonic kidney 293 (HEK293) cells to quantify the ceRNAeffect under various conditions by using a multifluorescent flow
Significance
We established a minimum competing endogenous RNA (ceRNA)model to quantitatively analyze the behavior of the ceRNAregulation and implemented multifluorescent synthetic genecircuits in cultured human cells to validate our predictions. Ourresults suggested that the ceRNA effect is affected by theabundance of microRNA (miRNA) and ceRNAs, the number andaffinity of binding sites, and the mRNA degradation pathwaydetermined by the degree of miRNA–mRNA complementarity.Furthermore, we found that a nonreciprocal competing effectbetween partial and perfect complementary targets is mainlydue to different miRNA loss rates in these two types ofrepressions, which sheds light on utilizing such a competingmodel for rational design of effective siRNA.
Author contributions: Y.Y., B.L., P.X., M.Q.Z., Y.L., Z.X., and X.W. designed research; Y.Y.and B.L. performed research; Y.Y., Z.X., and X.W. analyzed data; and Y.Y., B.L., Z.X., andX.W. wrote the paper.
The authors declare no conflict of interest.
This article is a PNAS Direct Submission.
Freely available online through the PNAS open access option.
Data deposition: The RNA sequencing data reported in this paper have been deposited inthe NCBI Sequence Read Archive, www.ncbi.nlm.nih.gov/sra/ (accession no. SRP052983).1Y.Y. and B.L. contributed equally to this work.2To whom correspondence may be addressed. Email: [email protected] [email protected].
This article contains supporting information online at www.pnas.org/lookup/suppl/doi:10.1073/pnas.1413896112/-/DCSupplemental.
3158–3163 | PNAS | March 10, 2015 | vol. 112 | no. 10 www.pnas.org/cgi/doi/10.1073/pnas.1413896112
Dow
nloa
ded
by g
uest
on
Nov
embe
r 5,
202
1
cytometry. Based on computational and experimental results, wedemonstrated that the relative abundance of miRNAs and com-peting RNAs, the miRNA–target binding free energy, and thenumber of MREs have strong impacts on miRNA-mediatedceRNA regulation in suitable molecular environments. Further-more, we proposed a special ceRNA system consisting of onetarget with partially paired MREs (miRNA-type target) and theother one with perfectly paired MREs (RNAi-type target). Wefound a nonreciprocal competition between partially and perfectlycomplementary targets that share the same miRNA species. Thiscompeting effect was largely due to the low miRNA loss rate inRNAi-type regulation and the high miRNA loss rate in miRNA-type regulation. In addition, we demonstrated that the RNAi ef-ficiency of siRNA can be significantly reduced by miRNA-like offtargets with high expression levels and strong binding sites. In-creasing siRNA concentrations diminished the competing effectcaused by highly expressed off targets, but severely repressed offtargets with strong binding sites. This finding provided us ansiRNA design strategy to reduce the siRNA off-target effect.
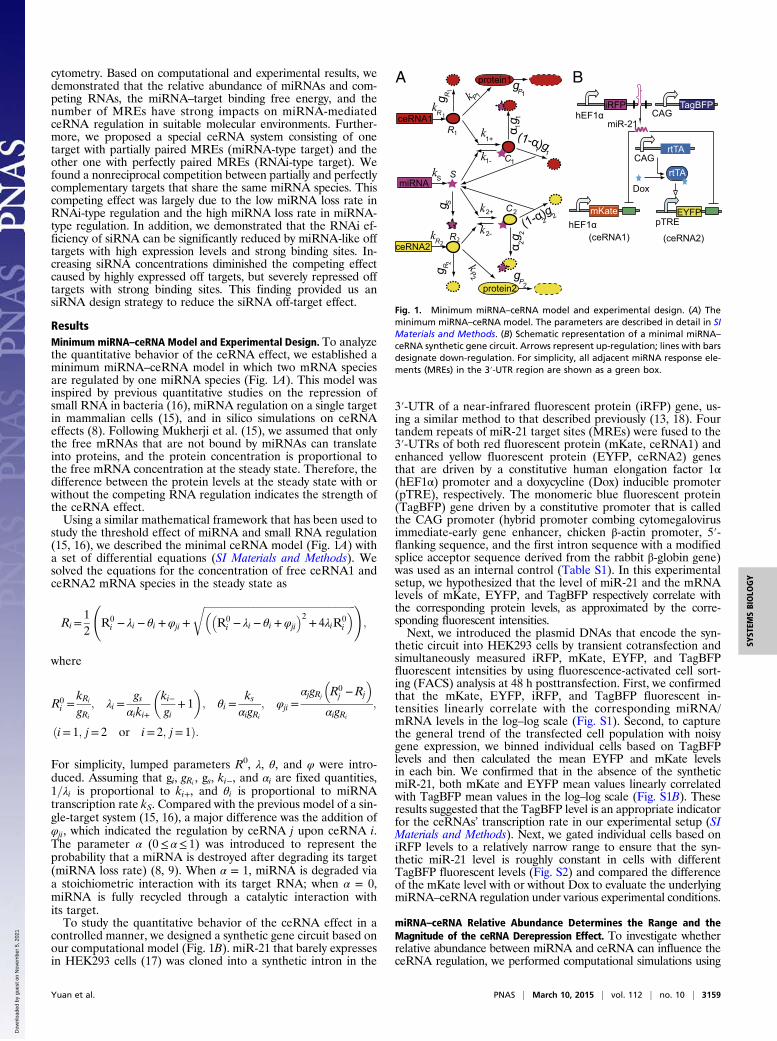
ResultsMinimum miRNA–ceRNA Model and Experimental Design. To analyzethe quantitative behavior of the ceRNA effect, we established aminimum miRNA–ceRNA model in which two mRNA speciesare regulated by one miRNA species (Fig. 1A). This model wasinspired by previous quantitative studies on the repression ofsmall RNA in bacteria (16), miRNA regulation on a single targetin mammalian cells (15), and in silico simulations on ceRNAeffects (8). Following Mukherji et al. (15), we assumed that onlythe free mRNAs that are not bound by miRNAs can translateinto proteins, and the protein concentration is proportional tothe free mRNA concentration at the steady state. Therefore, thedifference between the protein levels at the steady state with orwithout the competing RNA regulation indicates the strength ofthe ceRNA effect.Using a similar mathematical framework that has been used to
study the threshold effect of miRNA and small RNA regulation(15, 16), we described the minimal ceRNA model (Fig. 1A) witha set of differential equations (SI Materials and Methods). Wesolved the equations for the concentration of free ceRNA1 andceRNA2 mRNA species in the steady state as
Ri=12
R0
i − λi − θi +φji +
ffiffiffiffiffiffiffiffiffiffiffiffiffiffiffiffiffiffiffiffiffiffiffiffiffiffiffiffiffiffiffiffiffiffiffiffiffiffiffiffiffiffiffiffiffiffiffiffiffiffiffiffiffiffiffiffiffiffiffiffiffi��R0
i − λi − θi +φji
�2+ 4λiR0
i
�r !;
where
R0i =
kRi
gRi
; λi =gs
αiki+
�ki−gi
+ 1�; θi =
ksαigRi
; φji =αjgRj
�R0j −Rj
�αigRi
;
ði= 1; j= 2 or i= 2; j= 1Þ:
For simplicity, lumped parameters R0, λ, θ, and φ were intro-duced. Assuming that gi, gRi , gs, ki−, and αi are fixed quantities,1=λi is proportional to ki+, and θi is proportional to miRNAtranscription rate kS. Compared with the previous model of a sin-gle-target system (15, 16), a major difference was the addition ofφji, which indicated the regulation by ceRNA j upon ceRNA i.The parameter α (0≤ α≤ 1) was introduced to represent theprobability that a miRNA is destroyed after degrading its target(miRNA loss rate) (8, 9). When α = 1, miRNA is degraded viaa stoichiometric interaction with its target RNA; when α = 0,miRNA is fully recycled through a catalytic interaction withits target.To study the quantitative behavior of the ceRNA effect in a
controlled manner, we designed a synthetic gene circuit based onour computational model (Fig. 1B). miR-21 that barely expressesin HEK293 cells (17) was cloned into a synthetic intron in the
3′-UTR of a near-infrared fluorescent protein (iRFP) gene, us-ing a similar method to that described previously (13, 18). Fourtandem repeats of miR-21 target sites (MREs) were fused to the3′-UTRs of both red fluorescent protein (mKate, ceRNA1) andenhanced yellow fluorescent protein (EYFP, ceRNA2) genesthat are driven by a constitutive human elongation factor 1α(hEF1α) promoter and a doxycycline (Dox) inducible promoter(pTRE), respectively. The monomeric blue fluorescent protein(TagBFP) gene driven by a constitutive promoter that is calledthe CAG promoter (hybrid promoter combing cytomegalovirusimmediate-early gene enhancer, chicken β-actin promoter, 5′-flanking sequence, and the first intron sequence with a modifiedsplice acceptor sequence derived from the rabbit β-globin gene)was used as an internal control (Table S1). In this experimentalsetup, we hypothesized that the level of miR-21 and the mRNAlevels of mKate, EYFP, and TagBFP respectively correlate withthe corresponding protein levels, as approximated by the corre-sponding fluorescent intensities.Next, we introduced the plasmid DNAs that encode the syn-
thetic circuit into HEK293 cells by transient cotransfection andsimultaneously measured iRFP, mKate, EYFP, and TagBFPfluorescent intensities by using fluorescence-activated cell sort-ing (FACS) analysis at 48 h posttransfection. First, we confirmedthat the mKate, EYFP, iRFP, and TagBFP fluorescent in-tensities linearly correlate with the corresponding miRNA/mRNA levels in the log–log scale (Fig. S1). Second, to capturethe general trend of the transfected cell population with noisygene expression, we binned individual cells based on TagBFPlevels and then calculated the mean EYFP and mKate levelsin each bin. We confirmed that in the absence of the syntheticmiR-21, both mKate and EYFP mean values linearly correlatedwith TagBFP mean values in the log–log scale (Fig. S1B). Theseresults suggested that the TagBFP level is an appropriate indicatorfor the ceRNAs’ transcription rate in our experimental setup (SIMaterials and Methods). Next, we gated individual cells based oniRFP levels to a relatively narrow range to ensure that the syn-thetic miR-21 level is roughly constant in cells with differentTagBFP fluorescent levels (Fig. S2) and compared the differenceof the mKate level with or without Dox to evaluate the underlyingmiRNA–ceRNA regulation under various experimental conditions.
miRNA–ceRNA Relative Abundance Determines the Range and theMagnitude of the ceRNA Derepression Effect. To investigate whetherrelative abundance between miRNA and ceRNA can influence theceRNA regulation, we performed computational simulations using
A
CAGTagBFP
rtTA
rtTACAG
pTRE
Dox
EYFPhEF1α
mKate
iRFPhEF1α
miR-21ceRNA1
miRNA
ceRNA2
protein1
kR
kS
R
g Rg S
g R
k P
kP
α g
(1-α)g
(1-α)g
R
S
R
C
C
11
α g 2
2
2 2
1 1
1+
1-
2+
2-
protein2
1
1
1
2
2
2 (ceRNA1) (ceRNA2)
gP1
gP2
k
k
k
k
k
1
2
B
1
2
Fig. 1. Minimum miRNA–ceRNA model and experimental design. (A) Theminimum miRNA–ceRNA model. The parameters are described in detail in SIMaterials and Methods. (B) Schematic representation of a minimal miRNA–ceRNA synthetic gene circuit. Arrows represent up-regulation; lines with barsdesignate down-regulation. For simplicity, all adjacent miRNA response ele-ments (MREs) in the 3′-UTR region are shown as a green box.
Yuan et al. PNAS | March 10, 2015 | vol. 112 | no. 10 | 3159
SYST
EMSBIOLO
GY
Dow
nloa
ded
by g
uest
on
Nov
embe
r 5,
202
1
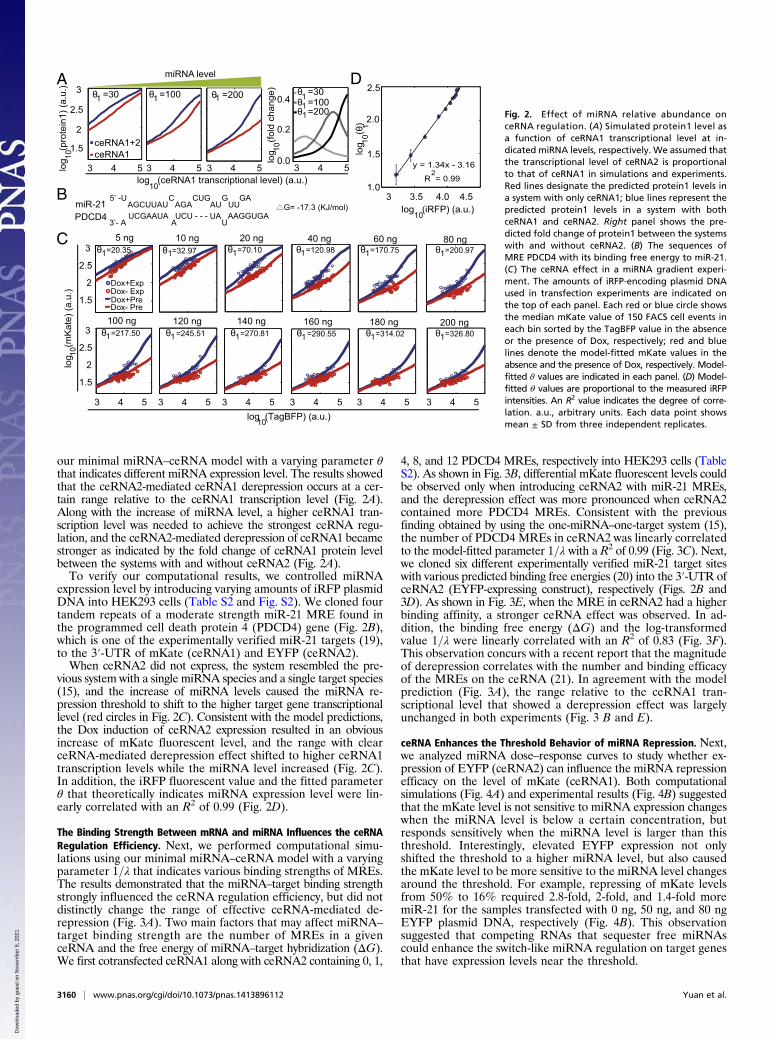
our minimal miRNA–ceRNA model with a varying parameter θthat indicates different miRNA expression level. The results showedthat the ceRNA2-mediated ceRNA1 derepression occurs at a cer-tain range relative to the ceRNA1 transcription level (Fig. 2A).Along with the increase of miRNA level, a higher ceRNA1 tran-scription level was needed to achieve the strongest ceRNA regu-lation, and the ceRNA2-mediated derepression of ceRNA1 becamestronger as indicated by the fold change of ceRNA1 protein levelbetween the systems with and without ceRNA2 (Fig. 2A).To verify our computational results, we controlled miRNA
expression level by introducing varying amounts of iRFP plasmidDNA into HEK293 cells (Table S2 and Fig. S2). We cloned fourtandem repeats of a moderate strength miR-21 MRE found inthe programmed cell death protein 4 (PDCD4) gene (Fig. 2B),which is one of the experimentally verified miR-21 targets (19),to the 3′-UTR of mKate (ceRNA1) and EYFP (ceRNA2).When ceRNA2 did not express, the system resembled the pre-
vious system with a single miRNA species and a single target species(15), and the increase of miRNA levels caused the miRNA re-pression threshold to shift to the higher target gene transcriptionallevel (red circles in Fig. 2C). Consistent with the model predictions,the Dox induction of ceRNA2 expression resulted in an obviousincrease of mKate fluorescent level, and the range with clearceRNA-mediated derepression effect shifted to higher ceRNA1transcription levels while the miRNA level increased (Fig. 2C).In addition, the iRFP fluorescent value and the fitted parameterθ that theoretically indicates miRNA expression level were lin-early correlated with an R2 of 0.99 (Fig. 2D).
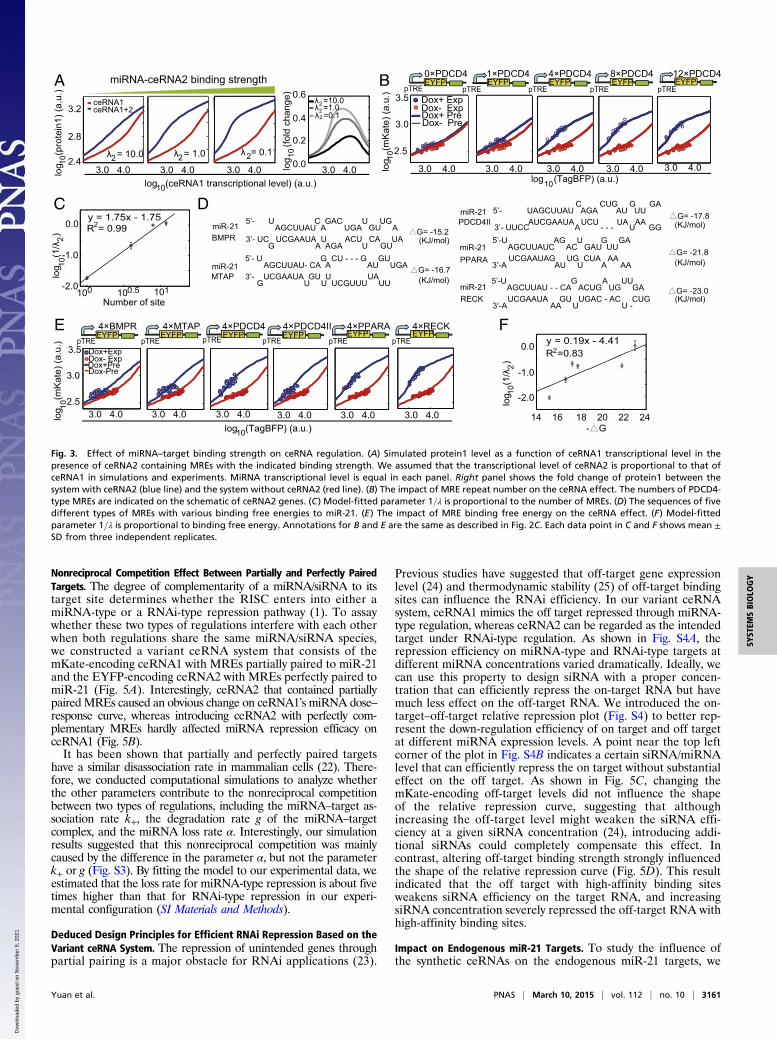
The Binding Strength Between mRNA and miRNA Influences the ceRNARegulation Efficiency. Next, we performed computational simu-lations using our minimal miRNA–ceRNA model with a varyingparameter 1=λ that indicates various binding strengths of MREs.The results demonstrated that the miRNA–target binding strengthstrongly influenced the ceRNA regulation efficiency, but did notdistinctly change the range of effective ceRNA-mediated de-repression (Fig. 3A). Two main factors that may affect miRNA–target binding strength are the number of MREs in a givenceRNA and the free energy of miRNA–target hybridization (ΔG).We first cotransfected ceRNA1 along with ceRNA2 containing 0, 1,
4, 8, and 12 PDCD4 MREs, respectively into HEK293 cells (TableS2). As shown in Fig. 3B, differential mKate fluorescent levels couldbe observed only when introducing ceRNA2 with miR-21 MREs,and the derepression effect was more pronounced when ceRNA2contained more PDCD4 MREs. Consistent with the previousfinding obtained by using the one-miRNA–one-target system (15),the number of PDCD4 MREs in ceRNA2 was linearly correlatedto the model-fitted parameter 1=λ with a R2 of 0.99 (Fig. 3C). Next,we cloned six different experimentally verified miR-21 target siteswith various predicted binding free energies (20) into the 3′-UTR ofceRNA2 (EYFP-expressing construct), respectively (Figs. 2B and3D). As shown in Fig. 3E, when the MRE in ceRNA2 had a higherbinding affinity, a stronger ceRNA effect was observed. In ad-dition, the binding free energy (ΔG) and the log-transformedvalue 1=λ were linearly correlated with an R2 of 0.83 (Fig. 3F).This observation concurs with a recent report that the magnitudeof derepression correlates with the number and binding efficacyof the MREs on the ceRNA (21). In agreement with the modelprediction (Fig. 3A), the range relative to the ceRNA1 tran-scriptional level that showed a derepression effect was largelyunchanged in both experiments (Fig. 3 B and E).
ceRNA Enhances the Threshold Behavior of miRNA Repression. Next,we analyzed miRNA dose–response curves to study whether ex-pression of EYFP (ceRNA2) can influence the miRNA repressionefficacy on the level of mKate (ceRNA1). Both computationalsimulations (Fig. 4A) and experimental results (Fig. 4B) suggestedthat the mKate level is not sensitive to miRNA expression changeswhen the miRNA level is below a certain concentration, butresponds sensitively when the miRNA level is larger than thisthreshold. Interestingly, elevated EYFP expression not onlyshifted the threshold to a higher miRNA level, but also causedthe mKate level to be more sensitive to the miRNA level changesaround the threshold. For example, repressing of mKate levelsfrom 50% to 16% required 2.8-fold, 2-fold, and 1.4-fold moremiR-21 for the samples transfected with 0 ng, 50 ng, and 80 ngEYFP plasmid DNA, respectively (Fig. 4B). This observationsuggested that competing RNAs that sequester free miRNAscould enhance the switch-like miRNA regulation on target genesthat have expression levels near the threshold.
C θ =32.973
1.5
2
2.5
log (TagBFP) (a.u.)10
log
(m
Kat
e) (a
.u.)
10
3 3.5 4.0 4.5
2.0
1.0
1.5log
(θ)
10
2.5
log (iRFP) (a.u.)10
y = 1.34x - 3.16
R2= 0.99
1
1
3 4 5
Alo
g (
prot
ein1
) (a.
u.)
10
log (ceRNA1 transcriptional level) (a.u.)10
ceRNA1+2ceRNA1 lo
g (
fold
cha
nge)
10
BG= -17.3 (KJ/mol) AGCUUAU AGA AU UU miR-21
UCGAAUA UCU - - - UA AAGGUGA 3’- A A U
5’ -U C CUG G GA
PDCD4
θ =20.351 θ =70.101 θ =120.98 θ =170.751 θ =200.971
θ =217.501 θ =245.511 θ =270.811 θ =290.551 θ =314.021 θ =326.801
miRNA level
3
1.5
2
2.5
0.0
0.2
0.4θ =301 θ =1001 θ =200 1θ =301θ =1001θ =2001
3 4 5 3 4 5 3 4 5
Dox+ExpDox- Exp
Dox+Pre Dox- Pre
1
3
1.5
2
2.5
3 4 5 3 4 5 3 4 5 3 4 5 3 4 5
D
5 ng 10 ng 20 ng 40 ng 60 ng 80 ng
100 ng 120 ng 140 ng 160 ng 180 ng 200 ng
3 4 5
Fig. 2. Effect of miRNA relative abundance onceRNA regulation. (A) Simulated protein1 level asa function of ceRNA1 transcriptional level at in-dicated miRNA levels, respectively. We assumed thatthe transcriptional level of ceRNA2 is proportionalto that of ceRNA1 in simulations and experiments.Red lines designate the predicted protein1 levels ina system with only ceRNA1; blue lines represent thepredicted protein1 levels in a system with bothceRNA1 and ceRNA2. Right panel shows the pre-dicted fold change of protein1 between the systemswith and without ceRNA2. (B) The sequences ofMRE PDCD4 with its binding free energy to miR-21.(C) The ceRNA effect in a miRNA gradient experi-ment. The amounts of iRFP-encoding plasmid DNAused in transfection experiments are indicated onthe top of each panel. Each red or blue circle showsthe median mKate value of 150 FACS cell events ineach bin sorted by the TagBFP value in the absenceor the presence of Dox, respectively; red and bluelines denote the model-fitted mKate values in theabsence and the presence of Dox, respectively. Model-fitted θ values are indicated in each panel. (D) Model-fitted θ values are proportional to the measured iRFPintensities. An R2 value indicates the degree of corre-lation. a.u., arbitrary units. Each data point showsmean ± SD from three independent replicates.
3160 | www.pnas.org/cgi/doi/10.1073/pnas.1413896112 Yuan et al.
Dow
nloa
ded
by g
uest
on
Nov
embe
r 5,
202
1
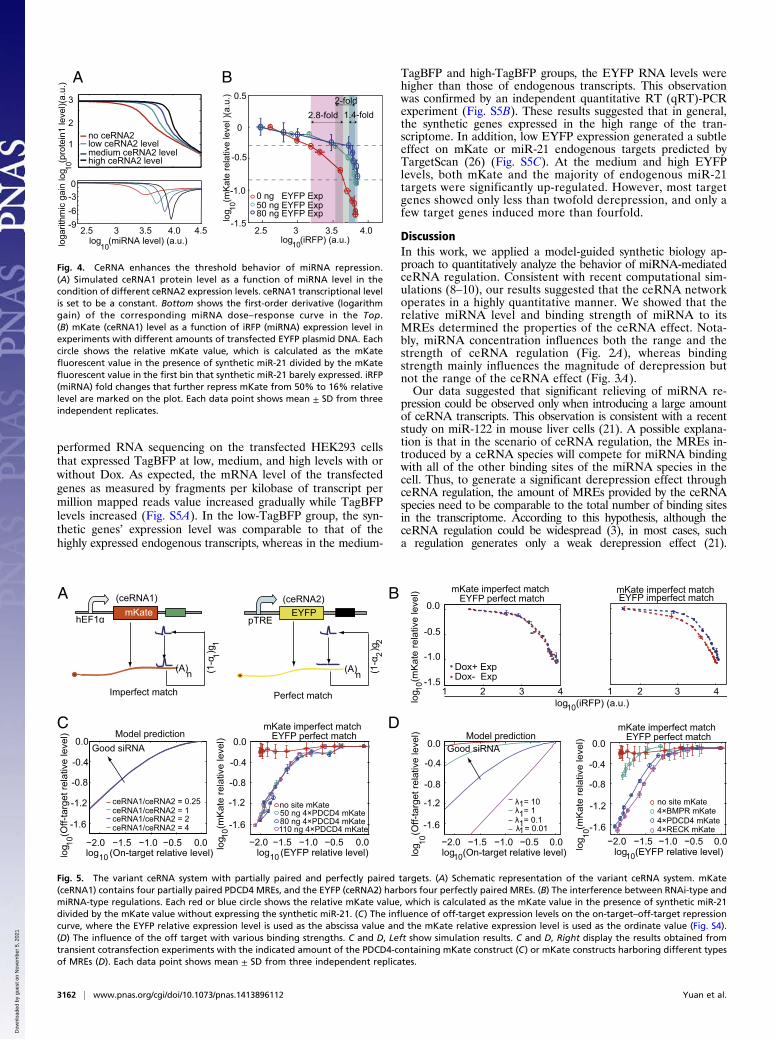
Nonreciprocal Competition Effect Between Partially and Perfectly PairedTargets. The degree of complementarity of a miRNA/siRNA to itstarget site determines whether the RISC enters into either amiRNA-type or a RNAi-type repression pathway (1). To assaywhether these two types of regulations interfere with each otherwhen both regulations share the same miRNA/siRNA species,we constructed a variant ceRNA system that consists of themKate-encoding ceRNA1 with MREs partially paired to miR-21and the EYFP-encoding ceRNA2 with MREs perfectly paired tomiR-21 (Fig. 5A). Interestingly, ceRNA2 that contained partiallypairedMREs caused an obvious change on ceRNA1’s miRNA dose–response curve, whereas introducing ceRNA2 with perfectly com-plementary MREs hardly affected miRNA repression efficacy onceRNA1 (Fig. 5B).It has been shown that partially and perfectly paired targets
have a similar disassociation rate in mammalian cells (22). There-fore, we conducted computational simulations to analyze whetherthe other parameters contribute to the nonreciprocal competitionbetween two types of regulations, including the miRNA–target as-sociation rate k+, the degradation rate g of the miRNA–targetcomplex, and the miRNA loss rate α. Interestingly, our simulationresults suggested that this nonreciprocal competition was mainlycaused by the difference in the parameter α, but not the parameterk+ or g (Fig. S3). By fitting the model to our experimental data, weestimated that the loss rate for miRNA-type repression is about fivetimes higher than that for RNAi-type repression in our experi-mental configuration (SI Materials and Methods).
Deduced Design Principles for Efficient RNAi Repression Based on theVariant ceRNA System. The repression of unintended genes throughpartial pairing is a major obstacle for RNAi applications (23).
Previous studies have suggested that off-target gene expressionlevel (24) and thermodynamic stability (25) of off-target bindingsites can influence the RNAi efficiency. In our variant ceRNAsystem, ceRNA1 mimics the off target repressed through miRNA-type regulation, whereas ceRNA2 can be regarded as the intendedtarget under RNAi-type regulation. As shown in Fig. S4A, therepression efficiency on miRNA-type and RNAi-type targets atdifferent miRNA concentrations varied dramatically. Ideally, wecan use this property to design siRNA with a proper concen-tration that can efficiently repress the on-target RNA but havemuch less effect on the off-target RNA. We introduced the on-target–off-target relative repression plot (Fig. S4) to better rep-resent the down-regulation efficiency of on target and off targetat different miRNA expression levels. A point near the top leftcorner of the plot in Fig. S4B indicates a certain siRNA/miRNAlevel that can efficiently repress the on target without substantialeffect on the off target. As shown in Fig. 5C, changing themKate-encoding off-target levels did not influence the shapeof the relative repression curve, suggesting that althoughincreasing the off-target level might weaken the siRNA effi-ciency at a given siRNA concentration (24), introducing addi-tional siRNAs could completely compensate this effect. Incontrast, altering off-target binding strength strongly influencedthe shape of the relative repression curve (Fig. 5D). This resultindicated that the off target with high-affinity binding sitesweakens siRNA efficiency on the target RNA, and increasingsiRNA concentration severely repressed the off-target RNA withhigh-affinity binding sites.
Impact on Endogenous miR-21 Targets. To study the influence ofthe synthetic ceRNAs on the endogenous miR-21 targets, we
miRNA-ceRNA2 binding strength
log
(pr
otei
n1) (
a.u.
) 10 2.4
2.8
3.2
3.0 4.0 log (ceRNA1 transcriptional level) (a.u.)10
A
log
(fo
ld c
hang
e)10
0.0
0.2
0.4
0.6λ =1.02
λ =10.02
λ =0.12
3.0 4.0 3.0 4.0 3.0 4.0
ceRNA1+2ceRNA1
λ = 10.02 λ = 1.02 λ = 0.12
log (TagBFP) (a.u.)10
3.0 4.0 3.0 4.0 3.0 4.0 3.0 4.0 3.0 4.0 log
(m
Kat
e) (a
.u.)
10
3.0
2.5
3.5 Dox+ ExpDox- ExpDox+ PreDox- Pre
pTRE pTRE pTRE pTRE pTREEYFP EYFP EYFP EYFP EYFP
G= -23.0
G= -17.8
G= -16.7
AGCUUAU A UGA GU A miR-213’- UC UCGAAUA U ACU CA UA
G
GUU -’5
UA AGA
C GAC U
GUBMPR
AGCUUAU- CA A AU UGA miR-213’- UCGAAUA GU U UA
G
5’- U
U UCGUUU UU U
G CU - - - G GU
MTAP
5’- UAGCUUAU AGA AU UU AUCGAAUA UCU UA AA
3’- UUCC A - - - U GG
C CUG G GA
AGCUUAU - - CA ACUG UG GA UCGAAUA GU UGAC - AC CUG 3’-A AA U U -
5’-U G A UU
RECK
G= -15.2
G= -21.8 AGCUUAUC AC GAU UU UCGAAUAG UG CUA AA3’-A AU U A AA
5’-U AG U G GA
PPARA
miR-21
miR-21
miR-21
EYFP EYFP EYFP EYFP EYFP EYFPpTRE pTRE pTRE pTRE pTRE pTRE
B
C D
E F
PDCD4II
log
(1/
λ )
10
0.0
-2.0
-1.0
2
Number of site 10 0 10 110 0.5
y = 1.75x - 1.75R2= 0.99
0.0
-2.0
-1.0
log
(1/
λ )
102
- G14 16 18 20 22 24
y = 0.19x - 4.41R2=0.83
log
(m
Kat
e) (a
.u.)
10
3.0
2.5
3.5
3.0 4.0 3.0 4.0 3.0 4.0 3.0 4.0 3.0 4.0 3.0 4.0 log (TagBFP) (a.u.)10
Dox+ExpDox- ExpDox+PreDox-Pre
0×PDCD4 1×PDCD4 4×PDCD4 8×PDCD4 12×PDCD4
4×BMPR 4×MTAP 4×PDCD4 4×PDCD4II 4×PPARA 4×RECK
(KJ/mol)
(KJ/mol)
(KJ/mol)
(KJ/mol)
(KJ/mol)
Fig. 3. Effect of miRNA–target binding strength on ceRNA regulation. (A) Simulated protein1 level as a function of ceRNA1 transcriptional level in thepresence of ceRNA2 containing MREs with the indicated binding strength. We assumed that the transcriptional level of ceRNA2 is proportional to that ofceRNA1 in simulations and experiments. MiRNA transcriptional level is equal in each panel. Right panel shows the fold change of protein1 between thesystem with ceRNA2 (blue line) and the system without ceRNA2 (red line). (B) The impact of MRE repeat number on the ceRNA effect. The numbers of PDCD4-type MREs are indicated on the schematic of ceRNA2 genes. (C) Model-fitted parameter 1=λ is proportional to the number of MREs. (D) The sequences of fivedifferent types of MREs with various binding free energies to miR-21. (E) The impact of MRE binding free energy on the ceRNA effect. (F) Model-fittedparameter 1=λ is proportional to binding free energy. Annotations for B and E are the same as described in Fig. 2C. Each data point in C and F shows mean ±SD from three independent replicates.
Yuan et al. PNAS | March 10, 2015 | vol. 112 | no. 10 | 3161
SYST
EMSBIOLO
GY
Dow
nloa
ded
by g
uest
on
Nov
embe
r 5,
202
1
performed RNA sequencing on the transfected HEK293 cellsthat expressed TagBFP at low, medium, and high levels with orwithout Dox. As expected, the mRNA level of the transfectedgenes as measured by fragments per kilobase of transcript permillion mapped reads value increased gradually while TagBFPlevels increased (Fig. S5A). In the low-TagBFP group, the syn-thetic genes’ expression level was comparable to that of thehighly expressed endogenous transcripts, whereas in the medium-
TagBFP and high-TagBFP groups, the EYFP RNA levels werehigher than those of endogenous transcripts. This observationwas confirmed by an independent quantitative RT (qRT)-PCRexperiment (Fig. S5B). These results suggested that in general,the synthetic genes expressed in the high range of the tran-scriptome. In addition, low EYFP expression generated a subtleeffect on mKate or miR-21 endogenous targets predicted byTargetScan (26) (Fig. S5C). At the medium and high EYFPlevels, both mKate and the majority of endogenous miR-21targets were significantly up-regulated. However, most targetgenes showed only less than twofold derepression, and only afew target genes induced more than fourfold.
DiscussionIn this work, we applied a model-guided synthetic biology ap-proach to quantitatively analyze the behavior of miRNA-mediatedceRNA regulation. Consistent with recent computational sim-ulations (8–10), our results suggested that the ceRNA networkoperates in a highly quantitative manner. We showed that therelative miRNA level and binding strength of miRNA to itsMREs determined the properties of the ceRNA effect. Nota-bly, miRNA concentration influences both the range and thestrength of ceRNA regulation (Fig. 2A), whereas bindingstrength mainly influences the magnitude of derepression butnot the range of the ceRNA effect (Fig. 3A).Our data suggested that significant relieving of miRNA re-
pression could be observed only when introducing a large amountof ceRNA transcripts. This observation is consistent with a recentstudy on miR-122 in mouse liver cells (21). A possible explana-tion is that in the scenario of ceRNA regulation, the MREs in-troduced by a ceRNA species will compete for miRNA bindingwith all of the other binding sites of the miRNA species in thecell. Thus, to generate a significant derepression effect throughceRNA regulation, the amount of MREs provided by the ceRNAspecies need to be comparable to the total number of binding sitesin the transcriptome. According to this hypothesis, although theceRNA regulation could be widespread (3), in most cases, sucha regulation generates only a weak derepression effect (21).
log 10 (p
rote
in1
leve
l)(a.
u.)
log10
(miRNA level) (a.u.) loga
rithm
ic g
ain
no ceRNA2
medium ceRNA2 level high ceRNA2 level
low ceRNA2 level
log 10
(mK
ate
rela
tive
leve
l )(a
.u.) 0.5
0
-0.5
-1.0
-1.52.5 3 3.5 4.0
log10(iRFP) (a.u.)
A B
2.8-fold2-fold
1.4-fold
0 ng EYFP Exp50 ng EYFP Exp80 ng EYFP Exp
2.5 3 3.5 4.0 4.5
1
2
3
0-3-6-9
Fig. 4. CeRNA enhances the threshold behavior of miRNA repression.(A) Simulated ceRNA1 protein level as a function of miRNA level in thecondition of different ceRNA2 expression levels. ceRNA1 transcriptional levelis set to be a constant. Bottom shows the first-order derivative (logarithmgain) of the corresponding miRNA dose–response curve in the Top.(B) mKate (ceRNA1) level as a function of iRFP (miRNA) expression level inexperiments with different amounts of transfected EYFP plasmid DNA. Eachcircle shows the relative mKate value, which is calculated as the mKatefluorescent value in the presence of synthetic miR-21 divided by the mKatefluorescent value in the first bin that synthetic miR-21 barely expressed. iRFP(miRNA) fold changes that further repress mKate from 50% to 16% relativelevel are marked on the plot. Each data point shows mean ± SD from threeindependent replicates.
Perfect match
EYFP mKatepTRE
A
D
(A)n (1-α
)g 11
Imperfect match
(A)n (1-α
)g 2
2
hEF1α
log (On-target relative level) 10log
(O
ff-ta
rget
rela
tive
leve
l)10
λ = 101λ = 11λ = 0.11λ = 0.01
-0.4
-0.8
-1.2
-1.6
Good siRNA 0.0
log
(m
Kat
e re
lativ
e le
vel)
10
-0.4
-0.8
-1.2
-1.6
0.0
log (EYFP relative level)10
B
log
(m
Kat
e re
lativ
e le
vel)
10
0.0
-0.5
-1.0
-1.5
log (iRFP) (a.u.)10
1 2 3 4 2 3 4
Dox+ ExpDox- Exp
EYFP perfect match
C
−2.0 −1.5 −1.0 −0.5 0.0
log
(O
ff-ta
rget
rela
tive
leve
l)10
log (On-target relative level) 10
Good siRNA-0.4
-0.8
-1.2
-1.6
0.0
log
(m
Kat
e re
lativ
e le
vel)
10
-0.4
-0.8
-1.2
-1.6
0.0
log (EYFP relative level) 10
−2.0 −1.5 −1.0 −0.5 0.0 −2.0 −1.5 −1.0 −0.5 0.0 −2.0 −1.5 −1.0 −0.5 0.0
1
mKate imperfect matchEYFP imperfect matchmKate imperfect match
(ceRNA1) (ceRNA2)
EYFP perfect matchmKate imperfect match
EYFP perfect matchmKate imperfect match
Model prediction Model prediction
no site mKate50 ng 4×PDCD4 mKate80 ng 4×PDCD4 mKate110 ng 4×PDCD4 mKate
ceRNA1/ceRNA2 = 0.25ceRNA1/ceRNA2 = 1ceRNA1/ceRNA2 = 2 ceRNA1/ceRNA2 = 4
no site mKate4×BMPR mKate4×PDCD4 mKate4×RECK mKate1
Fig. 5. The variant ceRNA system with partially paired and perfectly paired targets. (A) Schematic representation of the variant ceRNA system. mKate(ceRNA1) contains four partially paired PDCD4 MREs, and the EYFP (ceRNA2) harbors four perfectly paired MREs. (B) The interference between RNAi-type andmiRNA-type regulations. Each red or blue circle shows the relative mKate value, which is calculated as the mKate value in the presence of synthetic miR-21divided by the mKate value without expressing the synthetic miR-21. (C) The influence of off-target expression levels on the on-target–off-target repressioncurve, where the EYFP relative expression level is used as the abscissa value and the mKate relative expression level is used as the ordinate value (Fig. S4).(D) The influence of the off target with various binding strengths. C and D, Left show simulation results. C and D, Right display the results obtained fromtransient cotransfection experiments with the indicated amount of the PDCD4-containing mKate construct (C) or mKate constructs harboring different typesof MREs (D). Each data point shows mean ± SD from three independent replicates.
3162 | www.pnas.org/cgi/doi/10.1073/pnas.1413896112 Yuan et al.
Dow
nloa
ded
by g
uest
on
Nov
embe
r 5,
202
1
Dramatic ceRNA-mediated derepression may be mainly restrictedto highly expressed long noncoding RNAs, circular RNAs, ortranscripts in specific physiological or disease conditions (27).Each single miRNA species in a mammalian cell could bind to
hundreds or even thousands of target genes, whereas most ofthese targets show only moderate repression by the miRNA. Oneprevailing hypothesis posits that miRNAs “tune” the expressionof most targets but do not primarily act at the gene-to-gene level.However, there are also many examples suggesting that thephenotype generated by knocking out a miRNA species could berecovered by manipulating the expression of only a few targetgenes (28). Thus, an alternative explanation is that there are afew primary target genes heavily regulated by miRNAs, whereasthe other weak targets titrate only the effective concentration ofthe miRNA available to bind these highly regulated targets (29).Our work suggested that the widespread MREs could act asa pool of sponges to sequester shared miRNAs and enhance thethreshold behavior of miRNA repression for targets that haveexpression levels around the threshold, thus increasing the sen-sitivity of miRNA regulation on these primary targets. Duringthe revision of this paper, a theoretical study further supportedthis hypothesis (27).Directly measuring the miRNA loss rate is a great challenge
due to experimental difficulties (30). Although recent in silicostudies have predicted that the loss rate can strongly influenceceRNA effect in the steady state (8, 9), the loss rate for miRNAregulation is largely unknown. Previous studies have estimatedthis parameter ranging from a pure stoichiometric to almost afull catalytic mechanism (8, 9, 22, 30, 31). In this work, we con-structed a variant ceRNA system containing one partially paired(miRNA-type) target and one perfectly paired (RNAi-type) target.We found a nonreciprocal crosstalk between these two types ofregulations in mammalian cells. Our experimental results coupledwith model simulations suggested that the RNAi-type repressionhas a loss rate about five times less than that for miRNA-typerepression, which to our best knowledge has not been reportedpreviously. Furthermore, we deduced principles for designing
siRNAs that can effectively repress an on-target gene with a lessoff-target effect. Interestingly, we found that the influence of ahigh off-target gene expression level can be compensated by in-troducing a suitable amount of siRNAs, whereas off-target genesequence with strong binding strength should be avoided.Endogenous gene regulatory networks are complex and hard
to perturb, which makes it extremely difficult to understand theirbehaviors in a quantitative way. On the other hand, our work andseveral recent publications demonstrated that synthetic genecircuits offer a powerful tool, in a largely controlled manner, tounderstand the fundamental design principles of complex cellularsystems (12, 13, 15). Although the synthetic circuit used in our studycould not be fully isolated from the cellular environment becausenatural miR-21 targets may compete with the synthetic ceRNAs,our model deviation suggested that taking endogenous miR-21targets into account rescales only the parameter θ in our compu-tational model but does not change any of our conclusions (SIMaterials and Methods). In addition, our efforts also shed light onusing such a model for rational design of an effective RNAi ex-periment to reduce the siRNA off-target effect.
Materials and MethodsA detailed description of experimental procedures used in this study (cellculture, plasmid construction, cell transfection, FACS measurement (Fig. S6),RNA extraction, qTR-PCR, RNA sequencing analysis, and data analysis proce-dures) is available in SI Materials and Methods. Lists of primers are available inTable S1. Plasmid concentrations used in experiments are available in Table S2.Fitted model parameters are shown in Table S3.
ACKNOWLEDGMENTS. We thank Lei Wei for technical assistance. This workwas supported by the National Basic Research Program (2012CB316503, toM.Q.Z. and X.W.), the National Natural Science Foundation (61322310 and31371341, to X.W.; and 91019016, to M.Q.Z.), the Foundation for the Authorof National Excellent Doctoral Dissertation (201158, to X.W.) of China,Outstanding Tutors for doctoral dissertations of Science and Technologyproject in Beijing (20111000304, to Y.L.), the Junior “1000 Plan” Program(Z.X.), and a Tsinghua National Laboratory for Information Science and Tech-nology Outstanding Scholar Award (to Z.X.).
1. Hutvágner G, Zamore PD (2002) A microRNA in a multiple-turnover RNAi enzymecomplex. Science 297(5589):2056–2060.
2. Bartel DP (2009) MicroRNAs: Target recognition and regulatory functions. Cell 136(2):215–233.
3. Sumazin P, et al. (2011) An extensive microRNA-mediated network of RNA-RNA in-teractions regulates established oncogenic pathways in glioblastoma. Cell 147(2):370–381.
4. Karreth FA, et al. (2011) In vivo identification of tumor-suppressive PTEN ceRNAs inan oncogenic BRAF-induced mouse model of melanoma. Cell 147(2):382–395.
5. Cesana M, et al. (2011) A long noncoding RNA controls muscle differentiation byfunctioning as a competing endogenous RNA. Cell 147(2):358–369.
6. Hansen TB, et al. (2013) Natural RNA circles function as efficient microRNA sponges.Nature 495(7441):384–388.
7. Tay Y, Rinn J, Pandolfi PP (2014) The multilayered complexity of ceRNA crosstalk andcompetition. Nature 505(7483):344–352.
8. Ala U, et al. (2013) Integrated transcriptional and competitive endogenous RNAnetworks are cross-regulated in permissive molecular environments. Proc Natl AcadSci USA 110(18):7154–7159.
9. Bosia C, Pagnani A, Zecchina R (2013) Modelling competing endogenous RNA net-works. PLoS ONE 8(6):e66609.
10. Figliuzzi M, Marinari E, De Martino A (2013) MicroRNAs as a selective channel ofcommunication between competing RNAs: A steady-state theory. Biophys J 104(5):1203–1213.
11. Xie Z, Wroblewska L, Weiss R (2014) RNAi synthetic logic circuits for sensing, infor-mation processing, and actuation. Encyclopedia of Molecular Cell Biology and Mo-lecular Medicine, ed Meyers RA (Wiley, Hoboken, NJ), pp 1–23.
12. Siciliano V, et al. (2013) MiRNAs confer phenotypic robustness to gene networks bysuppressing biological noise. Nat Commun 4:2364.
13. Bleris L, et al. (2011) Synthetic incoherent feedforward circuits show adaptation tothe amount of their genetic template. Mol Syst Biol 7:519.
14. Xie Z, Wroblewska L, Prochazka L, Weiss R, Benenson Y (2011) Multi-input RNAi-basedlogic circuit for identification of specific cancer cells. Science 333(6047):1307–1311.
15. Mukherji S, et al. (2011) MicroRNAs can generate thresholds in target gene expres-sion. Nat Genet 43(9):854–859.
16. Levine E, Zhang Z, Kuhlman T, Hwa T (2007) Quantitative characteristics of generegulation by small RNA. PLoS Biol 5(9):e229.
17. Landgraf P, et al. (2007) A mammalian microRNA expression atlas based on small RNAlibrary sequencing. Cell 129(7):1401–1414.
18. Kashyap N, Pham B, Xie Z, Bleris L (2013) Transcripts for combined synthetic microRNAand gene delivery. Mol Biosyst 9(7):1919–1925.
19. Chen Y, et al. (2008) MicroRNA-21 down-regulates the expression of tumor sup-pressor PDCD4 in human glioblastoma cell T98G. Cancer Lett 272(2):197–205.
20. Kruger J, Rehmsmeier M (2006) RNAhybrid: microRNA target prediction easy, fast andflexible. Nucleic Acids Res 34(web server issue):W451–W454.
21. Denzler R, Agarwal V, Stefano J, Bartel DP, Stoffel M (2014) Assessing the ceRNAhypothesis with quantitative measurements of miRNA and target abundance. MolCell 54(5):766–776.
22. Wee LM, Flores-Jasso CF, Salomon WE, Zamore PD (2012) Argonaute divides its RNAguide into domains with distinct functions and RNA-binding properties. Cell 151(5):1055–1067.
23. Jackson AL, Linsley PS (2010) Recognizing and avoiding siRNA off-target effectsfor target identification and therapeutic application. Nat Rev Drug Discov 9(1):57–67.
24. Arvey A, Larsson E, Sander C, Leslie CS, Marks DS (2010) Target mRNA abundancedilutes microRNA and siRNA activity. Mol Syst Biol 6:363.
25. Ui-Tei K, Naito Y, Nishi K, Juni A, Saigo K (2008) Thermodynamic stability andWatson-Crick base pairing in the seed duplex are major determinants of the efficiency of thesiRNA-based off-target effect. Nucleic Acids Res 36(22):7100–7109.
26. Garcia DM, et al. (2011) Weak seed-pairing stability and high target-site abundance de-crease the proficiency of lsy-6 and other microRNAs. Nat Struct Mol Biol 18(10):1139–1146.
27. Jens M, Rajewsky N (2015) Competition between target sites of regulators shapespost-transcriptional gene regulation. Nat Rev Genet 16(2):113–126.
28. Ameres SL, Zamore PD (2013) Diversifying microRNA sequence and function. Nat RevMol Cell Biol 14(8):475–488.
29. Seitz H (2009) Redefining microRNA targets. Curr Biol 19(10):870–873.30. Baccarini A, et al. (2011) Kinetic analysis reveals the fate of a microRNA following
target regulation in mammalian cells. Curr Biol 21(5):369–376.31. Haley B, Zamore PD (2004) Kinetic analysis of the RNAi enzyme complex. Nat Struct
Mol Biol 11(7):599–606.
Yuan et al. PNAS | March 10, 2015 | vol. 112 | no. 10 | 3163
SYST
EMSBIOLO
GY
Dow
nloa
ded
by g
uest
on
Nov
embe
r 5,
202
1