Embed Size (px)
Citation preview

Modeling and Analysis of a PEM Fuel cell for Electrical
Applications Adel A. Elbaset
Dept. of Electrical Engineering,
Minia University, Minia, Egypt, 61517
Abstract - This paper presents a proposed three-Dimensional
(3D) computational electrochemical simulation model for simulation and evaluation performance of Polymer Electrolyte
Membrane (PEM) fuel cell. The proposed model is used to predict the output voltage, efficiency, hydrogen supply and study the transient response of PEM power plant when subjected to
variable load connected to it. Additionally, the effects of temperature and current density have been studied. The effectiveness of the proposed model has been verified via
extensive simulation using Matlab program to evaluate how the major operating variables affect the output performances. The results have indicated that the model provides an accurate
representation of the dynamic and static behaviors of the fuel cell power module and guarantee a better analytical performance. On the other hand, the results show that the computer model can
represent characteristics of the power system and it can be used in the study and design of fuel cell for electrical applications under different load conditions and temperatures.
Index Terms – Fuel cell, Modeling, Applications
I. INTRODUCTION
In 1838 Christian Friedrich Schoenbein discovered the
fuel cell effect that marked the beginning of fuel cell research.
Later on William Robert Grove invented the first fuel cell
which started the development of the clean energy converter.
The fuel cell, as a renewable energy source, is one of the most
promising sources of electric power. They can be considered
as green power sources because they are environmentally
clean, have extremely low emission of oxides of nitrogen and
sulfur, have very low noise, and high energy density. In
addition, they can provide energy in a controlled way with
higher efficiency than conventional power plants. The fuel cell
is an electrochemical conversion device. It produces electricity
from fuel (on the anode side) and an oxidant (on the cathode
side), which react in the presence of an electrolyte. The
reactants flow into the cell, and the reaction products flow out
of it, while the electrolyte remains within it. Fuel cells have
recently attracted a great deal of attention with some
promising results in applications ranging from powering small
cellular phones to large power generation in utilities [1-5].
There are several different types of fuel cells depending on the
type of electrolyte materials used [6]. The commonly available
fuel cells can be classified according to temperature, into low-
temperature, medium-temperature, and high temperature fuel
cells. The low-temperature fuel cells include the alkaline fuel
cell, and solid polymer fuel cell or proton exchange membrane
fuel cell (PEMFC). The medium-temperature class has the
phosphoric acid fuel cell. The high-temperature class has the
molten carbonate fuel cell and solid oxide fuel cell [1]. PEM
fuel cells generally operate at lower pressure and lower
temperature with higher power density compared to other
types of fuel cells. Therefore, they are more suitable for
applications in small to medium power levels, such as fuel cell
powered automobiles or micro-grid power applications. The
modeling and analysis of fuel cells is an important part to
simulate and model of the fuel cell since they facilitate a better
understanding of parameters affecting the performance of fuel
cells and fuel cell systems. Several fuel cell models can be
found in the literature. Amphlett et al. [2] used a semi-
empirical approach to estimate the activation loss and to
predict the voltage output of a Ballard Mark V 35-cell stack.
El-Sharkh et al. [3] introduced a dynamic model for a stand-
alone PEM fuel cell power plant. Then, Uzunoglu and Alam
[4] modified the PEM fuel cell model described in [3] in
Matlab and Simulink for stand-alone residential applications.
Zhang et al. [5] presented the effects of the temperature and
the equivalent internal resistance on the output characteristics
of the PEM fuel cells. Baschuk and Li [7] describe detailed
model the PEMFC voltage in terms of the three aspects: 1)
reversible voltage; 2) activation and mass transport loss of the
cathode, and 3) ohmic losses of the electrode, membrane and
flow channel plate. Many fuel cell models have been
developed and reported in literatures but they didn‟t focus on a
3D computational electrochemical simulation model for fuel
cell performance and impact of individual operating
parameters on fuel cell output characteristics. The paper
implements a simple model to present a 3D computational
electrochemical simulation for fuel cell. It also presents
impact of different operating temperatures on the performance
of PEMFC characteristics against situations, like efficiency,
power characteristics and load variations. Using the present
dynamical model, it is also possible the development of
several control techniques for the operation of the PEMFC.
II. MATHEMATICAL MODEL
A. Fuel cell system
The PEMFC considered in the present study is based on
the parameters of a Mark V cell, manufactured by the
Canadian Company Ballard, whose operation and data are
well known in the literature. Under normal operation, a simple
FC typically produces 0.5 V to 0.9 V. For use in energy
generation systems, where a relatively high power is needed,
several cells are connected in series, arranging a stack that can
supply hundreds of kW. The PEMFC primarily consists of
three components: a negatively charged electrode (cathode), a
positively charged electrode (anode), and a PEM. The simple
Proceedings of the 14th International Middle East Power Systems Conference (MEPCON’10), Cairo University, Egypt, December 19-21, 2010, Paper ID 217.
508

chemistry of the fuel cell involves hydrogen being oxidized on
the anode and oxygen reduced on the cathode. Protons (H+)
are transported from the anode to the cathode through the
PEM and electrons are carried to the cathode through an
external circuit. On the cathode, oxygen reacts with protons
and electrons forming water and producing heat. Both the
anode and the cathode contain a catalyst, usually platinum, to
speed up the electrochemical processes. The basic PEMFC
operation is shown in Fig. 1.
Fig. 1: Basic PEM Fuel Cell Operation
The electro-chemical reactions in the PEMFC are shown
below:-
H2(g) 2 H+
(aq) +2e- +waste heat (1)
2H2(aq) +2e-+1/2O2(g) H2O(L) (2)
Here, the waste heat produced in the stack module is removed
through the cooling system.
B. PEMFC Mathematical Model
Useful amount of electrical energy could be obtained from a
fuel cell only when a reasonable current is drawn from it. The
PEMFC performance model developed by [8,9] is used to
simulate the fuel cell stack. Fig. 2 shows the simplified circuit
diagram of the actual PEMFC. The model predicts the voltage
of a single cell at any specified operating conditions. The
voltage of the entire stack is then obtained by multiplying the
single cell potential with the number of cells in the stack.
Vact Vohmic Vcon
H2
O2/Air
Input
Ifc
ENernstOutput
Fig. 2 Simplified circuit diagram of the PEMFC.
The output voltage of a single cell can be obtained as the
result of the following expression [1], [9,10]:
𝑉𝑐𝑒𝑙𝑙 = 𝐸𝑁𝑒𝑟𝑛𝑠𝑡 − 𝑉𝑎𝑐𝑡 − 𝑉𝑜𝑚𝑖𝑐 − 𝑉𝑐𝑜𝑛 (3)
Where;
𝐸𝑁𝑒𝑟𝑛𝑠𝑡 = 1.229 − 0.85 ∗ 10−3 ∗ 𝑇𝑘 − 298.15 + 4.3085 ∗10−5 ∗ 𝑇𝑘 ∗ 𝑙𝑛 𝑝𝐻2
∗ + 0.5 ∗ 𝑙𝑛 𝑝𝑂2∗ (4)
𝐸𝑁𝑒𝑟𝑛𝑠𝑡 : The Nernst voltage or reversible voltage that exists
at no load condition for a given temperature and pressure. and,
𝑉𝑎𝑐𝑡 = − 1
+ 𝑇𝑘 ∗ 2
+ 𝑇𝑘 ∗ 3∗ ln 𝐶𝑂2
∗ + 𝑇𝑘 ∗ 4∗
𝑙𝑛(𝐼𝑓𝑐 ) (5)
𝑉𝑎𝑐𝑡 : The activation voltage drop due to the slowness of
the chemical reactions taking place at electrode surfaces.
Depending on the temperature and operating pressure, type of
electrode, and catalyst used, this region is more or less wide,
and.
𝑉𝑜𝑚𝑖𝑐 = 𝐼𝑓𝑐 ∗ (𝑅𝑐 + 𝑅𝑀) (6)
𝑉𝑜𝑚𝑖𝑐 :The ohmic voltage drop results from the resistance to
the electrons transfer through the collecting plates and carbon
electrodes, and the resistance to the protons transfer through
the solid membrane, and
𝑉𝑐𝑜𝑛 = −𝐵 ∗ 𝑙𝑛 1 −𝐽
𝐽𝑚𝑎𝑥 (7)
𝑉𝑐𝑜𝑛 : The voltage drop resulting from the reduction in
concentration of the reactants gases or, alternatively, from the
transport of mass of oxygen and hydrogen (also known as
concentration over potential).
In the above equations, the parameters are:
Tk : Cell operating Temperature (K),
B (V) : Parametric coefficient, that depends on the cell and
its operation state
𝑝𝐻2∗ : Effective partial pressure of Hydrogen (atm),
𝑝𝑂2∗ : Effective partial pressure of Oxygen (atm),
's : Represent parametric coefficients for each cell model,
whose values are defined based on theoretical equations with
kinetic, thermodynamic and electrochemical foundations [2],
[10-12] .
𝐶𝑂2∗ :Concentration of oxygen in the catalytic interface of the
cathode (mol/cm3), it can be determined by:
𝐶𝑂2∗ =
𝑝𝑂2∗
5.08∗106∗𝐸𝑥𝑝 (−498/𝑇𝑘) (8)
n :Number of exchange protons per mole of reactant,
F : Faraday‟s constant, 96,485 Coulombs.
Ifc : Cell operating current (A), it can be calculated as
follow:-
Ifc = 𝐽 ∗ 𝐴𝑎 (9)
Aa : Active intersection area of fuel cell stack, (cm2)
J : Current density. Typical values for current density are in
the range of 500 to 1500 mA/cm2.
RC : Resistance to the transfer of protons through the
membrane usually considered constant.
𝑅𝑀 : Equivalent resistance of the membrane, It can be
calculated by:-
𝑅𝑀 =𝑀 .∗𝑙
𝐴𝑎 (10)
Where,
M : Specific resistivity of the membrane for the electron
flow (.cm),
l :Thickness of the membrane (cm).
509

The membranes of the type Nafion® considered in this work,
is a registered trademark of Dupont and broadly used in
PEMFC. Dupont uses the following product designations to
denote the thicknessof the membranes Nafion:
Nafion 117: 7 mil (l = 178 µm)
Nafion 115: 5 mil (l = 127 µm)
Nafion 112: 2 mil (l = 51 µm)
The following numeric expression for the resistivity of the
membranes Nafion is used [10]:
𝑀
=181.6 1+0.03∗
ifc𝐴
+0.062∗ 𝑇
303
2∗
ifc𝐴
2.5
−0.634−3∗ ifc𝐴
∗𝐸𝑥𝑝 4.18∗ 𝑇−303
𝑇
(11)
: The membrane water content,
The parameter is an adjustable parameter with a possible
maximum value of 23 and minimum value of 14 [10]. This
parameter is influenced by the preparation procedure of the
membrane and it is a function of relative humidity and
stoichiometry relation of the anode gas. It may have a value
order of 14 under the ideal condition of 100% of relative
humidity. The effective partial pressure for Hydrogen and
Oxygen can be obtained through the following procedure.
First the saturation water vapor pressure for the system at the
temperature of operation, 𝑝𝐻2𝑂𝑠𝑎𝑡 , is calculated by [6,11]:
𝑙𝑜𝑔10 𝑃𝐻2𝑂𝑠𝑎𝑡 = −2.1794 + 0.02953 ∗ 𝑇𝑐 − 9.1837 ∗ 10−5 ∗
𝑇𝑐2 + 1.4454 ∗ 10−7 ∗ 𝑇𝑐
3 (12)
where, Tc :Temperature in Celsius and calculated by:
Tc=Tk-273.15 (13)
The partial pressure 𝑝𝐻2∗ and 𝑝𝑂2
∗ at cathode O2 H2 and anode
are calculated by:
𝑝𝐻2∗ = 0.5
𝑃𝐻2
𝐸𝑥𝑝 1.653∗𝑗
𝑇𝑘1.334
− 𝑃𝐻2𝑂𝑠𝑎𝑡 (14)
𝑝𝑂2∗ =
𝑃𝑎𝑖𝑟
𝐸𝑥𝑝 4.192∗𝑗
𝑇𝑘 − 𝑃𝐻2𝑂
𝑠𝑎𝑡 (15)
Finally, the power output for the fuel cell system can then be
calculated by the equation:
𝑃𝑓𝑐 ,𝑠𝑦𝑠𝑡𝑒𝑚 = 𝑛𝑠𝑡𝑎𝑐𝑘 ∗ 𝑛𝑐𝑒𝑙𝑙 ∗ 𝑉𝑐𝑒𝑙𝑙 ∗ 𝐼𝑓𝑐 (16)
Where, nstack and ncell are number of stacks in the system and
number of cells in a stack, respectively
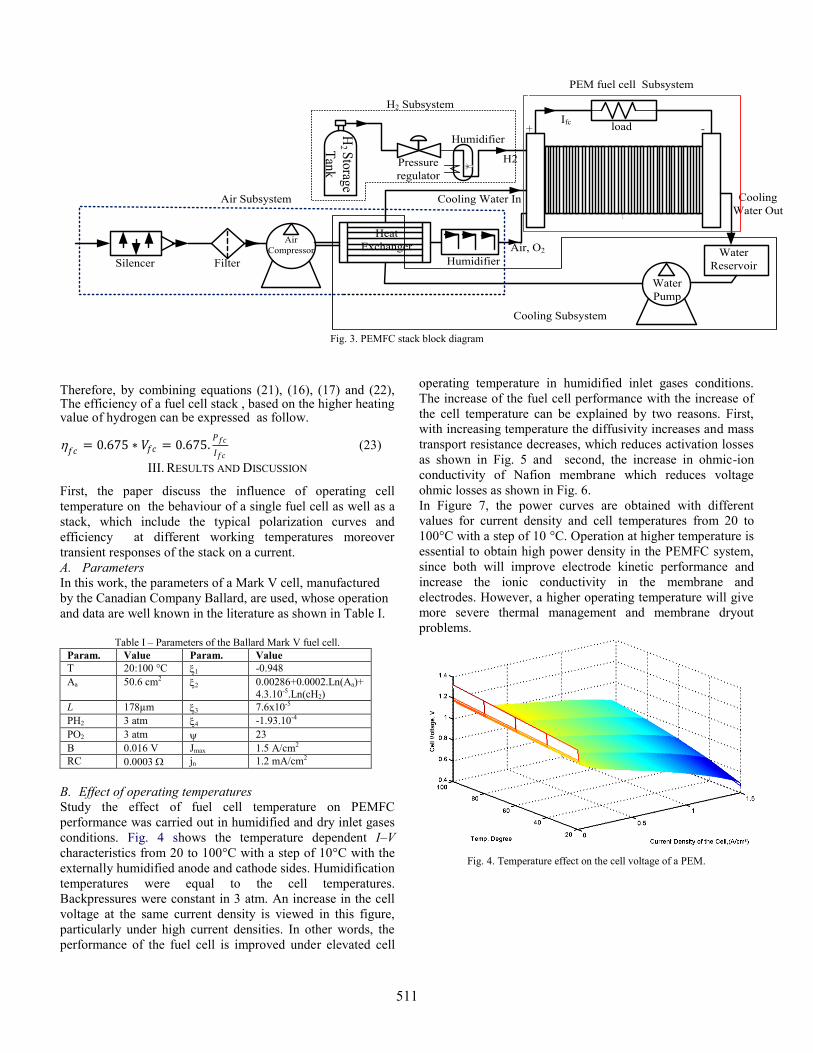
The power system model presented as shown in Fig. 3 consists
of four major subsystems: the PEMFC stack module, the air
compression subsystem, the hydrogen supply subsystem, and
the cooling subsystem. The PEMFC stack module is the heart
of the power system. The air compressor component of the
system module provides pressurized oxygen in the form of air,
to the stack. The pressurized air is cooled down in a heat
exchanger and humidified in a humidifier before being fed to
the stack. Similarly, compressed hydrogen stored on-board is
humidified in a humidifier before feeding to the stack.
Humidification of inlet streams is necessary to prevent
dehydration of the membranes in the fuel cell stack. Non of all
the hydrogen supplied to the fuel cell is consumed by the fuel
cell stack, and therefore the unreacted hydrogen leaving the
stack is recirculated. The purpose of the cooling loop is to
remove the heat produced by the exothermic reaction of
hydrogen and oxygen. The cooling loop consists of a radiator,
cooling pump, radiator fan. The cooling pump directs coolant
through the stack to remove the waste heat via radiator. In
order to produce electricity, a fuel cell must be supplied
continuously with fuel and oxidant. In addition, product water
must be removed continually to insure proper fuel and oxidant
at the catalyst layers to maintain high fuel cell efficiency.
Voltage losses occur in the fuel cell due to activation losses,
ohmic losses, and mass transport limitations. The hydrogen
mass flow rate (g/s) is:-
𝑚 𝐻2,𝑖𝑛 = 𝑆𝐻2.𝑀𝐻2
2.𝐹. 𝑛𝑐𝑒𝑙𝑙 . 𝐼𝑓𝑐 (17)
The oxygen mass flow rate (g/s) is
𝑚 𝑂2,𝑖𝑛 = 𝑆𝑂2 .𝑀𝑂2
4.𝐹. 𝑛𝑐𝑒𝑙𝑙 . 𝐼𝑓𝑐 (18)
The air mass flow rate (g/s) is
𝑚 𝑎𝑖𝑟 ,𝑖𝑛 =𝑆𝑂2 .𝑀𝑎𝑖𝑟
𝑟𝑂2 .4.𝐹. 𝑛𝑐𝑒𝑙𝑙 . 𝐼𝑓𝑐 (19)
In the above equations, the parameters are:
𝑀𝐻2 :Molar mass of hydrogen being 2.016 ×10⁻³𝑘𝑔 𝑚𝑜𝑙𝑒−1,
𝑆𝐻2 :Hydrogen stoichiometric ratio.
𝑀𝑂2:Molar mass of Oxygen being
31.9988 × 10⁻³ 𝑘𝑔 𝑚𝑜𝑙𝑒−1,
𝑆𝑂2 : Oxygen stoichiometric ratio.
𝑀𝑎𝑖𝑟 :Molar mass of air which is equal to 28.85 ×10⁻³ 𝑘𝑔 𝑚𝑜𝑙𝑒−1,
𝑟𝑂2 : Oxygen content in the air, which is equal to 0.2095.
C. Efficiency of PEMFC
Fuel Cell is characterised by a high efficiency and
comparatively small emissions. The fuel cell efficiency is the
ratio between the electrical power output and the fuel input as
shown in Equ. (21).
𝑓𝑐
= 𝐸𝑙𝑒𝑐𝑡𝑟𝑖𝑐𝑎𝑙 𝑃𝑜𝑤𝑒𝑟 𝑂𝑢𝑡𝑝𝑢𝑡 𝑃𝑓𝑐
𝐹𝑢𝑒𝑙 𝐼𝑛𝑝𝑢𝑡 𝐹𝑖𝑛 (21)
Where,
Pfc :The electrical power output of the fuel cell as shown in
Equ. (16).
Fin :The input fuel (in power units). It is a product of fuel
(hydrogen) consumption rate (in g/s) and its energy content,
usually given as enthalpy (H) or higher heating value.
Hydrogen‟s higher heating value is 142,000 J/g.
Hydrogen consumption rate (in g/s) can be calculated from
Equ. (17). Fuel input is therefore:
𝐹𝑖𝑛 = 𝑚 𝐻2,𝑖𝑛 .𝐻 = 𝑆𝐻2.𝑀𝐻2 .𝐻
2.𝐹. 𝑛𝑐𝑒𝑙𝑙 . 𝐼𝑓𝑐 (22)
The expression 𝑀𝐻2 .𝐻
2.𝐹 has a value of 1.482 V. This is called
reversible potential which corresponds to the maximum
possible energy (both electrical and thermal) resulting from
the electrochemical reaction as shown in Equ. (1) and (2).
510
Ifc-+ load
Pressure
regulator
Humidifier
Silencer Filter Humidifier
Air
Compressor
Heat
Exchanger
Cooling
Water Out
H2
Water
Pump
Water
Reservoir
Cooling Water In
Air, O2
H2 S
torag
e
Tan
k
H2 Subsystem
Air Subsystem
Cooling Subsystem
PEM fuel cell Subsystem
Fig. 3. PEMFC stack block diagram
Therefore, by combining equations (21), (16), (17) and (22), The efficiency of a fuel cell stack , based on the higher heating value of hydrogen can be expressed as follow.
𝑓𝑐
= 0.675 ∗ 𝑉𝑓𝑐 = 0.675.𝑃𝑓𝑐
𝐼𝑓𝑐 (23)
III. RESULTS AND DISCUSSION
First, the paper discuss the influence of operating cell
temperature on the behaviour of a single fuel cell as well as a
stack, which include the typical polarization curves and
efficiency at different working temperatures moreover
transient responses of the stack on a current.
A. Parameters
In this work, the parameters of a Mark V cell, manufactured
by the Canadian Company Ballard, are used, whose operation
and data are well known in the literature as shown in Table I.
Table I – Parameters of the Ballard Mark V fuel cell.
Param. Value Param. Value
T 20:100 °C 1 -0.948
Aa 50.6 cm2 2 0.00286+0.0002.Ln(Aa)+
4.3.10-5.Ln(cH2)
L 178µm 3 7.6x10⁻⁵
PH2 3 atm 4 -1.93.10-4
PO2 3 atm 23
B 0.016 V Jmax 1.5 A/cm2
RC 0.0003 jn 1.2 mA/cm2
B. Effect of operating temperatures
Study the effect of fuel cell temperature on PEMFC
performance was carried out in humidified and dry inlet gases
conditions. Fig. 4 shows the temperature dependent I–V
characteristics from 20 to 100°C with a step of 10°C with the
externally humidified anode and cathode sides. Humidification
temperatures were equal to the cell temperatures.
Backpressures were constant in 3 atm. An increase in the cell
voltage at the same current density is viewed in this figure,
particularly under high current densities. In other words, the
performance of the fuel cell is improved under elevated cell
operating temperature in humidified inlet gases conditions.
The increase of the fuel cell performance with the increase of
the cell temperature can be explained by two reasons. First,
with increasing temperature the diffusivity increases and mass
transport resistance decreases, which reduces activation losses
as shown in Fig. 5 and second, the increase in ohmic-ion
conductivity of Nafion membrane which reduces voltage
ohmic losses as shown in Fig. 6.
In Figure 7, the power curves are obtained with different
values for current density and cell temperatures from 20 to
100°C with a step of 10 °C. Operation at higher temperature is
essential to obtain high power density in the PEMFC system,
since both will improve electrode kinetic performance and
increase the ionic conductivity in the membrane and
electrodes. However, a higher operating temperature will give
more severe thermal management and membrane dryout
problems.
Fig. 4. Temperature effect on the cell voltage of a PEM.
511

Fig. 5. Temperature effect on the activation loss of a PEMFC.
Fig. 6. Temperature effect on ohmic voltage loss of a PEMFC.
Fig. 7. Temperature effect on the performance surface of a PEMFC.
In this paper, the fuel cell efficiency is directly proportional to
the cell potential, as shown from equation (23); So, the
efficiency is a function of power and current density moreover
temperature. Figs. 8-10 show the effect of cell voltage, power
and current density with variable operating cell temperature on
the performance surface of a PEMFC. From the presented data
in Figs. 6-8, it can be seen that the potential and efficiency are
higher values for low current densities and power densities.
On the other hand, for higher values of power, the efficiency
and the voltage are smaller values. Therefore, the control
system for PEMFC needs to find the optimum operation point
for the cell. The PEMFC cannot operate with a very high
voltage (and, consequently, high efficiency and low current
density) because the possible output power would be much
reduced, meaning that the cell should be overestimated for this
case. On the other hand, PEMFC cannot also operate with a
very high output current, because, in this case, the potential
and efficiency would be much reduced, besides decreasing the
useful life of the PEMFC. Table II shows the exact values for
maximum power and its corresponding values for efficiency,
Voltage, current density and input hydrogen. A control
system should be established among the demand of the load,
the power supplied from the PEMFC and temperature. For
example, if temperature increases from 60°C to 100 °C for the
same current density at 1.4629 A/cm2, the operating voltage
increase from 0.8190 to 0.8258 V and Power output decease
from 61.2373 to 61.1304 W resulting in high efficiency of
60.44%. Table II Performance of PEMFC
Tem
p.,
°C
Power, W
Efficiency
Voltage, V
Current
density,
A/cm2
mH2, Kg/s
20 39.0543 42.24 % 0.5771 1.3373 2.4869e-005
40 46.2685 46.69 % 0.6379 1.4334 2.6655e-005
60 52.2351 51.64 % 0.7056 1.4629 2.7204e-005
80 57.1154 56.19 % 0.7677 1.4703 2.7342e-005
100 61.2373 59.94 % 0.8190 1.4777 2.7479e-005
Fig. 8. Potential cell and power density effect on the efficiency of a PEMFC.
Fig. 9. Temperature and power density effect on the efficiency of a PEMFC.
512

Fig. 10. Temperature and current density effect on the efficiency of a PEMFC.
C. Transient response
For electrical application use, the fuel cell stack is tested with
the stack supplies 40 A to the load; after 3 seconds of
simulation, the current is increased to 140 A, staying at this
value until the simulation time reaches 7 seconds. Finally, the
load current is decreased again to 40 A, until the end of the
simulation (t = 10 seconds). The results correspond to the use
of a PEMFC stack Ballard Mark V, consisting of an
association of 35 cells, with an active area for each cell of 232
cm2, with a power of 5 kW @ 960 mA/cm2. The other
parameters are the same ones as described in the Table I. The
partial pressures of hydrogen and oxygen influence the
resulting stack voltage. In the simulations that proceed, air was
used as the oxidizer and, then, the partial pressure of oxygen
becomes 0.319 atm.
Fig. 10 depicts variable load current. Fig. 11 shows the voltage
during variation of load. It can be noticed that the values of
the voltage are 35.21 V before the load increase, 31.13 V
during the load pulse and, again, 35.21 V when the current is
decreased. Fig. 12 shows the stack power output during a load
variation. A peak can be observed at the load insertion instant,
with a maximum value of 4.375 kW. When the load is
decreased, the power presents a minimum value of 1.449 kW.
On the other hand, hydrogen supply in kg/s during load
variation presents in Fig. 13. In the real behavior of the fuel
cell in the same operating conditions, there are snapshots
during a transient from load variation.
Fig. 10. Stack current for partial load insertion
Fig. 11. Stack Voltage for load variation
Fig. 12. Stack Power for load variation
The stack efficiency is shown in Fig. 14. The behavior is
similar to the voltage, since these are directly related. The
steady-state values for the efficiency are: 73.641% for a
current of 40 A and 65.10% for a current of 140 A. It can be
noticed that there is a significant reduction in the efficiency
for variations of the demanded current, which should be taken
into consideration when one evaluates a certain system.
Fig. 13. Hydrogen input for load variation
513

Fig. 14. Stack efficiency for load variation
IV. CONCLUSIONS
The paper presents a 3D computational electrochemical
simulation model for PEMFC, on the other hand, it presents a
computer modeling to analysis the performance of a PEMFC
stack in similar circumstances as those commonly in small-
scale power generation systems, such as load variations. From
the results obtained above, the following salient conclusions
can be drawn:
1. Computer model presents in this paper can represent
characteristics of the power system and it can be used in
the study and design of fuel cell for electrical applications
under different load conditions and temperatures.
2. Voltage, power, hydrogen supply and efficiency affect by
load demand and temperature
3. The potential and efficiency are higher values for low
current densities and power densities.
4. Higher values of the power, the efficiency and the voltage
are smaller values. Therefore, the control system for
PEMFC needs to find the optimum operation point for the
cell.
5. If temperature increases from 60°C to 100 °C for the same
current density at 1.4629 A/cm2, the operating voltage
increase from 0.8190 to 0.8258 V and Power output
decrease from 61.2373 to 61.1304 W resulting in high
efficiency of 60.44%.
References [1] J. Larminie, A. Dicks, Fuel Cell Systems Explained, John Wiley & Sons,
Chichester, England,2003.
[2] J.C. Amphlett, et. al., “Performance modeling of the Ballard Mark IV
solid polymer electrolyte fuel cell” I. Mechanistic model development, J. Electrochem. Soc. 142 (1995) 1–8.
[3] M.Y. El-Sharkh, et. al. “A dynamic model for a stand-alone PEM fuel cell
power plant for residential applications” J. Power Sources 138 (2004) 199–204.
[4] M. Uzunoglu, M.S. Alam, “Dynamic modeling, design, and simulation of
a combined PEM fuel cell and ultracapacitor system for stand-alone residential applications”, IEEE Trans. Energy Convers. 21 (2006) 767–
775.
[5] Z. Zhang, X. Huang, J. Jiang, B. Wu, “An improved dynamic model considering effects of temperature and equivalent internal resistance for
PEM fuel cell power models”, J. Power Sources 161 (2006) 1062–1068.
[6] G. Hoogers, Fuel Cell Technology Handbook, CRC Press, 2003. [7] Baschuk J.J. and Li X. 2000, “Modelling of polymer electrolyte
membrane fuel cells with variable degrees of water flooding”, Journal of
Power Sources 86, pp.181- 196.
[8] S. Pasricha, et al, „Comparison and Identification of Static Electrical Terminal Fuel Cell Models‟, IEEE Trans. on Energy Conversion, Vol. 22,
NO. 3, Sept. 2007
[9] J. M. Corrêa,et al., “Simulation of Fuel-Cell Stacks Using a Computer-Controlled Power Rectifier With the Purposes of Actual High-Power
Injection Applications”, IEEE Trans. on Industry Applications, Vol. 39,
NO. 4, July/Aug. 2003 [10] Ronald F. Mann, et al. “Development and application of a generalized
steady-state electrochemical model for a PEM fuel cell,” J. Power
Sources, vol. 86, pp. 173–180, 2000 [11] Colleen Spiegel, “PEM Fuel Cell Modeling and Simulation Using
MATLA” , Book, ISBN: 978-0-12-374259-9, Academic Press, Elsevier
Inc. , 2008 [12] M.G.Santarelli, M.F.Torchio, P.Cochis, “Parameters estimation of a PEM
fuel cell polarization curve and analysis of their behaviour with
temperature”, Journal of Power Sources, vol. 159, pp. 824-835, 2006.
Adel A. Elbaset Mohammed was born in Nag
Hamadi, Qena-Egypt, on October 24, 1971. He
received the B.Sc., M.Sc., and Ph.D. from Faculty of
Engineering, Department of Electrical Engineering,
Minia University, Egypt, in 1995, 2000 and 2006,
respectively. He is a staff member in Faculty of
Engineering, Electrical Engineering Dept., Minia
University, Egypt. His research interests are in the area
of power electronics, power system, neural network, fuzzy systems and
renewable energy, Optimization.
514