Embed Size (px)
Citation preview
Modeling and estimating the Fast Channel
Variations in Wireless Indoor MIMO Channels
Amir Leshem1,3 Eran Gerson2 Nir Tal2 Lior Kravitz2 Zohar Livny2
Abstract
WLAN systems such as 802.11a/g are designed on the premise that the indoor channels, however frequency
selective, vary slowly at Doppler frequencies of around 10Hz at most. In this paper we consider rapid channel
variations on the order of 10 ms and less. We provide experimental evidence that the presence of fluorescent lamps
creates an environment where reflections are being introduced and removed at twice the power line frequency
(120 Hz in the US, 100 Hz in Europe). We propose a modification to an existing channel model that incorporates
this phenomena. This change had been accepted into the IEEE 802.11n channel models. We then propose a
super-resolution technique used to validate the proposed model on measured channels. We present capacity and
instantaneous capacity examples measured in the 5 GHz band using a MIMO system. These capacities are also
subject to the effect of fluorescent lamps. We present the results of an experiment, specifically designed to validate
that the fast channel variations are caused by the existence of fluorescent lamps. We end up by using the proposed
super-resolution analysis for separating the various reflections. This analysis clearly shows the validity of the
proposed model.
keywords: Channel measurement, 5 GHz, indoor radio propagation, wireless LAN, MIMO, IEEE 802.11n.
1School of Engineering, Bar-Ilan University, POB 52900, Ramat Gan, Israel. email: [email protected]. 2Metalink Broadband, Yakum
Business Park, 60972, Yakum, Israel. 3 Circuit and Systems, Faculty of EEMCS, Delft University of Technology. The research has been
done at Metalink Broadband labs. Part of this work has been presented at ICASSP 2004 and was incorporated into the IEEE 802.11n channel
models. N. Tal is currently with TI. L. Kravitz and E. Gerson are currently with Intel.
1
I. INTRODUCTION
The development of WLAN systems for indoor use has shown rapid and accelerated growth in recent
years. IEEE’s latest physical layer (PHY) standards, 802.11a and 802.11g employ OFDM modulation in
order to handle the highly frequency selective indoor channel. For each packet a preamble is transmitted,
which allows the receiver to estimate the channel frequency response and its phase. Customary indoor
wireless channel models [1], [2], [3] use a sequence of impulses to model the reflections from objects
and a ”slow” (f < 10Hz) Doppler spectrum to model their movement [3]. Further studies of MIMO
channels include [4] where it is shown that the statistical model can match measured capacity statistics
for an extensive measurement campaign at 2.4 GHz and [5] which provides good overview of MIMO
channel modeling in wireless communications. However in all these studies it has been assumed that
the Doppler spectrum is the largest contributor to channel variability over time. In office environments,
fluorescent lamps are typically used as the main source for light. These lamps, coupled with magnetic
ballast circuits, flicker, synchronized with the AC power line frequency, to create an interaction with the
incident electromagnetic waves ([6], [7]). It is this interaction, manifested by AM-like modulation of
the received signal that creates a large impact on the channel variability. The objective of this paper is
twofold. First, we propose an extension of the Saleh-Valenzuela indoor propagation model to accommodate
time varying phenomena, including the effect of fluorescent lamps. Second, we propose a super-resolution
techniques for estimating reflections using relatively low sampling rate. This technique enables to perform
channel sounding for relatively long periods of time with moderate storage requirements. This contrasts
previous measurement campaigns e.g., [8] which used very large bandwidth to estimate the fine structure
of the channel composed of delayed echos of the transmitted signal. To that end we use the ESPRIT
method, but other techniques such as MUSIC and MLE can be used as well. Finally, we describe a series
of experiments held in a typical office scenario, which clearly demonstrates the effect of fluorescent lights
on single and multiple antenna systems.
The structure of the paper is as follows: In section II we propose an extension of the Saleh-Valenzuela
2
model to incorporate the effect of fluorescent lamps. In section III we describe a super-resolution technique
to estimate the different paths of the wireless channels. This technique greatly reduces the hardware
requirements for channel analysis. This enables the continuous recording of very long channel measure-
ments. Section V describes capacity analysis of some MIMO channels, presenting the effect of fluorescent
lamps on channel capacity, as well as the MIMO gains. Section VI presents the results of applying the
proposed super-resolution algorithm to the indoor WLAN channel providing experimental confirmation
of the proposed modification of the Saleh-Valenzuela model. We end up with conclusions regarding the
necessity of channel tracking during packet reception in addition to training at the begining of each packet.
II. TIME VARYING INDOOR MODEL
In this section we describe an extension to the Saleh-Valenzuela model [2] which incorporates time
varying effects. The model is specifically appropriate to model indoor channel variations due to fluorescent
lamps, but can also incorporate multiple Doppler shifts from various reflecting objects. The basic Saleh-
Valenzuela model [2] assumes that the indoor radio channel impulse response is composed of a series of
Dirac delta’s
h(t) =K∑
k=1
βkejθkδ(t− τk) (1)
where βk and θk are the amplitude and phase of the k’th reflection respectively. Moreover, the reflections
are composed of a series of clusters of exponentially decaying reflections. It is further suggested that
time variations due to Doppler effect are negligible at signaling time scales. While this is indeed true
for systems operating at rates of 10-100 kbps, this is no longer accurate for OFDM systems, with packet
lengths on the order of 1ms and multichannel (MIMO) modulations of 64-QAM . In such cases channel
estimation needs to be very accurate to a level of 30-40 dB channel-to-estimation-error power ratio.
The non-stationary nature of the channel can degrade precoded MIMO systems relying on CSI at the
transmitter. This implies that the existence of channel variations at time scales of 1ms will require WLAN
indoor receivers to adapt the channel estimation during operation. In this paper we will show that the
3
existence of fluorescent lamps within the indoor environment can cause a periodicity of 100Hz of certain
reflections. Therefore we propose to add to (1) some components jointly modulated by a pulse train with
periodicity of 100 or 120 Hz. The new channel model thus becomes
h(t) =K∑
k=1
βkejθkδ(t− τk) + p(t)
M∑m=1
αmejψmδ(t− τ ′m) (2)
where p(t) is a pulse train
p(t) =∞∑
n=−∞U
(t− nTf
Tf
)(3)
and
U(t) =
1 if 0 ≤ t < 0.5
0 if 0.5 ≤ t ≤ 1
(4)
It is interesting to note that since all the electrical network is typically synchronized to the same phase a
single pulse train is sufficient. The rest of the paper is devoted to experimental validation of this model
and to quantifying its effect on WLAN channels.
III. DELAY SPREAD ESTIMATION
In this section we provide a simplified model for the data, and describe the delay spread model used.
We then describe the method of estimation of the multipath components using super-resolution techniques.
The received baseband signal at antenna i, xi(t) is given by
xi(t) =
p∑j=1
∫hij(τ)sj(t− τ)dτ + ni(t) (5)
where hij is the channel response from transmit antenna j to receive antenna i, sj is the PN sequence
transmitted from antenna j and p is the number of transmit signals. We use almost orthogonal sequences
for the various antennas. Note that hij possibly includes the response of the transmit and receive filters
which need to be removed from the data. This amounts to a simple calibration. The first phase of the
analysis is a correlation of the received signal xi(t) with sj(t) to remove the effect of the other transmit
4
antennas. We have used a PN sequence of period 212−1 (200 µs) and duration of 100 ms. After calibrating
and correlating with the PN sequence we obtain time domain channel impulse response samples
hij(mTs, lT0) : m = 0, . . . , M − 1 and l = 0, . . . , L− 1. (6)
where Ts is the sampling time and T0 is the time difference between consecutive channel estimates. In our
case we have used M = 64 for the length of the channel response, and L = 476, which corresponds to
about 100 ms measurement period. While both k and l are time indices, k describes consecutive channel
response coefficients and Ts = 0.05µs while l describes different channel instantiations separated by
T0 = 200µs. Converting to the frequency domain we obtain that the frequency response of the channel is
given by
hij(k, l) =M−1∑m=0
hij(mTs, lT0)e−2πj km
M (7)
We now turn to a parametric model of the channel response. We assume that the channel consists of a
small number of reflections. The delays of each reflection are constant along a 100 ms period. Moreover
we assume that the channel is non-stationary and the coefficient of each reflection varies along a period
of 100 ms. Therefore the channel model is given by
hij(m, l) =N−1∑n=0
a(n)ij (l)δ(mTs − τn) + nij(m, l) (8)
where n is the estimation noise, N is the number of dominant reflections, and 〈τn : n = 1, . . . , N〉 are
the corresponding delays. a(n)ij (l) are the attenuation and phase of the n’th reflection at the l’th block. We
assume that these coefficients are randomly varying with time. Transforming into frequency domain we
obtain that (8) now becomes
hij(k, l) =N−1∑n=0
a(n)ij (l)e−2πjkτn + nij(k, l) (9)
Therefore the frequency response of each channel is a sum of complex exponentials modulating a
random sequence. This model is well known in the signal processing literature. Stacking the channel
estimates for various values of l will result in a low-rank matrix, with a rank equal to the number of
5
reflections. We can now use any super-resolution technique to separate the reflections and obtain the
time domain behavior of the reflection coefficients. We have chosen to use ESPRIT [9] for this purpose,
mainly due to its computational simplicity. Since the signal to noise ratio is very good we do not expect the
choice of super-resolution method to be important. In a subsequent work we estimate the spatio-temporal
structure using joint angle-delay estimation methods [10], [11]. From this point on, we fix the transmit
and receive antennas and omit the i, j indices. Using matrix notation equation (9) becomes
H = TA + N (10)
where H is a K × L matrix given by
H =
h(0, 0) · · · h(0, L− 1)
......
h(K − 1, 0) · · · h(K − 1, L− 1)
(11)
T is a K ×N Vandermonde matrix
T =
e−2πj0τ0 · · · e−2πj0τN−1
......
e−2πj(K−1)τ0 · · · e−2πj(K−1)τN−1
(12)
A is the N × L reflection coefficients matrix
A =
a(0)(0) · · · a(0)(L− 1)
......
a(N−1)(0) · · · a(N−1)(L− 1)
(13)
and N is a K × L noise matrix with covariance σ2I. Using the Vandermonde structure of T we can
now estimate the delays using ESPRIT [9]. To ensure uniqueness of the solution we would require that
N < 0.5 min (K, L).
IV. THE EFFECT OF FLUORESCENT LAMPS ON WIRELESS LAN CHANNELS
In this section we describe an experiment that was specifically designed to verify the effect of fluorescent
lamps on the wireless channels. The results of this experiment demonstrate that the presence of fluorescent
6
lamps introduces a channel component that is amplitude modulated with a 100 (120) Hz ”modulating”
frequency. This experiment was conducted as part of MIMO channel measurement campaign. The detailed
statistical analysis of the results of this campaign will be reported separately. Nearly 1000 measurements
of wireless channels at the 5GHz band were taken within a typical office space at the Metalink premises
in Yakum, Israel. Each channel measurement consisted of 480 channel matrices, sampled over a period
of 100 ms, resulting in 480,000 WLAN channels. This enabled us to analyze the time variation of the
channel matrix on the very short time scales of a single packet, as well as on various locations and longer
time scales. The details of the measurement setup and equipment as well as the calibration procedures
are described in [12]. As will be shown in the next section, measurements presented a clear 100 Hz
periodicity. To validate the assumption that this periodicity is indeed the result of interaction of the waves
with fluorescent lamps we have conducted the following experiment.
Measurement Setup
A single continuous wave (CW) generator was connected to a directional antenna (antenna gain of
23dBi, 5o aperture). The transmitted signal propagated through a rack of several fluorescent lamps. The
signal was then picked up by an identical antenna, amplified using an LNA and fed into a spectrum
analyzer. Two variations of this setup were tested; one in which the receiving and transmitting antennas
were facing each other, with the fluorescent lights in the LOS path, and another in which the rack was
used as a reflector, and the antennas were placed at an angle. Three scenarios were tested:
1. Fluorescents Off - The signal was transmitted through the fluorescent lights while they were not
lit.
2. Fluorescents On - Without changing the setup, the fluorescent lights were lit.
3. Tin Foil Wrapped Lit Fluorescent - In order to distinguish between radio frequency interference
(RFI) and other types of interactions (e.g. reflection), an ungrounded tin foil was wrapped around
the fluorescent. This conductive tin foil is assumed not to suppress any emissions that might
7
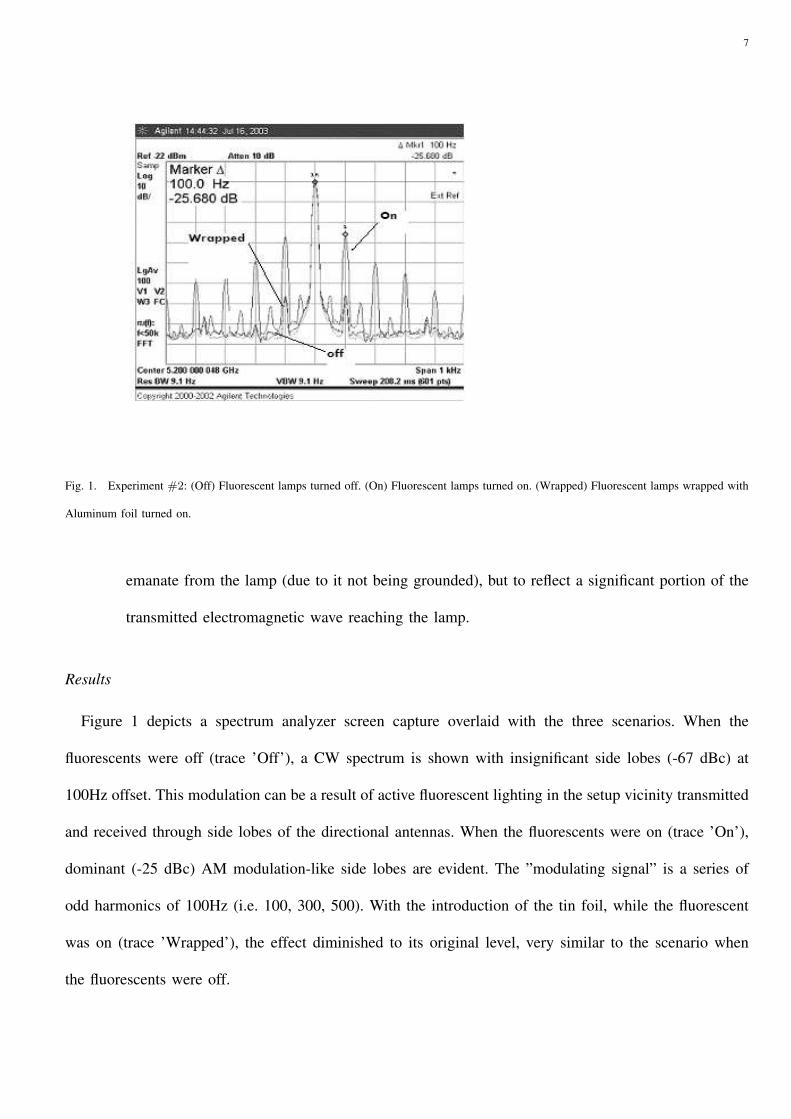
Fig. 1. Experiment #2: (Off) Fluorescent lamps turned off. (On) Fluorescent lamps turned on. (Wrapped) Fluorescent lamps wrapped with
Aluminum foil turned on.
emanate from the lamp (due to it not being grounded), but to reflect a significant portion of the
transmitted electromagnetic wave reaching the lamp.
Results
Figure 1 depicts a spectrum analyzer screen capture overlaid with the three scenarios. When the
fluorescents were off (trace ’Off’), a CW spectrum is shown with insignificant side lobes (-67 dBc) at
100Hz offset. This modulation can be a result of active fluorescent lighting in the setup vicinity transmitted
and received through side lobes of the directional antennas. When the fluorescents were on (trace ’On’),
dominant (-25 dBc) AM modulation-like side lobes are evident. The ”modulating signal” is a series of
odd harmonics of 100Hz (i.e. 100, 300, 500). With the introduction of the tin foil, while the fluorescent
was on (trace ’Wrapped’), the effect diminished to its original level, very similar to the scenario when
the fluorescents were off.
8
Physical Interpretation This experiment provides compelling evidence that the rapid channel variability
shown in experiment #1 is indeed a result of electro-magnetic wave interaction with the fluorescent lamps.
The stark difference between the spectrum of the received signal obtained by turning the fluorescence
on, off and with the tin foil leaves very little doubt as to the origin of the phenomenon. In fact, this
phenomenon, rediscovered by the authors, was reported in the literature as early as 1992 ([6]). With very
similar experiments (at a wider range of frequencies) Melancon et al have reached similar conclusions. Due
to the fact that fluorescent lights become conductive twice every mains AC cycle, they reflect the incident
electromagnetic wave. Between periods of fluorescence, when the voltage across the tube is not enough to
ionize the gas inside the lamp, the fluorescent conductivity dies out, leaving the lamp almost transparent
to incident electromagnetic waves. This phenomenon can be envisioned as metal shutters being drawn and
retracted at a certain frequency, thereby changing the electromagnetic reflective multi-path scenario at a
rate of twice the AC power cycle (100Hz Europe, 120Hz US). Having the ungrounded tin foil wrapped
around the fluorescent lamps eliminates the phenomenon due to the fact that most of the time varying
fluorescence reflection is prevented by the outer conductive surface. If this modulation was somehow
caused by electromagnetic waves emitted from the fluorescent lamp, the effect should have remained at
comparable levels with the ”on” scenario. In [7] Vogel et al have computed the conductivity of fluorescent
lights at both their states using ionized gas theory. It has been shown that for the standard GE T12 lamp at
frequencies above 1GHz the effective dielectric constant exceeds 82.0 (lossy conductor) during the ”on”
state and is very close to 1.0 during the ”off” state. This effectively means that the fluorescent lamp will
reflect most of the incident electromagnetic wave in the ”on” state, and become transparent to it during
the ”off” state. Following our initial reporting of the fluorescent lamps effect [13] Gilbert et al [14] have
verified these results as part of the IEEE 802.11 High Throughput Study Group (HTSG).
V. CAPACITY ANALYSIS
In this section we present some examples of the effect of the rapid channel variability due to fluorescent
lamps on the channel capacity. We assume identical transmit power at all antennas as is common in
9
MIMO WLAN systems, and average over the fading process across frequencies. As is well known the
instantaneous capacity of an OFDM MIMO channel for a given realization of the fading process at a
given frequency is given by
C(f) = log
(det
(I +
P
Tσ2H(f)H∗(f)
))(14)
where H is the channel matrix, P is the total transmit power, σ2 is the noise power and T is the number
of transmit antennas. The total capacity is given by averaging across frequencies obtaining
C =
∫
f
log
(det
(I +
P
Tσ2H(f)H∗(f)
))df (15)
Practically the integral is replaced by a Riemann sum with frequency division corresponding to the number
of frequency bins used in the modulation. To evaluate capacities based on the measured channels we have
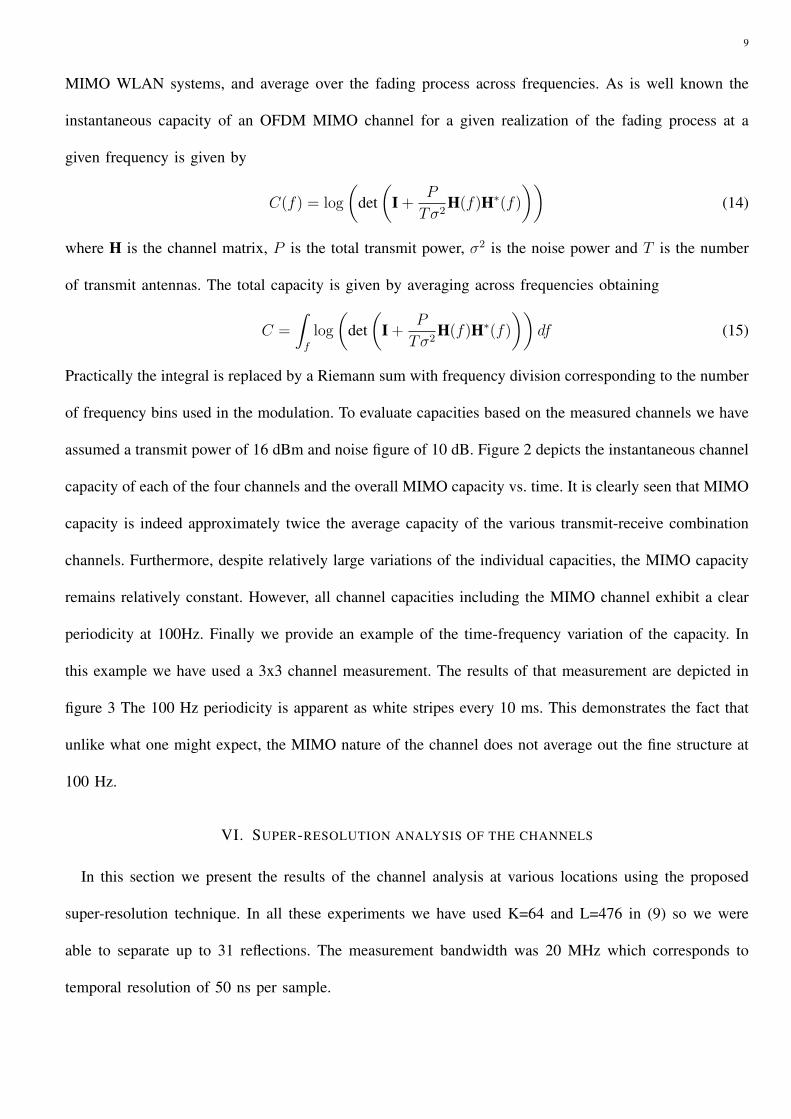
assumed a transmit power of 16 dBm and noise figure of 10 dB. Figure 2 depicts the instantaneous channel
capacity of each of the four channels and the overall MIMO capacity vs. time. It is clearly seen that MIMO
capacity is indeed approximately twice the average capacity of the various transmit-receive combination
channels. Furthermore, despite relatively large variations of the individual capacities, the MIMO capacity
remains relatively constant. However, all channel capacities including the MIMO channel exhibit a clear
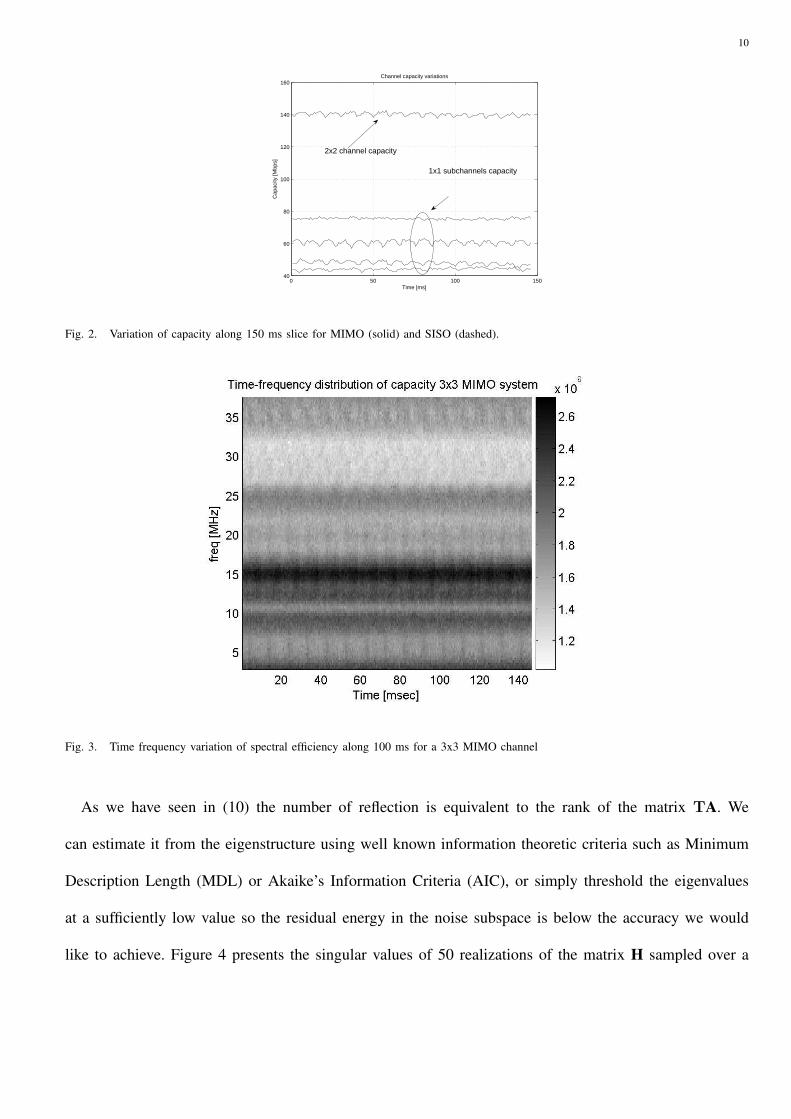
periodicity at 100Hz. Finally we provide an example of the time-frequency variation of the capacity. In
this example we have used a 3x3 channel measurement. The results of that measurement are depicted in
figure 3 The 100 Hz periodicity is apparent as white stripes every 10 ms. This demonstrates the fact that
unlike what one might expect, the MIMO nature of the channel does not average out the fine structure at
100 Hz.
VI. SUPER-RESOLUTION ANALYSIS OF THE CHANNELS
In this section we present the results of the channel analysis at various locations using the proposed
super-resolution technique. In all these experiments we have used K=64 and L=476 in (9) so we were
able to separate up to 31 reflections. The measurement bandwidth was 20 MHz which corresponds to
temporal resolution of 50 ns per sample.
10
0 50 100 15040
60
80
100
120
140
160
Time [ms]
Cap
acity
[Mbp
s]
Channel capacity variations
2x2 channel capacity
1x1 subchannels capacity
Fig. 2. Variation of capacity along 150 ms slice for MIMO (solid) and SISO (dashed).
Fig. 3. Time frequency variation of spectral efficiency along 100 ms for a 3x3 MIMO channel
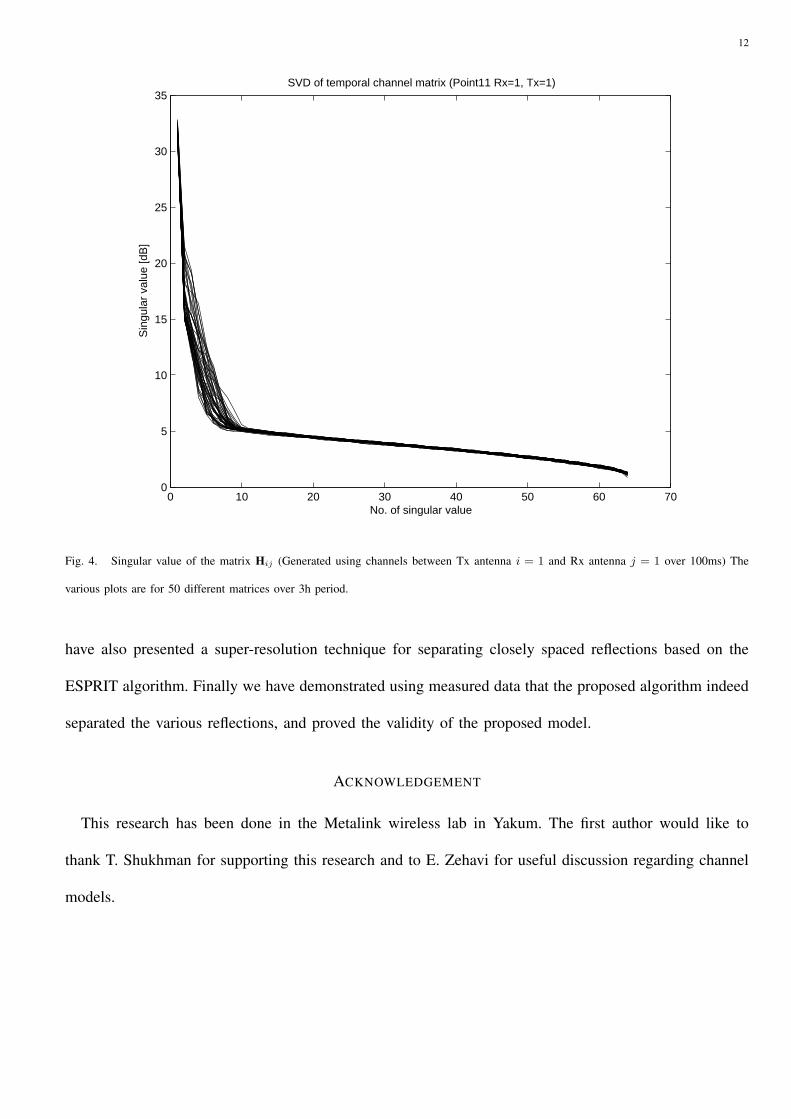
As we have seen in (10) the number of reflection is equivalent to the rank of the matrix TA. We
can estimate it from the eigenstructure using well known information theoretic criteria such as Minimum
Description Length (MDL) or Akaike’s Information Criteria (AIC), or simply threshold the eigenvalues
at a sufficiently low value so the residual energy in the noise subspace is below the accuracy we would
like to achieve. Figure 4 presents the singular values of 50 realizations of the matrix H sampled over a
11
3h period from transmit antenna 1 to receive antenna 1 in a non-line of sight experiment. Each realization
used 500 channel frequency responses sampled over a period of 100ms. We can clearly see that the largest
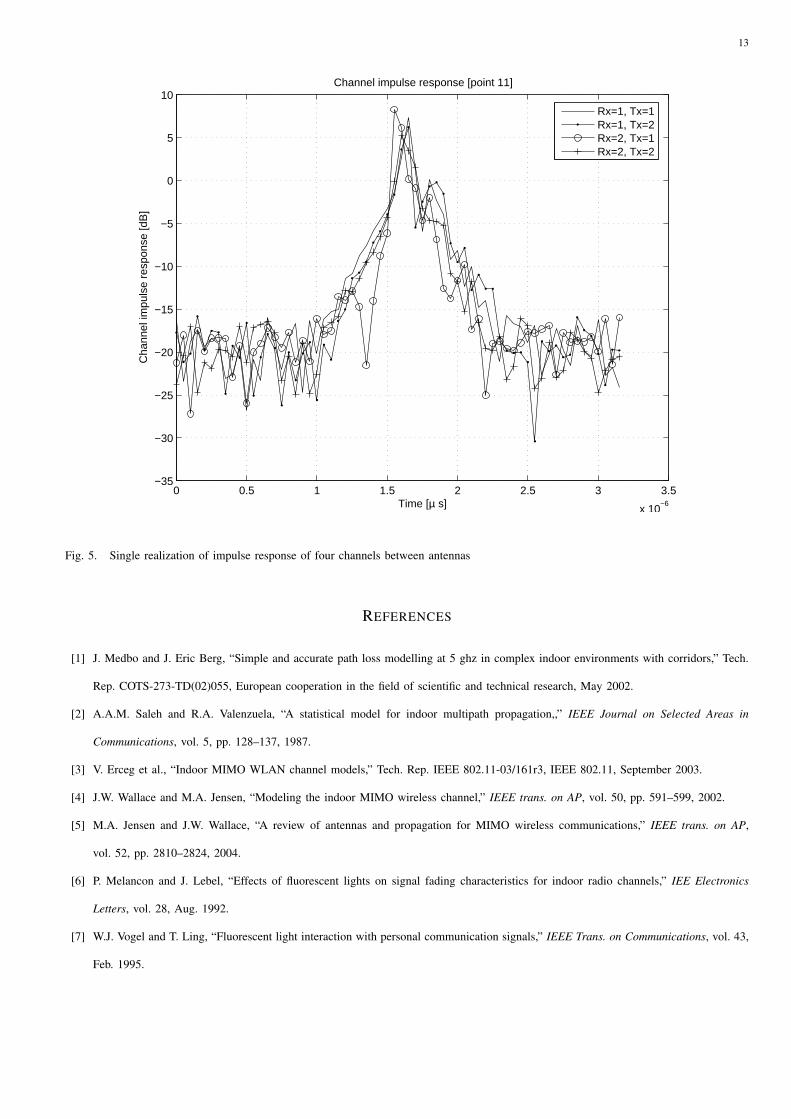
8 singular values dominate all the others. Similar results were obtained for all antennas. Figure 5 depicts
single realization of the channels between each transmit antenna and receive antenna. We can see that
the 8 different reflections cannot be clearly identified without using super-resolution techniques. Using
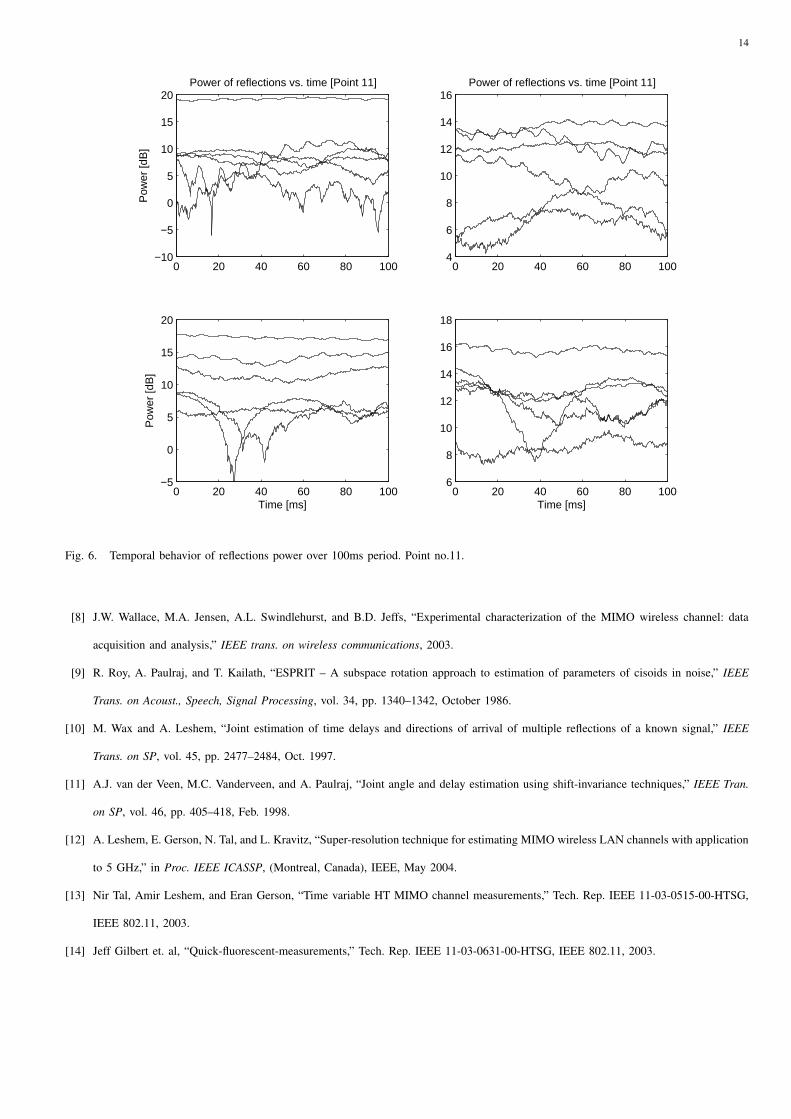
the estimated matrix H we have estimated the delays and the coefficients. Figure 6 presents the temporal
amplitude variations of the coefficients of each delay estimated for all channels between a transmit and
receive antennas using 500 channel responses measured over a 100ms period as measured at point no. 11
(far NLOS). It is interesting to note that some of the reflections present 100 Hz periodicity, corresponding
to the presence of fluorescent lamps in the building. As we have shown in previous section (see also [13])
this leads to 100Hz periodicity (120Hz when the AC line frequency is 60 Hz) of the channel coefficients.
Note also the slow variations due to Doppler spread (5-10 Hz) exist in some of the reflections.
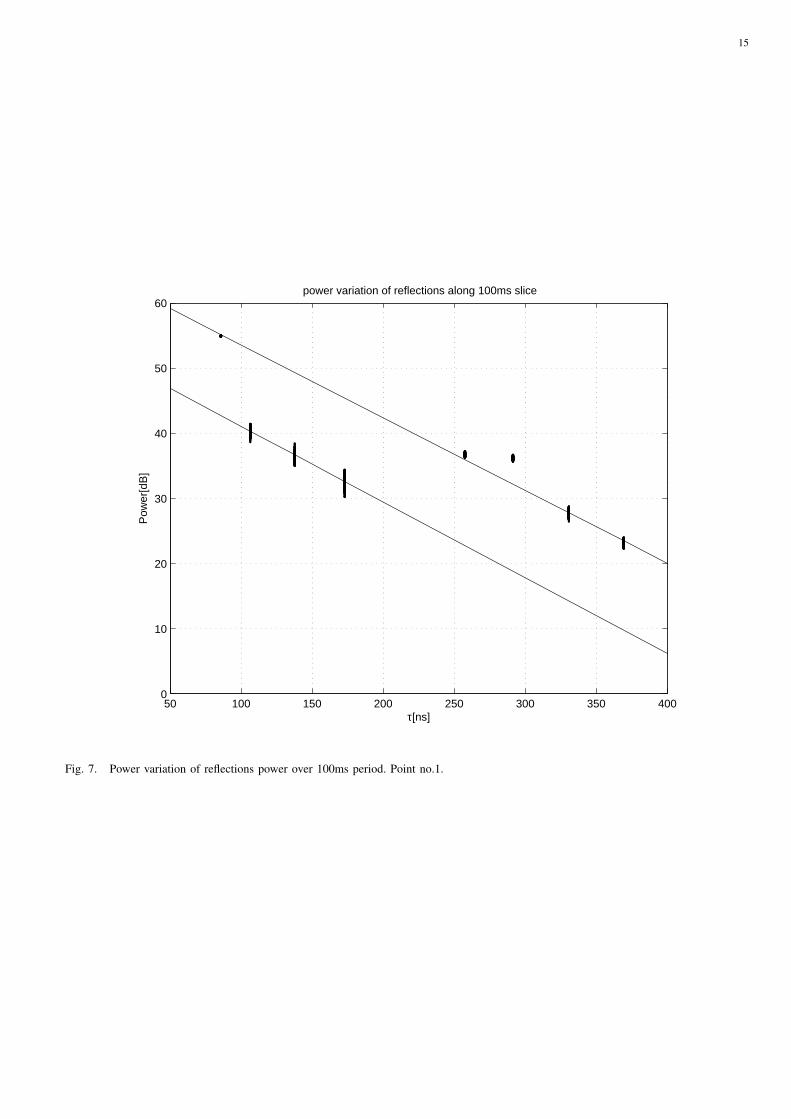
Figure 7 presents the power of the reflections in dB as a function of the delays. We can clearly see the
existence of exponentially decaying clusters corresponding to straight lines. This fits the well-known Saleh-
Valenzuela channel model [2] thus providing another verification of the success of the super resolution
technique to resolve the multipath.
VII. CONCLUSIONS
In this paper we proposed a model for the fast time variations of the indoor wireless channel. We have
demonstrated that the effect of fluorescent lamps on MIMO WLAN channels at the 5GHz frequency band
is the main cause for fast variations. The effect consists of a set of harmonics of 100 Hz modulating
some of the channel coefficients. While this time variation is small on average we have demonstrated
that for high data rates (high order modulations) channel tracking is necessary. We have shown that
not only the single channel structure is modulated, but also the channel capacity as well as the channel
matrix eigen-structure present a similar effect. Following the analysis presented in this paper current
IEEE 802.11n HTSG channel model has adopted the fluorescent effect as part of the channel model. We
12
0 10 20 30 40 50 60 700
5
10
15
20
25
30
35SVD of temporal channel matrix (Point11 Rx=1, Tx=1)
No. of singular value
Sin
gula
r va
lue
[dB
]
Fig. 4. Singular value of the matrix Hij (Generated using channels between Tx antenna i = 1 and Rx antenna j = 1 over 100ms) The
various plots are for 50 different matrices over 3h period.
have also presented a super-resolution technique for separating closely spaced reflections based on the
ESPRIT algorithm. Finally we have demonstrated using measured data that the proposed algorithm indeed
separated the various reflections, and proved the validity of the proposed model.
ACKNOWLEDGEMENT
This research has been done in the Metalink wireless lab in Yakum. The first author would like to
thank T. Shukhman for supporting this research and to E. Zehavi for useful discussion regarding channel
models.
13
0 0.5 1 1.5 2 2.5 3 3.5
x 10−6
−35
−30
−25
−20
−15
−10
−5
0
5
10
Time [µ s]
Cha
nnel
impu
lse
resp
onse
[dB
]
Channel impulse response [point 11]
Rx=1, Tx=1Rx=1, Tx=2Rx=2, Tx=1Rx=2, Tx=2
Fig. 5. Single realization of impulse response of four channels between antennas
REFERENCES
[1] J. Medbo and J. Eric Berg, “Simple and accurate path loss modelling at 5 ghz in complex indoor environments with corridors,” Tech.
Rep. COTS-273-TD(02)055, European cooperation in the field of scientific and technical research, May 2002.
[2] A.A.M. Saleh and R.A. Valenzuela, “A statistical model for indoor multipath propagation,,” IEEE Journal on Selected Areas in
Communications, vol. 5, pp. 128–137, 1987.
[3] V. Erceg et al., “Indoor MIMO WLAN channel models,” Tech. Rep. IEEE 802.11-03/161r3, IEEE 802.11, September 2003.
[4] J.W. Wallace and M.A. Jensen, “Modeling the indoor MIMO wireless channel,” IEEE trans. on AP, vol. 50, pp. 591–599, 2002.
[5] M.A. Jensen and J.W. Wallace, “A review of antennas and propagation for MIMO wireless communications,” IEEE trans. on AP,
vol. 52, pp. 2810–2824, 2004.
[6] P. Melancon and J. Lebel, “Effects of fluorescent lights on signal fading characteristics for indoor radio channels,” IEE Electronics
Letters, vol. 28, Aug. 1992.
[7] W.J. Vogel and T. Ling, “Fluorescent light interaction with personal communication signals,” IEEE Trans. on Communications, vol. 43,
Feb. 1995.
14
0 20 40 60 80 100−10
−5
0
5
10
15
20Power of reflections vs. time [Point 11]
Pow
er [d
B]
0 20 40 60 80 1004
6
8
10
12
14
16Power of reflections vs. time [Point 11]
0 20 40 60 80 100−5
0
5
10
15
20
Time [ms]
Pow
er [d
B]
0 20 40 60 80 1006
8
10
12
14
16
18
Time [ms]
Fig. 6. Temporal behavior of reflections power over 100ms period. Point no.11.
[8] J.W. Wallace, M.A. Jensen, A.L. Swindlehurst, and B.D. Jeffs, “Experimental characterization of the MIMO wireless channel: data
acquisition and analysis,” IEEE trans. on wireless communications, 2003.
[9] R. Roy, A. Paulraj, and T. Kailath, “ESPRIT – A subspace rotation approach to estimation of parameters of cisoids in noise,” IEEE
Trans. on Acoust., Speech, Signal Processing, vol. 34, pp. 1340–1342, October 1986.
[10] M. Wax and A. Leshem, “Joint estimation of time delays and directions of arrival of multiple reflections of a known signal,” IEEE
Trans. on SP, vol. 45, pp. 2477–2484, Oct. 1997.
[11] A.J. van der Veen, M.C. Vanderveen, and A. Paulraj, “Joint angle and delay estimation using shift-invariance techniques,” IEEE Tran.
on SP, vol. 46, pp. 405–418, Feb. 1998.
[12] A. Leshem, E. Gerson, N. Tal, and L. Kravitz, “Super-resolution technique for estimating MIMO wireless LAN channels with application
to 5 GHz,” in Proc. IEEE ICASSP, (Montreal, Canada), IEEE, May 2004.
[13] Nir Tal, Amir Leshem, and Eran Gerson, “Time variable HT MIMO channel measurements,” Tech. Rep. IEEE 11-03-0515-00-HTSG,
IEEE 802.11, 2003.
[14] Jeff Gilbert et. al, “Quick-fluorescent-measurements,” Tech. Rep. IEEE 11-03-0631-00-HTSG, IEEE 802.11, 2003.
15
50 100 150 200 250 300 350 4000
10
20
30
40
50
60power variation of reflections along 100ms slice
τ[ns]
Pow
er[d
B]
Fig. 7. Power variation of reflections power over 100ms period. Point no.1.


![Estimating the Preamble and Carrier Offset in Asymmetric ... · (DSL), wireless LAN ... long preamble) bandwidth of channel: 2.4GHz channel model: AWGN channel, ℎ = [1 0] ... supportive](https://img.pdfslide.net/doc/110x75/5b1ef1577f8b9a397f8cb9ad/estimating-the-preamble-and-carrier-offset-in-asymmetric-dsl-wireless.jpg)