Embed Size (px)
Citation preview
AAS 07-004
Americ3wstronaut1ca1 Society \I
Modeling and Parameter Estimation of Spacecraft Fuel Slosh with
Diaphragms Using Pendulum Analogs Yadira Chatman, Keith Schlee, Sathya Gangadharan, and James Ristow
Embry-Riddle Aeronautical University, Daytona Beach, FL 32114
James Sudermann and Charles Walker NASA, Kennedy Space Center, FL 32899
Carl Hubert Hubert Astronautics, Inc., Purcellville, VA 20134
30th ANNUAL AAS GUIDANCE AND CONTROL CONFERENCE
February 3-7. 2007 Sponsored by Breckenridge. Colorado Rocky Mountain Section
https://ntrs.nasa.gov/search.jsp?R=20130012950 2020-03-14T20:45:06+00:00Z
AAS Publications Office, P.O. Box 28130 - San Diego, California 92198
AAS 07-004
MODELING AND PARAMETER ESTIMATION OF SPACECRAFT FUEL SLOSH WITH
DIAPHRAGMS USING PENDULUM ANALOGS
Yadira Chatman*, Sathya Gangadharant And James Ristow Embry-Riddle Aeronautical University, Daytona Beach, FL 32114
Keith Schlee Analex Corporation, Kennedy Space Center, FL 32899
James Sudermann*ã and Charles Walkertt NASA, Kennedy Space Center, FL 32899
Carl Hubert Hubert Astronautics, Inc., Purceliville, VA 20134
Prediction and control of liquid slosh in moving containers is an important consideration in the design of spacecraft and launch vehicle control systems. Even with modern computing systems, CFD type simulations are not fast enough to allow for large scale Monte Carlo analyses of spacecraft and launch vehicle dynamic behavior with slosh included. It is still desirable to use some type of simplified mechanical analog for the slosh to shorten computation time. Analytic determination of the slosh analog parameters has met with mixed success and is made even more difficult by the introduction of propellant management devices such as elastomeric diaphragms. By subjecting full-sized fuel tanks with actual flight fuel loads to motion similar to that experienced in flight and measuring the forces experienced by the tanks, these parameters can be determined experimentally. Currently, the identification of the model parameters is a laborious trial-and-error process in which the hand-derived equations of motion for the mechanical analog are evaluated and their results compared with the experimental results. This paper will describe efforts by the university component of a team comprised of NASA's Launch Services Program, Embry Riddle Aeronautical University, Southwest Research Institute and Hubert Astronautics to improve the accuracy and efficiency of modeling techniques used to predict these types of motions. Of particular interest is the effect of diaphragms and bladders on the slosh dynamics and how best to model these devices. The previous research was an effort to automate the process of slosh model parameter identification using a MATLAB/SimMechanics-based computer simulation. These results are the first step in applying the same computer estimation to a full-size tank and vehicle propulsion system. The introduction of diaphragms to this experimental set-up will aid in a better and more complete prediction of fuel slosh characteristics and behavior. Automating
Graduate Student, Department of Aerospace Engineering Professor, Department of Engineering Sciences Undergraduate Student, Department of Aerospace Engineering
* Controls Analyst, Mission Analysis Branch , Expendable Launch Vehicle Division Controls Analyst, Mission Analysis Branch , Expendable Launch Vehicle Division Lead Controls Analyst, Mission Analysis Branch, Expendable Launch Vehicle Division Consultant in Spacecraft Dynamics and Control
the parameter identification process will save time and thus allow earlier identification of potential vehicle performance problems.
INTRODUCTION
Fuel slosh in spacecraft is a concern in at least two types of scenarios. Spacecraft fuel slosh can interact with the launch vehicle control system and cause unpredicted motions and reactions. Likewise, spacecraft control systems and sensors can be influenced by sloshing fuel or by fuel simply not being in the expected cg location. Slosh effects can be categorized in two additional ways. The first deals with slosh caused by launch vehicle and spacecraft maneuvers and, if induced under an acceleration field, is usually some type of bulk fluid motion with a periodic component. The second is slosh induced by interaction with a spinning or rotating spacecraft. This type of slosh can be bulk fluid motion and/or subsurface wave motion (currents) and almost always is periodic because of the spin. In either case, an unpredicted coupled resonance between the vehicle or spacecraft and the on board fuel can have mission threatening affects. For example, missions have been lost because of uncontrolled growth in nutation driven by resonant fuel slosh.
This paper will describe efforts by the university component of a team comprised of NASA's Launch Services Program, Embry Riddle Aeronautical University, Southwest Research Institute and Hubert Astronautics to improve the accuracy and efficiency of modeling techniques used to predict these types of motions. Of particular interest is the effect of diaphragms and bladders on the slosh dynamics and how best to model these devices.
Historically, it has been possible to predict free-surface lateral slosh of bulk fluid motion with a great deal of confidence and accuracy using codes such as the Lomens and the Dodge programs. 2 The difficulty increases and the confidence will diminish when a diaphragm or a bladder is introduced into a. fuel tank. These devices are used to separate the fuel from the gas ullage (usually pressurized) so as to ensure a pure liquid flow to the spacecraft engines. They have become very popular with spacecraft designers since they can guarantee smooth engine performance in any orientation and gravity field (or lack thereof). They also do a very good job of ensuring that a very high percentage of the available fuel is utilized. Both the Lomens and Dodge codes assume a pendulum as a mechanical analog for the slosh motion. We have become interested in additional types of mechanical analogs (such as rotors and suspended masses) and are working to develop a more generalized method of modeling fuel motion.
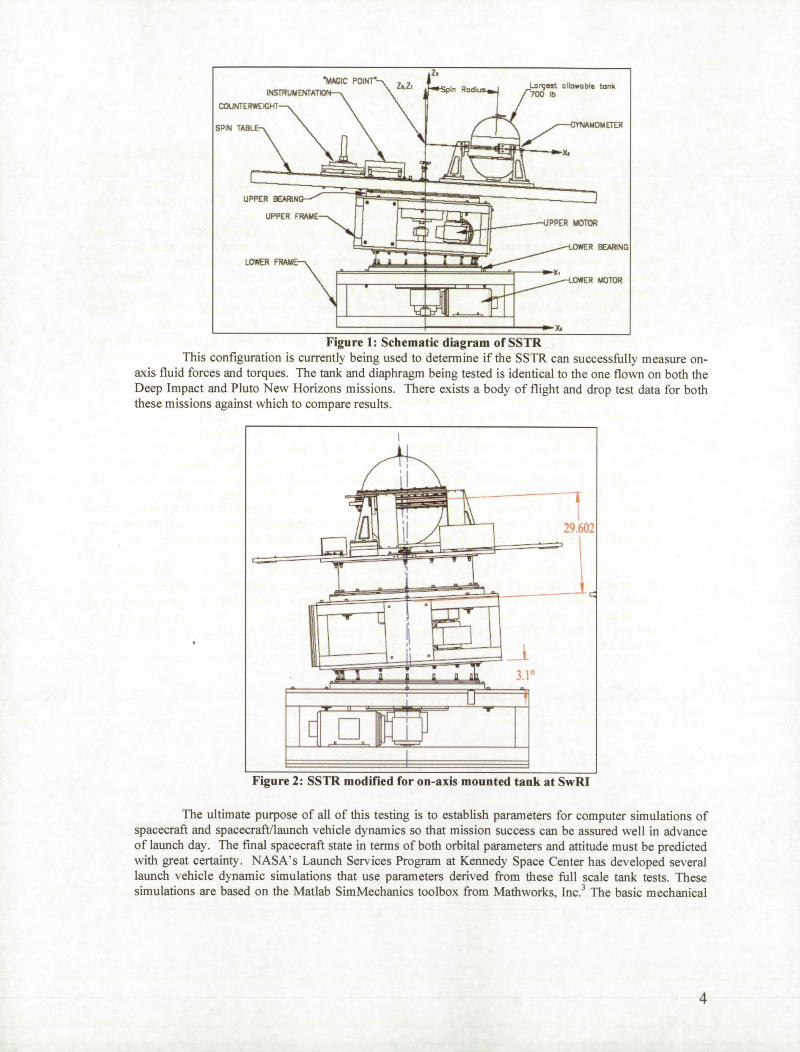
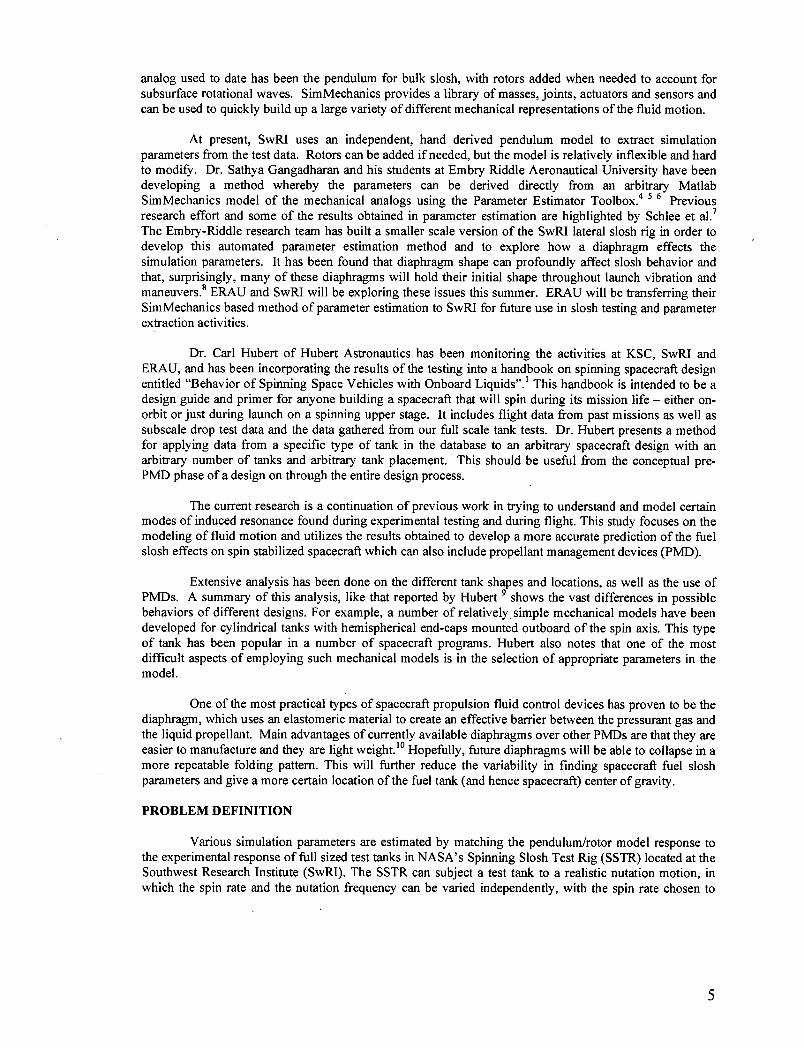
Activities to date at SwRI have been primarily concerned with testing of full scale tanks with diaphragms and bladders. They have performed fluid dynamics measurements on tanks used on the Genesis, Contour, Stereo and Dawn missions. Testing has been done to understand and measure the forces and torques generated by the fuel in both spinning and lateral excitation modes. Test rigs have been developed for both modes. The test rig (Figure 1) for the spinning mode Spinning Slosh Test Rig (SSTR) has recently been modified to allow testing of centerline mounted tanks (Figure 2).
3
M.&GIC PoINr
INSTRUMENTA 700 lb
cOUNTERWEIGHT
Spir RodiLrc5t lIwbl tank
SPIN TAB
x.
UPPER BE.AMN • a
UPPER FRAMEPPER MOTOR
• aR ARING
LOWER FRAME
OWER MOTOR
Figure 1: Schematic diagram of SSTR This configuration is currently being used to determine if the SSTR can successfully measure on-
axis fluid forces and torques. The tank and diaphragm being tested is identical to the one flown on both the Deep Impact and Pluto New Horizons missions. There exists a body of flight and drop test data for both these missions against which to compare results.
Figure 2: SS 1K modified for on-axis mounted tank at SwRI
The ultimate purpose of all of this testing is to establish parameters for computer simulations of spacecraft and spacecraftllaunch vehicle dynamics so that mission success can be assured well in advance of launch day. The final spacecraft state in terms of both orbital parameters and attitude must be predicted with great certainty. NASA's Launch Services Program at Kennedy Space Center has developed several launch vehicle dynamic simulations that use parameters derived from these full scale tank tests. These simulations are based on the Matlab SimMechanics toolbox from Mathworks, Inc. 3 The basic mechanical
4
analog used to date has been the pendulum for bulk slosh, with rotors added when needed to account for subsurface rotational waves. SimMechanics provides a library of masses, joints, actuators and sensors and can be used to quickly build up a large variety of different mechanical representations of the fluid motion.
At present, SwRJ uses an independent, hand derived pendulum model to extract simulation parameters from the test data. Rotors can be added if needed, but the model is relatively inflexible and hard to modif,'. Dr. Sathya Gangadharan and his students at Embry Riddle Aeronautical University have been developing a method whereby the parameters can be derived directly from an arbitrary Matlab SimMechanics model of the mechanical analogs using the Parameter Estimator Toolbox.4 5 6 Previous research effort and some of the results obtained in parameter estimation are highlighted by Schlee et al.7 The Embry-Riddle research team has built a smaller scale version of the SwRJ lateral slosh rig in order to develop this automated parameter estimation method and to explore how a diaphragm effects the simulation parameters. It has been found that diaphragm shape can profoundly affect slosh behavior and that, surprisingly, many of these diaphragms will hold their initial shape throughout launch vibration and maneuvers.8 ERAU and SwRI will be exploring these issues this summer. ERAU will be transferring their SimMechanics based method of parameter estimation to SwRI for future use in slosh testing and parameter extraction activities.
Dr. Carl Hubert of Hubert Astronautics has been monitoring the activities at KSC, SwRI and ERAU, and has been incorporating the results of the testing into a handbook on spinning spacecraft design entitled "Behavior of Spinning Space Vehicles with Onboard Liquids".' This handbook is intended to be a design guide and primer for anyone building a spacecraft that will spin during its mission life - either on-orbit or just during launch on a spinning upper stage. It includes flight data from past missions as well as subscale drop test data and the data gathered from our full scale tank tests. Dr. Hubert presents a method for applying data from a specific type of tank in the database to an arbitrary spacecraft design with an arbitrary number of tanks and arbitrary tank placement. This should be useful from the conceptual pre-PMD phase of a design on through the entire design process.
The current research is a continuation of previous work in trying to understand and model certain modes of induced resonance found during experimental testing and during flight. This study focuses on the modeling of fluid motion and utilizes the results obtained to develop a more accurate prediction of the fuel slosh effects on spin stabilized spacecraft which can also include propellant management devices (PMD).
Extensive analysis has been done on the different tank shapes and locations, as well as the use of PMDs. A summary of this analysis, like that reported by Hubert shows the vast differences in possible behaviors of different designs. For example, a number of relatively , simple mechanical models have been developed for cylindrical tanks with hemispherical end-caps mounted outboard of the spin axis. This type of tank has been popular in a number of spacecraft programs. Hubert also notes that one of the most difficult aspects of employing such mechanical models is in the selection of appropriate parameters in the model.
One of the most practical types of spacecraft propulsion fluid control devices has proven to be the diaphragm, which uses an elastomeric material to create an effective barrier between the pressurant gas and the liquid propellant. Main advantages of currently available diaphragms over other PMDs are that they are easier to manufacture and they are light weight.'° Hopefully, future diaphragms will be able to collapse in a more repeatable folding pattern. This will further reduce the variability in finding spacecraft fuel slosh parameters and give a more certain location of the fuel tank (and hence spacecraft) center of gravity.
PROBLEM DEFINITION
Various simulation parameters are estimated by matching the pendulum/rotor model response to the experimental response of full sized test tanks in NASA's Spinning Slosh Test Rig (SSTR) located at the Southwest Research Institute (SwRI). The SSTR can subject a test tank to a realistic nutation motion, in which the spin rate and the nutation frequency can be varied independently, with the spin rate chosen to
5
create a centrifugal acceleration large enough to ensure that the configuration of the bladder and liquid in the tank is nearly identical to the zero-g configuration. The propellant motion is simulated using models with various parameters (inertia, springs, dampers, etc.) and the problem reduces to a parameter estimation problem to match the experimental results obtained from the SSTR. The data from these tests are used to derive model parameters that are then used in the slosh blocks of a MATLAB/SimMechanics-based spacecraft and upper stage simulation. Currently, the identification of the model parameters is a laborious trial-and-error process in which the equations of motion for the mechanical analog are hand-derived, evaluated, and compared with the experimental results.
The previous research used mechanical analogs such as pendulums and rotors to simulate sloshing mass as a common alternative to fluid modeling. A homogeneous vortex model of liquid motions in spinning tanks and an equivalent mechanical rotor model was developed by Dodge et al. 1 ' An approximate theory of oscillations that predicts the characteristics of the dominant inertial wave oscillation and the forces and moments on the tank are described. A 3-DOF pendulum model was proposed by Green et al.'2 There was evidence of liquid resonance from the experimental data. The resonance was closely tied to the tangential torque and to a lesser degree to the radial torque, and there was little or no resonance in the force measurements. Green et al., proposed a rotary oscillator concept to simulate the torque resonance in tangential and radial directions. This rotary oscillator model was superimposed on the pendulum model to provide the overall response of liquid oscillation in the tank.
The previous research effort proposed was directed toward modeling fuel slosh on spinning spacecraft using simple l-DOF pendulum analogs. The pendulum analog modeled is a spherical tank. An electric motor induced the motion of the pendulum via a locomotive arm assembly to simulate free surface slosh. A SimMechanics model incorporating the pendulum analog of the experiment was created (Figure 7). Parameters describing the simple pendulum models characterized the modal frequency of the free surface sloshing motion. The 1-DOF model helped to understand fuel sloshing and serve as a stepping stone for future more complex simulations to predict the NTC accurately with less time and effort.
The SSTR can accommodate a full-sized fuel tank complete with any internal PMD for testing. The SSTR measures and records the force and torque response of the fuel tank to the internal slosh motion of the propellant. It has the capability to identify and characterize slosh resonances. The data from the tests are used to derive model parameters that are then used in the slosh blocks of a MATLAB/SimMechanics-based spacecraft and upper stage simulation. Currently the identification of the model parameters is a laborious trial-and-error process in which the hand-derived equations of motion for the mechanical analog evaluated and compared with the experimental results.
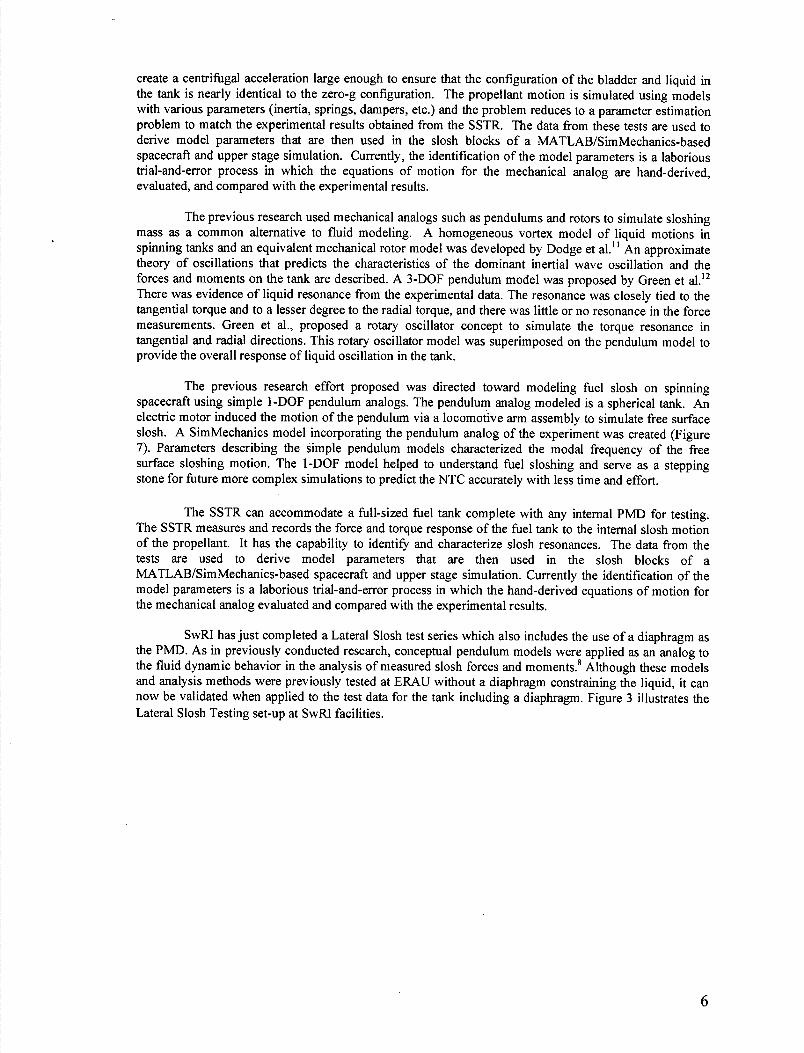
SwRI has just completed a Lateral Slosh test series which also includes the use of a diaphragm as the PMD. As in previously conducted research, conceptual pendulum models were applied as an analog to the fluid dynamic behavior in the analysis of measured slosh forces and moments. 8 Although these models and analysis methods were previously tested at ERAU without a diaphragm constraining the liquid, it can now be validated when applied to the test data for the tank including a diaphragm. Figure 3 illustrates the Lateral Slosh Testing set-up at SwRJ facilities.
U ' - - Cell Fitne
j .J :)ta .Ac.ele'omete
r
I • liotograph of the Test Rig for lateral slosh mode at SwRP
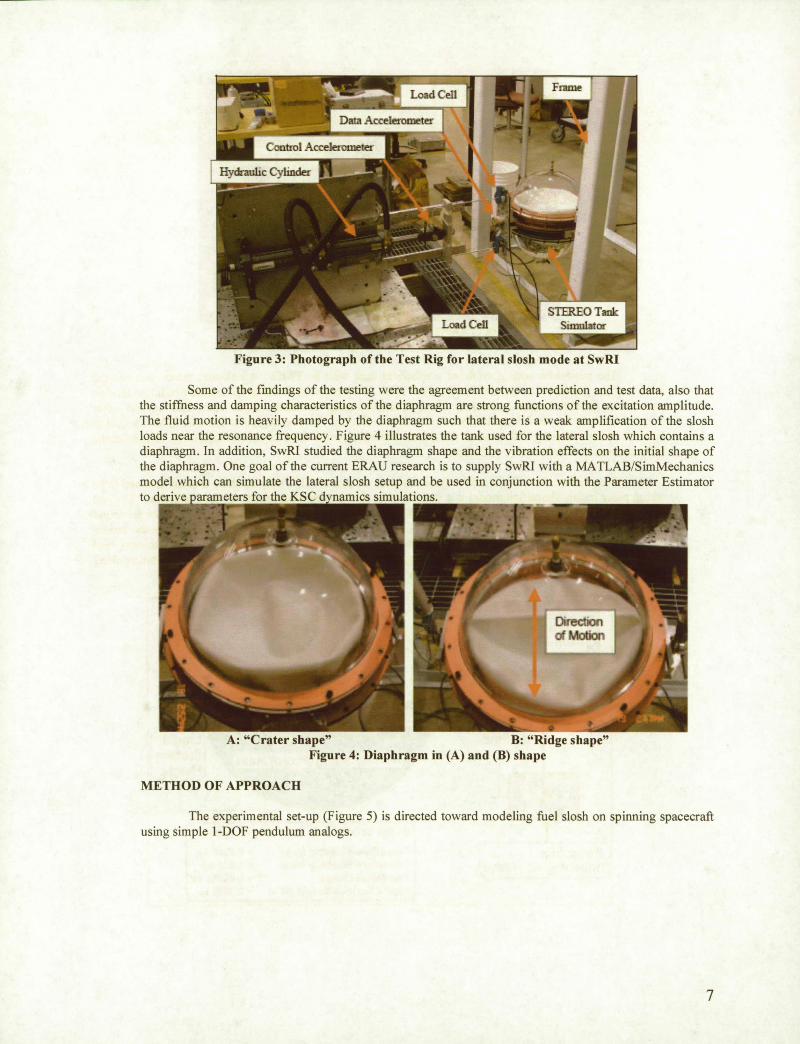
Some of the findings of the testing were the agreement between prediction and test data, also that the stiffness and damping characteristics of the diaphragm are strong functions of the excitation amplitude. The fluid motion is heavily damped by the diaphragm such that there is a weak amplification of the slosh loads near the resonance frequency. Figure 4 illustrates the tank used for the lateral slosh which contains a diaphragm. In addition, SwRI studied the diaphragm shape and the vibration effects on the initial shape of the diaphragm. One goal of the current ERAU research is to supply SwRI with a MATLAB/SimMechanics model which can simulate the lateral slosh setup and be used in conjunction with the Parameter Estimator to deri\ e paramctcrs fcr the KC simu1
;: ;T11 : _____ __ 7 .'
A: "Crater shape" B: "Ridge shape" Figure 4: Diaphragm in (A) and (B) shape
METHOD OF APPROACH
The experimental set-up (Figure 5) is directed toward modeling fuel slosh on spinning spacecraft using simple 1-DOF pendulum analogs.
7
I1i1 Hinge
Fixed Mass
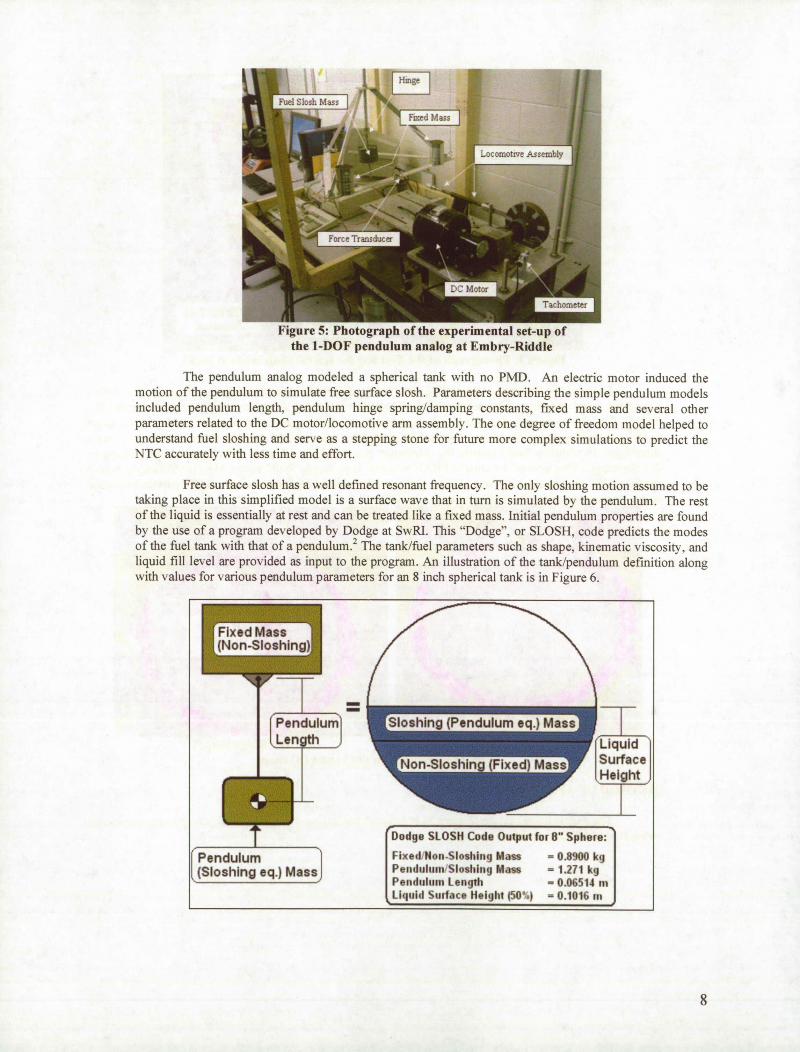
FigureS: Photograph of the experimental set-up of the 1-DOF pendulum analog at Embry-Riddle
The pendulum analog modeled a spherical tank with no PMD. An electric motor induced the motion of the pendulum to simulate free surface slosh. Parameters describing the simple pendulum models included pendulum length, pendulum hinge spring/damping constants, fixed mass and several other parameters related to the DC motor/locomotive arm assembly. The one degree of freedom model helped to understand fuel sloshing and serve as a stepping stone for future more complex simulations to predict the NTC accurately with less time and effort.
Free surface slosh has a well defined resonant frequency. The only sloshing motion assumed to be taking place in this simplified model is a surface wave that in turn is simulated by the pendulum. The rest of the liquid is essentially at rest and can be treated like a fixed mass. Initial pendulum properties are found by the use of a program developed by Dodge at SwRI. This "Dodge", or SLOSH, code predicts the modes of the fuel tank with that of a pendulum. 2 The tank/fuel parameters such as shape, kinematic viscosity, and liquid fill level are provided as input to the program. An illustration of the tank/pendulum definition along with values for various pendulum parameters for an 8 inch spherical tank is in Figure 6.
Fixed Mass •
T Pendul - ______
(Non-Sloshingj
_____ -
[Lengtj
Ixed) Mass Surface
Pendulum (Sloshing eq.) Mass
Dodge SLOSH Code Output for 8" Sphere:
FixedNon.Sloshing Mass - 0.8900 kg Pend.uluuii•Sloshiiig Mass = 1.271 kg Pendulum Length - 0.06514 in Liquid Sutface Height (50',) 0.1016 in
8
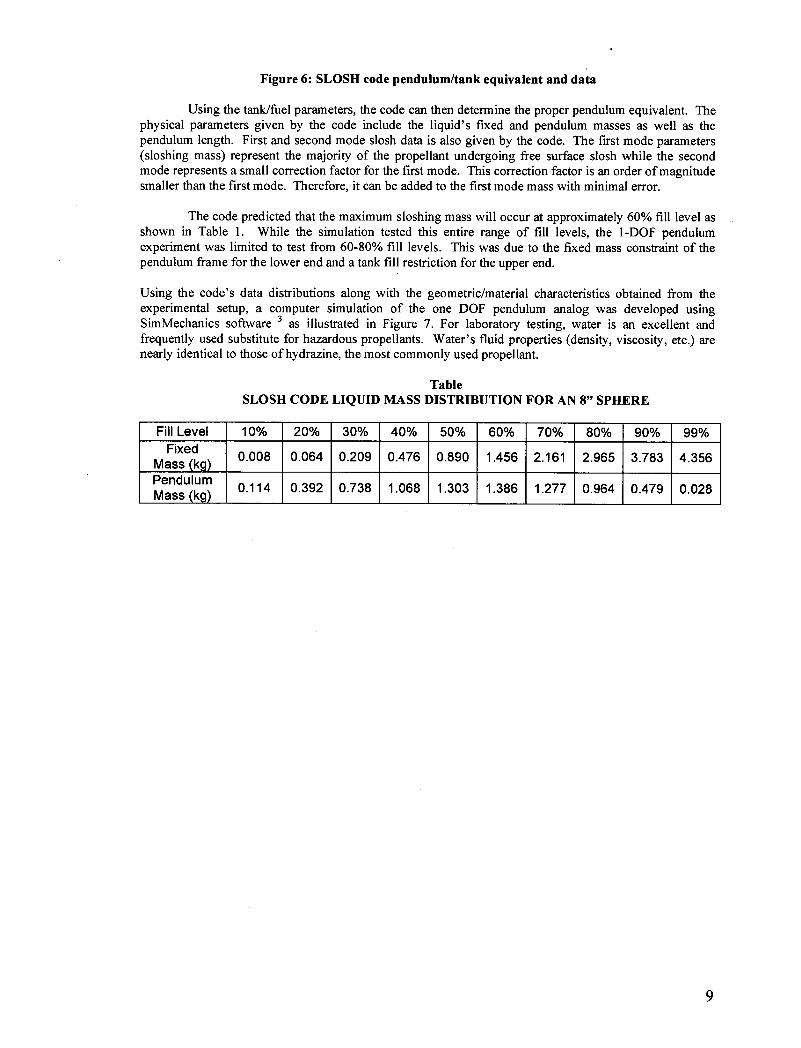
Figure 6: SLOSH code pendulum/tank equivalent and data
Using the tank/fuel parameters, the code can then determine the proper pendulum equivalent. The physical parameters given by the code include the liquid's fixed and pendulum masses as well as the pendulum length. First and second mode slosh data is also given by the code. The first mode parameters (sloshing mass) represent the majority of the propellant undergoing free surface slosh while the second mode represents a small correction factor for the first mode. This correction factor is an order of magnitude smaller than the first mode. Therefore, it can be added to the first mode mass with minimal error.
The code predicted that the maximum sloshing mass will occur at approximately 60% fill level as shown in Table 1. While the simulation tested this entire range of fill levels, the l-DOF pendulum experiment was limited to test from 60-80% fill levels. This was due to the fixed mass constraint of the pendulum frame for the lower end and a tank fill restriction for the upper end.
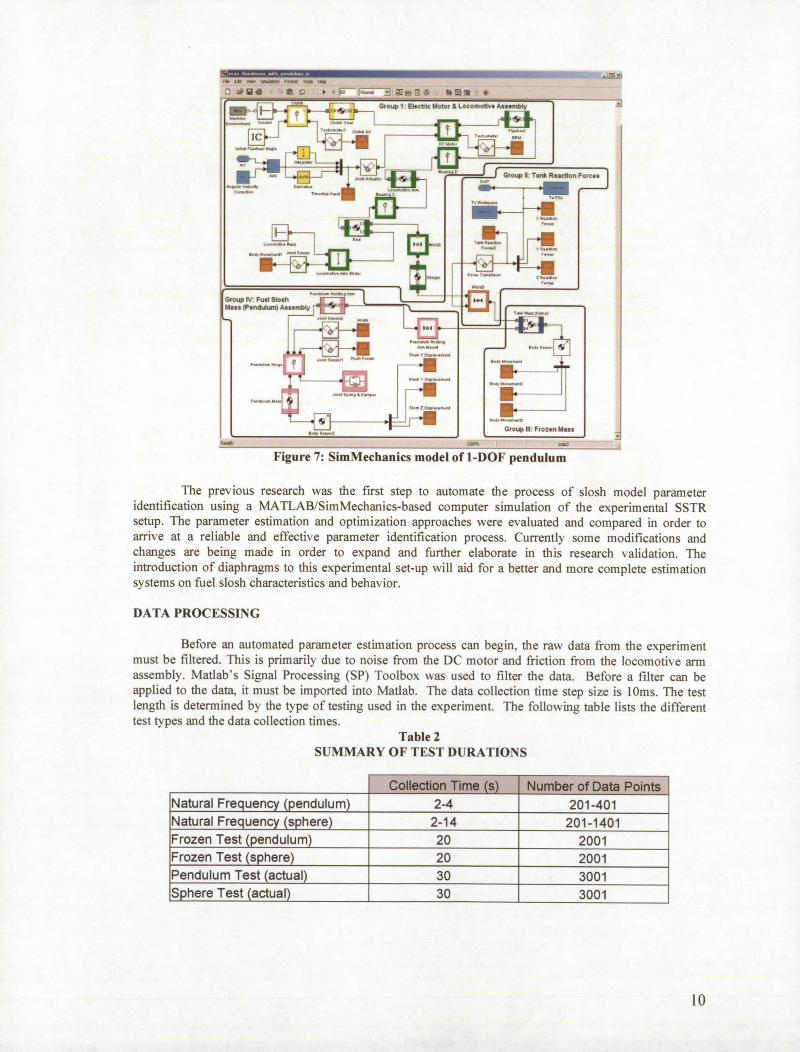
Using the code's data distributions along with the geometric/material characteristics obtained from the experimental setup, a computer simulation of the one DOF pendulum analog was developed using SimMechanics software as illustrated in Figure 7. For laboratory testing, water is an excellent and frequently used substitute for hazardous propellants. Water's fluid properties (density, viscosity, etc.) are nearly identical to those of hydrazine, the most commonly used propellant.
Table SLOSH CODE LIQUID MASS DISTRIBUTION FOR AN 8" SPHERE
Fill Level 10% 20% 30% 40% 50% 60% 70% 80% 90% 99%
Fixed Mass_(kg)
0.008 ________
0.064 ______
0.209 ______
0.476 ______
0.890 ______
1.456 2.161 2.965 3.783 4.356
Pendulum
______ ______ ______ ______ ______
Mass_(kg)0.114
________0.392
______0.738 ______
1.068 ______
1.303 ______
1.386 ______
1.277 ______
0.964 ______
0.479 ______ 0.028 ______
t
Group I: EIer l.loto & Locooftvs Asumbly
.° LLLI 72_ iTGrouplu:r.ni,Ructon Foce.. ]
fl..... -I
Group IV: Fuil Slosh .ss (P.ndsAir)
______________________________________________________I Ill: Froz.n
Figure 7: SimMechanics model of 1-DOF pendulum
The previous research was the first step to automate the process of slosh model parameter identification using a MATLAB/SimMechanics-based computer simulation of the experimental SSTR setup. The parameter estimation and optimization approaches were evaluated and compared in order to arrive at a reliable and effective parameter identification process. Currently some modifications and changes are being made in order to expand and further elaborate in this research validation. The introduction of diaphragms to this experimental set-up vill aid for a better and more complete estimation systems on fuel slosh characteristics and behavior.
DATA PROCESSING
Before an automated parameter estimation process can begin, the raw data from the experiment must be filtered. This is primarily due to noise from the DC motor and friction from the locomotive arm assembly. Matlab's Signal Processing (SP) Toolbox was used to filter the data. Before a filter can be applied to the data, it must be imported into Matlab. The data collection time step size is lOms. The test length is determined by the type of testing used in the experiment. The following table lists the different test types and the data collection times.
Table 2 SUMMARY OF TEST DURATIONS
___________________________ Collection Time (s) Number of Data Points Natural Frequency (pendulum) 2-4 201-401 Natural Frequency (sphere) 2-14 201-1401 Frozen Test (pendulum) 20 2001 Frozen Test (sphere) 20 2001 Pendulum Test (actual) 30 3001 Sphere Test (actual) 30 3001
10
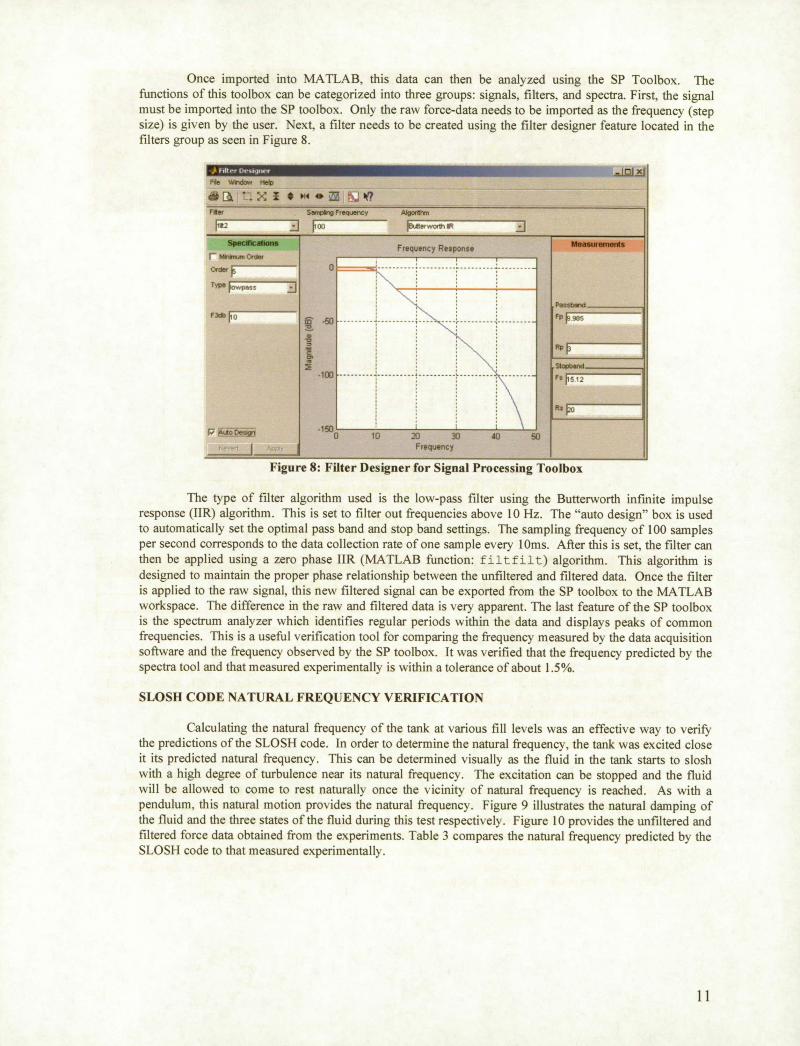
Once imported into MATLAB, this data can then be analyzed using the SP Toolbox. The functions of this toolbox can be categorized into three groups: signals, filters, and spectra. First, the signal must be imported into the SP toolbox. Only the raw force-data needs to be imported as the frequency (step size) is given by the user. Next, a filter needs to be created using the filter designer feature located in the filters group as seen in Figure 8.
wz:i Fe Vldo.. Hp
. .>: 6 " . j k? Fler SerePg Frequency Aigcem,
I: J ,rJo tewther
SSCUICiOfl$Frequency Response MS5*U1Ofl1St
r
IPe J \,,...... - .. -.
..
i •l5C
I Frequency
Figure 8: Filter Designer for Signal Processing Toolbox
The type of filter algorithm used is the low-pass filter using the Butterworth infmite impulse response (IIR) algorithm. This is set to filter out frequencies above 10 Hz. The "auto design" box is used to automatically set the optimal pass band and stop band settings. The sampling frequency of 100 samples per second corresponds to the data collection rate of one sample every lOms. After this is set, the filter can then be applied using a zero phase IIR (MATLAB function: filtfilt) algorithm. This algorithm is designed to maintain the proper phase relationship between the unfiltered and filtered data. Once the filter is applied to the raw signal, this new filtered signal can be exported from the SP toolbox to the MATLAB workspace. The difference in the raw and filtered data is very apparent. The last feature of the SP toolbox is the spectrum analyzer which identifies regular periods within the data and displays peaks of common frequencies. This is a useful verification tool for comparing the frequency measured by the data acquisition software and the frequency observed by the SP toolbox. It was verified that the frequency predicted by the spectra tool and that measured experimentally is within a tolerance of about 1.5%.
SLOSH CODE NATURAL FREQUENCY VERIFICATION
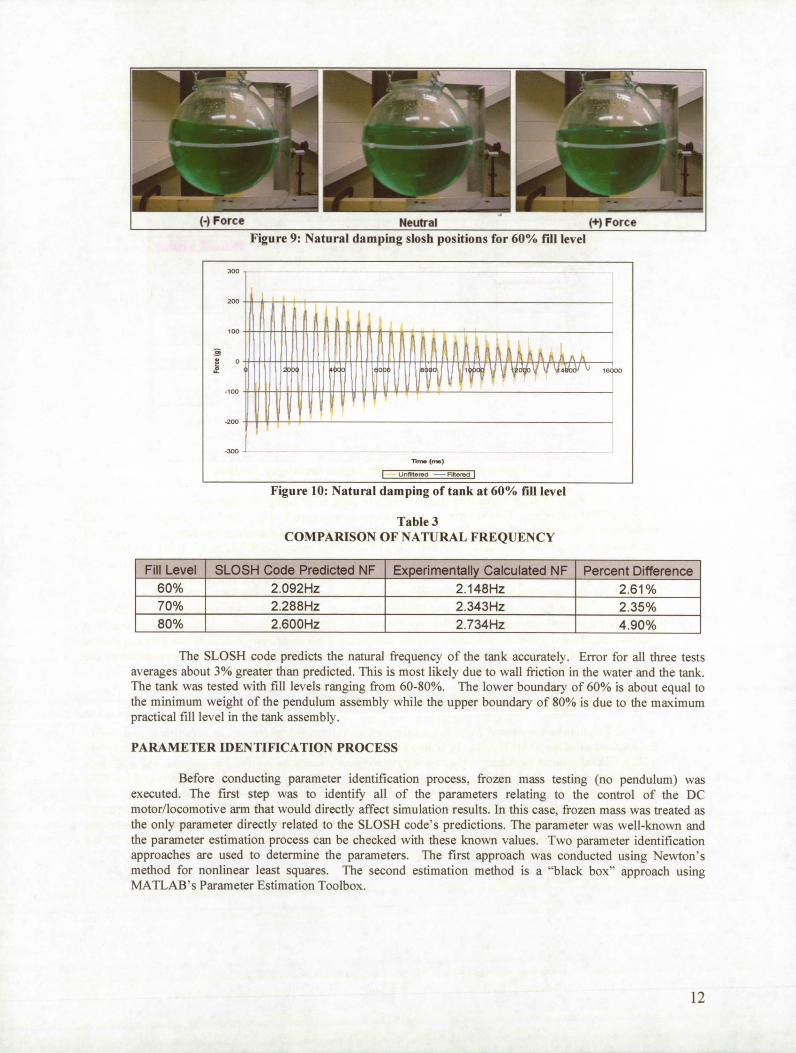
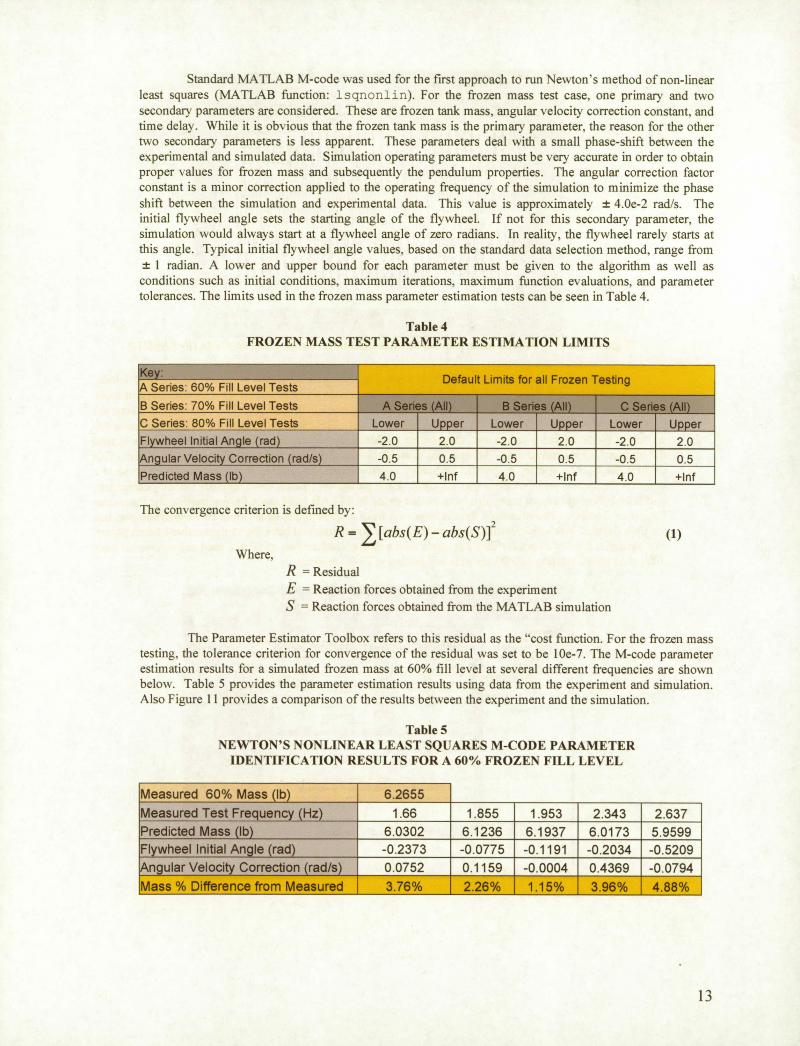
Calculating the natural frequency of the tank at various fill levels was an effective way to verify the predictions of the SLOSH code. In order to determine the natural frequency, the tank was excited close it its predicted natural frequency. This can be determined visually as the fluid in the tank starts to slosh with a high degree of turbulence near its natural frequency. The excitation can be stopped and the fluid will be allowed to come to rest naturally once the vicinity of natural frequency is reached. As with a pendulum, this natural motion provides the natural frequency. Figure 9 illustrates the natural damping of the fluid and the three states of the fluid during this test respectively. Figure 10 provides the unfiltered and filtered force data obtained from the experiments. Table 3 compares the natural frequency predicted by the SLOSH code to that measured experimentally.
r'i..... i: V r r.7 Id
- p Fo, Ce NCLItI al Foi ce Figure 9: Natural damping slosh positions for 60% fill level
°
I Unfiltered - Futered I
Figure 10: Natural damping of tank at 60% fill level
Table 3 COMPARISON OF NATURAL FREQUENCY
Fill Level SLOSH Code Predicted NE Experimentally Calculated NF Percent Difference
60% 2.092Hz 2.148Hz 2.61%
70% 2.288Hz 2.343Hz 2.35%
80% 2.600Hz 2.734Hz 4.90%
The SLOSH code predicts the natural frequency of the tank accurately. Error for all three tests averages about 3% greater than predicted. This is most likely due to wall friction in the water and the tank. The tank was tested with fill levels ranging from 60-80%. The lower boundary of 60% is about equal to the minimum weight of the pendulum assembly while the upper boundary of 80% is due to the maximum practical fill level in the tank assembly.
PARAMETER IDENTIFICATION PROCESS
Before conducting parameter identification process, frozen mass testing (no pendulum) was executed. The first step was to identifv all of the parameters relating to the control of the DC motor/locomotive arm that would directly affect simulation results. In this case, frozen mass was treated as the only parameter directly related to the SLOSH codes predictions. The parameter was well-known and the parameter estimation process can be checked with these known values. Two parameter identification approaches are used to determine the parameters. The first approach was conducted using Newton's method for nonlinear least squares. The second estimation method is a "black box" approach using MATLAB's Parameter Estimation Toolbox.
12
Standard MATLAB M-code was used for the first approach to run Newtons method of non-linear least squares (MATLAB function: lsqnonhin). For the frozen mass test case, one primary and two secondary parameters are considered. These are frozen tank mass, angular velocity correction constant, and time delay. While it is obvious that the frozen tank mass is the primary parameter, the reason for the other two secondary parameters is less apparent. These parameters deal with a small phase-shift between the experimental and simulated data. Simulation operating parameters must be very accurate in order to obtain proper values for frozen mass and subsequently the pendulum properties. The angular correction factor constant is a minor correction applied to the operating frequency of the simulation to minimize the phase shift between the simulation and experimental data. This value is approximately ± 4.Oe-2 rad/s. The initial flywheel angle sets the starting angle of the flywheel. If not for this secondary parameter, the simulation would always start at a flywheel angle of zero radians. In reality, the flywheel rarely starts at this angle. Typical initial flywheel angle values, based on the standard data selection method, range from ± 1 radian. A lower and upper bound for each parameter must be given to the algorithm as well as conditions such as initial conditions, maximum iterations, maximum function evaluations, and parameter tolerances. The limits used in the frozen mass parameter estimation tests can be seen in Table 4.
Table 4
FROZEN MASS TEST PARAMETER ESTIMATION LIMITS
Key:Default Limits for all Frozen Testing
__________________ \ Series: 60% Fill Level Tests
B Series: 70% Fill Level Tests A Series (All)
__________________
B Series (All)
__________________
C Series (All)
C Series: 80% Fill Level Tests Lower Upper Lower Upper Lower Upper
Flywheel Initial Angle (rad) -2.0 2.0 -2 0 2.0 -2.0 2.0
ngular Velocity Correction (radls) -0.5 0.5 -0.5 0.5 -0.5 0.5
Predicted Mass (Ib) 4.0 +Inf 4.0 +lnf 4.0 +lnf
The convergence criterion is defined by:
R = [abs(E) - abs(S)]2 (1)
Where,R Residual E = Reaction forces obtained from the experiment S = Reaction forces obtained from the MATLAB simulation
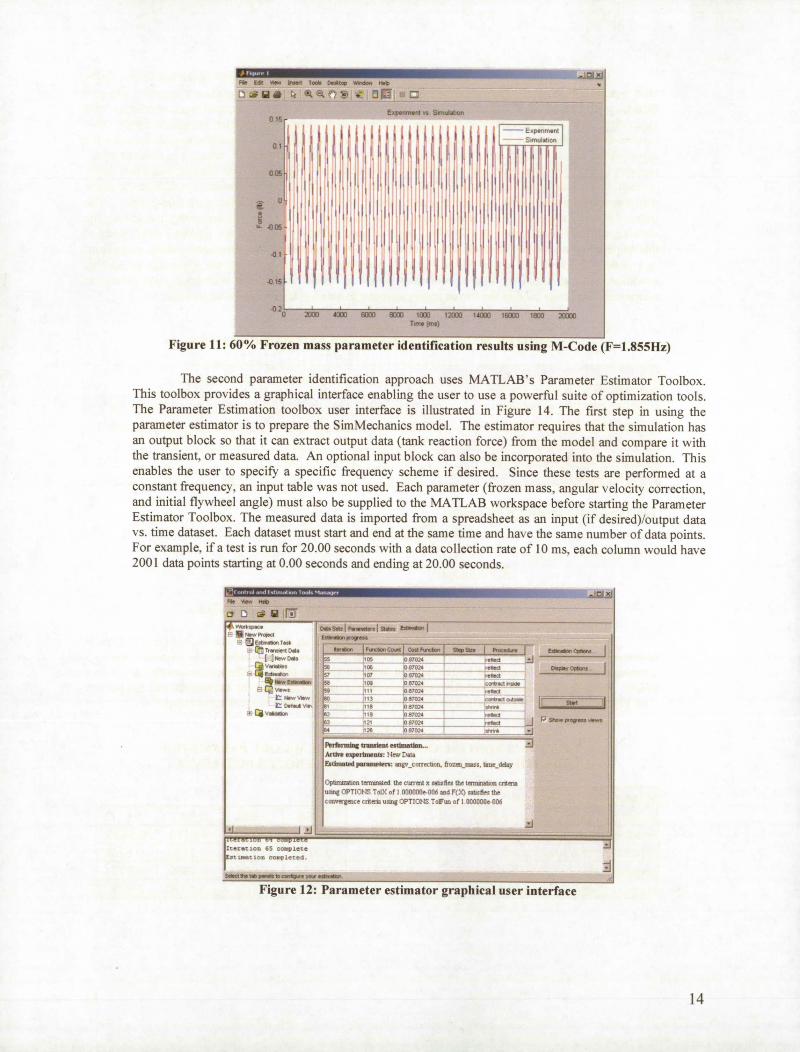
The Parameter Estimator Toolbox refers to this residual as the "cost function. For the frozen mass testing, the tolerance criterion for convergence of the residual was set to be lOe-7. The M-code parameter estimation results for a simulated frozen mass at 60% fill level at several different frequencies are shown below. Table 5 provides the parameter estimation results using data from the experiment and simulation. Also Figure 11 provides a comparison of the results between the experiment and the simulation.
Table 5
NEWTON'S NONLINEAR LEAST SQUARES M-CODE PARAMETER IDENTIFICATION RESULTS FOR A 60% FROZEN FILL LEVEL
Measured 60% Mass (lb) 6.2655
Measured Test Frequency (Hz) 1.66
________
1.855
________
1.953
________
2.343
________
2.637 Predicted Mass (lb) 6.0302 6.1236 6.1937 6.0173 5.9599
Flywheel Initial Angle (rad) -0.2373 -0.0775 -0.1191 -0.2034 -0.5209
Angular Velocity Correction (rad/s) 0.0752 0.1159 -0.0004 0.4369 -0.0794
Mass % Difference from Measured 3.76% 2.26% 1.15% 3.96% 4.88%
13
— ljv Q14i Fl. It . k,.et ToOM t.rop
DWà e W +
Sop. .,,.nt o S.,wI.Oon O 15 _______________
..poflm.nt Ui1IP h 1 hh 1il p lH I rl _____ 011 1 1 1 I, Ii li i i I Ilk I I I' I F II
I 1 I , 1 1 I, I. I . I II I
1,1 iii
I I
-O2i s000 m i izm ii ixx ia
Tm. (ml)
Figure 11: 60% Frozen mass parameter identification results using M-Code (F=1.855Hz)
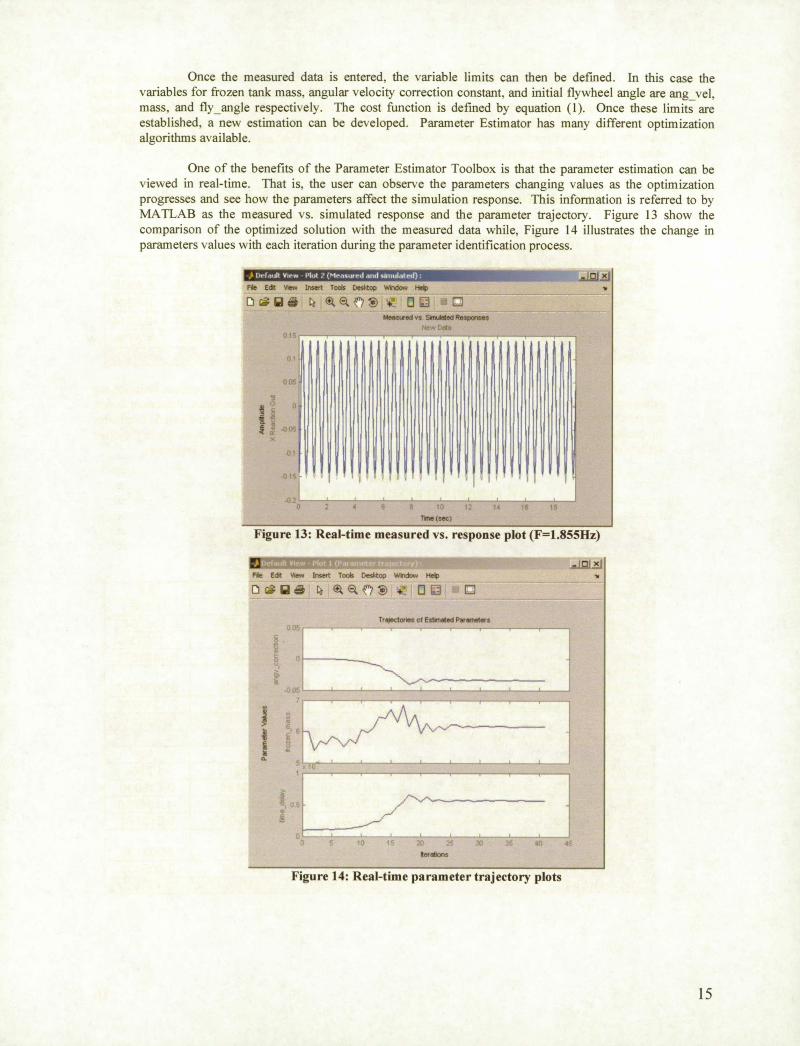
The second parameter identification approach uses MATLAB's Parameter Estimator Toolbox. This toolbox provides a graphical interface enabling the user to use a powerful suite of optimization tools. The Parameter Estimation toolbox user interface is illustrated in Figure 14. The first step in using the parameter estimator is to prepare the SimMechanics model. The estimator requires that the simulation has an output block so that it can extract output data (tank reaction force) from the model and compare it with the transient, or measured data. An optional input block can also be incorporated into the simulation. This enables the user to specify a specific frequency scheme if desired. Since these tests are performed at a constant frequency, an input table was not used. Each parameter (frozen mass, angular velocity correction, and initial flywheel angle) must also be supplied to the MATLAB workspace before starting the Parameter Estimator Toolbox. The measured data is imported from a spreadsheet as an input (if desired)/output data vs. time dataset. Each dataset must start and end at the same time and have the same number of data points. For example, if a test is run for 20.00 seconds with a data collection rate of 10 ms, each column would have 2001 data points starting at 0.00 seconds and ending at 20.00 seconds.
nmne.,n.nnTn,rntrrr... PIe f... 00th
w liT
EloO T.oO 1000 Sd.
I iNewDdo
v--
F:
E 00w w k o.,.a
Sd. SdT I P.00w, I Sd.. Sl.dew
I I I 5S 'U O67O
U U7O e0T Olø.yO,. - 107 067020 r000d
TO 007020 0 flu 087020 C _____ It - I
7020
----
_____
.-.
PIu*rmIr4 0i.I.n* es*ln... Aeth. .op.thn.u.lz New trala Fzdnl.d p.IIurIeew ..go_co1Iuoeo. froz.. ua... Inae_doy
Optima.twio Immooated the crxreo x .00.58. the t&n*ation cedmia 000.g OPTIONS ToLX of I 000000e-006 wrd F(X) ,00oSeo the convwgce c11aa u..0 OPTIONS iofzo ot I 000000e 006
-------- ---
Figure 12: Parameter estimator graphical user interface
14
5
05
Once the measured data is entered, the variable limits can then be defined. In this case the variables for frozen tank mass, angular velocity correction constant, and initial flywheel angle are ang_vel, mass, and fly angle respectively. The cost function is defined by equation (1). Once these limits are established, a new estimation can be developed. Parameter Estimator has many different optimization algorithms available.
One of the benefits of the Parameter Estimator Toolbox is that the parameter estimation can be viewed in real-time. That is, the user can observe the parameters changing values as the optimization progresses and see how the parameters affect the simulation response. This information is referred to by MATLAB as the measured vs. simulated response and the parameter trajectory. Figure 13 show the comparison of the optimized solution with the measured data while, Figure 14 illustrates the change iii parameters values with each iteration during the parameter identification process.
- - Fe uY I1se1 Tools Deolt ,dow l
O1 Mses*,ed os Si,piqed Reopci**s
01
005
0
.uOS
-0l
-0 S
•02 4 6 0 0 4 18 10
Tie. (sic)
Figure 13: Real-time measured vs. response plot (Fl.855Hz)
9e Ed Vlso Insert Tools Colto '.Widow He
UÔ + Ol
Tredones of EstinMed PvnMers
ierMtins
Figure 14: Real-time parameter trajectory plots
15
Once the parameter trajectories become constant, the parameter estimation can be manually terminated by the user for fast estimations. For more accurate estimations, the optimizer can iterate until a pre-defined stopping criterion is met as indicated in the status window of the Parameter Estimator interface shown in Figure 12. In this case, the stopping criterion is defined as the cost function changing by no more than lOe-6 for each iteration. The Parameter Estimator results for a simulated frozen mass at 60% fill level at several different frequencies are shown in Table
Table 6
PARAMETER ESTIMATOR TOOLBOX PARAMETER IDENTIFICATION RESULTS FOR 60% FROZEN FILL LEVEL
Measured 60% Mass (Ib) 6.2655
Measured Test Frequency (Hz) 1.66
________
1 .855
________
1.953
________
2.343
________
2.637 Predicted Mass (Ib) 6.0307 6.1241 6.1939 6.0176 5.9605 Flywheel Initial Angle (rad) -0.2855 -0.0759 -0.1177 -0.2082 -0.5205 Angular Velocity Correction (racl/s) 0.0817 0.1192 0.0038 0.4392 -0.0714 Mass % Difference from Measured 3.75% 2.26% 1.14% 3.96% 4.87% Mass % Difference from M-Code 0.008% 0.008% 0.003% 0.005% 0.01 0%
The same method used to estimate the frozen mass parameters was then used to estimate the pendulum parameters on a liquid-fill tank with no PMDs undergoing free surface slosh. Pendulum length and pendulum springldamping coefficients were added in addition to the parameters in Table 5. Limits for the pendulum length were set to be +1- 20% of the length predicted by the SLOSH code while the other limits were similar to those shown in Table 4. Table 7 shows the results for the 60% fill level tests.
Table 7 60% PENDULUM RESULTS FOR EACH METHOD
Pendulum Simulation (M-Code)
Five Parameters
___________ Fixed Mass
(Ib)
_______________ Pendulum Mass
(Ib) 60% Fill Level Properties 3.2099 3.055 Test ID Al A2
___________
A3 Measured Test Frequency (Hz) 1 .660 1.757 1.770 Angular Velocity Correction (rad/s) -0.1124420 -0.0274759 0.1357546 Initial Flywheel Angle (rad) -0 .2676705 -0.828300 1 -1 .1392384 Pendulum Spring Constant (ft-lb/rad) 0.0443370 0.0454400 0.0302538 Pendulum Damping Constant (ft-Ib/rad/sec) 0.0213000 0.0053249 0.0024797 Predicted Pendulum Length (in) 2.6167000 2.2831 900 2.131 5700 CostFunction 0.41629 0.89570 2.52411 Pendulum Simulation (Parameter Estimator) Test ID Al
________________ A2
____________
A3 Measured Test Frequency (Hz) 1 .660 1 .757 1 .770 Angular Velocity Correction (rad/s) -0.1 10270 -0.028498 0.135030 Initial Flywheel Angle (rad) -0.375980 -0.81 0290 -1.134300 Pendulum Spring Constant (ft-lb/rad) 0.000031 0.000000 0.01 3874 Pendulum Damping Constant (ft-Ib/rad/sec) 0.020442 0.003703 0.002133 Predicted Pendulum Length (in) 2.6185 (L) 1.949900 2.005400 Cost Function 0.40716 0.83715 2.48520
The results from Table and Table illustrate the effectiveness of each estimation method. Both the M-Code and the Parameter Estimator Toolbox converge to the same solution value for frozen mass test case. This is an important finding because the Parameter Estimator Toolbox is a "black box" program. By knowing that its output matches Newton's method as indicated by the graphical user interface, it can be concluded that the process of setting up the Toolbox for parameter estimation is being done correctly.
Overall, 35 distinct datasets were optimized with each method to total over 70 optimizations. For more details on the results obtained reference Schlee 13 The parameter identification approach developed provides a viable method for determining parameters. The simulation behaves well at different conditions and is very robust. Settings are quick to change and it is easy to run different test cases once a method is established. The analyst has the freedom to substitute different mechanical slosh analogs in the SimMechanics model as well as have the option to add more slosh analogs if desired. Each method, M-Code and Parameter Estimator, provides its own strengths and weaknesses. The M-Code gives the analyst control over the optimization while the Parameter Estimator Toolbox provided multiple optimization options in a user friendly interface.
Current Research
Extensive analysis has been done on the different tank shapes and locations, as well as the use of PMDs. Companies like Pressure Systems Inc. (PSI), which have manufactured for several years many diaphragm tanks, tested and demonstrated that the diaphragm provides an inherently superior slosh control compared to other PMDs. Figure 15 shows one of the PSI elastomeric diaphragms undergoing slosh testing.
Figure 1 : l'liotograpii ol an elastonieric d iaph ragiii (( o ii rtesy: PSI)
The current research is utilizing the previous modeling of fuel slosh for the introduction of a diaphragm and its effects to the whole system. Also, various liquids with different kinematic viscosities undergoing free surface slosh will be tested as an extension of the previous research. Both the experimental set-up and computer simulation are nearly the same as the previous research with only the addition of specific adjustments needed for the new elements introduced to experiment.
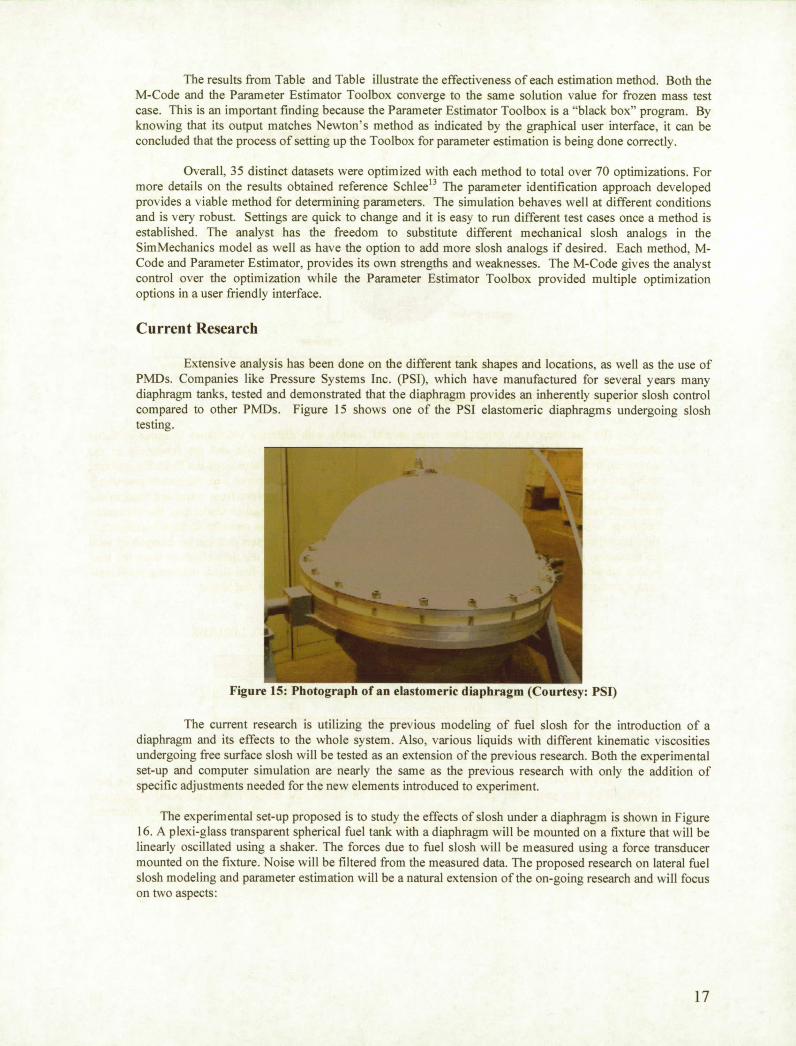
The experimental set-up proposed is to study the effects of slosh under a diaphragm is shown in Figure 16. A plexi-glass transparent spherical fuel tank with a diaphragm will be mounted on a fixture that will be linearly oscillated using a shaker. The forces due to fuel slosh will be measured using a force transducer mounted on the fixture. Noise will be filtered from the measured data. The proposed research on lateral fuel slosh modeling and parameter estimation will be a natural extension of the on-going research and will focus on two aspects:
17
• Understanding fuel slosh with various liquids • Understanding how a diaphragm effects fuel slosh
rigure lo: cnemauc uiagram 0! experimentai Set-up wirn tne aiapnragm
Current Research Model Validation
The first step is to experiment with several liquids with different viscosities in order to better understand the lateral fuel slosh effects. The resistance to flow of a fluid and the resistance to the movement of an object through a fluid are usually stated in terms of the viscosity of the fluid. By utilizing variation of viscosity, other fluids can be tested and the results can be compared with the results previously obtained. Liquids of varying viscosities and physical characteristics different from water are used in the propellant tank and will be tested (Table 7). It is assumed that for higher viscosities the resonance frequency is slightly higher that the predicted value for an ideal liquid, as reported in former research.14 This assumption about the liquids frequency will be one of the few parameters that can be determined with the execution of this first experimental set-up. In addition, the results of the data obtained from the new liquids introduced to the experiment will evaluate the effectiveness of the fuel slosh modeling previously used. Consequently, this will prepare the experiment for the inclusion of the diaphragm.
Table 7 COMPARSION OF VISCOSITIES OF DIFFERENT LIQUIDS
Liquid Viscosity (Poise)
Water 0.01
Glycerine 13
Corn Syrup 22
The SLOSH code was also utilized to obtain the model characteristic and properties for the new liquids. Using the same tank geometry and different fill levels, the SLOSH code provided mechanical system properties and they were compared with the previous results obtained with water. Table 8 illustrates the SLOSH code output for the liquids in the experiment.
18
Table 8 SLOSH CODE PREDICTION FOR ALL TESTED LIQUIDS
Glycerine ______ Corn Syrup War ________________________ FiLese4% 60 70 5) 60 70
______ 66 70
______ 83
LiquidMass(kg) 3587 4347 0 122 0 142
43 C 153
3933 0 122
4719 5393 0 163
2532 0 122
3438 C 142
7729 0 153 Liqud Sirce HegH (M) 0 142
First Mode Parameters Pend Mass (kg) 1 699 1.532 1.133 1 838 1. 1.232 1.338 1.214 0.895 Pend. Length (M) 0057 0.047 0.037 0 057 0.047 0.037 0.057 0.047 0.037 Pend Hingez. bncation (M) 0132 0.104 0.109 0132 0.104 0.109 0.132 0.104 0.109 Pend % cr4 Damrig 8.839 10.906 15309 10.380 12.806 17.600 0.703 0.874 1.217 RatofSshAmpitude 14-48 1.541 1.635 1448 1.541 1.635 1448 1.541 1635 to pend. Amplitude ______
Parameters
Pend. Mass (kg) 0 060 0.079 0063 0. 0. 0.091 0.048 0(53 0. Pend Length (M( 0018 0.017 0.014 0.018 0.017 0.014 0.018 0.017 0.014 Peret. Hingez.dcation(M) 0106 0.106 0.095 0.106 0.106 0.096 0.106 0106 0.095 Pami. % cr4. Darnpg 8 839 10.906 15.309 10. 12.806 17.938 0.703 0.874 1.217 RahofSboohAmphtix3e 0405 0.509 0627 0.405 0. 0.627 0.405 0.506 0.627 to pend Amitude
Fbed Mass Parameters Mass (kg( 1 838 2.728 3743 1. 2. 4.070 1 456 2.161 2.955 Z-dcation (M) 0101 0.100 0.099 0.101 0.109 0.099 0101 0.100 0.099 Moo, hertia (kgM2) 0.006 0.013 0.018 0. 0.014 0 019 0.097 0.010 0.014
1st Mode Ssh Frequency 2 092 2.288 2.609 2. 2.288 2,609 2.093 2.289 2601 2nd Mode Sksh Frequency 3.664 3.828 4.147 3.664 3.828 4.147 3, 3.838 4.149
are cycleslsec _______
As predicted with the SLOSH code output, damping is a critical parameter when comparing the liquids with different viscosities. Parameters such as the slosh frequency and pendulum length remain the same for all liquids regardless of their viscosities. Modeling the system with a diaphragm will help to better understand the damping effects on the system.
Introduction of Diaphragm
The flexible diaphragm will be attached to the periphery of the tank wall. Because of the geometric constraints, a flexible diaphragm is most commonly used in spherical propellant tanks. Diaphragms provide a substantial level of slosh damping as a result of the combination of viscoelastic flexing of the diaphragm and the increased viscous effects at the liquid-diaphragm interface. 15 A diaphragm also increases the slosh natural frequency because of the constraints imposed on the free surface shape. The effective mass of liquid participating in the sloshing is slightly smaller than for a tank of the same shape and fill level without a diaphragm. The nutation characteristics of the whole system also depend on the dissipation induced by the liquid viscosity, as well as on the presence and damping characteristics of PMD.'6
The introduction of a PMD in the propellant tank, in this case a diaphragm, could involve more complicated behavior than the previously researched free surface slosh. By utilizing a similar step-by-step approach as what was used for the free surface slosh, incorporating a diaphragm into the simulation may lead to better parameter identification of this type of system. The stiffness of the diaphragm in the tank is one of the parameter in the system that was not previously present in the former experimental set-up. This will be yet another parameter to be either experimentally determined and/or calculated with the computer estimation tools. Also including the stiffness effect of the diaphragm to the SLOSH code to predict the slosh changes expected in the tank, will be needed to compare the previous results without the diaphragm.
Figure 16, illustrates the diaphragm introduction to the experimental tank. This is the same experimental set-up as the previous research, but with diaphragm inside the tank. Once the diaphragm is
19
1 I
4 Ii
.-
p-
c:._
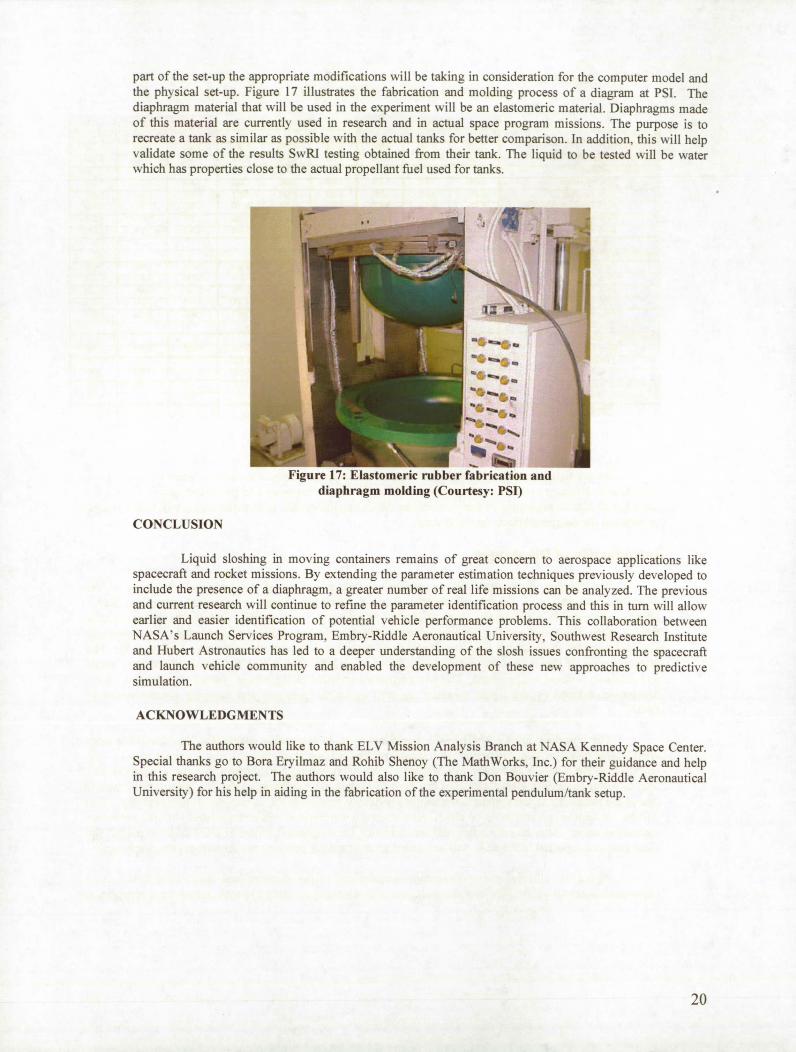
part of the set-up the appropriate modifications will be taking in consideration for the computer model and the physical set-up. Figure 17 illustrates the fabrication and molding process of a diagram at PSI. The diaphragm material that will be used in the experiment will be an elastomeric material. Diaphragms made of this material are currently used in research and in actual space program missions. The purpose is to recreate a tank as similar as possible with the actual tanks for better comparison. In addition, this will help validate some of the results SwRI testing obtained from their tank. The liquid to be tested will be water which has properties close to the actual propellant fuel used for tanks.
Figure 17: Elastomeric rubber fabrication and diaphragm molding (Courtesy: PSI)
CONCLUSION
Liquid sloshing in moving containers remains of great concern to aerospace applications like spacecraft and rocket missions. By extending the parameter estimation techniques previously developed to include the presence of a diaphragm, a greater number of real life missions can be analyzed. The previous and current research will continue to refine the parameter identification process and this in turn will allow earlier and easier identification of potential vehicle performance problems. This collaboration between NASA's Launch Services Program, Embry-Riddle Aeronautical University, Southwest Research Institute and Hubert Astronautics has led to a deeper understanding of the slosh issues confronting the spacecraft and launch vehicle community and enabled the development of these new approaches to predictive simulation.
ACKNOWLEDGMENTS
The authors would like to thank ELV Mission Analysis Branch at NASA Keimedy Space Center. Special thanks go to Bora Eryilmaz and Rohib Shenoy (The Math Works, Inc.) for their guidance and help in this research project. The authors would also like to thank Don Bouvier (Embry-Riddle Aeronautical University) for his help in aiding in the fabrication of the experimental pendulum/tank setup.
20
REFERENCES
1. Hubert, C., Behavior of Spinning Space Vehicles with Onboard Liquids, Hubert Astronautics, 2003, [email protected] .
2. Dodge, F.T., Fuel Slosh in Asymmetrical Tank Software.
3. Wood, G.D., and Kennedy, D.C., Simulating Mechanical Systems in Simulink with SimMechanics, The Mathworks report 2003.
4. Sudermann, J., Parameter Estimation of Spacecraft Fuel Slosh Mode, Research and Technology 2004 Annual Report, NASA Technical Memorandum 2004-2 1 1535
5. Sudermann, J., Parameter Estimation of Spacecraft Fuel Slosh, Technology Development and Application 2005 Annual Report, NASA Technical Memorandum 2006-2 14201
6. Gangadharan, S.N., Sudermann, J., Marlowe, A., Parameter Estimation of Spacecraft Nutation Growth Model, AIAA/ASME/ASCE/AHS/ASC 45th. Structures, Structural Dynamics and Materials (SDM) Conference, Palm Springs, California, In-Proceedings, April 19-22, 2004.
7. Schlee, K., Gangadharan, S.N., Ristow, J., Sudermann, J., Walker, C., and Hubert, C., Modeling and Parameter Estimation of Spacecraft Fuel Slosh, 29th Annual AAS Guidance and Control Conference, In Proceedings, Paper # AAS-06-027, American Astronautical Society, Rocky Mountain Section, Breckenridge, Colorado, February 4-8, 2006.
8. Green, S., Burkey, R., Dodge, F., and Walter, D., Lateral Slosh Test for STEREO Propellant Tank, Final Report SwRI Project# 18.12441.01.008 2006.
9. Hubert, C., Introduction to the Dynamics and Control of Spinning Space Vehicles, Hubert Astronautics, 2001.
10. Ballinger, l.A., Lay, W.D., and Tam, W.H., Review and History of PSI Elastomeric Diaphragm Tanks, AIAAJASME/SAE/ASEE Joint Propulsion Conference and Exhibit, San Diego, CA. July, 1995.
11. Dodge, F.T., Unruh, J.F., Green, S.T., Cruse, M.W., A Mechanical Model of Liquid Inertial Waves for Use with Spinning Craft, Fluid Transients, FED-Vol. 198IPVP-Vol. 291, ASME 1994.
12. Green, S., Burkey, R., Dodge, F., and Walter, D., Nutation Time Constant Model Parameters for the Contour Spacecraft, Final Report SwRI Project4l8.046l7 2002.
13. Schlee, K., Modeling and Parameter Estimation of Spacecraft Fuel Slosh Using Pendulum Analogs, MS Thesis, Embry-Riddle Aeronautical University, Daytona Beach, Florida, July 2006.
14. Ibrahim, R. Liquid Sloshing Dynamics: Theory and Applications. Wayne State University, Michigan. Cambridge Publishing. ISBN- 13: 9780521838856
15. Kana, D.D., and Dodge, F.T., Dynamics of Sloshing in Upright and Inverted Bladdered Tanks, ASME Journal Fluids Engineering, 109, pp. 58-63.
16. Quadrelli, M., Modeling and Analysis for Nut ation Time Constant Determination of On-Axis Diaphragm Tanks Spinners: Application to the Deep Space One. AAS paper 03-155, AIAA copyright 2003.
21