Embed Size (px)
Citation preview
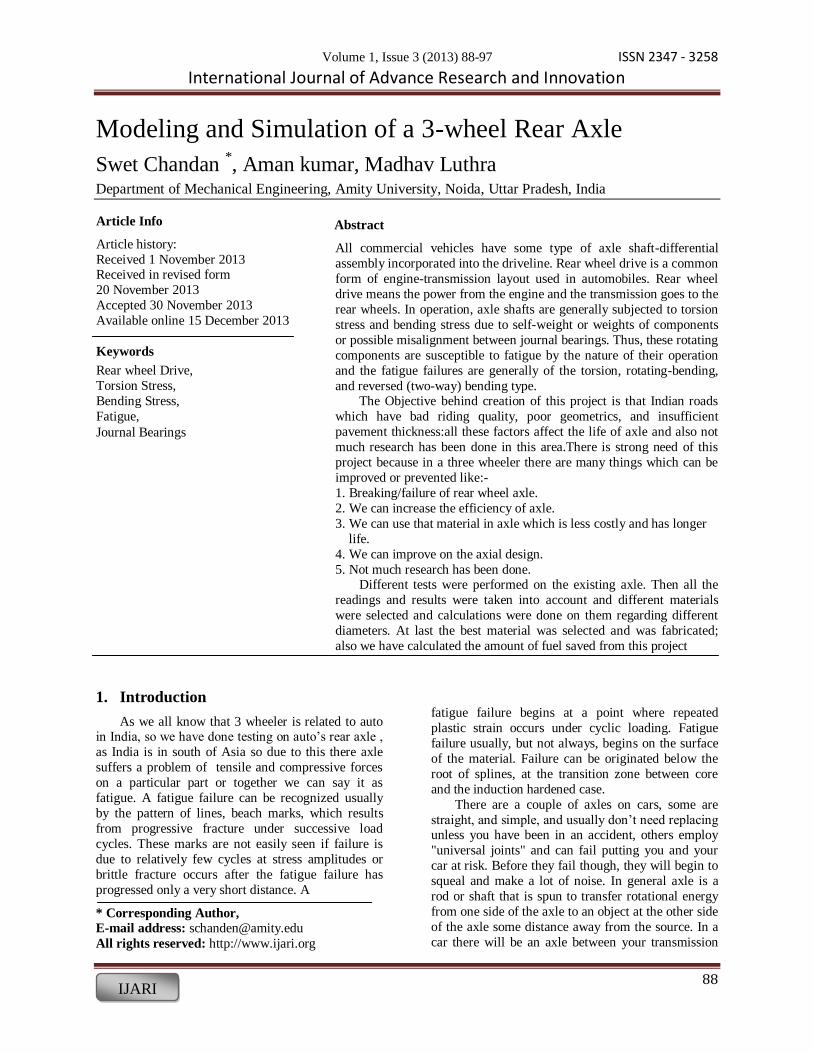
Volume 1, Issue 3 (2013) 88-97 ISSN 2347 - 3258 International Journal of Advance Research and Innovation
88 IJARI
Modeling and Simulation of a 3-wheel Rear Axle
Swet Chandan *, Aman kumar, Madhav Luthra
Department of Mechanical Engineering, Amity University, Noida, Uttar Pradesh, India
Abstract
All commercial vehicles have some type of axle shaft-differential
assembly incorporated into the driveline. Rear wheel drive is a common
form of engine-transmission layout used in automobiles. Rear wheel
drive means the power from the engine and the transmission goes to the
rear wheels. In operation, axle shafts are generally subjected to torsion
stress and bending stress due to self-weight or weights of components
or possible misalignment between journal bearings. Thus, these rotating
components are susceptible to fatigue by the nature of their operation
and the fatigue failures are generally of the torsion, rotating-bending,
and reversed (two-way) bending type. The Objective behind creation of this project is that Indian roads
which have bad riding quality, poor geometrics, and insufficient
pavement thickness:all these factors affect the life of axle and also not
much research has been done in this area.There is strong need of this
project because in a three wheeler there are many things which can be
improved or prevented like:-
1. Breaking/failure of rear wheel axle.
2. We can increase the efficiency of axle.
3. We can use that material in axle which is less costly and has longer
life.
4. We can improve on the axial design.
5. Not much research has been done. Different tests were performed on the existing axle. Then all the
readings and results were taken into account and different materials
were selected and calculations were done on them regarding different
diameters. At last the best material was selected and was fabricated;
also we have calculated the amount of fuel saved from this project
1. Introduction
As we all know that 3 wheeler is related to auto in India, so we have done testing on auto’s rear axle ,
as India is in south of Asia so due to this there axle
suffers a problem of tensile and compressive forces
on a particular part or together we can say it as
fatigue. A fatigue failure can be recognized usually
by the pattern of lines, beach marks, which results
from progressive fracture under successive load
cycles. These marks are not easily seen if failure is
due to relatively few cycles at stress amplitudes or
brittle fracture occurs after the fatigue failure has
progressed only a very short distance. A
* Corresponding Author, E-mail address: [email protected]
All rights reserved: http://www.ijari.org
fatigue failure begins at a point where repeated
plastic strain occurs under cyclic loading. Fatigue
failure usually, but not always, begins on the surface
of the material. Failure can be originated below the
root of splines, at the transition zone between core
and the induction hardened case.
There are a couple of axles on cars, some are
straight, and simple, and usually don’t need replacing unless you have been in an accident, others employ
"universal joints" and can fail putting you and your
car at risk. Before they fail though, they will begin to
squeal and make a lot of noise. In general axle is a
rod or shaft that is spun to transfer rotational energy
from one side of the axle to an object at the other side
of the axle some distance away from the source. In a
car there will be an axle between your transmission
Article Info
Article history:
Received 1 November 2013 Received in revised form
20 November 2013
Accepted 30 November 2013
Available online 15 December 2013
Keywords
Rear wheel Drive,
Torsion Stress,
Bending Stress,
Fatigue,
Journal Bearings
Volume 1, Issue 3 (2013) 88-97 ISSN 2347 - 3258 International Journal of Advance Research and Innovation
89 IJARI
and your wheel, or there will be one in-between your
transmission and your differential housing, in that
case, your differential housing will have one axle
coming from it going to each wheel.
Axles are an integral component of a wheeled
vehicle. In a live-axle suspension system, the axles serve to transmit driving torque to the wheel, as well
as to maintain the position of the wheels related to
each other and to the vehicle body. The axles in this
system must also bear the weight of the vehicle plus
any cargo. A non-driving axle, such as the front beam
axle in Heavy duty trucks and some 2 wheel drive
light trucks and vans, will have no shaft. It serves
only as a suspension and steering component.
Conversely, many front wheel drive cars have a solid
rear beam axles.
2. Mechanical Testing
To start we have taken a rear axle shaft and we
have performed following mechanical testing:
1. TORSION TEST
2. IMPACT TEST
3. HARDNESS TEST
4. BENDING TEST 5. SPECTRO TEST
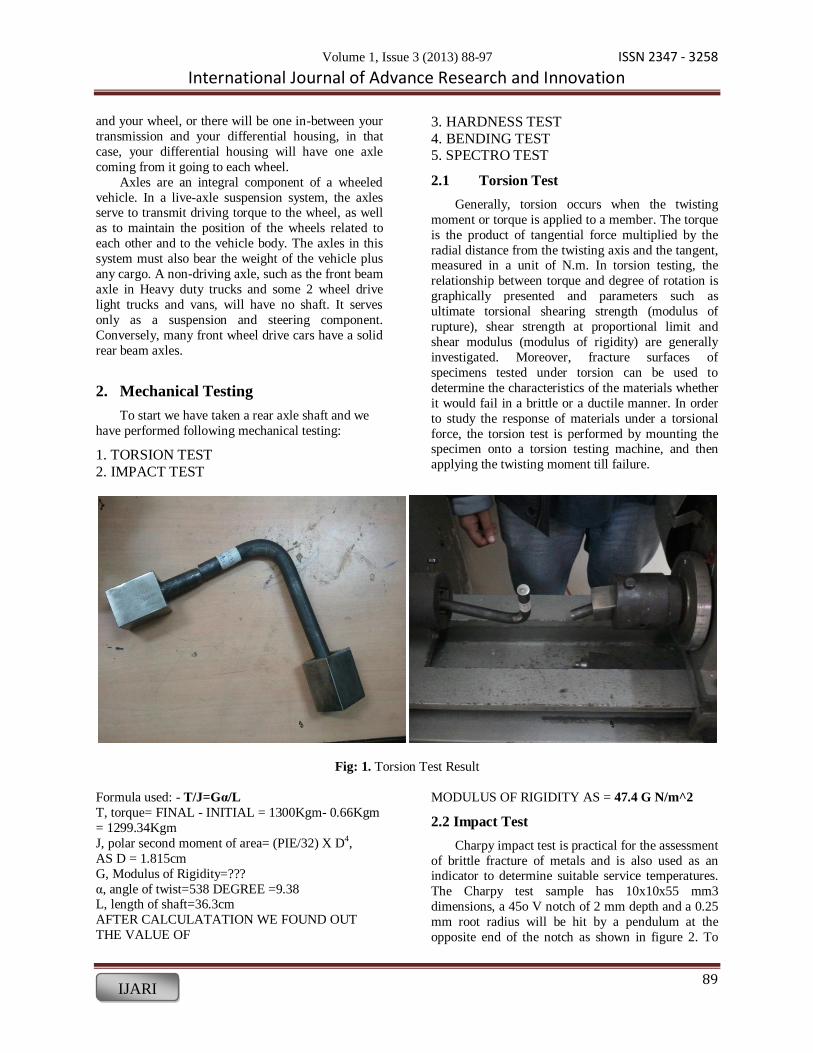
2.1 Torsion Test
Generally, torsion occurs when the twisting
moment or torque is applied to a member. The torque
is the product of tangential force multiplied by the
radial distance from the twisting axis and the tangent, measured in a unit of N.m. In torsion testing, the
relationship between torque and degree of rotation is
graphically presented and parameters such as
ultimate torsional shearing strength (modulus of
rupture), shear strength at proportional limit and
shear modulus (modulus of rigidity) are generally
investigated. Moreover, fracture surfaces of
specimens tested under torsion can be used to
determine the characteristics of the materials whether
it would fail in a brittle or a ductile manner. In order
to study the response of materials under a torsional
force, the torsion test is performed by mounting the specimen onto a torsion testing machine, and then
applying the twisting moment till failure.
Fig: 1. Torsion Test Result
Formula used: - T/J=Gα/L
T, torque= FINAL - INITIAL = 1300Kgm- 0.66Kgm
= 1299.34Kgm
J, polar second moment of area= (PIE/32) X D4,
AS D = 1.815cm
G, Modulus of Rigidity=???
α, angle of twist=538 DEGREE =9.38 L, length of shaft=36.3cm
AFTER CALCULATATION WE FOUND OUT
THE VALUE OF
MODULUS OF RIGIDITY AS = 47.4 G N/m^2
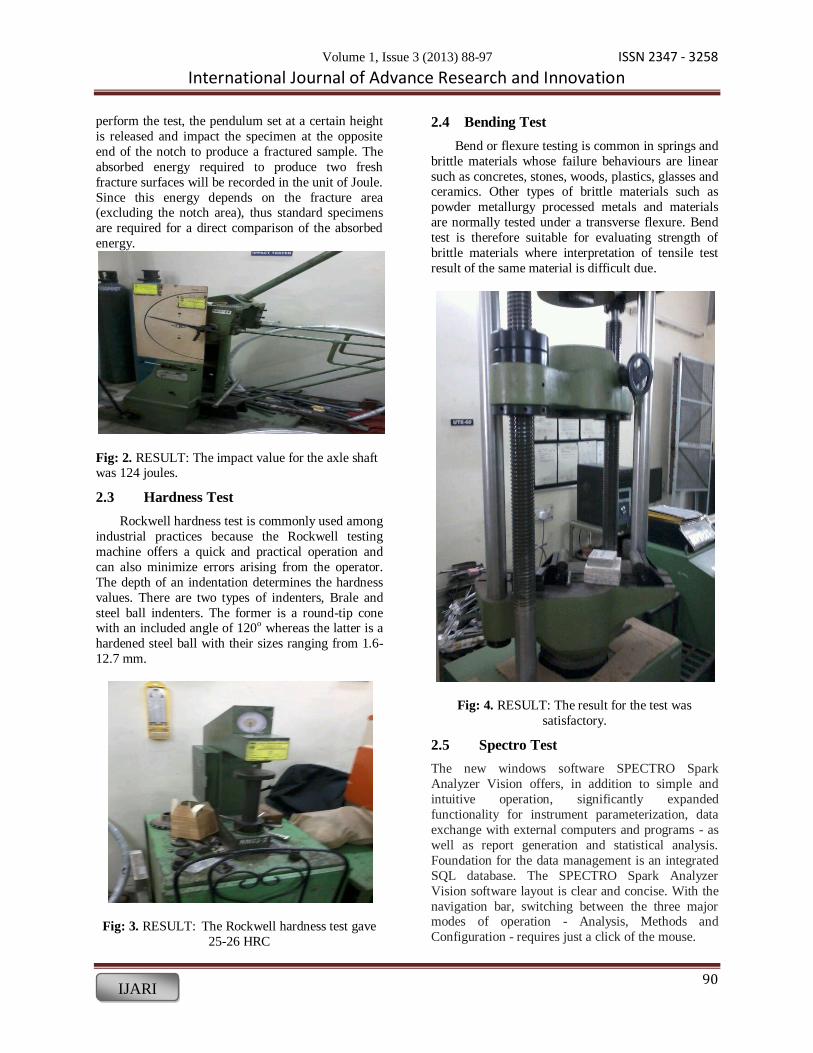
2.2 Impact Test
Charpy impact test is practical for the assessment
of brittle fracture of metals and is also used as an indicator to determine suitable service temperatures.
The Charpy test sample has 10x10x55 mm3
dimensions, a 45o V notch of 2 mm depth and a 0.25
mm root radius will be hit by a pendulum at the
opposite end of the notch as shown in figure 2. To
Volume 1, Issue 3 (2013) 88-97 ISSN 2347 - 3258 International Journal of Advance Research and Innovation
90 IJARI
perform the test, the pendulum set at a certain height
is released and impact the specimen at the opposite
end of the notch to produce a fractured sample. The
absorbed energy required to produce two fresh
fracture surfaces will be recorded in the unit of Joule.
Since this energy depends on the fracture area (excluding the notch area), thus standard specimens
are required for a direct comparison of the absorbed
energy.
Fig: 2. RESULT: The impact value for the axle shaft was 124 joules.
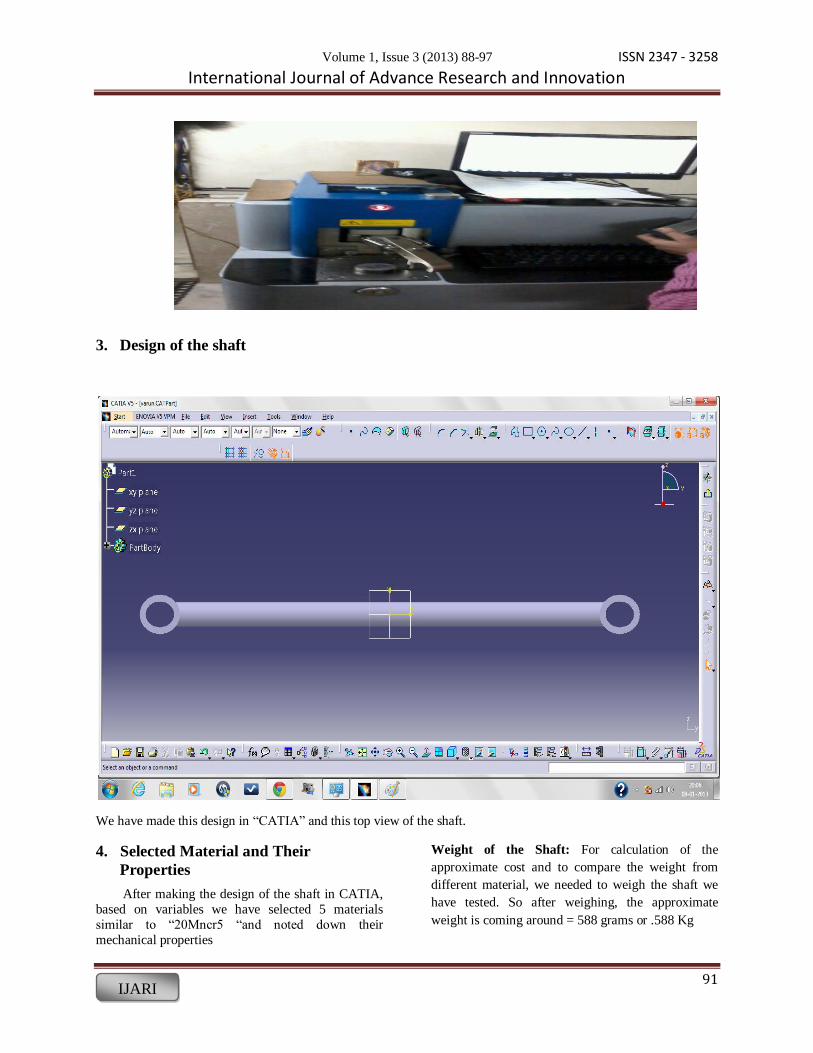
2.3 Hardness Test
Rockwell hardness test is commonly used among
industrial practices because the Rockwell testing
machine offers a quick and practical operation and
can also minimize errors arising from the operator.
The depth of an indentation determines the hardness
values. There are two types of indenters, Brale and
steel ball indenters. The former is a round-tip cone with an included angle of 120o whereas the latter is a
hardened steel ball with their sizes ranging from 1.6-
12.7 mm.
Fig: 3. RESULT: The Rockwell hardness test gave
25-26 HRC
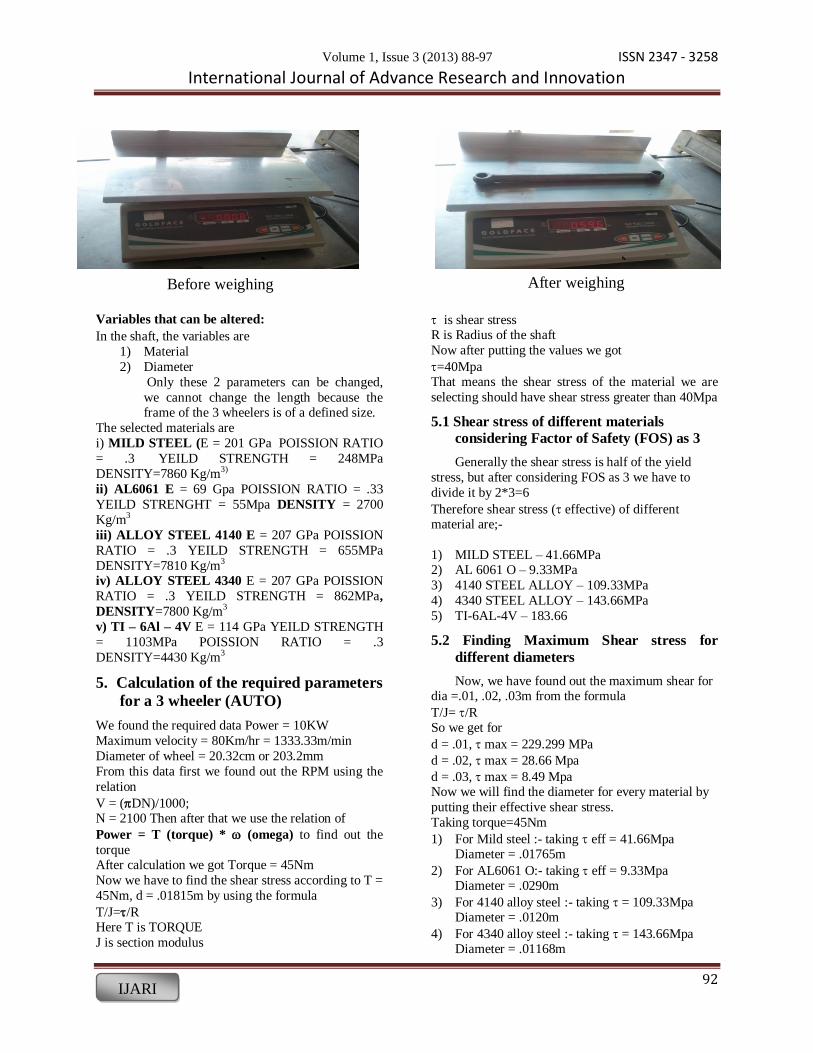
2.4 Bending Test
Bend or flexure testing is common in springs and
brittle materials whose failure behaviours are linear
such as concretes, stones, woods, plastics, glasses and ceramics. Other types of brittle materials such as
powder metallurgy processed metals and materials
are normally tested under a transverse flexure. Bend
test is therefore suitable for evaluating strength of
brittle materials where interpretation of tensile test
result of the same material is difficult due.
Fig: 4. RESULT: The result for the test was
satisfactory.
2.5 Spectro Test
The new windows software SPECTRO Spark
Analyzer Vision offers, in addition to simple and
intuitive operation, significantly expanded
functionality for instrument parameterization, data
exchange with external computers and programs - as
well as report generation and statistical analysis.
Foundation for the data management is an integrated
SQL database. The SPECTRO Spark Analyzer
Vision software layout is clear and concise. With the
navigation bar, switching between the three major modes of operation - Analysis, Methods and
Configuration - requires just a click of the mouse.
Volume 1, Issue 3 (2013) 88-97 ISSN 2347 - 3258 International Journal of Advance Research and Innovation
91 IJARI
3. Design of the shaft
We have made this design in “CATIA” and this top view of the shaft.
4. Selected Material and Their
Properties
After making the design of the shaft in CATIA,
based on variables we have selected 5 materials
similar to “20Mncr5 “and noted down their
mechanical properties
Weight of the Shaft: For calculation of the
approximate cost and to compare the weight from
different material, we needed to weigh the shaft we
have tested. So after weighing, the approximate
weight is coming around = 588 grams or .588 Kg
Volume 1, Issue 3 (2013) 88-97 ISSN 2347 - 3258 International Journal of Advance Research and Innovation
92 IJARI
fig 5.1
fig 5.2
Variables that can be altered:
In the shaft, the variables are
1) Material
2) Diameter
Only these 2 parameters can be changed,
we cannot change the length because the frame of the 3 wheelers is of a defined size.
The selected materials are
i) MILD STEEL (E = 201 GPa POISSION RATIO
= .3 YEILD STRENGTH = 248MPa DENSITY=7860 Kg/m3) ii) AL6061 E = 69 Gpa POISSION RATIO = .33
YEILD STRENGHT = 55Mpa DENSITY = 2700
Kg/m3
iii) ALLOY STEEL 4140 E = 207 GPa POISSION
RATIO = .3 YEILD STRENGTH = 655MPa
DENSITY=7810 Kg/m3
iv) ALLOY STEEL 4340 E = 207 GPa POISSION
RATIO = .3 YEILD STRENGTH = 862MPa,
DENSITY=7800 Kg/m3
v) TI – 6Al – 4V E = 114 GPa YEILD STRENGTH
= 1103MPa POISSION RATIO = .3
DENSITY=4430 Kg/m3
5. Calculation of the required parameters
for a 3 wheeler (AUTO)
We found the required data Power = 10KW
Maximum velocity = 80Km/hr = 1333.33m/min
Diameter of wheel = 20.32cm or 203.2mm
From this data first we found out the RPM using the
relation
V = (DN)/1000; N = 2100 Then after that we use the relation of
Power = T (torque) * (omega) to find out the
torque After calculation we got Torque = 45Nm
Now we have to find the shear stress according to T =
45Nm, d = .01815m by using the formula
T/J=/R Here T is TORQUE
J is section modulus
is shear stress R is Radius of the shaft
Now after putting the values we got
=40Mpa That means the shear stress of the material we are
selecting should have shear stress greater than 40Mpa
5.1 Shear stress of different materials
considering Factor of Safety (FOS) as 3
Generally the shear stress is half of the yield
stress, but after considering FOS as 3 we have to
divide it by 2*3=6
Therefore shear stress ( effective) of different material are;-
1) MILD STEEL – 41.66MPa 2) AL 6061 O – 9.33MPa
3) 4140 STEEL ALLOY – 109.33MPa
4) 4340 STEEL ALLOY – 143.66MPa
5) TI-6AL-4V – 183.66
5.2 Finding Maximum Shear stress for
different diameters
Now, we have found out the maximum shear for dia =.01, .02, .03m from the formula
T/J= /R So we get for
d = .01, max = 229.299 MPa
d = .02, max = 28.66 Mpa
d = .03, max = 8.49 Mpa Now we will find the diameter for every material by
putting their effective shear stress.
Taking torque=45Nm
1) For Mild steel :- taking eff = 41.66Mpa Diameter = .01765m
2) For AL6061 O:- taking eff = 9.33Mpa Diameter = .0290m
3) For 4140 alloy steel :- taking = 109.33Mpa Diameter = .0120m
4) For 4340 alloy steel :- taking = 143.66Mpa Diameter = .01168m
Before weighing After weighing
Volume 1, Issue 3 (2013) 88-97 ISSN 2347 - 3258 International Journal of Advance Research and Innovation
93 IJARI
5) For TI–6AL–4V :- TAKING =183.66Mpa Diameter = .01076m
5.3 Selecting the Required Diameter
After Finding the Diameter Now We Will Select
the Diameter Which Will Satisfy the Equation
(MAX) (EFF) Now For
1) MILD STEEL
d = 1cm (rejected)
d = 1.765 (selected as this is the min diameter)
d = 2cm (selected)
d = 3cm (selected)
2) AL6061O
d = 1 cm (rejected)
d = 2 cm (rejected)
d = 2.9 cm (selected as this is the min diameter
d = 3 cm (selected)
3) 4140 alloy steel
d = 1 cm (rejected)
d = 1.2 cm (selected as this is the min diameter)
d = 2 cm (selected)
d = 3 cm (selected)
4) 4340 alloy steel
d = 1 cm (rejected) d = 1.168 cm (selected as this is the min
diameter)
d = 2 cm (selected)
d=3cm (selected)
5) TI-6AL-4V
d = 1cm (rejected)
d = 1.076(selected as this is the min diameter)
d = 2 cm (selected)
d = 3 cm (selected)
Now we have selected the diameters, we
will now calculate the cost for each material for
each selected diameter.
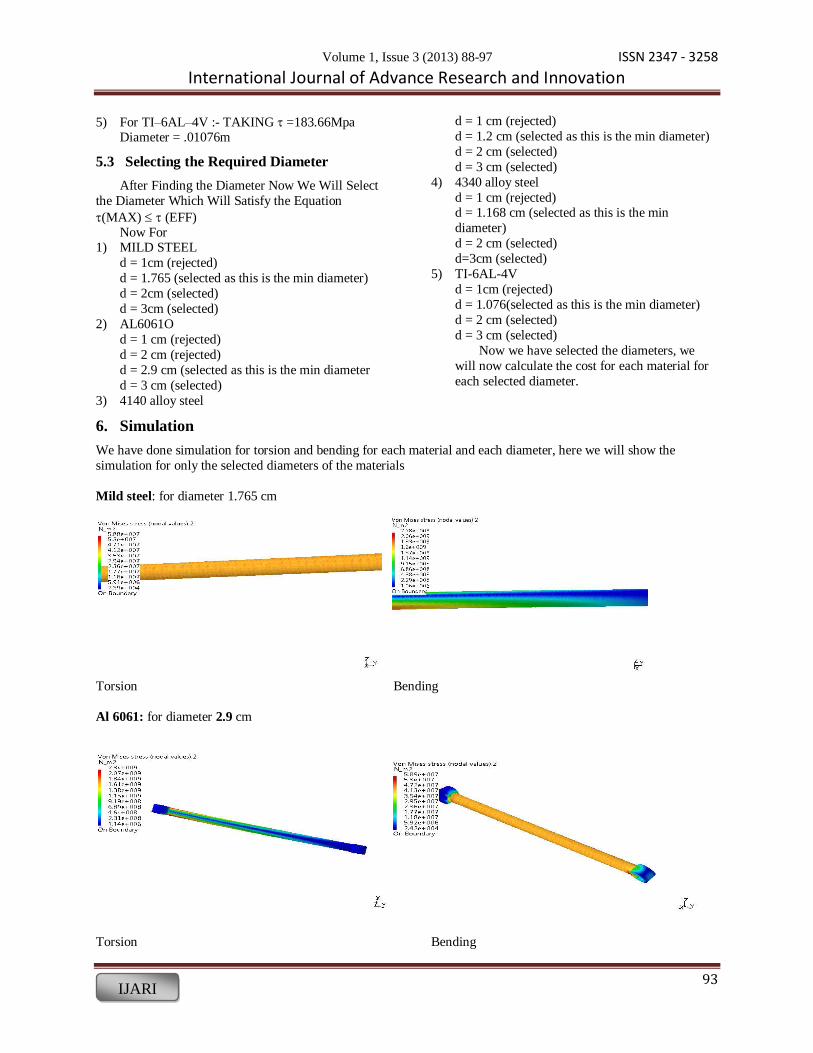
6. Simulation
We have done simulation for torsion and bending for each material and each diameter, here we will show the
simulation for only the selected diameters of the materials
Mild steel: for diameter 1.765 cm
Torsion Bending
Al 6061: for diameter 2.9 cm
Torsion Bending
Volume 1, Issue 3 (2013) 88-97 ISSN 2347 - 3258 International Journal of Advance Research and Innovation
94 IJARI
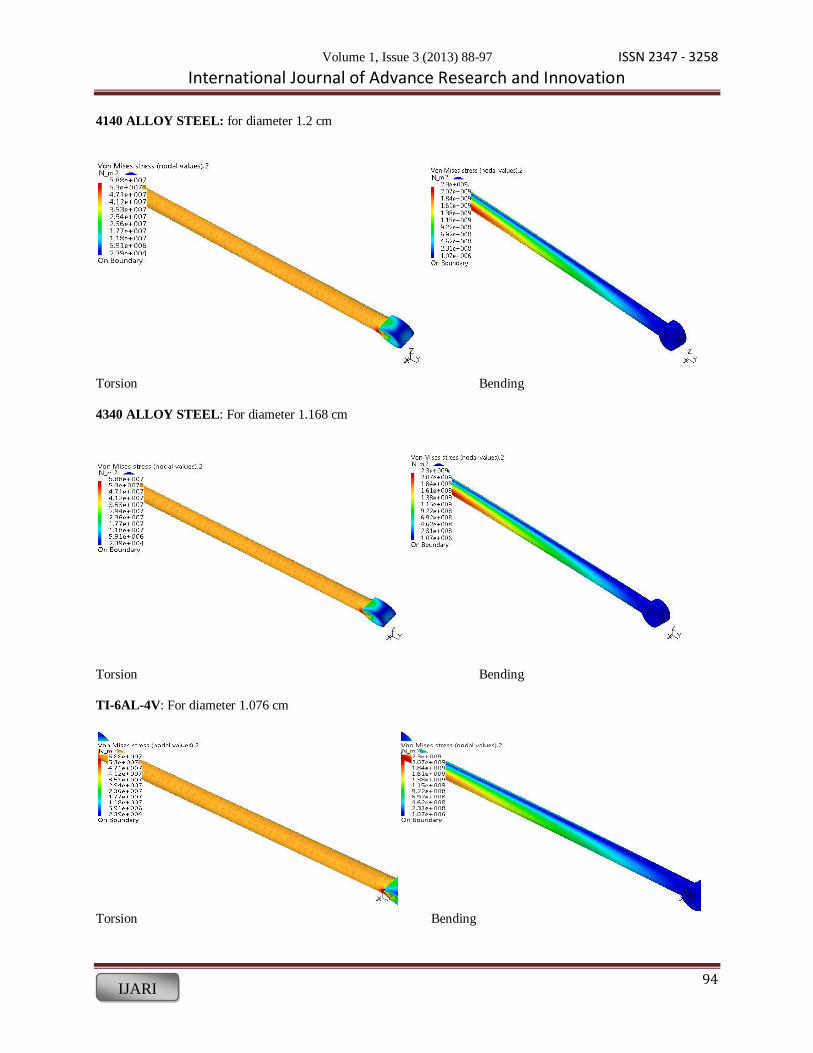
4140 ALLOY STEEL: for diameter 1.2 cm
Torsion Bending
4340 ALLOY STEEL: For diameter 1.168 cm
Torsion Bending
TI-6AL-4V: For diameter 1.076 cm
Torsion Bending
Volume 1, Issue 3 (2013) 88-97 ISSN 2347 - 3258 International Journal of Advance Research and Innovation
95 IJARI
7. Calculations:
For calculation of weight: Total Volume= 2 Volume of the curved ends + Volume of the shaft
Total volume = {(/4) x [(Do) 2 – (Di) 2] x t x 2} +
{(/4) X D 2 x L}
Where
t= thickness (= D)
Do = Outside diameter
Di = inside diameter
L = length of the shaft
By using these formulas we will calculate the
volume for each diameter and then find the mass for
each material by using the relation.
Mass= density volume.
1) MILD STEEL
Density = 7860Kg/m3,
Cost = 34.23/Kg
(I) for diameter = 1.765 cm = .01765m
Total vol. = 1.0110-4m3
Mass = 78601.0110-4m3= .7937 Kg = 793.7 grams
Cost = .793734.23 = 27.169 Rupees Similarly
(II) For d= 2 cm
Total vol. = 1.26710-4m3
Mass= .998 Kg
Cost= 34.23 Rupees
(III) For d = 3 cm
Total vol. = 2.7710-4m 3 Mass= 2.178 Kg
Cost= 74.57 Rupees
2) AL 6061 O
Density = 2700Kg/m3, Cost = 137.48/Kg
(I) for diameter = 2.9 cm = .0290 m
Total vol. = 2.59610-4m3
Mass = 27002.596 x 10-4m3 = .7011 Kg = 701.1 grams
Cost = .7011137.48 = 94.29 Rupees
(II) For d = 3 cm
Total vol. = 2.7710-4m3 Mass= .7479 Kg
Cost = 102.82 Rupees
3) 4140 ALLOY STEEL
Density = 7810Kg/m3,
Cost = 163.62/Kg
(I) for diameter= 1.2 cm = .0120
Total vol. = 0.49x 10⁻⁴m3
Mass = 78100.49 x 10-4m3 = .3853 Kg = 385.3 grams
Cost = .3853163.62 = 63.05 Rupees
(II)Similarly
For d = 2 cm
Total vol. = 1.2710-4m3
Mass = .99187 Kg
Cost = .99187 x 163.62 = 162.28 rupees
(III) Similarly
For d = 3 cm
Total vol. = 2.77 x 10⁻⁴m3
Mass = 2.16 Kg
Cost = 354 Rupees
4) 4340 ALLOY STEEL
Density = 7800Kg/m3, Cost = 180/Kg
(I) for diameter = 1.168 cm = .011680 m
Total vol. = .4695x 10-4 m3
Mass = 7800 x 0.4695 x 10-4m3 = .36621 Kg =
366.21 grams
Cost = .36621 x 180 = 66 Rupee
(II) Similarly for d = 2 cm
Total vol. = 1.27 x 10⁻⁴m3
Mass = .9906 Kg
Cost = 178.3 Rupees
(III) Similarly for d = 3 cm
Total vol. = 2.77 x 10⁻⁴m3 Mass = 2.1606 Kg
Cost = 389 Rupees
5) TI-6AL-4V
density = 4430Kg/m3,
Cost = 3500/Kg
(I) for diameter = 1.076 cm = .01076 m
Total vol. = .3743 x 10-4m3
Mass = 4430 x 0.3743 x 10-4m3 = .1658 Kg =
.1658 grams
Cost = .1658 x 3500= 580.35 Rupees
(II) Similarly for d = 2 cm
Total vol. = 1.27 x 10⁻⁴m3 Mass = .5626 Kg
Cost = 1969.135 Rupees
(III) Similarly for d = 3 cm
Total vol. = 2.77 x 10⁻⁴m3
Mass = 1.22 Kg
Cost = 4300 Rupees
Volume 1, Issue 3 (2013) 88-97 ISSN 2347 - 3258 International Journal of Advance Research and Innovation
96 IJARI
8. The Selected Material
1) 4140 alloy steel having diameter d = 1.2 cm = 0.012m having weight 385.3 grams and having
cost 63.05 Rupees, if we use this material the
weight reduced will be = 0.588 - 0.3853 =
0.2027 Kg
2) 4340 alloy steel having diameter d = 1.168 cm =
0.01168 m having weight 366.21 grams and having the cost of Rs 66, if we use this material
the weight reduced will be = 0.588 - 0.36621 =
0.2218 Kg
3) TI-6AL-4V having diameter d = 1.076 = .01076
m having weight .1658 grams is the lightest and
but having the cost of Rs 580, if we use this
material the weight reduced will be = 0.588 –
0.1658 = 0.422 Kg
After looking up on all possible options we have
short listed 3 materials but in final we have selected
“4340 alloy steel”
Because it is lighter than 4140 and having better yield
strength.
On the other hand TI-6AL-4V is rejected only
because of the high cost as it possesses great yield
strength and is very light.
So we have finally selected the material
Material : - 4340 alloy steel Weight : - 366 grams
Suggested diameter : - 1.168 cm = .01168m
Density : - 7800 Kg/m3
Poisson Ratio : - 0.3
Young's modulus : - 207 Gpa
Yield strength : - 862 Mpa
9. Effect on Fuel Consumption
We know the weight of the original smaller shaft =
588 grams
And the weight of the original larger shaft =828
grams
Now with the new shaft material suggested the
weight of smaller shaft coming = 366 grams
Having a reduction of 37.75 %
So the total weight of the original shaft = 1416 grams
And the total weight of the new shaft = 881 grams
So the net reduction = 1416 – 881 = 535 grams
As a general data know that
Price of CNG = Rs 40 / Kg Mileage of a 3 wheeler = 35 Km / Kg
Now we know that fuel economy (F) and reduced
mass (M) are inversely proportional
F inversely proportional M
It means that when mass is reduce fuel economy
increases
By a certain thumb rule we have found out that
F = - 0.0064 X M
where F is in mpg (Miles Per Gallon) which is =
425.144 m / Kg and M is in Pounds which is = 453.592 grams
Now converting the difference into pounds, 535
grams, we get = 1.18 pounds
Putting the value in the equation we got
F = 0.007552 mpg
now converting it in meters / Kg we got = 3.21 m /
Kg
As the CNG in market is available to us in RS / Kg
So we have to convert liters into Kg
As per standard data ,we got 6 liters of CNG = 1 Kg
of CNG
so 1 liters of CNG = 1/6 Kg of CNG So the increased mileage will come out
= 3.21 x 6 meters / Kg
= 19.26 meters / Kg
so the net mileage = 35019.26 m / Kg
and the actual mileage is 35000 m / Kg
Therefore comparing both, we got consumption of
fuel = 0.99945 Kg
now we know that CNG costs us Rs 40 / Kg
So after comparison we got the price of consumption
as = Rs 38.78
therefore a decrease of Rs 0.22 / Kg Now if we compare the prices of newly made shaft
and the original shaft we have a approx difference in
money of
MPR of the original smaller + larger shaft
= Rs 130+190 respectively
= Rs 320
And MPR of newly made shaft = Rs 210 + 280
approximate
The price is a combination various process such as
finishing and grinding etc.
Now the increase price
= Rs (210 + 280) – (130 + 190) = Rs 490 – 320
= Rs 170
So now we have an increment in the price of the shaft
by = Rs 170
Now we know the 3 wheeler will save Rs 0.22 / Kg
and if we estimate an average consumption of 6 Kg a
day
the auto can save Rs 1.32 a day
the auto will eliminate the extra price of Rs 170
occurred due to use of new parts in 129 days.
As 1.32 x 129 = Rs 170.28 If we estimate auto's life as 6 years then the net
reduction in fuel consumption in Rs is

Volume 1, Issue 3 (2013) 88-97 ISSN 2347 - 3258 International Journal of Advance Research and Innovation
97 IJARI
= (6 x 12 x 30 x 1.32) – 170 = Rs 2851.2 – 170
= Rs 2681.2
Sometimes the shaft ends can worn out in approx
1.5 years
In that case the net profit
= (1.5 x 12 x 30 x 1.32) – 170 = 712.8 – 170
= Rs 542.8
10. Future Aspects
Though we have done some testing which are commonly used to design a shaft. There are other tests which may be required for different case. Vibration analysis we have not included which may be useful and can alter the design parameter. Some other tests like creep, fracture, fatigue can be useful for the optimum design.
References
[1] Ultra-heavy Axle Loads: Design and
Management Strategies for Mine Pavements by
Roger Thompson Curtin University of
Technology.
[2] Study Of Axle Overloading On Rural Roads By
S.S. Kolo, (Civil Engineering Department,
Federal University of Technology, Minna,
Nigeria) [3] Research to Improve Wheel and Axle
Composition, Properties and Designs CAMRON
LONSDALE, Standard Steel, LLC, Burnham,
PA
[4] Allowable Systematic Axle Load Measurement
Error for Pavement Design by Haider, Syed
Waqar Michigan State University, East Lansing
[5] Impact of Systematic Axle Load Measurement
Error on Pavement Design Using Mechanistic-
Empirical Pavement Design Guide.By Syed
Waqar Haider, Ronald.S. Harichandran and Monther.B. Dwaikat
[6] Design and Control of a Passively Steered, Dual
Axle Vehicle. By Michael Wagner
[7] Ford Escort Rally Preparation by C Reynolds
[8] STA190P05a11_TECNOLOGIA.indd by
anonymous
[9] VPW-07-08catalog.indd by dodge vintage power
wagons
[10] Workshop Manual L200 Made by MMSE
[11] Rear Axle Servicing by Audi
[12] Structural Design Of Composite Drive Shaft For
Rear-Wheel Drive Engine K.V.N. Parvathi , Ch.
Prabhakara Rao
[13] S. Pappada, R. Rametto "Study of a composite to
metal tubular joint, Department of Materials and
Structures Engineering, Technologies and
Process CETMA , Italy" (2002).
[14] J. Reimpell and H. Stroll, "The automotive
chassis: engineering principles, Society of
Automotive Engineers, New York", (1996).
[15] A. K. Kaw, "Mechanics of Composite Materials,
CRC Press", (1997). [16] N. Rastogi, "Design of composite drive shafts
for automotive applications, Visteon
Corporation, SAE technical paper series" (2004).
[17]P. K Mallick and Newman, "Composite
Materials Technology", Hanser publishers, 206-
210 (1990)
[18] 21048CM-Ch_07.qxd by Mark
[19] Rear Axle, Differential and Related Components
by Jon Seymour
[20]P.S. Rao, D. Roccaforte, R. Campbell,
"Developing an ADAMS model of an automobile using test data", SAE Technical
Paper 2002-02-1567, 2002