Embed Size (px)
Citation preview

Modeling climate mitigation and economic growth in relation to employment and skills in South Africa
Jules Schers, CIRED / ENPC / AgroParisTech
Co-Authors: Frédéric Ghersi and Franck Lecocq
Supported by: AFD, SMASH, and the Chair of prospective modelling for sustainable development at ENPC
International Energy Workshop Cork, Friday 3 June 2016

Content
Why a "CGE" exploration of energy & labour?
Modelling Objectives
A not-so-short presentation of IMACLIM-SA
Drivers of growth & reference projection
Scenarios for CO2 tax revenue recycling
Approach to modelling labour by skill in a CGE
Results by level of skill
Work-in-progress & Conclusion
2 / 22

Why a "CGE" exploration of energy & labour?
3 / 22
High hopes (new economic activity) and big fears
(unemployment) around "greening" and growth
Big issue for South Africa with unemployment at 25%
(officially) to 39% ("broad")
Usually analyses focus on direct and indirect employment
effects: Renewables & Efficiency vs. Fossil Fuel use and supply
but… Debate asks for analysis of macro-economic feedbacks
on employment (in all industries)

Modelling objectives: capturing constaints
Understand implications of carbon tax-driven climate
mitigation for economic development of South Africa
Capture constraint of electricity infrastructure "lock-in"…
… and other second-best features = non-energy constraints
on economic development:
Labour market has significant impact on economic cost of an
energy transition (Guivarch et al, 2011)*
Relevant for South Africa: very high unemployment among
non- & low educated labour, but shortage of high educated
4 / 22 * Guivarch, C., R. Crassous, O. Sassi, and S. Hallegatte (2011). The costs of climate policies in a second-best world with labour market imperfections. Climate Policy, vol.11:1, pp.768-788

Characteristics of IMACLIM-SA
Open economy, hybrid “CGE”, in a 1-step projection from 2005 to 2035 calibrated on “hybrid” data:
10 Products/sectors, of which 5 energy
5 Household classes
Second-best features:
No foresight, non-linear simulation (not optimisation)
Fixed (agent-specific) mark-up prices
Rigid real wages: CPI indexed wages in a wage curve
ELC sector (production) technology is BU-informed Leontief
5 / 22
Hybridisation
6 / 22

Cost structure domestic production
7 / 22
Cost structure per unit of output
λ_ls1 λ_ls2
κ_1 κ_2
α_11 α_12
α_21 α_22
λ_hs1
λ_ms1
λ_hs2
λ_ms2
Energy Sector (1) Non-energy sector (2)
L Medium-skill (ms)
L High-skill (hs)
Non-energy sector (2)
Energy Sector (1)
K (CFC)
L Low-skill (ls)

Nested CES KLEM production function
8 / 22
Y
KLE MatCOA
GASE KL
OIL
REF L1 KL23
KL3 L2ELC
MAN
EIN
LSS
HSS
Constant Elasticity of Substitution (CES)
Fixed production coefficients (Leontief)
K L3
TRA

Electricity sector based on SA TIMES model
Technical coefficients for inputs to electricity based on
outcomes of the South Africa TIMES model of the ERC of
Univ. of Cape Town*
PJ fuel per PJ of ELC
Units of capital per PJ of ELC
Assumptions to link O&M costs to input of labour and volume
of goods&services (non-energy) per PJ of ELC
SATIM simulations include SA’s Integrated Resource Plan
(updated) + R100 and R300 CO2 tax levels * Thanks to the support of the Energy Research Centre (ERC) of the University of Cape Town. For more info on SATIM, see: ERC. 2013. Assumptions and Methodologies in the South African TIMES (SATIM) Energy Model. Version 2.1, 2013/04/08. Systems Analysis & Planning Group, Energy Research Centre, University of Cape Town, Cape Town

Nested CES consumption function
10 / 22
U
COMP EAG
REF(above basic need)
ELC(above basic need)
EIN MAT LSS HSSTRA(above basic need)
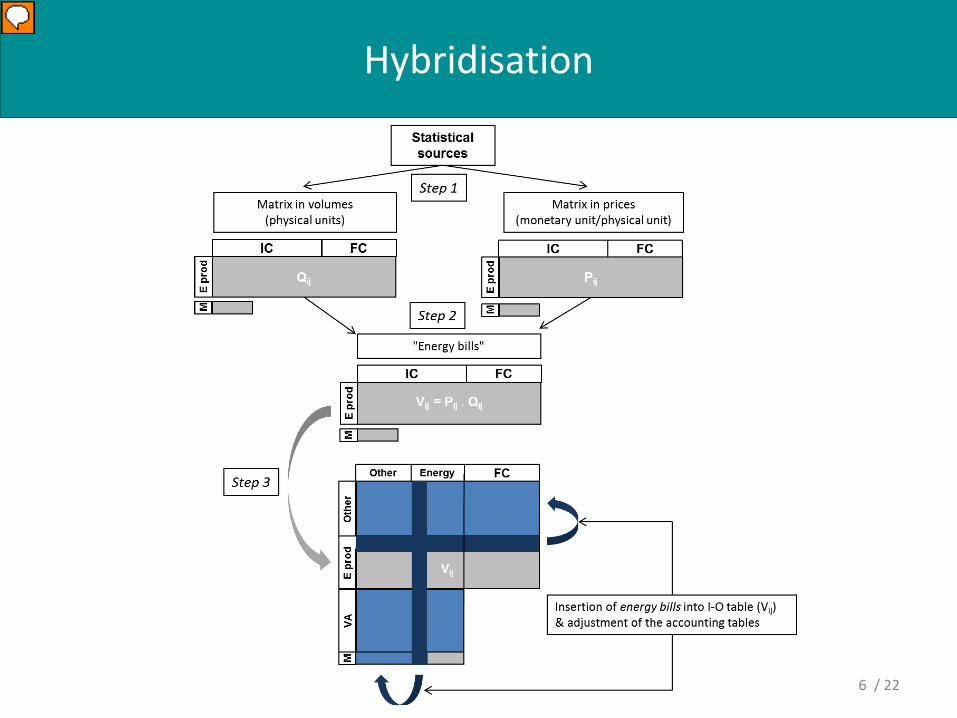
11 / 22
Quantities
L_ls1 L_ls2
K_1 K_2
L_hs1 L_hs2
L_ms1 L_ms2
IC_11 IC_12
IC_21 IC_22
X_1
X_2
Energy Sector (1) Non-energy sector (2)
Y_1 Y_2
R_1 R_2
Exports
M_1 M_2
Total Uses
U_1
U_2
FC_1
FC_2
Final Consumption Gov.
G_1
G_2
Investm.
I_1
I_2
L Medium-skill (ms)
L High-skill (hs)
Total Resource (R)
Imports (M)
Dom. Prod. (Y)
Non-energy sector (2)
Energy Sector (1)
K (CFC)
L Low-skill (ls)
Internat. trade-
offs

12 / 22
Values … and… Income and Expenditure by Agent
CFC_1 CFC_2
RV_1 RV_2
NOS_1 NOS_2
TY_1 TY_2
SAL_hs1 SAL_hs2
SAL_ms1 SAL_ms2
SAL_ls1 SAL_ls2
Energy Sector (1) Non-energy sector (2)
TC_1 TC_2
IV_11 IV_12
IV_21 IV_22
MV_1 MV_2
Rest o/t World (ROW)
XV_1
Firms (S)
PC_hs
PC_ms
PC_ls
PI_G
Wage_hs
Wage_ms
Wage_ls
Total Uses
UV_1
UV_2
Households (H) Government (G)
GV_2
FV_1
FV_2
Trade Balance
XV_2
GOS_H GOS_G GOS_S
TY_G
SoCo_hs
SoCo_ms
SoCo_ls
Total FC_H Total FC_G Total IV_G
VA_1 VA_2 PI_H
L Medium-skill (ms)
L High-skill (hs)
PI_STotal Factor (VA) / Primary (PI) income
Investment
IV_2
Total Resource (R)
Imports (M)
Dom. Prod. (Y)
Non-energy sector (2)
Energy Sector (1)
Transport & Commerce margins
Taxes on Prod (TY)
Net Profits (NOS)
K (CFC)
L Low-skill (ls)
Inco
me
Dist
ribut
ion,
Ta
xes
and
othe
r tra
nsfe
rs
Pric
es,
cost
s,m
argi
ns,
and
taxe
s

13 / 22
… and… Income and Expenditure by Agent
Rest o/t World (ROW)
Firms (S)
PC_hs
PC_ms
PC_ls
PI_G
Wage_hs
Wage_ms
Wage_ls
Households (H) Government (G)
Trade Balance
GOS_H GOS_G GOS_S
TY_G
SoCo_hs
SoCo_ms
SoCo_ls
Total FC_H Total FC_G Total IV
GDI_H GDI_G GDI_S
SFC_H SFC_G
PI_H
GDI_H
L Medium-skill (ms)
L High-skill (hs)
SFC_S
BUD_H BUD_G BUD_S
GFCF_H GFCF_G GFCF_S
SFC_ROW
PI_S
Transfers (taxes, interest, benefits, other)
Total Factor (VA) / Primary (PI) income
D_ROW D_H D_G D_S
Investment
Total GFCF
Total Resource (R)
Imports (M)
BUD_ROW
Transport & Commerce margins
Transfers
Gross Disposable Income (GDI)
Net Saving or Borrowing (SFC)
Total Budget (BUD)
Gross Fixed Capital Formation (GFCF)
Taxes on Prod (TY)
Net Profits (NOS)
K (CFC)
L Low-skill (ls)
Inco
me
Dist
ribut
ion,
Ta
xes
and
othe
r tra
nsfe
rs

Labour market with equilibrium unemployment
Imperfect labour markets through wage curve with wages fixed to consumer price index (CPI) and Labour Productivity (LP) gains :
𝑤𝑤𝑤𝑤𝑠1 − 𝑠𝑠𝑤𝑠𝑤𝐿𝐿𝐿𝐿𝐿𝐿,𝑠 ∗ 𝐶𝐶𝐶 + 𝑠𝑠𝑤𝑠𝑤𝐿𝐿𝐿𝐿𝐿𝐿,𝑠 ∗ 𝐿𝐶𝑠𝐿𝐿_𝑤𝑤𝑔𝑔𝑠 ∗ 𝐶𝐶𝐶)
= 𝑤𝑤𝑤𝑤𝑠,0 ∗𝑤𝑤𝑤𝑤𝑠,0
𝑤𝑤𝑤𝑤𝑠,𝑡
𝜎𝑤𝑤
14 / 22

Drivers of Growth & Reference Projection (RP)
No damage function for impacts of climate change
Productivity increase:
Capital: +2.0% /yr
Labour (all skill levels): +1.0% /yr
Materials & Services: +0.25%/yr
Trend in volume of exports: +1.5%/yr
Outcomes: GDP/cap Index
Broad Unempl.
CO2 emis. Index
High/Low inc. ratio
Base Year (BY, 2005) 100 39% 100 42
Ref. Proj. (RP, 2035) 216 29% 181 41
15 / 22

Scenarios for CO2 tax revenue recycling
Basic approach of CO2 tax (Ctax) scenarios:
Ctax levels: 100 and 300 ZAR2005/tCO2 (18 and 55 USD2012/tCO2) applied to direct emissions of energy consumption
No border tax adjustment, no Ctax export rebates, No foreign or international Ctax
Ctax Revenue Recycling schemes:
1. Reduce public deficit
2. Reduction of sales tax on final consumption
3. Reduce income and revenue taxes of companies & households
4. Increase government expenditure
5. Lumpsum transfer to all households
16 / 22

Results of CO2 tax scenarios
Double dividend for Ctax 100 ZAR2005/tCO2 + Sales tax reduction
GDP/cap. (BY = 100)
Broad Unempl.
CO2 emis. vs. Ref. Proj.
High/Low inc. ratio
Reference Projection 216 29% - 41
Ctax 100 + recycling
Deficit reduction 200 33% -25% 41
Sales Tax reduction 218 25% -20% 41
Income Tax reduction 201 31% -24% 42
Higher Gov. Expenses 205 28% -23% 40
Lumpsum transfer 201 32% -24% 30
Ctax 300 + recycling
Sales tax reduction 209 26% -42% 41
17 / 22

Approach to modelling labour segmented by skill
Common approach: Skill of labour ≈ Worker’s education level Future educational attainment based on a conservative estimate versus
IIASA projections for South Africa (K.C. et al., 2013)*
Initially, using "common" approach, we project more high skill (28%) than low skill (21%) unemployment in 2035 Due to an increase / decrease of their share in labour force Results obtained with strong complementarity between capital and
high-skill labour
We need to reconsider the dynamics of supply and demand of labour by level of skill
* K.C., S., et al. 2013. Summary of Data, Assumptions and Methods for New Wittgenstein Centre for Demography and Global Human Capital (WIC) Population Projections by Age, Sex and Level of Education for 195 Countries to 2100. IIASA, Laxenbourg 18 / 22

Dynamics of skill-segmented labour in a CGE
1. Definition: What is labour by level of skill? Level of skill of the worker, e.g. the level of education: Constant Educational
Attainment definition (CEA)
Characteristic of a job type in production, regardless of labour supply (positional): Constant Shares of Labour Force definition (CSLF)
A combination? Supply of high-skilled labour goes up with degree, but requirements for jobs go up too: Upgraded Qualifications definition (UQ)
2. What are the drivers for change of skill-intensity of production: Changing productivity Relative factor prices Other drivers?
3. What is consumption’s role in demand for skills: Are high-skill intensive goods in higher demand when people get richer? Do they have a higher income-elasticity than other goods?
19 / 22

Results by level of skill
We now obtain a sharp decrease of unemployment for high skill
High skill labour also relatively benefitting most from revenue
recycling through sales tax reduction.
What if one partly recycles Ctax revenue into investing in skills?
Result: if productivity effect is bigger than +1% annual productivity
growth, then GDP/capita grows stronger than emissions, but only
benefiting high skill labour
20 / 22

Work in progress
Relative CPI Real Effective Exchange Rate which impacts the
comparability of IMACLIM-SA and SATIM runs’ price & cost
trajectories
Other parametrisation issues: big trade balance surpluss and
questions around solving the capital market
Differentiation in productivity developments by sector (and skill)
Diffferentiation in developments in international prices, e.g.
energy vs. non-energy
21 / 22

Conclusion
South Africa can achieve its economic, social and environmental
objectives through recycling of carbon tax revenue, likely by
reducing VAT + additionall equity measures
South Africa’s INDC can be achieved with a CO2 tax of around
ZAR2005 300/tCO2 (USD2012 55) by 2035
To assess economic growth and employment by level of skill in a
CGE setting we need an approach beyond "degree = skill"
CO2 tax revenue recycling through investment in skill of labour
need a tailored approach in order to reduce inequality. 22 / 22

Thank you for your attention!
Jules Schers CIRED, France
schers | at | centre-cired.fr
Schers, J., F. Ghersi, F. Lecocq, F. Grazi (ed). 2015. Green Growth and its Implications for Public Policy – The Case of South Africa. Etudes de l’AFD, no.4. Agence Française de Développement (AFD). Paris, December 2015. (and a shorter working paper following soon)