Embed Size (px)
Citation preview
Modeling Common Cause Failures
of Thrusters on ISS Visiting Vehicles
PSA 2015
International Topical Meeting on Probabilistic Safety Assessment and Analysis
Sun Valley, Idaho, April 2015
Megan Haught
Bruce Reistle
https://ntrs.nasa.gov/search.jsp?R=20150006971 2018-05-25T13:57:23+00:00Z
COMMON CAUSE FAILURES
Common Cause Failures (CCFs) are dependent failures of (usually) redundant
items not otherwise accounted for in a probabilistic risk model. Common cause
failures can be due to many factors, including:
• Environmental factors (vibration, thermal stress, humidity, etc.)
• Manufacturing defects
• Human error (installation error, improper maintenance, etc.)
• Design error
CCFs are not the same as single point failures (e.g., power supply fails causes a
loss of three computers)
Examples of CCF from Shuttle:
• Engine Cut-Off Sensors – Common cause dual and triple failures of the sensors
caused multiple launch scrubs
• PICs – Ten failures on a single mission
• RCS Thrusters – Five instances of two thruster failures on the same mission, and
one instance of three failures
2
COMMON CAUSE MODELS
See NUREG/CR5485 for details about CCF modeling.
• Beta
• Assumes common cause will fail every item
• Is easiest to model
• Is usually used as a placeholder or screening value
• Alpha
• Allows two failures, three failures, etc.
• Modeler must explicitly model all common cause groups
• Best model for small groups (which is usually the case)
• Multiple Greek Letter
• Equivalent to Alpha Model
• Global Alpha
• Uses Alpha model parameters and logic—combines all CCFs into one event
• Pro: Does not require modeler to explicitly model all common cause groups
• Con: Does not include common-cause/independent cross products
(Cross products are almost always negligible)
3
COMMON CAUSE MODEL INPUTS
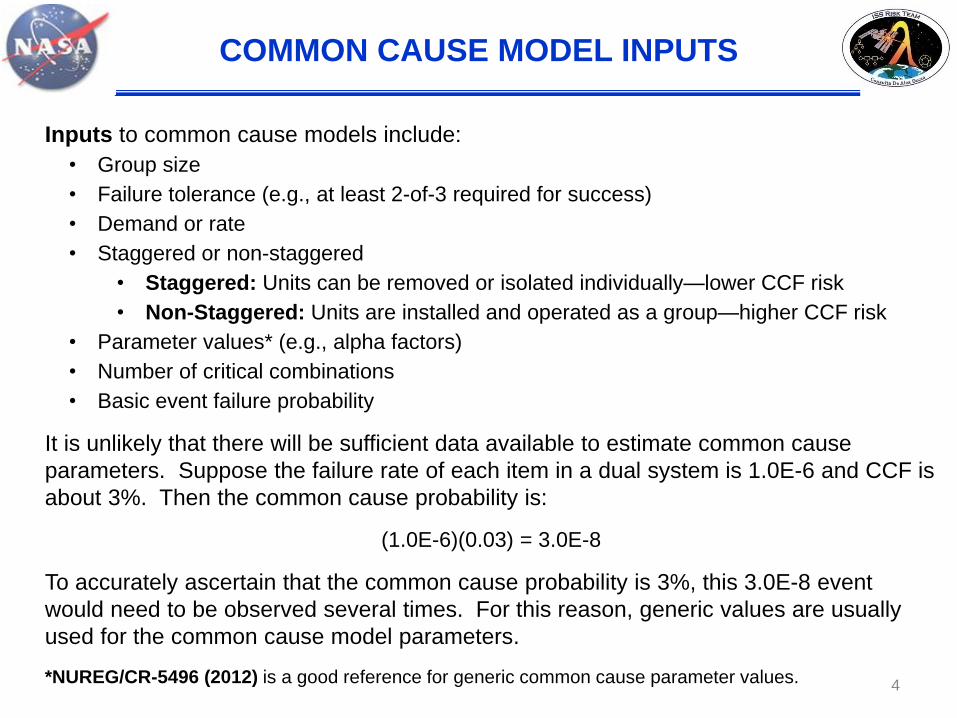
Inputs to common cause models include:
• Group size
• Failure tolerance (e.g., at least 2-of-3 required for success)
• Demand or rate
• Staggered or non-staggered
• Staggered: Units can be removed or isolated individually—lower CCF risk
• Non-Staggered: Units are installed and operated as a group—higher CCF risk
• Parameter values* (e.g., alpha factors)
• Number of critical combinations
• Basic event failure probability
It is unlikely that there will be sufficient data available to estimate common cause
parameters. Suppose the failure rate of each item in a dual system is 1.0E-6 and CCF is
about 3%. Then the common cause probability is:
(1.0E-6)(0.03) = 3.0E-8
To accurately ascertain that the common cause probability is 3%, this 3.0E-8 event
would need to be observed several times. For this reason, generic values are usually
used for the common cause model parameters.
*NUREG/CR-5496 (2012) is a good reference for generic common cause parameter values. 4
ALPHA FACTORS
5
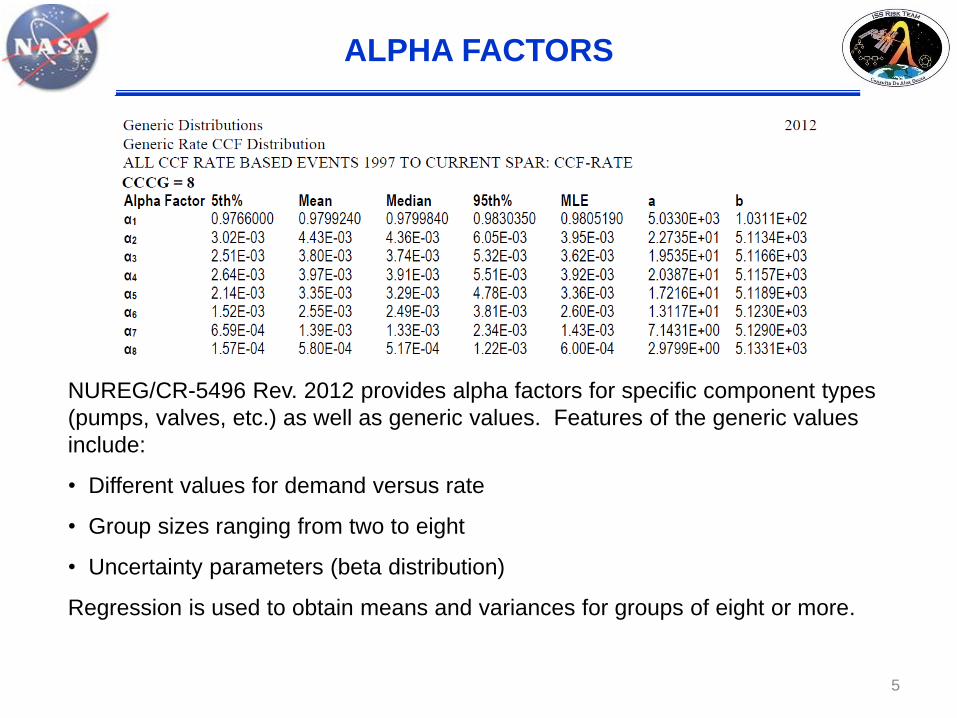
NUREG/CR-5496 Rev. 2012 provides alpha factors for specific component types
(pumps, valves, etc.) as well as generic values. Features of the generic values
include:
• Different values for demand versus rate
• Group sizes ranging from two to eight
• Uncertainty parameters (beta distribution)
Regression is used to obtain means and variances for groups of eight or more.
COMBINATORICS
6
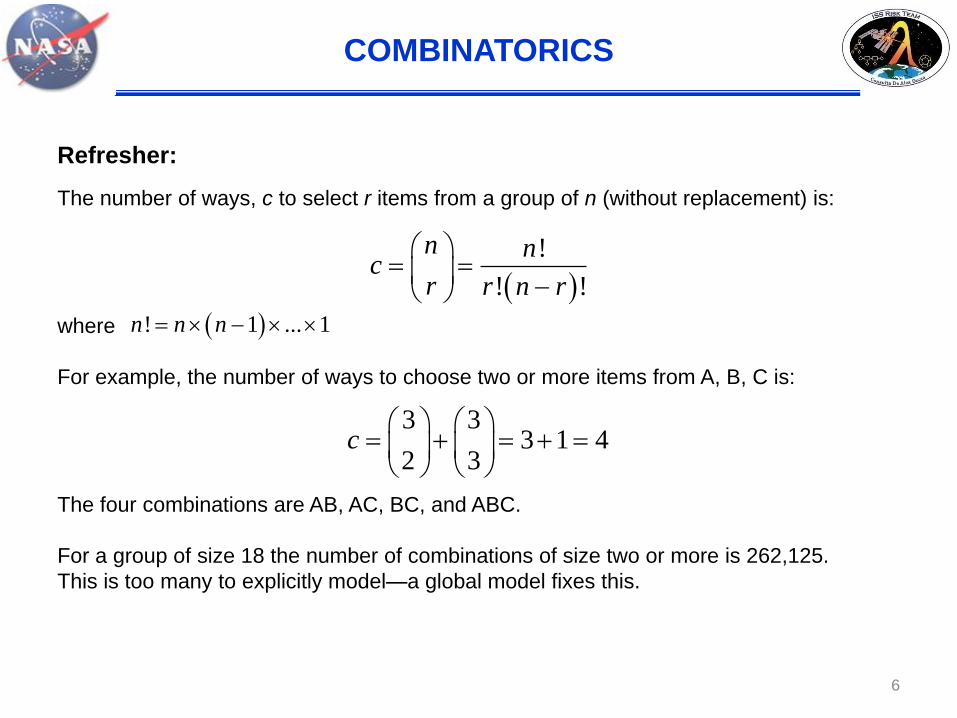
Refresher:
The number of ways, c to select r items from a group of n (without replacement) is:
where
For example, the number of ways to choose two or more items from A, B, C is:
The four combinations are AB, AC, BC, and ABC.
For a group of size 18 the number of combinations of size two or more is 262,125.
This is too many to explicitly model—a global model fixes this.
!
! !
n nc
r r n r
! 1 ... 1n n n
3 33 1 4
2 3c
Staggered Non-Staggered
tkk
m
k Q
k
mcQ
1
1
1
tkk
m
k Qp
k
mcQ
1
1
1
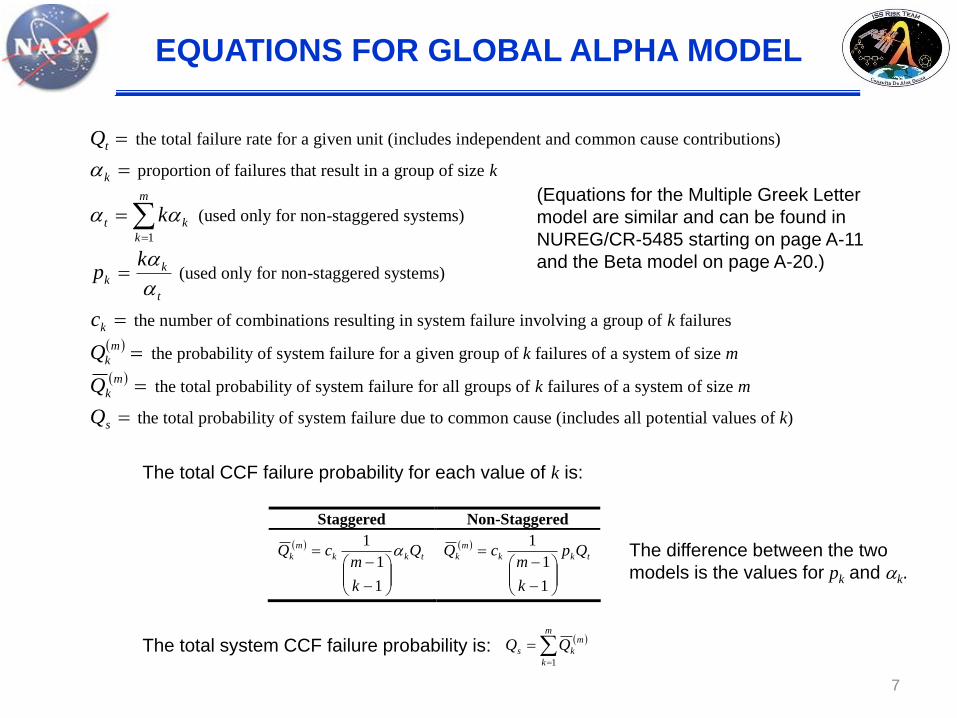
tQ the total failure rate for a given unit (includes independent and common cause contributions)
k proportion of failures that result in a group of size k
m
k
kt k1
(used only for non-staggered systems)
t
kk
kp
(used only for non-staggered systems)
kc the number of combinations resulting in system failure involving a group of k failures
m
kQ the probability of system failure for a given group of k failures of a system of size m
m
kQ the total probability of system failure for all groups of k failures of a system of size m
sQ the total probability of system failure due to common cause (includes all potential values of k)
The total system CCF failure probability is:
m
k
m
ks QQ1
The total CCF failure probability for each value of k is:
The difference between the two
models is the values for pk and k.
(Equations for the Multiple Greek Letter
model are similar and can be found in
NUREG/CR-5485 starting on page A-11
and the Beta model on page A-20.)
EQUATIONS FOR GLOBAL ALPHA MODEL
7
ISS VISITING VEHICLE PROPULSION SYSTEM
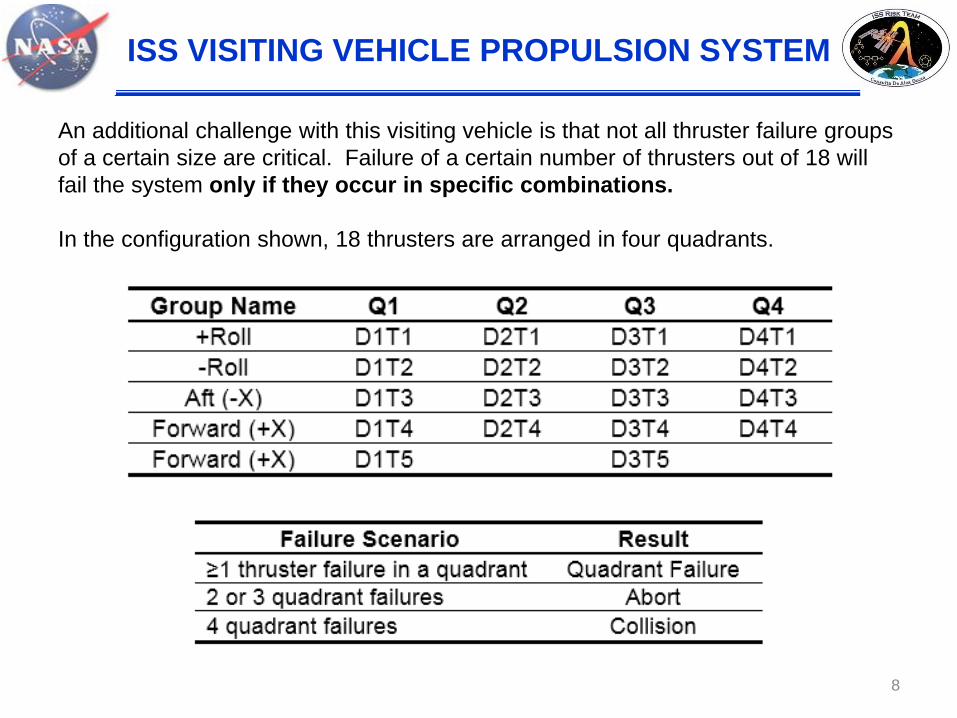
An additional challenge with this visiting vehicle is that not all thruster failure groups
of a certain size are critical. Failure of a certain number of thrusters out of 18 will
fail the system only if they occur in specific combinations.
In the configuration shown, 18 thrusters are arranged in four quadrants.
8
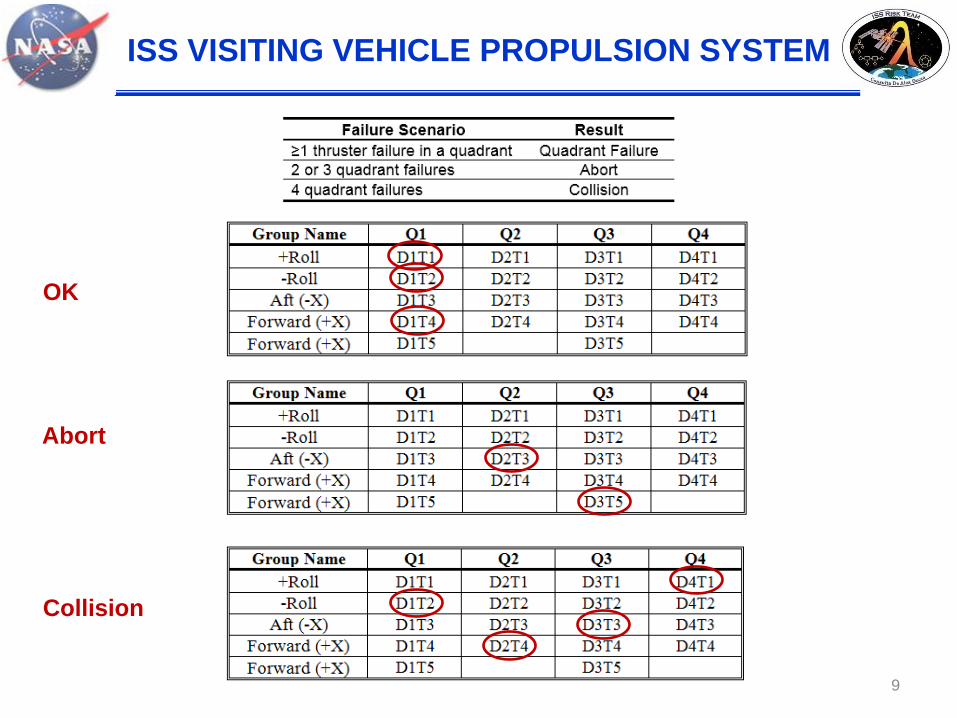
OK
Abort
Collision
ISS VISITING VEHICLE PROPULSION SYSTEM
9

COMBINATORIAL FAILURE LOGIC
Let k equal the number of thruster failures that have occurred.
Consider the critical combinations that lead to Collision (at least one failure in each
of the four quadrants).
When k = 0,1,2,3 there will be no Collision. When k = 4, the result is Collision only
if the failures occur in different quadrants. The total number of Collision failure
groups when k = 4 can be calculated as follows:
Choose both groups of five and
choose one member from each group,
and choose both groups of four and
choose one member from each group:
When k = 5, one group must contain 2 failures and the remaining groups must each
have 1 failure. The group with 2 failures can be of size 4 or size 5:
…it gets complicated pretty quickly.
2 22 2 5 4
4002 2 1 1
10
2 22 5 5 2 4 2 4 4 2 5
1,600 1,200 2,8001 2 1 2 1 1 2 1 2 1
2 failures in a 5 group 2 failures in a 4 group
BRUTE FORCE FAILURE LOGIC
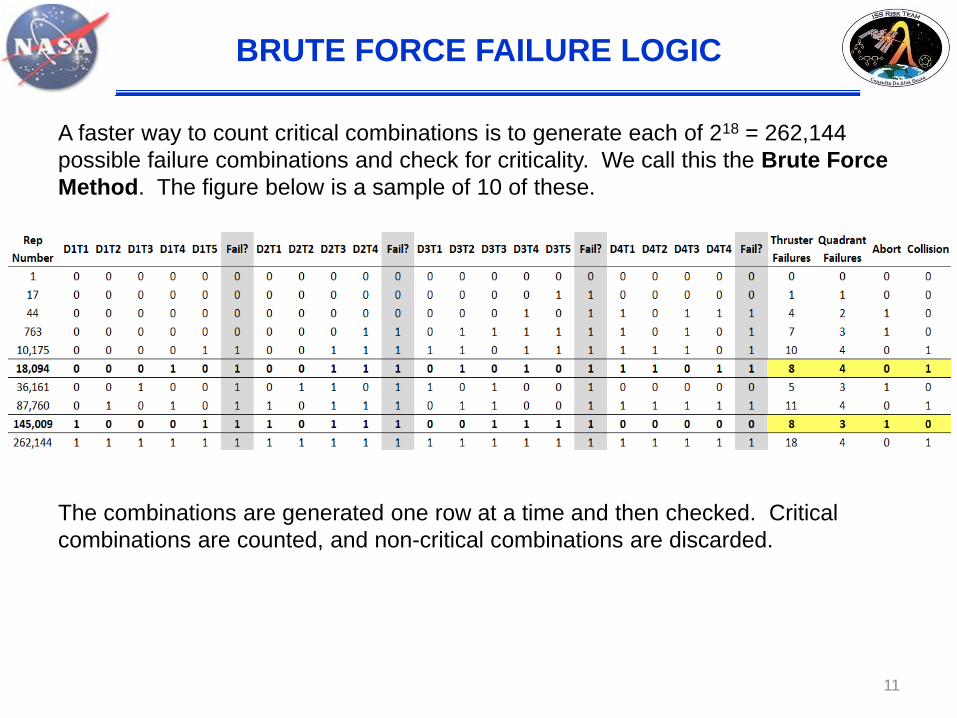
A faster way to count critical combinations is to generate each of 218 = 262,144
possible failure combinations and check for criticality. We call this the Brute Force
Method. The figure below is a sample of 10 of these.
The combinations are generated one row at a time and then checked. Critical
combinations are counted, and non-critical combinations are discarded.
11
COMBINATORIAL FAILURE LOGIC
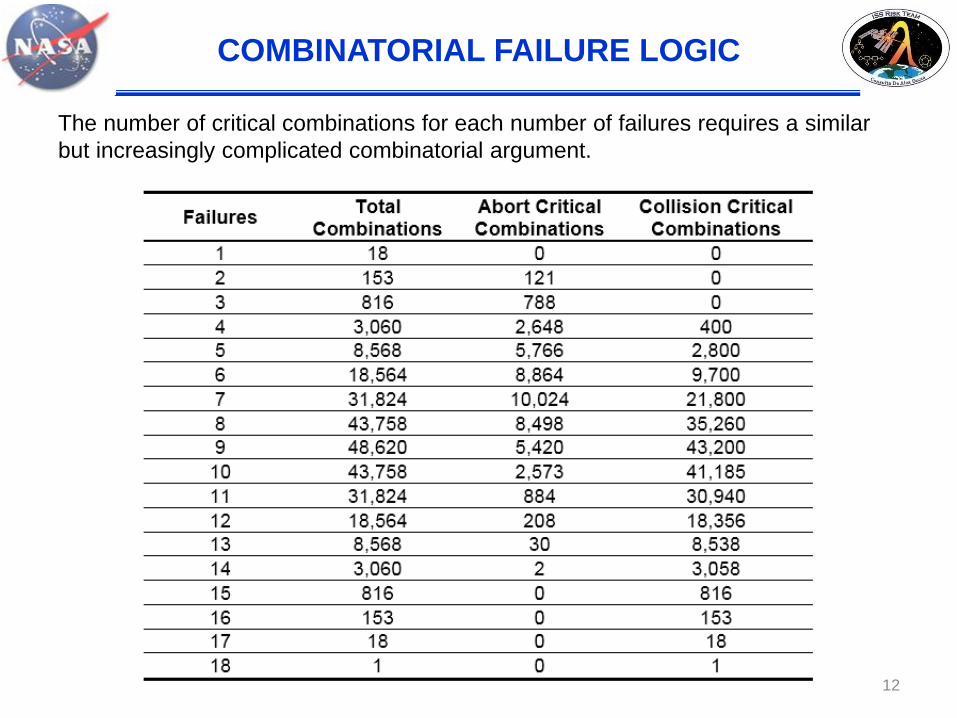
The number of critical combinations for each number of failures requires a similar
but increasingly complicated combinatorial argument.
12
GLOBAL ALPHA MODEL
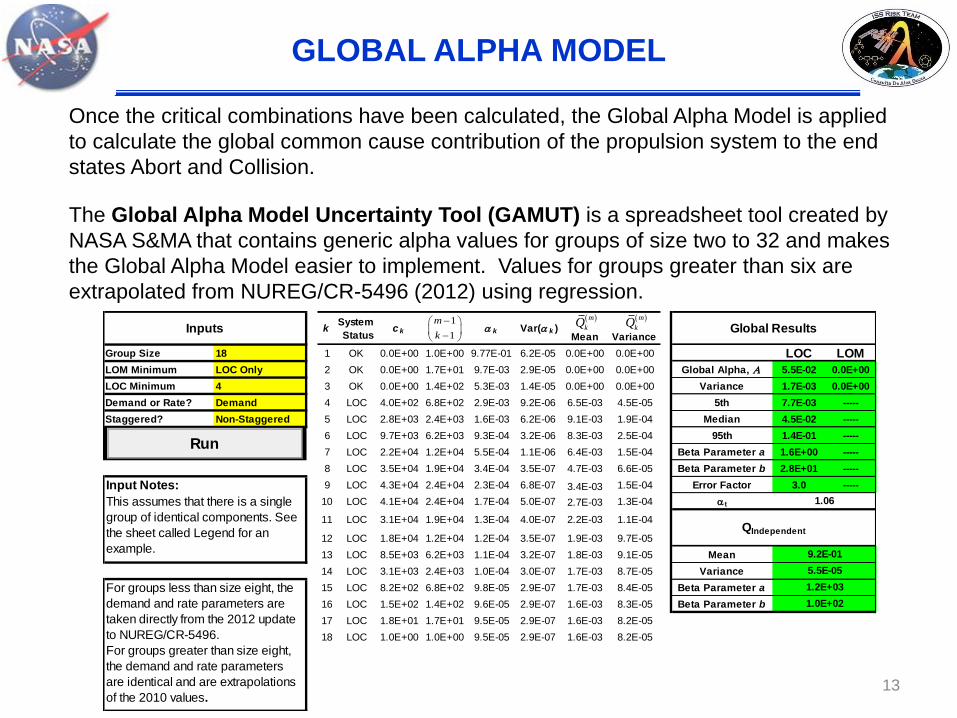
Once the critical combinations have been calculated, the Global Alpha Model is applied
to calculate the global common cause contribution of the propulsion system to the end
states Abort and Collision.
The Global Alpha Model Uncertainty Tool (GAMUT) is a spreadsheet tool created by
NASA S&MA that contains generic alpha values for groups of size two to 32 and makes
the Global Alpha Model easier to implement. Values for groups greater than six are
extrapolated from NUREG/CR-5496 (2012) using regression.
13
kSystem
Statusc k k Var( k )
Mean Variance
Group Size 18 1 OK 0.0E+00 1.0E+00 9.77E-01 6.2E-05 0.0E+00 0.0E+00 LOC LOM
LOM Minimum LOC Only 2 OK 0.0E+00 1.7E+01 9.7E-03 2.9E-05 0.0E+00 0.0E+00 Global Alpha, A 5.5E-02 0.0E+00
LOC Minimum 4 3 OK 0.0E+00 1.4E+02 5.3E-03 1.4E-05 0.0E+00 0.0E+00 Variance 1.7E-03 0.0E+00
Demand or Rate? Demand 4 LOC 4.0E+02 6.8E+02 2.9E-03 9.2E-06 6.5E-03 4.5E-05 5th 7.7E-03 -----
Staggered? Non-Staggered 5 LOC 2.8E+03 2.4E+03 1.6E-03 6.2E-06 9.1E-03 1.9E-04 Median 4.5E-02 -----
6 LOC 9.7E+03 6.2E+03 9.3E-04 3.2E-06 8.3E-03 2.5E-04 95th 1.4E-01 -----
7 LOC 2.2E+04 1.2E+04 5.5E-04 1.1E-06 6.4E-03 1.5E-04 Beta Parameter a 1.6E+00 -----
8 LOC 3.5E+04 1.9E+04 3.4E-04 3.5E-07 4.7E-03 6.6E-05 Beta Parameter b 2.8E+01 -----
Input Notes: 9 LOC 4.3E+04 2.4E+04 2.3E-04 6.8E-07 3.4E-03 1.5E-04 Error Factor 3.0 -----
10 LOC 4.1E+04 2.4E+04 1.7E-04 5.0E-07 2.7E-03 1.3E-04 t
11 LOC 3.1E+04 1.9E+04 1.3E-04 4.0E-07 2.2E-03 1.1E-04
12 LOC 1.8E+04 1.2E+04 1.2E-04 3.5E-07 1.9E-03 9.7E-05
13 LOC 8.5E+03 6.2E+03 1.1E-04 3.2E-07 1.8E-03 9.1E-05 Mean
14 LOC 3.1E+03 2.4E+03 1.0E-04 3.0E-07 1.7E-03 8.7E-05 Variance
15 LOC 8.2E+02 6.8E+02 9.8E-05 2.9E-07 1.7E-03 8.4E-05 Beta Parameter a
16 LOC 1.5E+02 1.4E+02 9.6E-05 2.9E-07 1.6E-03 8.3E-05 Beta Parameter b
17 LOC 1.8E+01 1.7E+01 9.5E-05 2.9E-07 1.6E-03 8.2E-05
18 LOC 1.0E+00 1.0E+00 9.5E-05 2.9E-07 1.6E-03 8.2E-05
5.5E-05
For groups less than size eight, the
demand and rate parameters are
taken directly from the 2012 update
to NUREG/CR-5496.
For groups greater than size eight,
the demand and rate parameters
are identical and are extrapolations
of the 2010 values.
1.2E+03
1.0E+02
Inputs Global Results
This assumes that there is a single
group of identical components. See
the sheet called Legend for an
example.
1.06
QIndependent
9.2E-01
1
1
m
k
Run
m
kQ m
kQ
GLOBAL ALPHA MODEL RESULTS
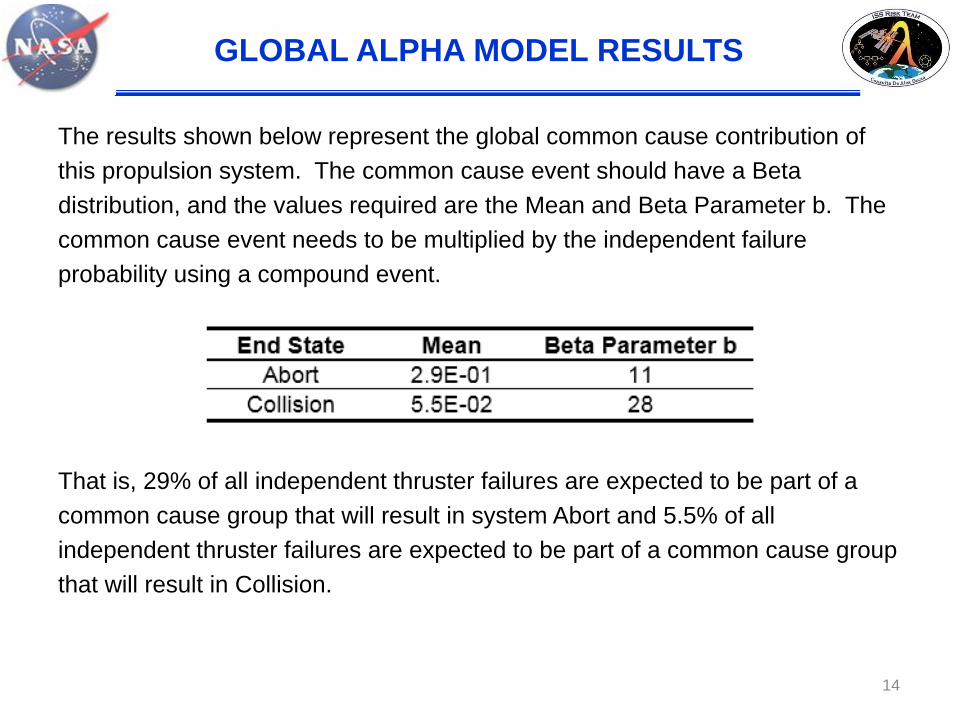
The results shown below represent the global common cause contribution of
this propulsion system. The common cause event should have a Beta
distribution, and the values required are the Mean and Beta Parameter b. The
common cause event needs to be multiplied by the independent failure
probability using a compound event.
That is, 29% of all independent thruster failures are expected to be part of a
common cause group that will result in system Abort and 5.5% of all
independent thruster failures are expected to be part of a common cause group
that will result in Collision.
14
MODELING CONSIDERATIONS
Common Cause failures of the ISS Visiting Vehicle thrusters were previously
modeled using a Beta Model. The Beta Model assumes that any common
cause failure results in the failure of every member of the group, so it cannot be
used to assess the likelihood of Abort.
The generic beta screening value that was used was 1.1E-01 (11%). This was
believed to be conservative.
However, the ISS Visiting Vehicle thrusters comprise a very large group that
can fail with as few as two failures. When k = 2, there are = 153 possible
combinations of two failures, of which 121 are critical (resulting in Abort).
The fraction of failures that are groups of size k = 2 in a group of size 18 is
1.3E-01 (using generic alpha parameters from NUREG/CR-5496). This is
already larger than the beta screening value of 1.1E-01, and is only for a group
of size two; the end result includes common cause failure groups of all sizes.
18
2
15
CONCLUSION
The methodology described here has been used to model common cause of
thrusters and valves on the following systems:
• All ISS Visiting Vehicles, including Shuttle
• Russian Service Module (SM) thrusters
• Beta Gimbal Assemblies (BGAs)
• Low-Impact Docking System (LIDS)
• Multipurpose Laboratory Module (MLM) power feeds
• Functional Cargo Block (FGB) power feeds
The Global Alpha Model is the recommended common cause methodology for
any system with a large number of similar redundant components, particularly
when specific failure combinations are required to fail the system.
16
BACKUP
17
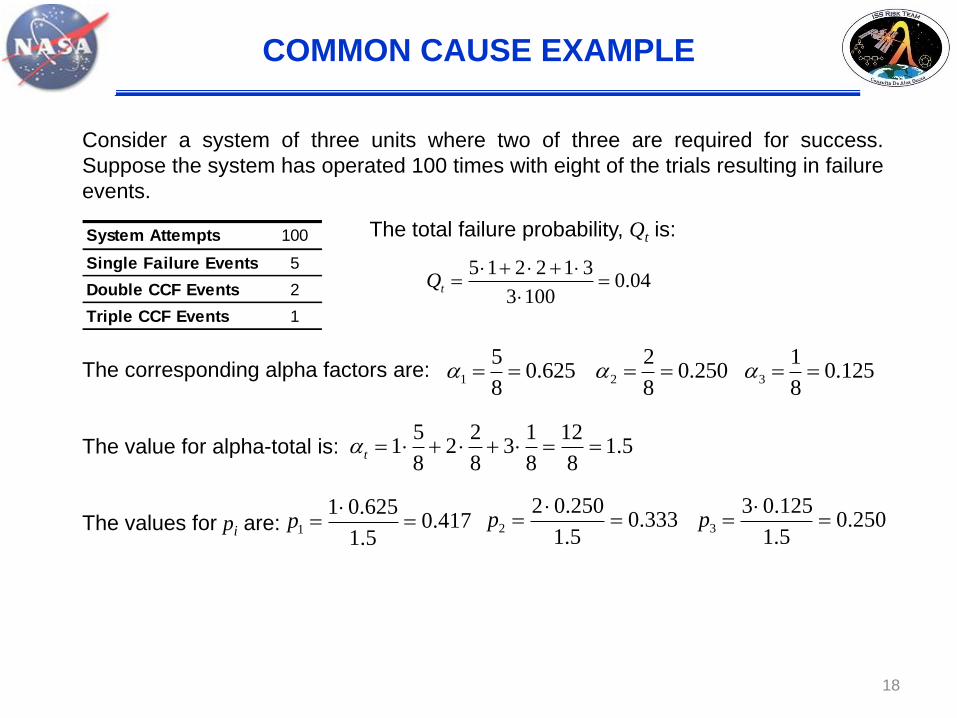
Consider a system of three units where two of three are required for success.
Suppose the system has operated 100 times with eight of the trials resulting in failure
events.
The total failure probability, Qt is:
The corresponding alpha factors are:
The value for alpha-total is:
The values for pi are:
System Attempts 100
Single Failure Events 5
Double CCF Events 2
Triple CCF Events 1
1
50.625
8 2
20.250
8 3
10.125
8
5 2 1 121 2 3 1.5
8 8 8 8t
1
1 0.6250.417
1.5p
2
2 0.2500.333
1.5p
3
3 0.1250.250
1.5p
5 1 2 2 1 30.04
3 100tQ
COMMON CAUSE EXAMPLE
18
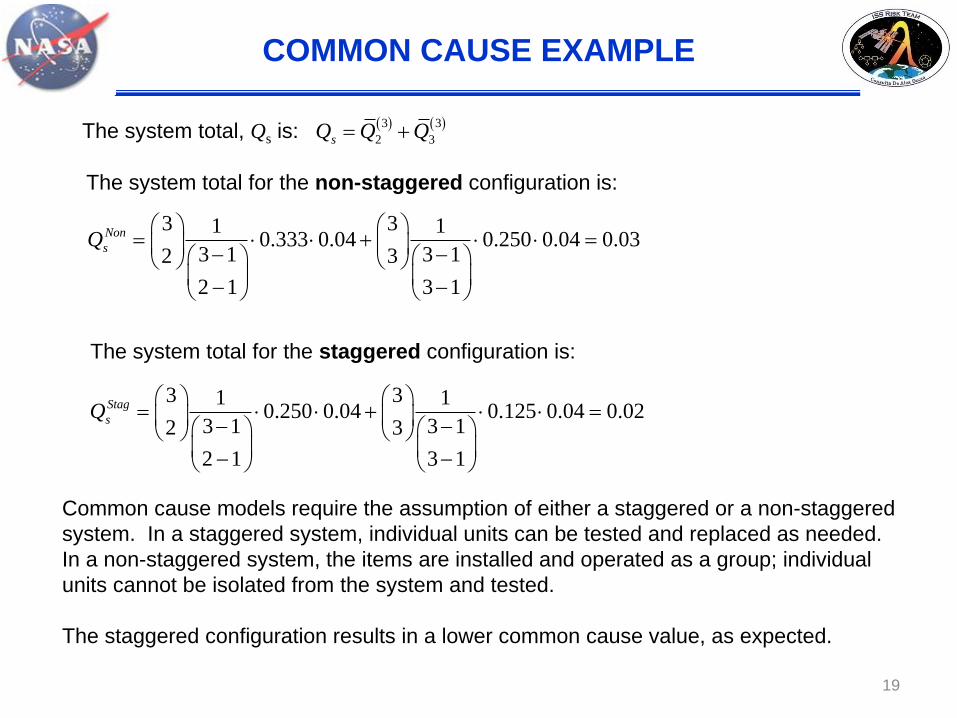
The system total, Qs is: 3 3
2 3sQ Q Q
The system total for the non-staggered configuration is:
3 31 10.333 0.04 0.250 0.04 0.03
3 1 3 12 3
2 1 3 1
Non
sQ
The system total for the staggered configuration is:
3 31 10.250 0.04 0.125 0.04 0.02
3 1 3 12 3
2 1 3 1
Stag
sQ
Common cause models require the assumption of either a staggered or a non-staggered
system. In a staggered system, individual units can be tested and replaced as needed.
In a non-staggered system, the items are installed and operated as a group; individual
units cannot be isolated from the system and tested.
The staggered configuration results in a lower common cause value, as expected.
COMMON CAUSE EXAMPLE
19