Embed Size (px)
Citation preview
Nahrain University, College of Engineering Journal (NUCEJ) Vol.16 No.2, 2014 pp.238-259
832NUCEJ Vol.16 No.2 Ali
Modeling Design of Solar Heating System for Absorption
Refrigeration System with Partial Loads & Studying the
Collectors arrangements
Mohammed Hadi Ali
University of Mustansiriya
Abstract:
This paper presents a modeling
design for a solar heating system to be
used as a driven - powered thermal
energy to a single – stage absorption
cooling system using Lithium Bromide
solution, by using flat – plate collectors,
storage tank, auxiliary heater and 3 –
way valves. The study also goes into
partial load control by flowrate variation
through the generator section and to
study the effects of series and parallel
collector's arrangement arrays on the
solar heating system performance.
The study is focused to evaluate the
performance of the solar heating system
throughout the summer season. The
effects on performance have been
explored for various design variables
and operation conditions.
In this paper, it was reached to a general
formula for a collector outlet
temperature arranged in series and
compared to a parallel arrangement.
The performance calculations indicate
that:
There is no significant
difference in storage tank
temperature for both parallel and
series arrangements.
The collector's outlet
temperature wasn't greatly
affected by the storage tank
capacity (size).
The storage tank temperature
increases with partial load
Percent increases, i.e. as the
thermal load decreases.
Nomenclature:
Ac = Collector aperture area (m2)
Cpg = Specific heat for the Water or
water / glycol mixture in collector (W. s
/ kg. oC)
Cpw = Specific heat for the Water
(W. s / kg. oC) = 4184
FR
coefficient is a number between [0 and
1] (Dimensionless)
FR UL = Thermal Loss coefficient
(W/m2 .
oC)
I = The Average monthly
Insolation ( W/m2 )
Inoon = The peak noontime Solar
radiation (W / m2)
It = The Global solar radiation
(W/m2)
K1 = Constant (Dimensionless)
K2 = Constant (m2 .
oC / W)
K3 = Constant (Dimensionless)
K4 = constant ( 1 / s ) = constant *
3600 ( 1 / hour ).
K5 = constant ( 1 / s ) = constant *
3600 ( 1 / hour ).
K6 = K4 + K5 ( 1 / s ) = constant *
3600 ( 1 / hour ).
K7 = Constant (1 / s) = Constant *
3600 (1 / hour)
K8 = Constant (m2 .
oC / W. s) =
Constant * 3600 (m2 .
oC / W. hour)
K9 = Constant (1 / s) = Constant *
3600 (1 / hour)
K10 = Constant (1 / s) = Constant *
3600 (1 / hour)
Nahrain University, College of Engineering Journal (NUCEJ) Vol.16 No.2, 2014 pp.238-259
832NUCEJ Vol.16 No.2 Ali
Mst = Mass of the water in storage
tank (kg)
mco - n = Mass flow rate through the
collectors in series (kg/s) = n . mco
mco - t = Total mass flow rate through
the collectors (kg/s)
ms = Mass flow rate through the
storage tank (kg/s)
qL = The heat losses from the
storage tank & heat exchanger losses
(W)
Qload = QG (W), [equations (11 or
12)]
Qaux = the heat added by the
auxiliary heater (W), equation (14)
Ta = The ambient temp. (oC)
Tci = Collector inlet water temp.
(oC)
Tco = Collector outlet temp. of the
Water or water / glycol mixture (oC)
Tco - n = Collectors outlet temp. of the
fluid medium (oC)
Tmix – 1 = City Water or feed water
temp. to the storage tank (oC)
Tst = Storage tank water temp.
(oC)
t = Time (Hour)
tsunrise = The Sunrise time (Hour)
tsunset = The Sunset time (Hour)
∆T = The driving force
temperature difference (oC)
[ ref. 13 ]
= The collector efficiency
% Solar Availability = the percent of
daily insolation available.
Introduction
The standard of living is closely linked
to the energy consumption, a simple
calculation shows the dramatic
challenges facing the energy sector in
the coming (100) years [ref. 1]
.
The world demand of energy for Air
Conditioning is continually increasing.
As traditional cooling units are
electrically powered, peak demands of
electrical power in summer increases
and tend to reach the capacity limit in
some countries [ ref. 2 ]
.
In some ways, solar energy is better
suited to space cooling and refrigeration
than to space heating [3]
. The seasonal
variation of solar energy is well-suited to
the space-cooling than heating
requirements of buildings. Because the
warmest seasons of the year correspond
to periods of high insolation (incident
solar radiation), thus solar energy is
most available when there is no heat
load but instead comfort cooling is most
needed. Moreover, the efficiency of
solar collectors increases with increasing
insolation and increasing ambient
temperature. In summer, the amount of
energy delivered per unit area of
collector can be larger than that in winter
as a result of lower sun altitude angle,
and may be cloudy, foggy and windy
day.The traditional refrigeration & air
conditioning system has not become
popular due to the unfavorable
economics and using more conventional
means such as fossil fuels which has the
greenhouse effect to environment. The
most widely used methods applied to
solar cooling and
air conditioning are vapor compression
cycles, absorption-cooling cycles, and
desiccant cooling [ ref. 3 ]
.
Absorption air conditioning is a heat
operated cycle [4]
, and it is compatible
with solar energy because a large
fraction of the energy required is thermal
energy at temperatures that solar
collectors can easily provide [3]
. The
LiBr – H2O (Lithium Bromide – Water)
system operates at a generator
temperature in the range of [70 – 95 ℃]
with water used as a coolant in the
absorber and condenser and has (COP)
of about [0.7] and higher than NH3 –
H2O (Ammonia – Water) system [ ref. 6 ]
.
Nahrain University, College of Engineering Journal (NUCEJ) Vol.16 No.2, 2014 pp.238-259
842NUCEJ Vol.16 No.2 Ali
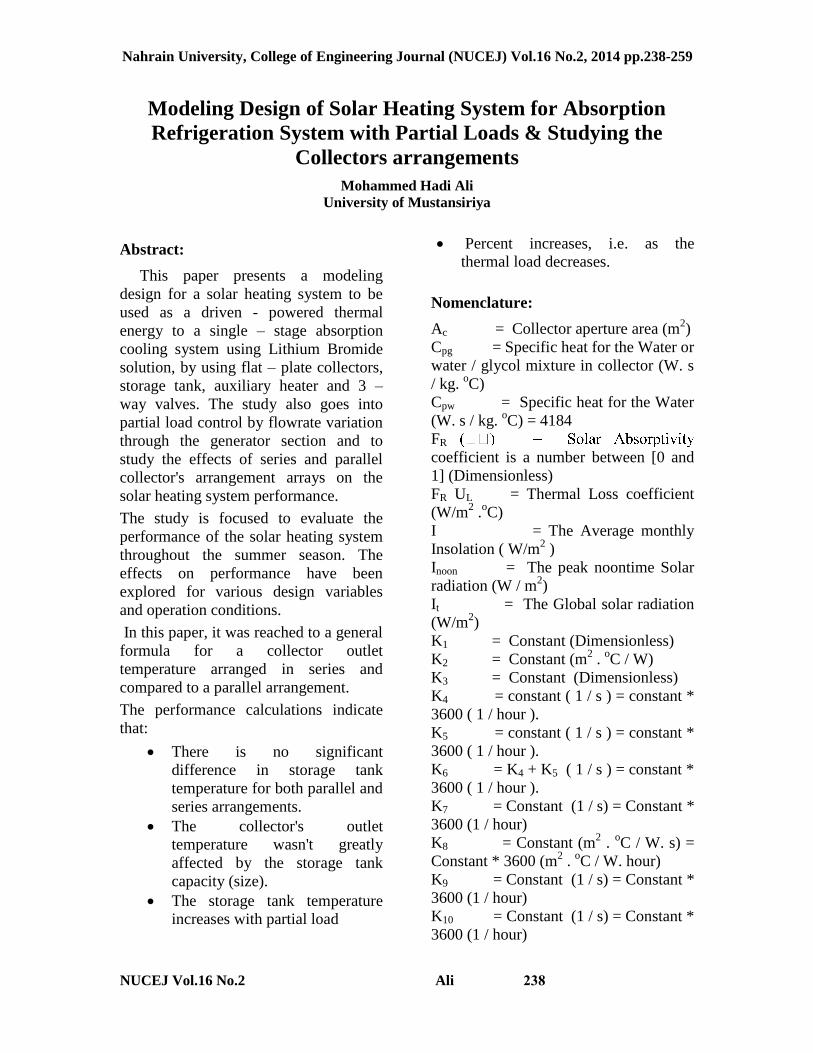
A simple solar absorption LiBr – H2O
system is shown in figure (1), and it is
simply consists of two systems (circuits)
as well a control panel, those are:
Solar Heating system as a heat
driven source for Absorption
Refrigeration system (ARS).
The LiBr – H2O Absorption
Refrigeration System (single stage) uses
LiBr (Lithium Bromide) as absorbent
and water as refrigerant and for
application above (0 ℃).
A control panel is to regulate the
Flowrate to the generator of (ARS) at
partial load and to control the storage
tank temperature as it exceeds the
reference set temperature to generator.
Fig. (1): The basic arrangement of a
solar driven absorption refrigeration
cycle.
The Objective of the Research:
The objective of this paper is to set a
modeling design for improving solar
thermal heating system for supplying a
driven heat to an Absorption
Refrigeration System (ARS), where the
generator section for (ARS) is the only
portion that is exposed to the solar
heating system [ref. 7]
. Most the concerned
studies about the solar thermal
absorption cooling system (STACS)
focused on improving the performance
of the absorption cooling systems rather
than solar systems, because the solar
system is a complex dynamic system and
it is difficult to predict the annual saving
energy, so, if experiments were used to
study the effect of each parameter on the
overall system performance would
normally requires several cooling
seasons to establish a conclusion [ ref. 4 & 5
].
Solar Absorption Refrigeration
system – basic description:
A simple schematic drawing showing
the most components, temperature, flow
rates and flow direction of the solar
absorption refrigeration– single effect
LiBr – H2O system are shown in figures
(1 & 2). The working fluid in absorption
refrigeration LiBr – H2O system is a
binary solution consisting of water as
refrigerant and LiBr as absorbent.
Heat supplied by the solar heating
system into the generator section is
added to a solution of (LiBr-H2O). This
heat causes the refrigerant (water), to be
boiled out of the solution in a distillation
process. The water vapor that results
passes into the condenser section where
a cooling medium is used to condense
the vapor back to a liquid state. The
water then flows down to the evaporator
section where it passes over tubes
containing the fluid to be cooled. By
maintaining a very low pressure in the
absorber-evaporator shell, the water
boils at a very low temperature. This
boiling causes the water to absorb heat
from the medium to be cooled, thus,
lowering its temperature. Evaporated
Nahrain University, College of Engineering Journal (NUCEJ) Vol.16 No.2, 2014 pp.238-259
842NUCEJ Vol.16 No.2 Ali
water then passes into the absorber
section where it is mixed with (LiBr-
H2O) solution that is very low in water
content. This strong solution (in LiBr)
tends to absorb the vapor from the
evaporator section to form a weaker
solution. This is the absorption process
that gives the cycle its name. The weak
solution is then pumped to the generator
section to repeat the cycle.
Fig. (2): Schematic diagram of Solar
Absorption Refrigeration System
(exposing generator section only)
On the other hand, the solar heating
system consists of the solar collectors'
arrays (parallel & series arrangement) in
which the sun's energy is gained and
transferred to circulating fluid, then, the
heat is accumulated in the storage tank
for direct or later use. The auxiliary
heater is used to elevate the fluid
temperature to specified or reference
temperature (Tref). The hot water is then
supplied to the generator to boil off
water vapor from a solution of LiBr and
water.
A control panel (system) as well is used
to regulate the flowrate to bypass
through 3- way valve (V1) for capacity
control (partial load) of the (ARS), and
to control the outlet temperature of the
storage tank not to exceed (Tref) or when
it is less than fluid entering temperature
to the storage tank (Tmix-1) by letting the
fluid medium passing through 3-way
valve (V2).
The Theoretical Analysis of the Solar
Heating System:
The solar heating system is modeled by
treating each of the major components,
which are solar collectors, storage tank,
auxiliary heater, 3-way valves and the
generator of the (ARS) by taking the
energy and mass balance across each
components.
We have assumed that only the input and
output parameters are counted. This is
the principle of a lumped parameter
model (LPM) [ ref. 7 ]
, which states that
the volume or mass under consideration
is perfectly mixed, all phases inside this
volume will have the same property as
that at the output. To study and analyze
this case figure ( 2 ) above is applied to
represent a simplified schematic for
solar model (System Configuration).
The Heat Balance for the Solar
Collectors:
The heat supplied by the solar heating
system to the (ARS) should be at high
temperature in the range of (70 – 95 ℃),
in order to achieve this temperature an
analysis of collectors arrangement in
series is studied below. Thus, n –
collectors of the same type are connected
in series, and the flow through them( mco
– n ) which is ( n ) times that of the single
panel flow rate ( mco ) [ ref. 8 ]
is required
to obtain temperature in that range.
Referring to figure (3), the useful energy
( Qs ) in watts gains from the sun as an
incident solar radiation ( It ) on 1st
collector will be absorbed by the
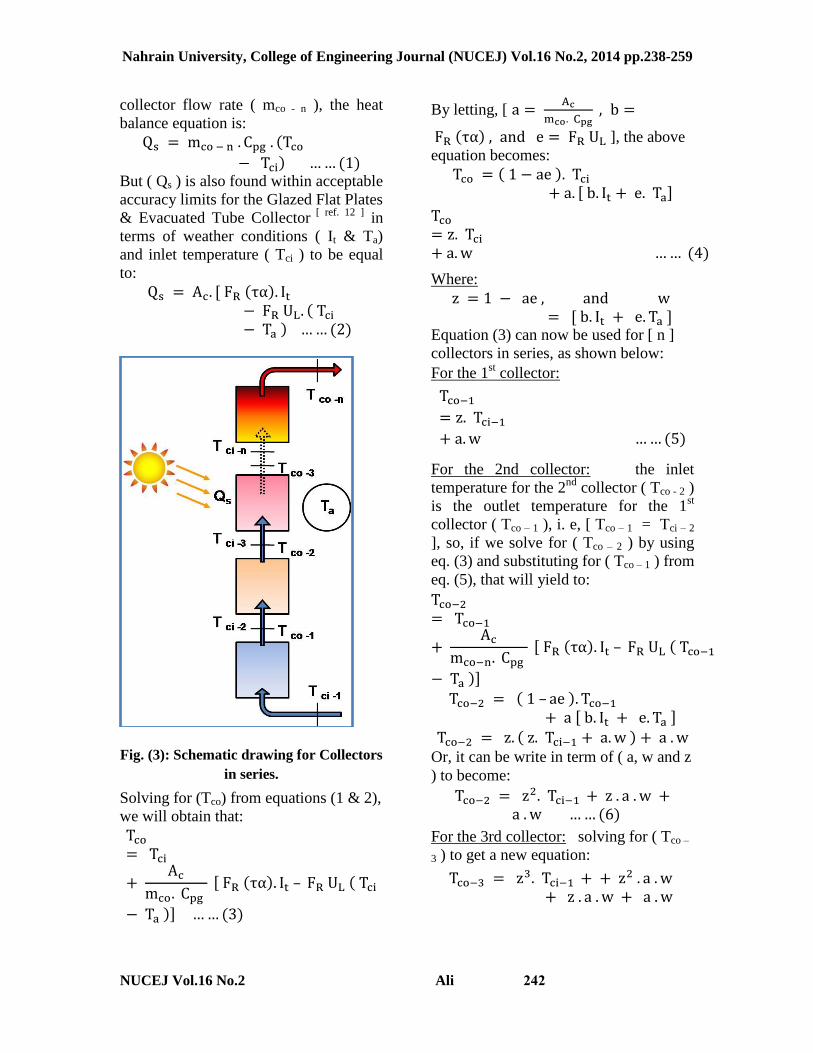
Nahrain University, College of Engineering Journal (NUCEJ) Vol.16 No.2, 2014 pp.238-259
848NUCEJ Vol.16 No.2 Ali
collector flow rate ( mco - n ), the heat
balance equation is:
(
) ( ) But ( Qs ) is also found within acceptable
accuracy limits for the Glazed Flat Plates
& Evacuated Tube Collector [ ref. 12 ]
in
terms of weather conditions ( It & Ta)
and inlet temperature ( Tci ) to be equal
to:
( ) (
) ( )
Fig. (3): Schematic drawing for Collectors
in series.
Solving for (Tco) from equations (1 & 2),
we will obtain that:
( ) (
)] ( )
By letting, [
( ) ], the above
equation becomes:
( ) ]
( )
Where:
]
Equation (3) can now be used for [ n ]
collectors in series, as shown below:
For the 1st collector:
( )
For the 2nd collector: the inlet
temperature for the 2nd
collector ( Tco - 2 )
is the outlet temperature for the 1st
collector ( Tco – 1 ), i. e, [ Tco – 1 = Tci – 2
], so, if we solve for ( Tco – 2 ) by using
eq. (3) and substituting for ( Tco – 1 ) from
eq. (5), that will yield to:
( ) (
)]
( ) ]
( )
Or, it can be write in term of ( a, w and z
) to become:
( )
For the 3rd collector: solving for ( Tco –
3 ) to get a new equation:
Nahrain University, College of Engineering Journal (NUCEJ) Vol.16 No.2, 2014 pp.238-259
843NUCEJ Vol.16 No.2 Ali
( ) ( )
In the same manner for further collectors
in series, we will reach to a general
equation for the outlet temperature ( Tco –
n ) for [ n – collectors ] in series, which
is as follows:
(
)
∑
( )
Substituting for ( w ) in eq. ( 8 ), the
general equation becomes:
∑
]
∑
∑
( )
Where:
(
)
∑ (
)
( )
∑(
)
The Heat Balance for Storage Tank:
The water inside the storage tank is
assumed to be well mixed and not
stratified during heating up process in
any way. The model loop is shown in
figure (4) and the firm equation will be
derived below as follows using simple
energy balance along with mass flow
and heat capacity for each stream and
components. The heat balance equation
for the storage tank is:
( )] (
)
In this model, we ignore the effect of the
tank size and assume all energy
extracted by the solar panels is useful,
and simply multiplied by the heat
exchanger efficiency ( 𝜼 ), that means
we let the heat loss (qL) as a fraction of
the of the useful energy of the built – in
heat exchanger { Q = mco - n . Cpg . 𝜼 [ Tco
– ( Tst + ∆T ) ]}, then the above equation
becomes:
( )] ( )
Simplifying and re-arranging the above
equation, it yields to:
( )
Nahrain University, College of Engineering Journal (NUCEJ) Vol.16 No.2, 2014 pp.238-259
844NUCEJ Vol.16 No.2 Ali
Figure (4): Schematic diagram of
storage tank with built in heat
exchanger
.
Where:
The Heat & Mass Balance for the
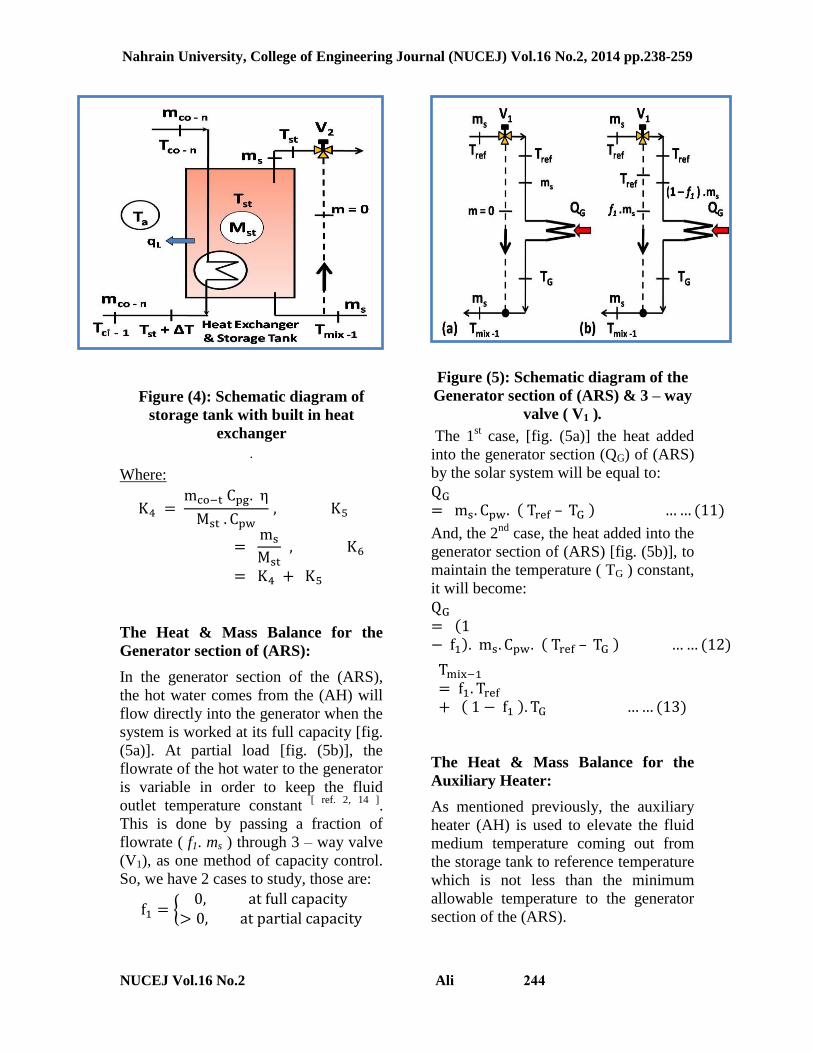
Generator section of (ARS):
In the generator section of the (ARS),
the hot water comes from the (AH) will
flow directly into the generator when the
system is worked at its full capacity [fig.
(5a)]. At partial load [fig. (5b)], the
flowrate of the hot water to the generator
is variable in order to keep the fluid
outlet temperature constant [ ref. 2, 14 ]
.
This is done by passing a fraction of
flowrate ( f1. ms ) through 3 – way valve
(V1), as one method of capacity control.
So, we have 2 cases to study, those are:
{
Figure (5): Schematic diagram of the
Generator section of (ARS) & 3 – way
valve ( V1 ).
The 1st case, [fig. (5a)] the heat added
into the generator section (QG) of (ARS)
by the solar system will be equal to:
( ) ( )
And, the 2nd
case, the heat added into the
generator section of (ARS) [fig. (5b)], to
maintain the temperature ( TG ) constant,
it will become:
( ) ( ) ( )
( ) ( )
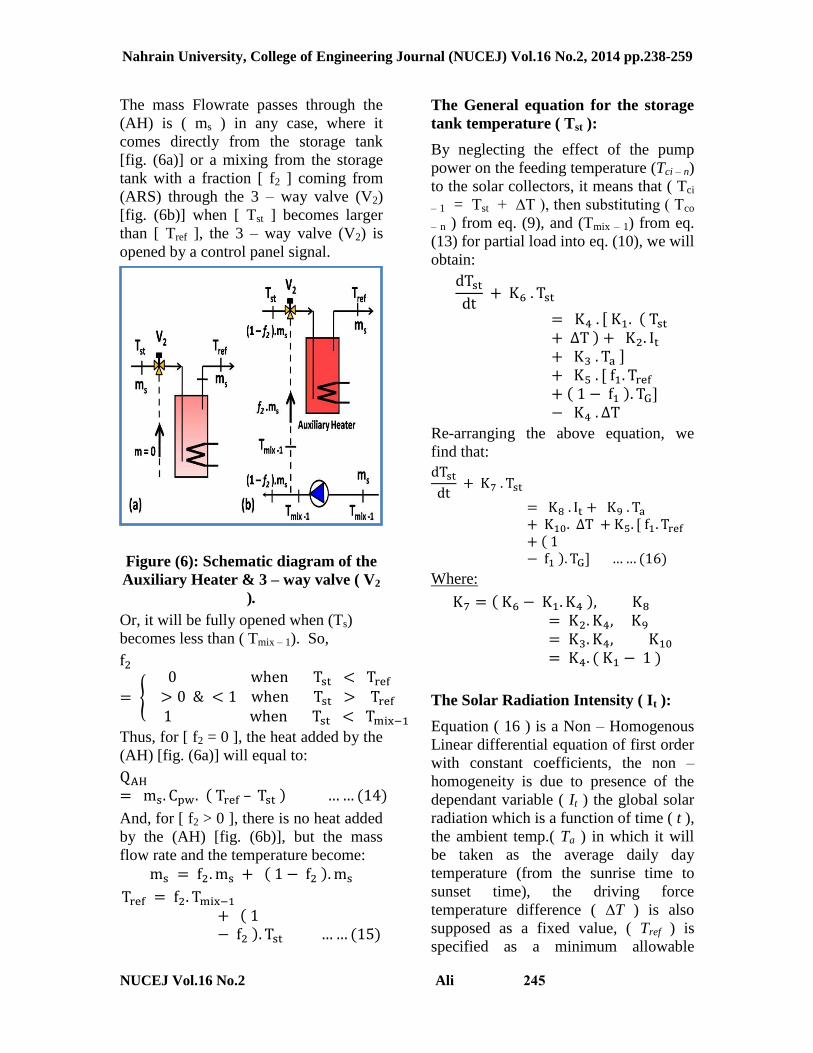
The Heat & Mass Balance for the
Auxiliary Heater:
As mentioned previously, the auxiliary
heater (AH) is used to elevate the fluid
medium temperature coming out from
the storage tank to reference temperature
which is not less than the minimum
allowable temperature to the generator
section of the (ARS).
Nahrain University, College of Engineering Journal (NUCEJ) Vol.16 No.2, 2014 pp.238-259
842NUCEJ Vol.16 No.2 Ali
The mass Flowrate passes through the
(AH) is ( ms ) in any case, where it
comes directly from the storage tank
[fig. (6a)] or a mixing from the storage
tank with a fraction [ f2 ] coming from
(ARS) through the 3 – way valve (V2)
[fig. (6b)] when [ Tst ] becomes larger
than [ Tref ], the 3 – way valve (V2) is
opened by a control panel signal.
Figure (6): Schematic diagram of the
Auxiliary Heater & 3 – way valve ( V2
).
Or, it will be fully opened when (Ts)
becomes less than ( Tmix – 1). So,
{
Thus, for [ f2 = 0 ], the heat added by the
(AH) [fig. (6a)] will equal to:
( ) ( )
And, for [ f2 > 0 ], there is no heat added
by the (AH) [fig. (6b)], but the mass
flow rate and the temperature become:
( )
( ) ( )
The General equation for the storage
tank temperature ( Tst ):
By neglecting the effect of the pump
power on the feeding temperature (Tci – n)
to the solar collectors, it means that ( Tci
– 1 = Tst + ∆T ), then substituting ( Tco
– n ) from eq. (9), and (Tmix – 1) from eq.
(13) for partial load into eq. (10), we will
obtain:
(
) ] ( ) ]
Re-arranging the above equation, we
find that:
( ) ] ( )
Where:
( )
( )
The Solar Radiation Intensity ( It ):
Equation ( 16 ) is a Non – Homogenous
Linear differential equation of first order
with constant coefficients, the non –
homogeneity is due to presence of the
dependant variable ( It ) the global solar
radiation which is a function of time ( t ),
the ambient temp.( Ta ) in which it will
be taken as the average daily day
temperature (from the sunrise time to
sunset time), the driving force
temperature difference ( ∆T ) is also
supposed as a fixed value, ( Tref ) is
specified as a minimum allowable
Nahrain University, College of Engineering Journal (NUCEJ) Vol.16 No.2, 2014 pp.238-259
842NUCEJ Vol.16 No.2 Ali
temperature into the generator section of
(ARS), and ( TG ) is maintained constant,
because lowering ( TG ) causes a lower
in condensing temperature of (ARS) to
un-achieved condensing temperature and
to LiBr crystallization [ ref. 24 ]
. All those
parameters can be considered as
constants. So, to solve equation (16), the
relation as a function [ ( ) ]
should be known.
The simple Half – Sine Model of
clear – day solar radiation is all that
needed to predict the solar energy
system design [ ref. 9 ]
. The only input
required is the times of sunrise, sunset
and the peak noontime solar irradiance,
the model state that:
[ ( )
( )]
Letting the sunrise time ( tsunrise ) to
be the zero time, then ( ∆t = tsunset –
tsunrise ) represents the daylight time and
the above equation for ( It ) becomes:
[
] ( )
Substituting eq. ( 17 ) into eq. ( 16 ), we
will obtain:
[
]
( ) Where:
( ) ]
Equation ( 18 ) has two solutions, the
Complementary function and the
Particular Integral [ 15 ]
, the
complementary function can be find by
equating the left side of eq. (18) to zero:
It is natural to find out that the complete
solution of homogenous equation
mentioned above is:
It easy to see that the Particular Integral
solution is [ ref. 15 ]
:
[
] [
]
Differentiating (YP), and substituting for
( Yp & Yp' ) into eq. ( 18 ) and solving
for the constants ( E, A & B ), it is found
that:
(
)
(
)
Where:
Then the general solution for equation (
18 ) is:
(
) [ [
]
[
]] ( )
The arbitrary constant ( C ) can be
obtained by applying the initial
condition at the beginning of the heating
process by the Solar Energy which is:
Where ( Ti ) is the initial storage tank
temperature. Substituting in equation (
19 ) the general equation and solving for
( C ), which yields to:
Nahrain University, College of Engineering Journal (NUCEJ) Vol.16 No.2, 2014 pp.238-259
842NUCEJ Vol.16 No.2 Ali
(
)
Rearranging the general solution to have
the final form for ( Tst ) which becomes:
( )
{ ( [
])
[
] } ( )
Where:
The performance of the solar system
is characterized by the solar fraction
(SF), which is the fraction of load
covered by the solar system given by the
following equation [ ref. 2 ]
:
( )
( )
The Application:
In this paragraph, a modeling design for
Absorption Refrigeration system – single
stage (effect) of [10.5 kW] capacity will
be put into practice. This capacity
represents the refrigeration effect
[cooling output (QE)], the COP is an
index of the efficiency of (ARS), it is
calculated by dividing the cooling output
(QE) by the required heat input (QG) [ ref.
17 ] {see fig. (1) above}:
Where (Wme) is the pump power which
is small compared to (QG). Since COP
for single – stage (ARS) is between (0.6
– 0.8) [ ref. 6 & 18 ]
, and has a value of (0.7) [ ref. 19 ]
, thus:
The (15 kW) is the required heat to
be supplied by the solar heating system
into the generator section, and from this
point the other design factors will be
found or proposed.
To find the total collectors area ( Ac )
required to produce the designed thermal
load ( QG ), it will be estimated
according to the following equation
which will be used [ ref. 5 & 20 ]
:
(
) ( )
To find the Average monthly Solar
Insolation ( I ), we will consider summer
months [April to September], and from
the Meteorology Database for Baghdad
City (year 2000) [ ref. 26 ]
, we found that (I
= 565 W/m2), figure (7) shows the
monthly variation in Solar Insolation of
summer months.
For the efficiency
in manufacturer's specification sheets or
from the Solar Rating and Certification
Corporation (SRCC), we will use an
efficiency value of (0.45) which is an
average of all the efficiencies of the
brands [ ref. 20 ]
. The %Solar Availability
is assumed to be equal to (100%) for
unobstructed solar window. Thus the
total collectors' area (Ac - T) can be
obtained to be equal to:
Ac - T = 15000 / ( 0.45 * 565 ) = 59 m2
Nahrain University, College of Engineering Journal (NUCEJ) Vol.16 No.2, 2014 pp.238-259
842NUCEJ Vol.16 No.2 Ali
To find the Collector's numbers to be
used in this calculation, we should
choose the standard area of the collector,
this parameter is the manufacturer's
specification and should be taken from
collector's brochures, it is mostly equal
to (2.87 m2) for (8 ft x 4 ft) standard, and
thus the collector's no. is:
Collector's no. (N) = 59 / 2.87 ≈ 20
These collectors {Glazed Flat – Plates
[with double anti-reflection glazing and
hermetically sealed collectors with inert
– gas filling reduce collector heat losses,
and can be used for applications in the
range of (80 – 120 ℃)]}[ ref. 3 & 21 ]
or
(Evacuated Tube) will be flushed
mounted horizontally on the Building
roof in parallel and series array, so it
should be taken into consideration the
enough space for this arrangement.
The Storage Tank capacity (size)
depends on the system used, it can
roughly estimate to be equal to (0.05 to
0.075 m3 / m
2 of the collectors' area)
[ ref.
12 & 22 ], thus it will be assumed to be (4.5
m3 or 4500 Liter). Most Glazed Flat
plate collectors are provided with values
of (FR ( = 0.68 to 0.75) & (FR UL =
4.9 to 5.247 W/m2.
oC )
[ ref. 11 & 13 ] ,
choosing (FR ( = 0.74) & (FR UL =
5.247 W/m2 .
oC ) to be used in our
calculation.
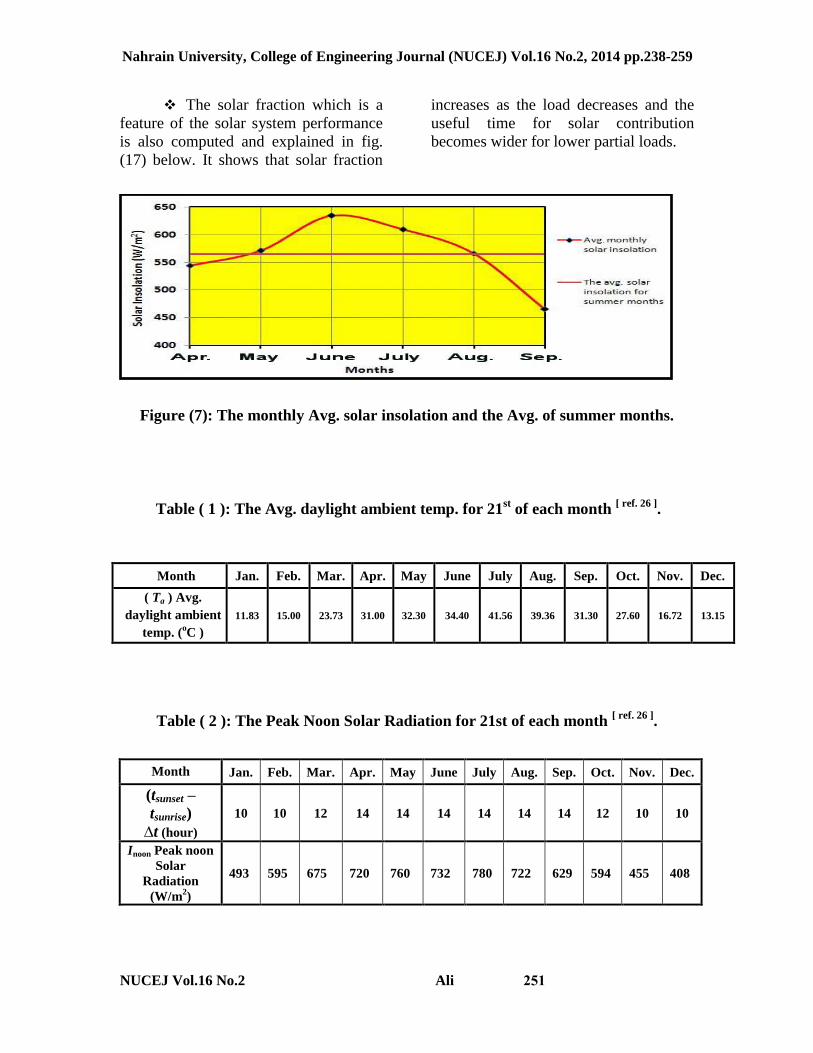
The average daylight ambient
temperature (Ta) for 21st of each month
can be obtained from Meteorology
Database (2000) for Baghdad City [ ref. 26
] according to the following table (1):
The peak noontime Solar radiation [Inoon
(W / m2)] for 21
st of each month can also
be obtained from Meteorology Database
(2000) for Baghdad City as shown in the
following table (2) and fig. (8) shows the
estimated values for it according to
equation (17) for some months.
The collector's mass flow rate ( mco - T ),
it will be considered water instead of
glycol, the optimum fluid flow rates per
unit collector's area are usually in the
range of (0.0083 to 0.0167 kg/s . m2)
[ ref.
22 ] or (0.011 to 0.0146 kg/s . m
2)
[ ref. 23 ],
we will use here for our calculated area
(0.011 kg/s.m2) to have total flow rate of
(0.6 kg/s), that means the flow rate per
one collector is equal to:
( )
The solar collectors will be arranged
in an array of two row in parallel, which
means that no. of row (n = 2). So, the
flow rate for two rows in series becomes
equal to:
( ∆T ) the driving force temperature
differences is taken to be ( 5 oC ) and
the Initial Storage Water Tank (Ti) to be
equal to ambient temp. (Ta) of the
initiation working day.
In order to maintain good heat transfer in
the generator section, only a small
temperature difference [ ∆TG = Tref – TG
] can be tolerated in the hot water flow
stream [ ref. 19 ]
.
This is a result of the fact that the (ARS)
was originally designed for steam input
to the generator, and the heat transfer
from the condensing steam is a constant
temperature process. A temperature
difference of ( ∆TG = 4 ℃ ) [ ref. 24 ]
, and (
∆TG = 7.5 ℃ ) [ ref. 25 ]
, we will use a
temperature difference of ( ∆TG = 6 ℃ ),
i.e., if ( Tref = 95 ℃ ), then ( TG = 89 ℃
).
Nahrain University, College of Engineering Journal (NUCEJ) Vol.16 No.2, 2014 pp.238-259
842NUCEJ Vol.16 No.2 Ali
According the above paragraph, the
flow rate passing through the generator
section ( ms ) can be estimated using
equation (11), to yield that ( ms = 0.6
kg/sec ).
Thus, for April month as an example, the
constants (K1 – K12) can be estimated to
have the following values, and equation
(20) for April month becomes:
K1 = 0.884, K2 = 0.0164, K3 = 0.116,
K4 = 0.408, K5 = 0.48, K6 = 0.89,
K7 = 0.527, K8 = 0.007, K9 = 0.047,
K10 = - 0.047, K11 = 43.95, K12 =
0.224,
[
], C2 = 0.005, C3 =
0.011
[
]
( ) { (
]) ] }
Results and discussion
The analysis for this research shows the
possibility to predict the Storage Tank
Water temperature ( Tst ) for the solar
absorption refrigeration system and the
factors that have major effects on system
operation during any day in the year and
the succession.
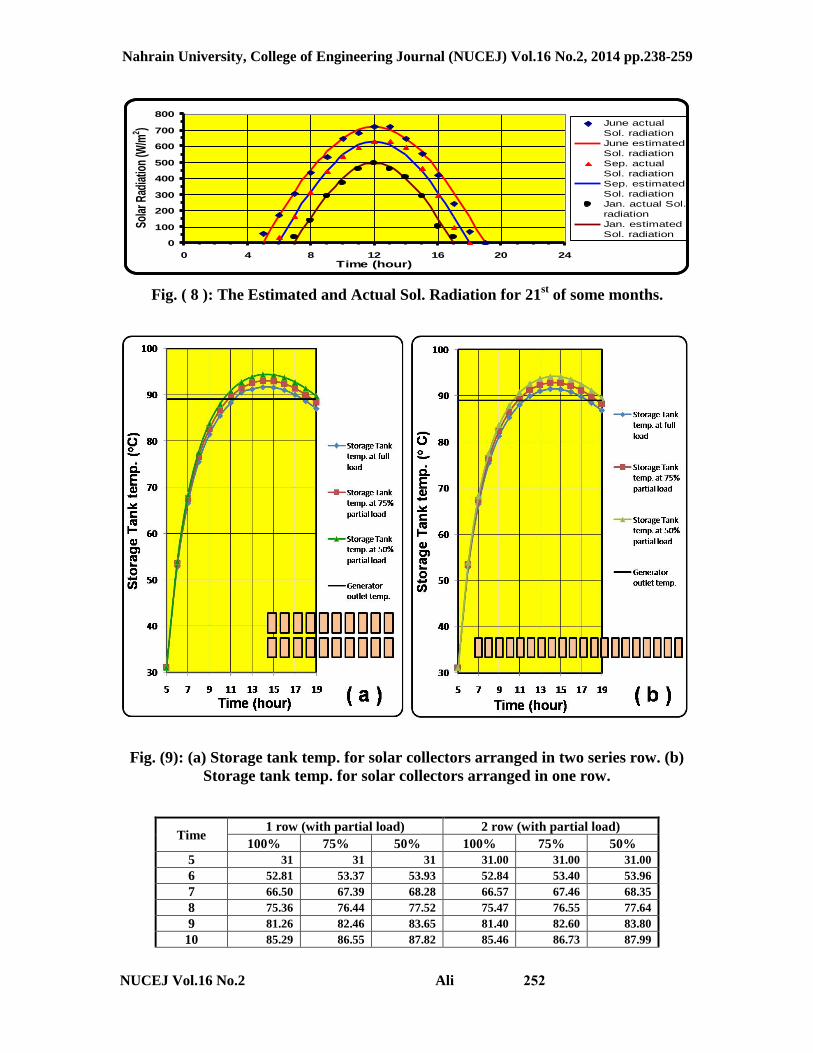
Figure (9a) shows the variation of
Storage Tank temperature ( Tst )
variation during the heating time for 21st
of April starts at sunrise time (5 O'clock
a.m.) and ends at sunset (7 O'clock p. m)
according to the above equations for
solar collector arranged in two series
rows (2 x 10 = 20).
Figure ( 9b ) shows also ( Tst ) variation
during the heating time for 21st of April
but for solar collector arranged in one
row (1 x 20 = 20). The results showed
that there wasn't a significant difference
in ( Tst ) between the two arrangements
as tabulated in table (3):
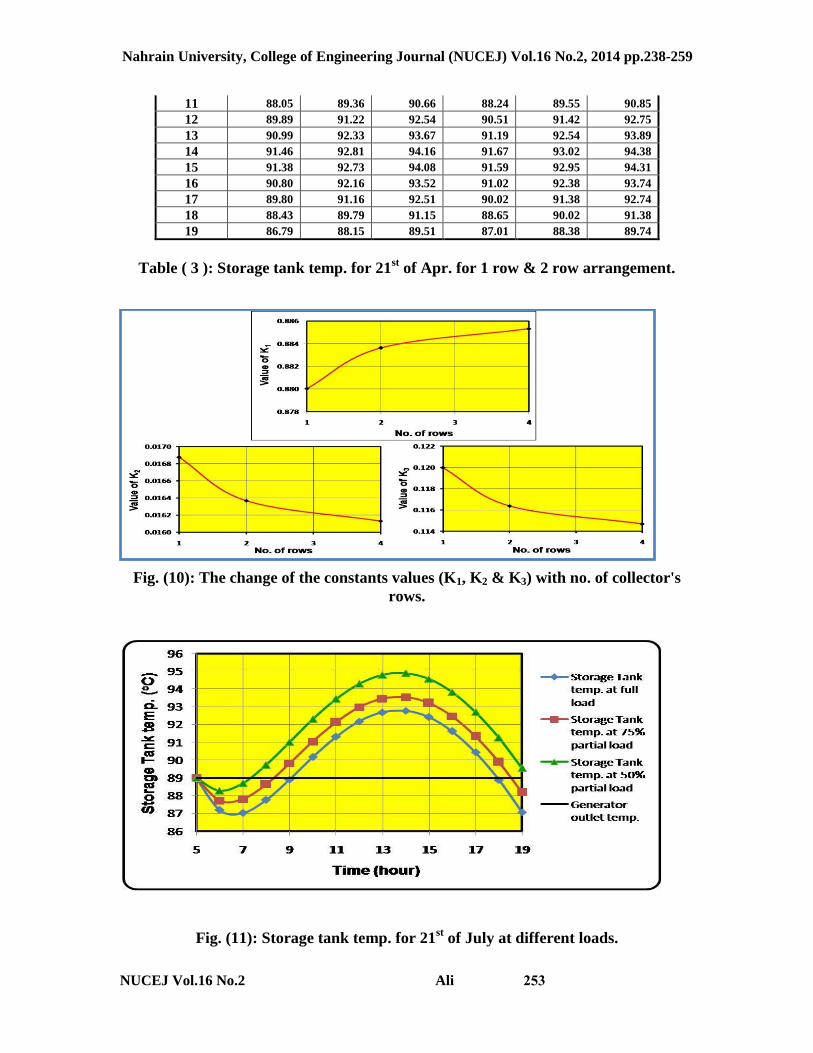
The reason for this point can be
explained through the change in values
of the constants (K1, K2 and K3) of
equation (9) which are shown in fig.
(10). It can be observed that the value of
(K1) is increased with increasing number
of rows, on contrary the values of (K2
and K3) is decreased with increasing
number of rows, that means the
increasing in (K1) is compensated by the
decreasing in values of (K2 and K3), thus
the outlet temperature from the solar
collectors (Tco – n) is considerably
unchanged.
Actually, the initial storage tank
temperature in a continuous operation
will be the generator outlet temperature
(TG) of (ARS) not (Ti). So, on this basis
the storage tank temperature will
become as shown in the following
figures.
It is obviously seen from fig. (11) that
the storage tank temperature for 21st of
July (with noon solar intensity of 780
W/m2) is lowered first to below than (89
oC) then it goes up again to reach and
pass (89 oC), this is because the solar
collectors has its own thermal capacity
to rise from its initial temperature to
reach the temperature of (89 oC), and the
solar radiation intensity should reach the
critical solar intensity (Ic) which is equal [ ref. 3 ]
:
( )
( )
For example the critical solar intensity
for September month can be computed
to be equal to (490 W/m2), which occurs
at about approximately at (10 a.m.)
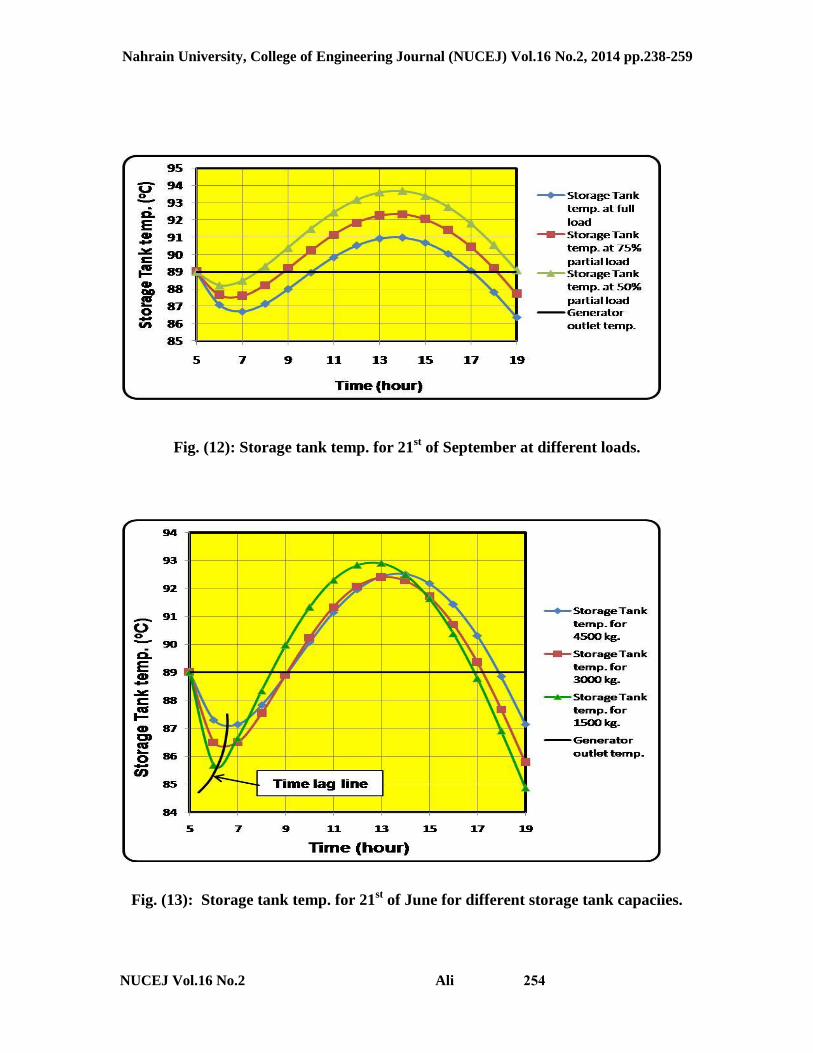
The same thing is shown in fig. (12) for
the storage tank temperature for 21st of
September (with noon solar intensity of
630 W/m2), but the difference is the time
Nahrain University, College of Engineering Journal (NUCEJ) Vol.16 No.2, 2014 pp.238-259
822NUCEJ Vol.16 No.2 Ali
required to reach and pass the (89 oC) is
less and with higher (Tst) for higher solar
intensity rather than a lower solar
intensity, which is apparently clear in
figures (11 & 12) that the useful time for
effective solar intensity is between (9
a.m. to about 6 p.m.) for July and (10
a.m. to 5 p.m.) for September.
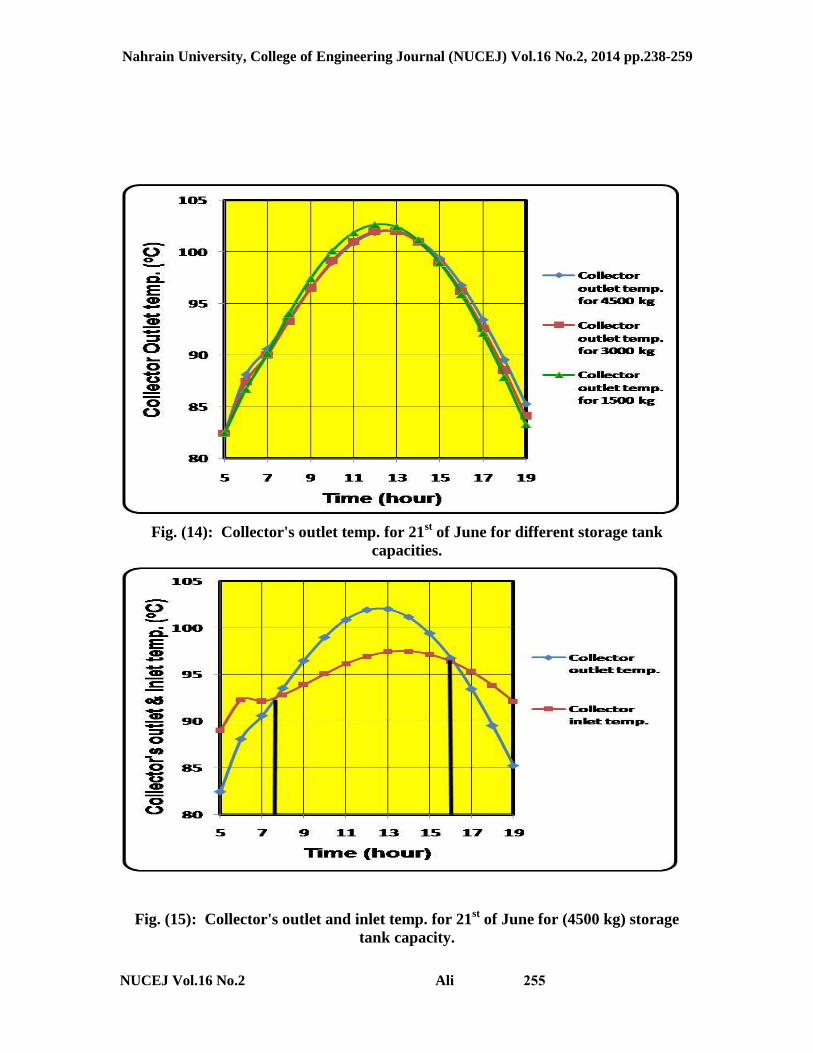
The effect of the storage tank capacity
was studied in this research to obtain the
best size or tank capacity that the solar
heating system has for (ARS). Different
tank capacity is used in our computation
and the final results were collected in
figure (13).
It is observed that for small storage
capacity (1500 kg), the storage tank
temperature drops rapidly in a short time
to its minimum temperature and then rise
to pass the line of (89 oC) because it has
a lower thermal capacity which means it
lost its heat quickly. On contrary, for
larger storage tank (4500 kg), the storage
temperature drops slowly (due to its high
thermal capacity) to its minimum
temperature which is higher than the
minimum temperature for storage tank
of (1500 kg) but with a time lags and
then rise to pass the line of (89 oC).
It appears also from fig. (13) that the
storage tank temperature for lower
storage tank capacity speeds up to its
maximum temperature and then drops
rapidly, it is also due to its lower thermal
capacity, whereas the storage tank
temperature for larger tank capacity rises
slower to its maximum temperature
which is lower than that for smaller tank
but with a time lags to last for a wider
period of time than smaller tanks.
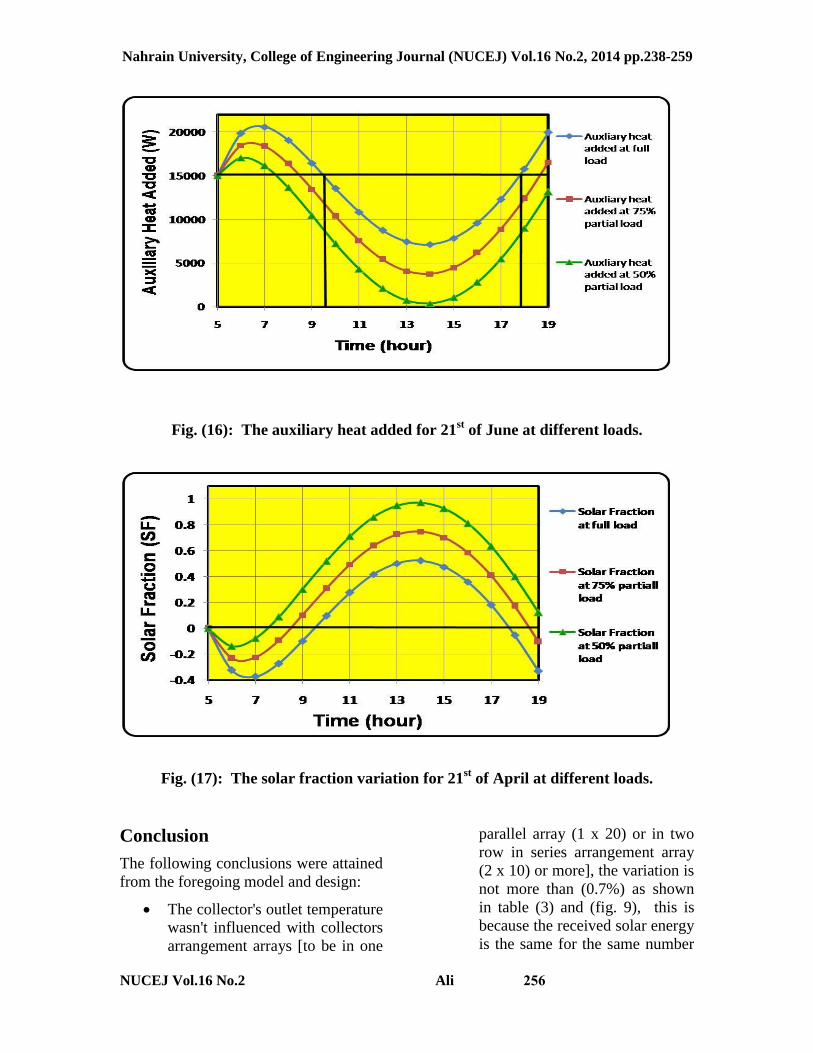
The effect of the storage tank capacity
on the collector's outlet temperature is
well explained in fig. (14)., the figure
shows no significant impact on the
collector's outlet temperature for
different storage tank capacity (4500,
3000 & 1500 kg), and the three curves
for them seem to be coincided on each
other, the best is (4500 kg) storage tank
as expressed in the previous paragraph.
In figure (15), the collector's outlet
temperature is drawn against the
collector's inlet temperature. The figure
shows that at beginning the solar
collectors start to absorb the heat from
the circulated flowrate through them to
reach its equilibrium thermal state due to
two reasons:
The initial collector's
temperature is nearly equal to the
ambient temperature, so it starts to
absorb the heat from the circulating flow
rate through them.
The solar intensity
doesn't reach to its critical intensity to
compensate the heat losses from the
collectors themselves until it reaches the
balance points which is marked with the
bold line in fig. (15), and same thing
happen when solar intensity drops to (Ic)
at sun's setting.
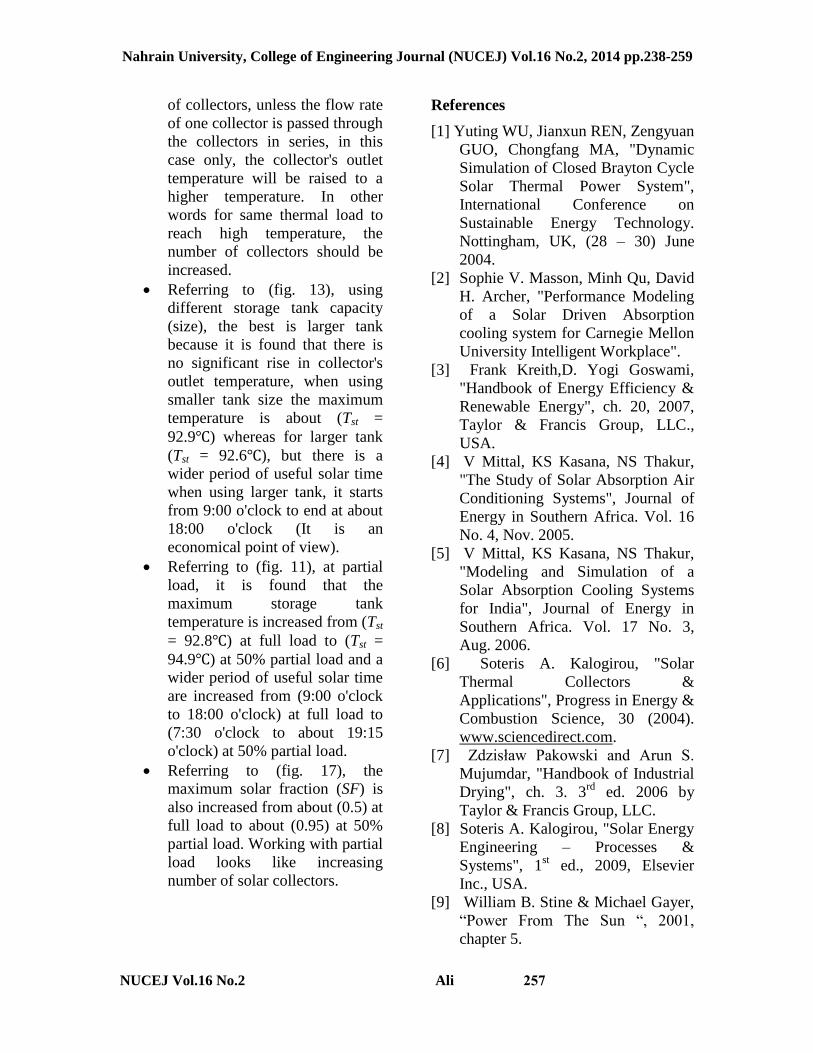
The auxiliary heat added by the (AH) is
computed and explained in fig. (16).
The figure shows that the auxiliary heat
added is high because the storage tank
temperature at its initiation is lowered as
the storage tank gives some of its
thermal capacity to warm up the solar
collector till the solar intensity reaches
its critical value. Thus a bypass 3 – way
valve (V2) is incorporated and comes
into play to pass the flow rate at a
generator outlet temperature (TG)
directly to the auxiliary heater (AH) till
the storage tank temperature rise up to
be equal to the generator outlet
temperature (TG) and again to be full
opened the 3 – way valve when the
storage tank temperature drops again
lower than the generator outlet
temperature.
Nahrain University, College of Engineering Journal (NUCEJ) Vol.16 No.2, 2014 pp.238-259
822NUCEJ Vol.16 No.2 Ali
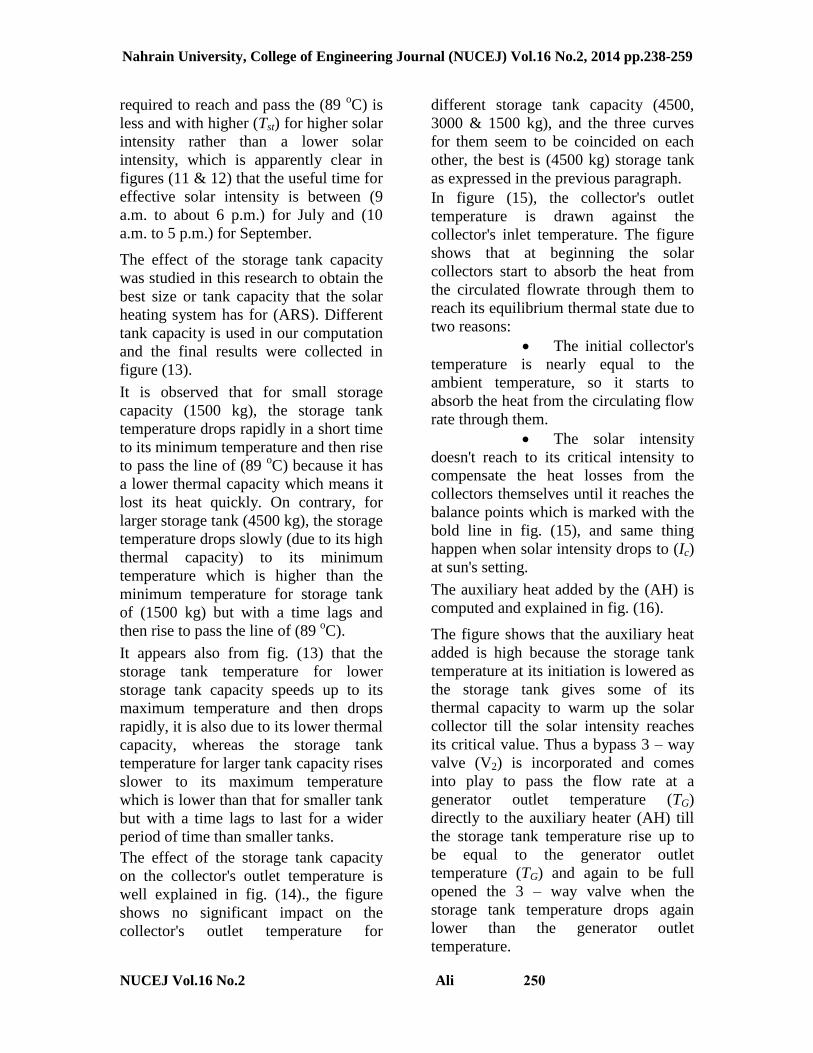
The solar fraction which is a
feature of the solar system performance
is also computed and explained in fig.
(17) below. It shows that solar fraction
increases as the load decreases and the
useful time for solar contribution
becomes wider for lower partial loads.
Figure (7): The monthly Avg. solar insolation and the Avg. of summer months.
Table ( 1 ): The Avg. daylight ambient temp. for 21st of each month
[ ref. 26 ].
Table ( 2 ): The Peak Noon Solar Radiation for 21st of each month [ ref. 26 ]
.
Month Jan. Feb. Mar. Apr. May June July Aug. Sep. Oct. Nov. Dec.
(tsunset –
tsunrise)
∆t (hour)
10 10 12 14 14 14 14 14 14 12 10 10
Inoon Peak noon
Solar
Radiation
(W/m2)
493 595 675 720 760 732 780 722 629 594 455 408
Month Jan. Feb. Mar. Apr. May June July Aug. Sep. Oct. Nov. Dec.
( Ta ) Avg.
daylight ambient
temp. (oC )
11.83 15.00 23.73 31.00 32.30 34.40 41.56 39.36 31.30 27.60 16.72 13.15
Nahrain University, College of Engineering Journal (NUCEJ) Vol.16 No.2, 2014 pp.238-259
828NUCEJ Vol.16 No.2 Ali
Fig. ( 8 ): The Estimated and Actual Sol. Radiation for 21st of some months.
Fig. (9): (a) Storage tank temp. for solar collectors arranged in two series row. (b)
Storage tank temp. for solar collectors arranged in one row.
Time 1 row (with partial load) 2 row (with partial load)
100% 75% 50% 100% 75% 50%
5 31 31 31 31.00 31.00 31.00
6 52.81 53.37 53.93 52.84 53.40 53.96
7 66.50 67.39 68.28 66.57 67.46 68.35
8 75.36 76.44 77.52 75.47 76.55 77.64
9 81.26 82.46 83.65 81.40 82.60 83.80
10 85.29 86.55 87.82 85.46 86.73 87.99
0
100
200
300
400
500
600
700
800
0 4 8 12 16 20 24Time (hour)
Sola
r Rad
iatio
n (W
/m2 ) June actual
Sol. radiation
June estimated
Sol. radiation
Sep. actual
Sol. radiation
Sep. estimated
Sol. radiation
Jan. actual Sol.
radiation
Jan. estimated
Sol. radiation
Nahrain University, College of Engineering Journal (NUCEJ) Vol.16 No.2, 2014 pp.238-259
823NUCEJ Vol.16 No.2 Ali
11 88.05 89.36 90.66 88.24 89.55 90.85
12 89.89 91.22 92.54 90.51 91.42 92.75
13 90.99 92.33 93.67 91.19 92.54 93.89
14 91.46 92.81 94.16 91.67 93.02 94.38
15 91.38 92.73 94.08 91.59 92.95 94.31
16 90.80 92.16 93.52 91.02 92.38 93.74
17 89.80 91.16 92.51 90.02 91.38 92.74
18 88.43 89.79 91.15 88.65 90.02 91.38
19 86.79 88.15 89.51 87.01 88.38 89.74
Table ( 3 ): Storage tank temp. for 21st of Apr. for 1 row & 2 row arrangement.
Fig. (10): The change of the constants values (K1, K2 & K3) with no. of collector's
rows.
Fig. (11): Storage tank temp. for 21st of July at different loads.
Nahrain University, College of Engineering Journal (NUCEJ) Vol.16 No.2, 2014 pp.238-259
824NUCEJ Vol.16 No.2 Ali
Fig. (12): Storage tank temp. for 21st of September at different loads.
Fig. (13): Storage tank temp. for 21st of June for different storage tank capaciies.
Nahrain University, College of Engineering Journal (NUCEJ) Vol.16 No.2, 2014 pp.238-259
822NUCEJ Vol.16 No.2 Ali
Fig. (14): Collector's outlet temp. for 21st of June for different storage tank
capacities.
Fig. (15): Collector's outlet and inlet temp. for 21st of June for (4500 kg) storage
tank capacity.
Nahrain University, College of Engineering Journal (NUCEJ) Vol.16 No.2, 2014 pp.238-259
822NUCEJ Vol.16 No.2 Ali
Fig. (16): The auxiliary heat added for 21
st of June at different loads.
Fig. (17): The solar fraction variation for 21st of April at different loads.
Conclusion
The following conclusions were attained
from the foregoing model and design:
The collector's outlet temperature
wasn't influenced with collectors
arrangement arrays [to be in one
parallel array (1 x 20) or in two
row in series arrangement array
(2 x 10) or more], the variation is
not more than (0.7%) as shown
in table (3) and (fig. 9), this is
because the received solar energy
is the same for the same number
Nahrain University, College of Engineering Journal (NUCEJ) Vol.16 No.2, 2014 pp.238-259
822NUCEJ Vol.16 No.2 Ali
of collectors, unless the flow rate
of one collector is passed through
the collectors in series, in this
case only, the collector's outlet
temperature will be raised to a
higher temperature. In other
words for same thermal load to
reach high temperature, the
number of collectors should be
increased.
Referring to (fig. 13), using
different storage tank capacity
(size), the best is larger tank
because it is found that there is
no significant rise in collector's
outlet temperature, when using
smaller tank size the maximum
temperature is about (Tst =
92.9℃) whereas for larger tank
(Tst = 92.6℃), but there is a
wider period of useful solar time
when using larger tank, it starts
from 9:00 o'clock to end at about
18:00 o'clock (It is an
economical point of view).
Referring to (fig. 11), at partial
load, it is found that the
maximum storage tank
temperature is increased from (Tst
= 92.8℃) at full load to (Tst =
94.9℃) at 50% partial load and a
wider period of useful solar time
are increased from (9:00 o'clock
to 18:00 o'clock) at full load to
(7:30 o'clock to about 19:15
o'clock) at 50% partial load.
Referring to (fig. 17), the
maximum solar fraction (SF) is
also increased from about (0.5) at
full load to about (0.95) at 50%
partial load. Working with partial
load looks like increasing
number of solar collectors.
References
[1] Yuting WU, Jianxun REN, Zengyuan
GUO, Chongfang MA, "Dynamic
Simulation of Closed Brayton Cycle
Solar Thermal Power System",
International Conference on
Sustainable Energy Technology.
Nottingham, UK, (28 – 30) June
2004.
[2] Sophie V. Masson, Minh Qu, David
H. Archer, "Performance Modeling
of a Solar Driven Absorption
cooling system for Carnegie Mellon
University Intelligent Workplace".
[3] Frank Kreith,D. Yogi Goswami,
"Handbook of Energy Efficiency &
Renewable Energy", ch. 20, 2007,
Taylor & Francis Group, LLC.,
USA.
[4] V Mittal, KS Kasana, NS Thakur,
"The Study of Solar Absorption Air
Conditioning Systems", Journal of
Energy in Southern Africa. Vol. 16
No. 4, Nov. 2005.
[5] V Mittal, KS Kasana, NS Thakur,
"Modeling and Simulation of a
Solar Absorption Cooling Systems
for India", Journal of Energy in
Southern Africa. Vol. 17 No. 3,
Aug. 2006.
[6] Soteris A. Kalogirou, "Solar
Thermal Collectors &
Applications", Progress in Energy &
Combustion Science, 30 (2004).
www.sciencedirect.com.
[7] Zdzisław Pakowski and Arun S.
Mujumdar, "Handbook of Industrial
Drying", ch. 3. 3rd
ed. 2006 by
Taylor & Francis Group, LLC.
[8] Soteris A. Kalogirou, "Solar Energy
Engineering – Processes &
Systems", 1st ed., 2009, Elsevier
Inc., USA.
[9] William B. Stine & Michael Gayer,
“Power From The Sun “, 2001,
chapter 5.
Nahrain University, College of Engineering Journal (NUCEJ) Vol.16 No.2, 2014 pp.238-259
822NUCEJ Vol.16 No.2 Ali
www.PowerFromTheSun.net.
[10] Lunde, P. J., “Solar Thermal
Engineering”, John Wiley & Sons,
New York. (1980).
[11] Solar Water Heating Project
Analysis ( RETScreen Engineering
& Cases Textbook )
www.retscreen.net.
[12] Duffie, J. A., "Solar Energy
Thermal Process". A Wiley Interscience
Publication, (1974).
[13] Thomas, B, & supervisor Dr.
Naoko Ellis.“ Solar Thermal Water
Heating ( A simplified Modelling
Approach & Potential Application
for CHBE)“,
www.chbe.ubc.ca/sustainability/docs/C
HBE492_SolarThermal.pdf.
[14] EE IIT, Kharagpur,"Lesson – 15,
Absorption Refrigeration System –
based on water / LiBr pair", 2008,
India.
http://nptel.iitm.ac.in/courses/Webcourse
-contents/IIT-Kharagpur/
[15] Attenborough M., "Mathematics for
Electrical Engineering &
Computing", Newness, (2003) (An
imprint of Elsevier), Oxford.
[16] Jasim M. Abdulateef,
Kamaruzzaman Sopian, M. A.
Alghoul, Mohd Yusof Sulaiman,
Azami Zaharim & Ibrahim
Ahmed,"Solar Absorption
Refrigeration System Using New
Working Fluid Pairs",
International Journal of Energy,
Issue 3, Vol. 1, 2007.
[17] EE IIT, Kharagpur,"Lesson – 14,
Absorption Refrigeration System –
based on water / LiBr pair", 2008,
India.
[18] Duffie J. A. and Beckman W.
A.,"Solar Engineering of Thermal
Process", Wiley, N.Y, 1991.
[19] Kevin D. Rafferty, P.E."Chapter 13
– Absorption Refrigeration",
http://geoheat.oit.edu/pdf/tp51.pdf
[20] Sorter, A., Miess, K., Engel, R. &
Sorensen, A. Solar Thermal
Design: Research, Design and
Installation of Solar Water System
for Redwood National Park.
www.ajur.uni.edu/v1no4/Sorter et al.pdf
[21] Björn Nienborg, "Solar-assisted
heating and cooling of buildings:
technology, markets and
perspectives",
http://www.solarserver.de/solarma
gazin/index-e.html
[22] Ursula Eicker, "Solar Technologies
for Buildings", John Wiley & Sons Ltd,
USA, 2003.
[23] J. Paul Guyer, , "Introduction to
Solar Cooling Systems",
http://www.cedengineering.com/upl
oad/Intro%20To%20Solar%20Cooli
ng%20Systems.pdf
[24] Soteris Kalogirou, George Florides,
Savvas Tassou, Louis Wrobel,"
Design and Construction of a
Lithium Bromide Water
Absorption Refrigerator", CLIMA
2000/Napoli 2001 World Congress
– Napoli (I), 15-18 September
2001
http://ktisis.cut.ac.cy/bitstream/104
88/881/1/C43-CLIMA-
LITHIUM.pdf
[25] R. Palacios Bereche, R. Gonzales
Palomino, S. A. Nebra,"
Thermoeconomic Analysis of a
Single and Double-Effect
LiBr/H2O Absorption

Nahrain University, College of Engineering Journal (NUCEJ) Vol.16 No.2, 2014 pp.238-259
822NUCEJ Vol.16 No.2 Ali
Refrigeration System", Int. J. of
Thermodynamics, Vol. 12 (No. 2),
pp. 89-96, June 2009.
[26] Meteorology Database for Baghdad
City ( 1998 ).
تسخين شمسية تستخدم الطاقة الحرارية المتولدة تصميم نموذج لمنظومة
فيها كقدرة حرارية دافعة لمنظومة تبريد امتصاصية
محمد هادي علي
الجامعة المستنصرية
الخلاصة:
إن هذا البحث يدرس تصميم نموذج لمنظومة تسخين شمسية تستخدم الطاقة الحرارية المتولدة فيها
ذات مرحلة واحدة يستخدم فيها محلول الليثيوم –كقدرة حرارية دافعة لمنظومة تبريد إمتصاصية
– Flat(, وهذه المنظومة تستخدم ألواح التجميع الشمسية المستوية )LiBr solutionبرومايد )
Plate Collector( حوض التخزين الحراري ,)The Thermal Storage Tank السخان ,)
(. ذهب البحث أيضا إلى way valves-3( و الصمامات الثلاثية )Auxiliary Heaterالإضافي )
دراسة الحمل الحراري الجزئي من خلال التحكم بكمية المائع المتدفق عبر وحدة التوليد
(generatorلم ) نظومة التبريد الإمتصاصية, وأيضا دراسة تأثير ترتيب ألواح التجميع الشمسية
على هيئة مصفوفات بالتوالي أو التوازي على كفاءة وأداء المنظومة الشمسية.
لقد تركزت الدراسة على تخمين وحساب أداء المنظومة الشمسية طوال فترة الصيف. وكذلك دراسة
لمختلفة وحالات التشغيل على أداء المنظومةالشمسية.تأثير المتغيرات التصميمية ا
في هذا البحث, تم التوصل إلى معادلة رياضية عامة لدرجة الحرارة الخارجة من ألواح التجميع
الشمسية على شكل مصفوفات متوالية.
وقد أظهرت النتائج الحسابية ما يلي:
وض التسخين لكلا من الترتيب ليس هناك إختلاف أو فرق واضح أو مهم في درجة حرارة ح
المتوازي أو المتوالي لألواح التسخين الشمسية.
.لا تتأثر كثيرا درجة الحرارة الخارجة من الألواح الشمسية بسعة حجم حوض التسخين
تزداد درجة حرارة حوض التسخين مع زيادة نسبة الحمل الحراري الجزئي أي كلما قل
الحمل الحراري.