Embed Size (px)
Citation preview

Modeling Epidermis Homeostasis and Psoriasis Pathogenesis
Hong Zhang (张红),1, 2, ∗ Wenhong Hou (侯文洪),1, ∗ Laurence Henrot,3 Marc
Dumas,4 Sylvianne Schnebert,4 Catherine Heus,4 and Jin Yang (杨劲)1, †
1CAS–MPG Partner Institute and Key Laboratory for Computational Biology,Shanghai Institutes for Biological Sciences, Shanghai 200031, China
2Naval Submarine Academy, Qingdao, Shandong 266000, China3Sprim Advanced Life Sciences, 1 Daniel Burnham Court, San Francisco, CA 94109, USA
4LVMH Research, 185 Avenue de Verdun, 45804, Saint-Jean-de-Braye, France(Dated: December 24, 2014)
We present a computational model to study the spatiotemporal dynamics of the epidermishomeostasis under normal and pathological conditions. The model consists of a populationkinetics model of the central transition pathway of keratinocyte proliferation, differentiation andloss and an agent-based model that propagates cell movements and generates the stratifiedepidermis. The model recapitulates observed homeostatic cell density distribution, the epidermalturnover time and the multilayered tissue structure. We extend the model to study the onset,recurrence and phototherapy-induced remission of psoriasis. The model considers the psoriasis as aparallel homeostasis of normal and psoriatic keratinocytes originated from a shared stem-cell nicheenvironment and predicts two homeostatic modes of the psoriasis: a disease mode and a quiescentmode. Interconversion between the two modes can be controlled by interactions between psoriaticstem cells and the immune system and by the normal and psoriatic stem cells competing for growthniches. The prediction of a quiescent state potentially explains the efficacy of the multi-episodeUVB irradiation therapy and recurrence of psoriasis plaques, which can further guide designs oftherapeutics that specifically target the immune system and/or the keratinocytes.
Keywords: Mathematical model, Epidermal homeostasis, Psoriasis, Bimodal switch, Immune system
I. INTRODUCTION
The epidermis, the outermost layer of skin, provides thehuman body a physiological barrier to the environment andprotects the body from water loss, pathogenic infectionand physical injury. The epidermis organizes into astratified structure of keratinocytes at several differentiatedstages [1], which constitute 95% cell population in theepidermis [2]. Like other regenerative tissues, the epidermisconstantly renews itself to replace desquamated and apoptotickeratinocytes, repair tissue damage and establish thehomeostasis. The renewal is orchestrated by a cascadeof cellular processes including proliferation, differentiation,migration, apoptosis and desquamation [3–5]. A keratinocytetransits spatially from the stratum basale to the stratumcorneum during its lifespan and meanwhile experiencesmulti-stage biochemical and morphological changes. Manyendogenous and exogenous factors (e.g., Ca2+ concentration,cytokines, UV irradiation, etc.) affect the epidermal dynamicsand the homeostasis of the epidermis by regulating one ormore cellular processes.
Mathematical and computational models have long beenuseful tools to predict cellular behaviors of the epidermisrenewal under normal or pathological conditions. Previousmodels for the epidermal dynamics usually adopted twoapproaches. One approach includes deterministic models thatderived analytical solutions to stationary cell populations.For example, the model by Savill [6] described proliferation
∗ These authors contributed equally† Correspondence. 320 Yue Yang Road, Shanghai 200031,
China. Tel: +86-21-54920476; Fax: +86-21-54920451; E-Mail:[email protected]
of stem cells and transit-amplifying cells and differentiationto post-mitotic cells, which predicted the influences ofapoptosis, cell-cycle time and transit time on cell populations.Gandolfi et al. [7] proposed a spatiotemporal model toinvestigate the evolution of epidermis, which describedcell motion by a constitutive equation. The otherapproach includes agent-based models that treat individualkeratinocytes as computing entities operating under specificphysical and biological rules. Such models can simulatethe multi-layer epidermal structure organized by cellproliferation, differentiation, death and migration, in whichnonspecific intracellular and extracellular biochemical factorsaffected cell proliferation and differentiation while physicaladhesive and repulsive forces governed cell motion [8–12].
In this paper, we present a hybrid model to combineadvantages of the above two approaches. The modeluses a mean-field cell population kinetics together with anagent-based model for cell migration. The model computespopulation dynamics of the epidermal renewal without havingto compute the cell movements simultaneously, allowingfast and analytical evaluations of modeling hypotheses andresults. The population kinetics model describes cellularprocesses including cell division, differentiation, apoptosisand desquamation. Either deterministic or stochasticsimulation can be used to generate the population dynamicsof keratinocytes. The cell migration is described by atwo-dimensional agent-based model that tracks the cellmovement driven by cell-cell interactions. Simulation ofthe cell migration can be integrated with the stochasticpopulation dynamics to visualize the tissue stratification andestablishment of homeostasis. A properly parameterizedmodel reproduces experimentally-observed epidermis growth,differentiation and desquamation dynamics, homeostaticdensity distribution over different types of keratinocytes andthe epidermis turnover times of different cell compartments.
arX
iv:1
312.
1401
v3 [
q-bi
o.M
N]
23
Dec
201
4
2
k5
Proliferation
Stem CellTransit-ampl-
ifying Cell
Growth-arre-
sted CellSpinous Cell
ApoptosisApoptosis
Proliferative Compartment
Proliferation
Stratum Basale
Nonproliferative Compartment
Stratum
Corneocyte
Desquamation
Corneum
Central Transition Pathway
Granular Cell
Granulosum
Apoptosis Apoptosis Apoptosis
γ1
γ2
β1
β2 β
3β
4β
5α
k5
k4
k3
k-2
k-1
k1s ,k
1a
Stratum StratumSpinosum
k2s ,k
2a
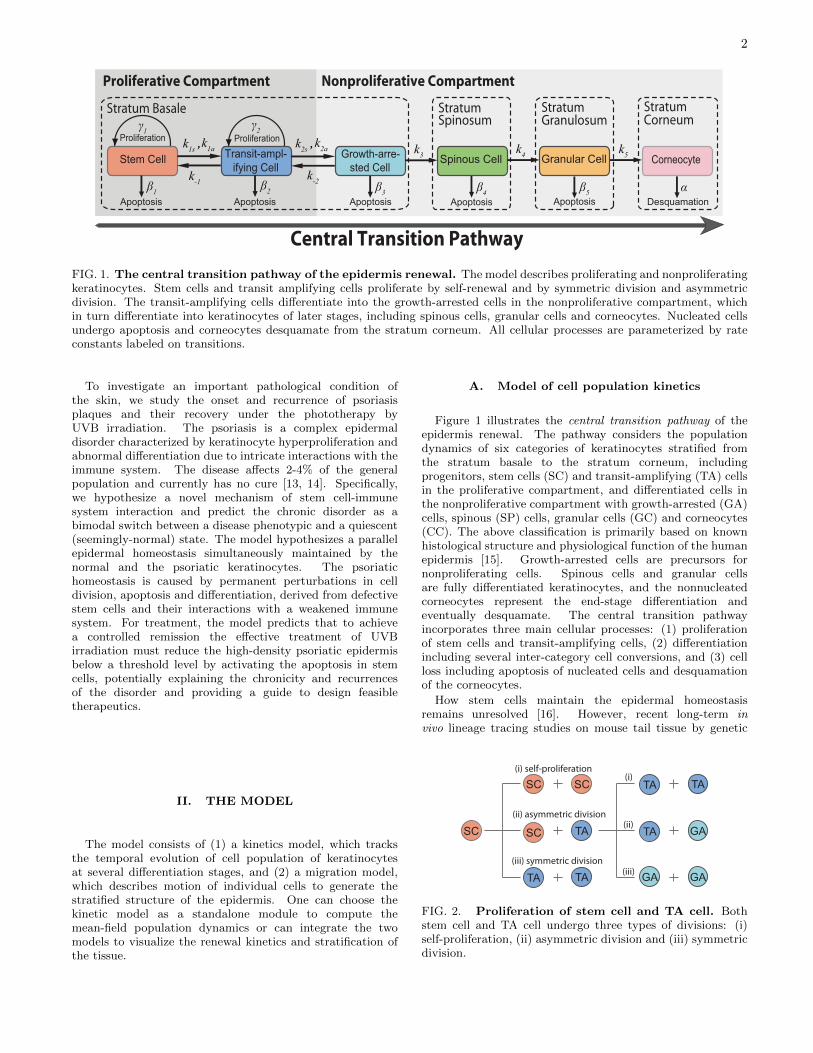
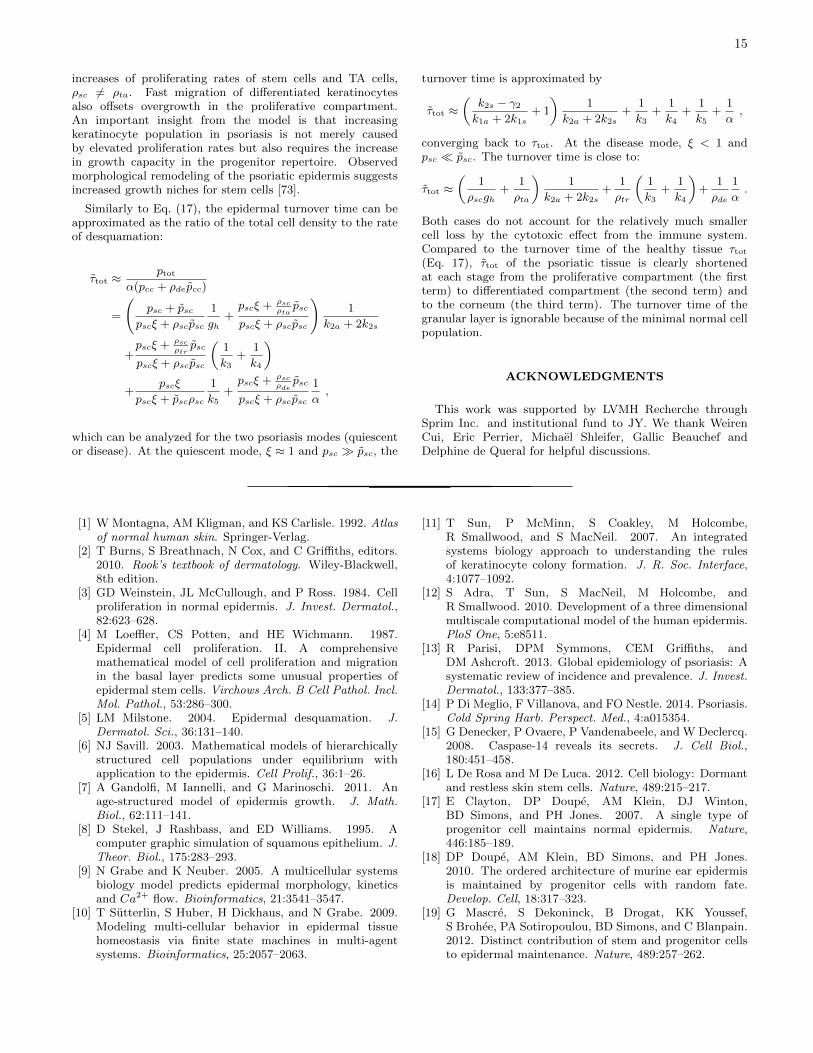
FIG. 1. The central transition pathway of the epidermis renewal. The model describes proliferating and nonproliferatingkeratinocytes. Stem cells and transit amplifying cells proliferate by self-renewal and by symmetric division and asymmetricdivision. The transit-amplifying cells differentiate into the growth-arrested cells in the nonproliferative compartment, whichin turn differentiate into keratinocytes of later stages, including spinous cells, granular cells and corneocytes. Nucleated cellsundergo apoptosis and corneocytes desquamate from the stratum corneum. All cellular processes are parameterized by rateconstants labeled on transitions.
To investigate an important pathological condition ofthe skin, we study the onset and recurrence of psoriasisplaques and their recovery under the phototherapy byUVB irradiation. The psoriasis is a complex epidermaldisorder characterized by keratinocyte hyperproliferation andabnormal differentiation due to intricate interactions with theimmune system. The disease affects 2-4% of the generalpopulation and currently has no cure [13, 14]. Specifically,we hypothesize a novel mechanism of stem cell-immunesystem interaction and predict the chronic disorder as abimodal switch between a disease phenotypic and a quiescent(seemingly-normal) state. The model hypothesizes a parallelepidermal homeostasis simultaneously maintained by thenormal and the psoriatic keratinocytes. The psoriatichomeostasis is caused by permanent perturbations in celldivision, apoptosis and differentiation, derived from defectivestem cells and their interactions with a weakened immunesystem. For treatment, the model predicts that to achievea controlled remission the effective treatment of UVBirradiation must reduce the high-density psoriatic epidermisbelow a threshold level by activating the apoptosis in stemcells, potentially explaining the chronicity and recurrencesof the disorder and providing a guide to design feasibletherapeutics.
II. THE MODEL
The model consists of (1) a kinetics model, which tracksthe temporal evolution of cell population of keratinocytesat several differentiation stages, and (2) a migration model,which describes motion of individual cells to generate thestratified structure of the epidermis. One can choose thekinetic model as a standalone module to compute themean-field population dynamics or can integrate the twomodels to visualize the renewal kinetics and stratification ofthe tissue.
A. Model of cell population kinetics
Figure 1 illustrates the central transition pathway of theepidermis renewal. The pathway considers the populationdynamics of six categories of keratinocytes stratified fromthe stratum basale to the stratum corneum, includingprogenitors, stem cells (SC) and transit-amplifying (TA) cellsin the proliferative compartment, and differentiated cells inthe nonproliferative compartment with growth-arrested (GA)cells, spinous (SP) cells, granular cells (GC) and corneocytes(CC). The above classification is primarily based on knownhistological structure and physiological function of the humanepidermis [15]. Growth-arrested cells are precursors fornonproliferating cells. Spinous cells and granular cellsare fully differentiated keratinocytes, and the nonnucleatedcorneocytes represent the end-stage differentiation andeventually desquamate. The central transition pathwayincorporates three main cellular processes: (1) proliferationof stem cells and transit-amplifying cells, (2) differentiationincluding several inter-category cell conversions, and (3) cellloss including apoptosis of nucleated cells and desquamationof the corneocytes.
How stem cells maintain the epidermal homeostasisremains unresolved [16]. However, recent long-term invivo lineage tracing studies on mouse tail tissue by genetic
SC TA GA
(i) self-proliferation
(ii) asymmetric division
(iii) symmetric division
(i)
(ii)
(iii)
SC
SC SC
TATA
TA TA
TA
GA GA
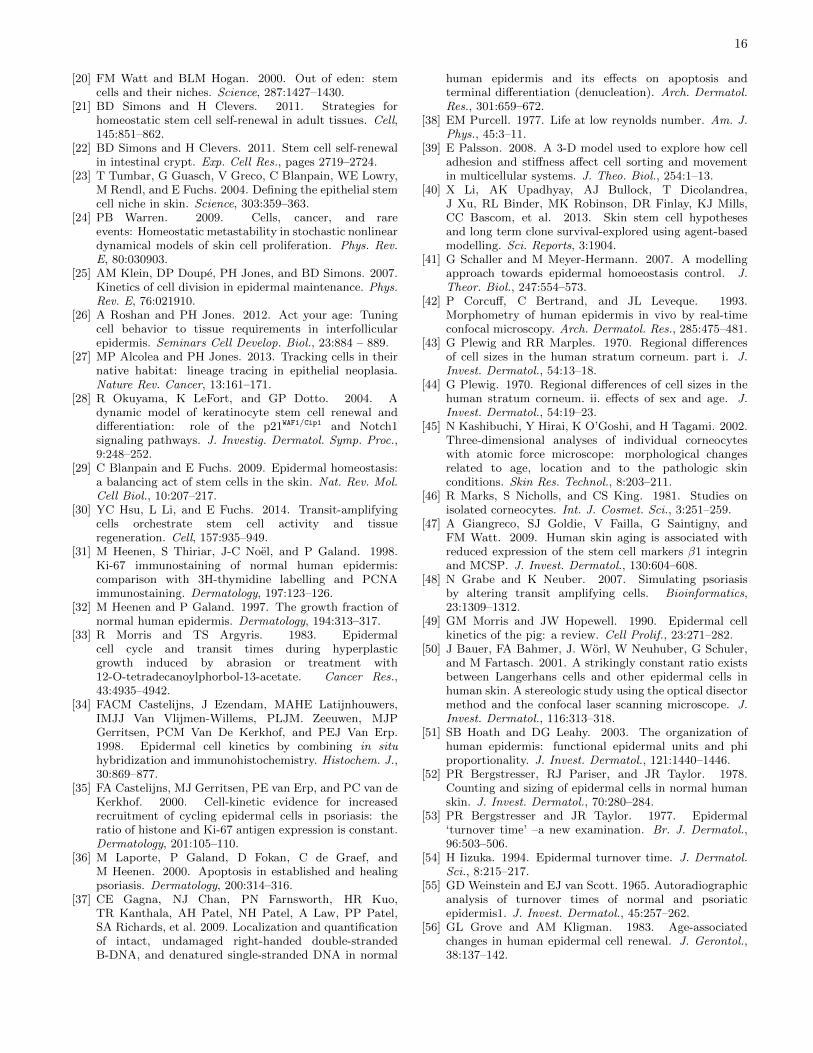
FIG. 2. Proliferation of stem cell and TA cell. Bothstem cell and TA cell undergo three types of divisions: (i)self-proliferation, (ii) asymmetric division and (iii) symmetricdivision.

3
labeling revealed remarkable details about clonal dynamicsof epidermal progenitors, suggesting the existence of eithersingle (stem cell alone) or two progenitors (stem cell andcommitted progenitor) [17–19]. As illustrated in Fig. 2,our model considers a slow cycling stem cell populationtogether with a faster proliferating committed progenitors(or, transit-amplifying cells). A stem cell divides in one ofthree modes [20–22]: (i) self-proliferation, by which a stem celldivides into two daughter stem cells, (ii) asymmetric division,by which a stem cell divides into a stem cell and a TA cell,or (iii) symmetric division, by which a stem cell divides intotwo TA cells. Considering a finite availability of stem cellniches [20, 23], we assume a logistic growth of stem cells tolimit the stem cell density by a maximal growth capacity,which ensures the system to reach a well-defined steady state(see Ref. [24] for a more general model that guarantees asteady state). Previous models [17, 25] required a precisebalance between stem cell self-proliferation and symmetricdivision and were intolerable to arbitrary perturbations suchas population random drift caused by intrinsic stochasticityin the three-mode stem cell division. Similarly, TA cellsalso divide in one of the three modes of self-proliferation,symmetric and asymmetric division into the GA cells [17, 26,27]. In addition, a TA cell may resume the stem cell state anda GA cell may resume a TA cell state by backconversions [28].
The rate of progenitor division is often characterized bythe cell-cycle time and by the subpopulation of cells that areactive to divide (also known as the “growth fraction”). Ourmean-field model does not distinguish proliferative propensityin individual cells and therefore parameterizes cell divisionswith empirical rate constants that integrate influences of thecell cycle and the growth fraction. Environmental changesregulate the proliferation rate of stem cells. For example,the need of repairing tissue damage promotes stem cellproliferation [19, 21, 29]. Recent study of hair folliclesshowed that TA cells may signal to stem cells to regulateproliferation [30]. To incorporate this feedback mechanism,we assume an empirical dependence of stem cell division rateconstants, γ1, k1a and k1s, on the density of TA cells anddefine:
γ1
γ1,h=
k1a
k1a,h=
k1s
k1s,h=
ω
1 + (ω − 1)(pta/pta,h)n, (1)
where the subscript h indicates a homeostatic rate constant(see Table III for numerical values), and ω ≡ rx,max/rx,h is theratio of the maximum division rate to the homeostatic rateand is assumed identical for all division processes. ω reflectsthe maximum increase in the growth fraction and/or decreasein the cell cycle time when stem cell proliferation accelerates.At homeostasis of the normal epidermis, the reported growthfraction varied from 20% to 70% [31, 32]. Study in miceepidermis found more than 10-fold decrease in the cell cycletime from 5-7 days to 11 hours following tissue abrasion [33],whereas no significant change in cell cycle time was foundin psoriasis [34, 35]. The exponent n models the sensitivityto the deviation of TA density from the homeostasis. In thelimit of a much reduced TA cell density (pta pta,h), stemcells divide at the maximum rate, rx,max, whereas stem cellsdivide at a minimal rate when TA cells overpopulate (pta pta,h). The total stem cell proliferating rate at homeostasis isset about 10−2 per day, aligned with 4-6 division events peryear [19].
The nonproliferative compartment describes a cascade ofdifferentiations from GA cells to corneocytes. The model also
Ep
ide
rmis
thic
kn
ess
Re
te r
idg
e
he
igh
t
(c)
Basement
membrane
F12
F13F
1
S13
S12
F12=kS12sinθ12
F1=F
12+F
13
h
w
Cell center
2
1
3
F12=kS12cosθ12r,x
r,y
F13=kS13sinθ13
F13=kS13cosθ13r,x
r,y
(a)
θ13
θ12
H
F1=F
12+F
13
Cell center
2
1
(b)
g12
3
F12
F13
g13
y12x
12
Repulsive force
Adhesive force
θ13
θ12
F 12
a,y= sinθ12
F 12
a,x= cosθ12
F 13
a,x= cosθ13
F 13
a,y= sinθ13
ƒadh(g12 )
ƒadh(g12 )
ƒadh(g13 )
ƒadh(g13 )
r r r
rr
r
a aa
a
a
F1
a
Dermis
FIG. 3. Mechanics of cell migration. Keratinocytesare geometrically modeled as irrotational ellipsoids with twoprincipal axes staying horizontal or vertical. (a) A repulsiveforce is determined by an overlap between neighboring cells.The repulsion Fr12 between cells 1 and 2 is proportional tothe overlapping area S12 approximated by the correspondingoverlap rectangle. Fr13 is determined similarly. The netrepulsion on cell 1 is a vector sum Fr1 = Fr12 + Fr13. (b)The adhesive force exists between two adjacent cells. Theforce Fa12 is related to the distance between cell 1 and cell 2.The direction of Fa12 or Fr12 acting on cell 1 is paralleled tothe line (dashed) connecting centers of cell 1 and cell 2. Therepulsive force and adhesive force between two overlappedcells are balanced by the force generated by viscosity dueto cell motion. Cell motion is only translational withoutrotation. w and h denote the width and height of a cell.(c) Epidermis thickness, rete ridge height, and undulantbasement membrane geometrically configure the epidermis ina 2D projection.
considers an apoptosis process for all nucleated keratinocytes.Early studies suggested that apoptosis was only significantfor stem cells and transit-amplifying cells in the proliferativecompartment [36]. Recent experiment [37] also showed thatapoptosis was evident in the differentiated keratinocytes. Theextent of apoptosis is commonly characterized by apoptotic

4
index, which is typically quantified using the TUNEL(transferase-mediated uridine nick end labelling) assay [36].For a cell type i, the apoptosis index equals the probabilitythat a cell undergoes apoptosis, defined as the ratio ofapoptosis rate fapop
i to the total outflux fouti including rates
of apoptosis and transition to the downstream cell category:
AI =fapopi
fouti
=βi
βi + ki, i = 1, ...5 , (2)
For stem cells and TA cells, k1 = k1s and k2 = k2s
are symmetric division rate constants. Experiments oftenreported global apoptosis indices that did not differentiateapoptotic activities in proliferative and non-proliferativecompartments. Apoptotic heterogeneities of cells within acompartment is even less known. Here each cell category isassumed an identical apoptosis index that is used to calculatethe apoptosis rate constants β′is. Governing system equations(ODEs) are listed in Table I and computation of the model isdescribed in the Supplementary Material (Fig. S1).
B. Model of cell migration
The agent-based migration model describes movementof all keratinocytes in a two-dimensional (cross-sectional)epidermis volume. Keratinocytes once derived from stemcells move outward from the stratum basale to the outermoststratum corneum, to compose a stratified epidermis. Themodel describes cell mechanics that propels cell movement.An individual cell is subject to three forces: (i) a viscousforce due to cell moving in the surrounding environment; (ii)a repulsive force due to cell-cell compression; and (iii) anadhesive force due to interactions among adhesive moleculeson cell membranes. Considering the sluggish keratinocytemotion (in a scale of µm/hr) in a fluidic environment with alow Reynolds number (i.e., viscosity dominates inertia) [38],the model neglects the acceleration due to inertia. The modelalso considers keratinocytes as non-chemical tactic cells thatdo not move by self-propulsion. The force balance for the ithcell is
µdxidt
+ Fri + Fai = 0 , (3)
where vector xi is the cell-center coordinate, and µ is theviscosity coefficient. The first term in Eq. (3) is the viscosityof the epidermis. Fri and Fai are repulsive and adhesive forcesbetween neighboring cells, which are sums of forces derivedfrom all individual pairwise contacts,
Fri =∑
j=O(i)
Frij , Fai =∑j=Ω(i)
Faij , (4)
where O(i) and Ω(i) denote sets of cells overlapping andneighboring with the ith cell and Frij and Faij are force vectorsproduced onto cell i by interaction (repulsion or adhesion)between cells i and j. By symmetry, Frij = −Frji andFaij = −Faji. The model treats individual cells as rigid-bodyagents and uses the extent of virtual cell overlap to determinethe repulsive force [Fig. 3(a)]. Adhesion between two cellsis a function of their spatial distance [39, 40] [Fig. 3(b)].Computation of Frij and Faij is given in the SupplementaryMaterial.
Previous agent-based models [9, 11, 41] treatedkeratinocytes as identically-sized circles or spheres. However,
cells progressively adopt varied shapes and sizes at differentstages of differentiation. Cells in an outer layer generally havemore flattened cell body and larger surface area, comparedto cells in layers underneath. Tissue location in the bodycan also influence the cell geometry. For example, comparedto the mean basal cell diameter of 6-8 µm at the forearmand hand [42], at unexposed sites in the adult tissue [3], theaverage cell diameter in the proliferative compartment isabout 10 µm whereas the average differentiated cell diameteris about 16 µm. For simplicity, we use ellipsoids to modelgeometric heterogeneity in cell morphology and size. Celltypes are distinguished by the mean major-to-minor axisratio and the mean nominal size.
The basement membrane of the epidermis is undulantwith rete ridges extending downward between the dermalpapillae [Fig. 3(c)]. In adult human epidermis, the averagerete ridge height is about 40 µm in the adult tissue, andabout six rete ridges along 1 mm cross-sectional tissue lengthwere observed [47], which changes with age. The basementmembrane is modeled by periodically-repeating Gaussianfunctions (see the Supplementary Material). Parameters ofcell sizes and epidermis thickness are listed in Table II.
III. RESULTS
The model recapitulates two important measures of theepidermis homeostasis: cell counts in different layers and theepidermal turnover times in different compartments.
A. Homeostatic cell density distribution
The mean homeostatic cell densities can be analyticallycalculated from the ordinary differential equations in Table Ias follows (see Table III for definitions of parameters).
psc = pmaxsc
1− 1
γ1
k1s + β1 −k−1(k1a + 2k1s)
k−1 + k2s + β2 − γ2 − k−2(k2a+2k2s)
k−2+k3+β3
,
(5)
pta =k1a + 2k1s
k−1 + k2s + β2 − γ2 − k−2(k2a+2k2s)
k−2+k3+β3
psc , (6)
pga =k2a + 2k2s
k−2 + k3 + β3pta, (7)
psp =k3
k4 + β4pga , (8)
pgc =k4
k5 + β5psp, (9)
pcc =k5
αpgc , (10)
and the total cell density is given as
ptot = psc + pta + pga + psp + pgc + pcc . (11)
The density of each cell category is proportional to theepidermis capacity of stem cells, pmax
sc and the ratio betweendensities of any pair of cell types is a constant. Therefore,
5
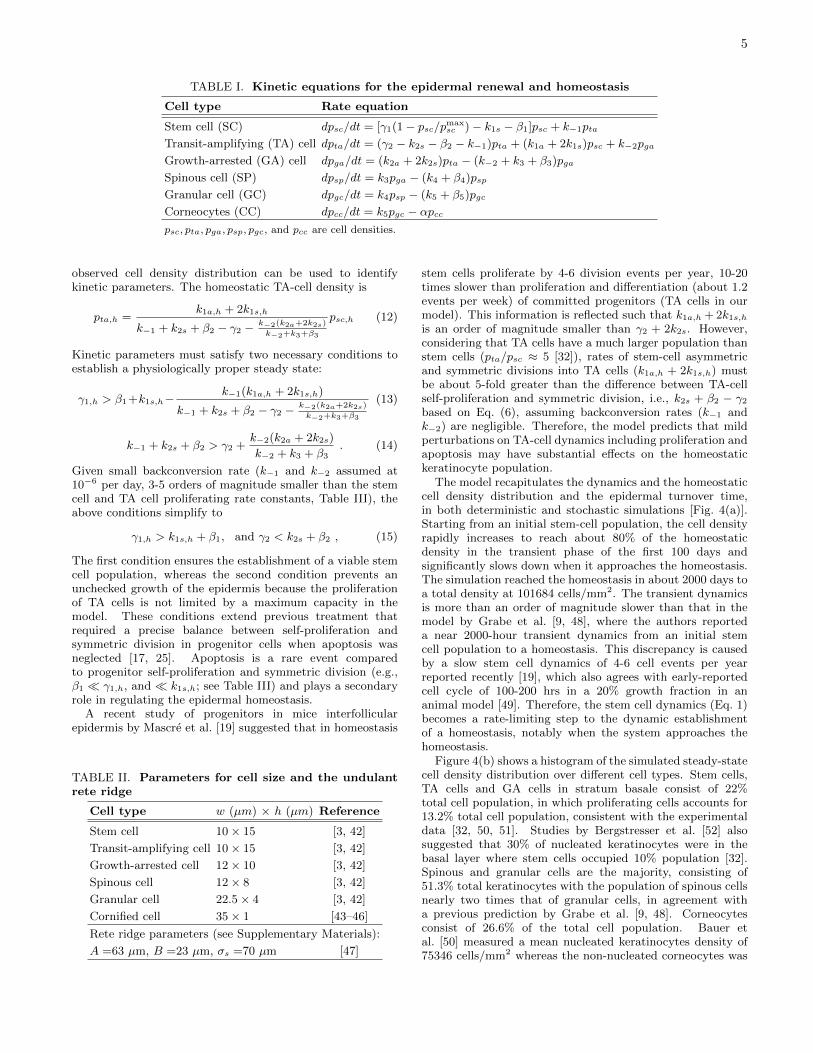
TABLE I. Kinetic equations for the epidermal renewal and homeostasis
Cell type Rate equation
Stem cell (SC) dpsc/dt = [γ1(1− psc/pmaxsc )− k1s − β1]psc + k−1pta
Transit-amplifying (TA) cell dpta/dt = (γ2 − k2s − β2 − k−1)pta + (k1a + 2k1s)psc + k−2pga
Growth-arrested (GA) cell dpga/dt = (k2a + 2k2s)pta − (k−2 + k3 + β3)pga
Spinous cell (SP) dpsp/dt = k3pga − (k4 + β4)psp
Granular cell (GC) dpgc/dt = k4psp − (k5 + β5)pgc
Corneocytes (CC) dpcc/dt = k5pgc − αpccpsc, pta, pga, psp, pgc, and pcc are cell densities.
observed cell density distribution can be used to identifykinetic parameters. The homeostatic TA-cell density is
pta,h =k1a,h + 2k1s,h
k−1 + k2s + β2 − γ2 − k−2(k2a+2k2s)
k−2+k3+β3
psc,h (12)
Kinetic parameters must satisfy two necessary conditions toestablish a physiologically proper steady state:
γ1,h > β1+k1s,h−k−1(k1a,h + 2k1s,h)
k−1 + k2s + β2 − γ2 − k−2(k2a+2k2s)
k−2+k3+β3
(13)
k−1 + k2s + β2 > γ2 +k−2(k2a + 2k2s)
k−2 + k3 + β3. (14)
Given small backconversion rate (k−1 and k−2 assumed at10−6 per day, 3-5 orders of magnitude smaller than the stemcell and TA cell proliferating rate constants, Table III), theabove conditions simplify to
γ1,h > k1s,h + β1, and γ2 < k2s + β2 , (15)
The first condition ensures the establishment of a viable stemcell population, whereas the second condition prevents anunchecked growth of the epidermis because the proliferationof TA cells is not limited by a maximum capacity in themodel. These conditions extend previous treatment thatrequired a precise balance between self-proliferation andsymmetric division in progenitor cells when apoptosis wasneglected [17, 25]. Apoptosis is a rare event comparedto progenitor self-proliferation and symmetric division (e.g.,β1 γ1,h, and k1s,h; see Table III) and plays a secondaryrole in regulating the epidermal homeostasis.
A recent study of progenitors in mice interfollicularepidermis by Mascre et al. [19] suggested that in homeostasis
TABLE II. Parameters for cell size and the undulantrete ridge
Cell type w (µm) × h (µm) Reference
Stem cell 10× 15 [3, 42]
Transit-amplifying cell 10× 15 [3, 42]
Growth-arrested cell 12× 10 [3, 42]
Spinous cell 12× 8 [3, 42]
Granular cell 22.5× 4 [3, 42]
Cornified cell 35× 1 [43–46]
Rete ridge parameters (see Supplementary Materials):
A =63 µm, B =23 µm, σs =70 µm [47]
stem cells proliferate by 4-6 division events per year, 10-20times slower than proliferation and differentiation (about 1.2events per week) of committed progenitors (TA cells in ourmodel). This information is reflected such that k1a,h + 2k1s,h
is an order of magnitude smaller than γ2 + 2k2s. However,considering that TA cells have a much larger population thanstem cells (pta/psc ≈ 5 [32]), rates of stem-cell asymmetricand symmetric divisions into TA cells (k1a,h + 2k1s,h) mustbe about 5-fold greater than the difference between TA-cellself-proliferation and symmetric division, i.e., k2s + β2 − γ2
based on Eq. (6), assuming backconversion rates (k−1 andk−2) are negligible. Therefore, the model predicts that mildperturbations on TA-cell dynamics including proliferation andapoptosis may have substantial effects on the homeostatickeratinocyte population.
The model recapitulates the dynamics and the homeostaticcell density distribution and the epidermal turnover time,in both deterministic and stochastic simulations [Fig. 4(a)].Starting from an initial stem-cell population, the cell densityrapidly increases to reach about 80% of the homeostaticdensity in the transient phase of the first 100 days andsignificantly slows down when it approaches the homeostasis.The simulation reached the homeostasis in about 2000 days toa total density at 101684 cells/mm2. The transient dynamicsis more than an order of magnitude slower than that in themodel by Grabe et al. [9, 48], where the authors reporteda near 2000-hour transient dynamics from an initial stemcell population to a homeostasis. This discrepancy is causedby a slow stem cell dynamics of 4-6 cell events per yearreported recently [19], which also agrees with early-reportedcell cycle of 100-200 hrs in a 20% growth fraction in ananimal model [49]. Therefore, the stem cell dynamics (Eq. 1)becomes a rate-limiting step to the dynamic establishmentof a homeostasis, notably when the system approaches thehomeostasis.
Figure 4(b) shows a histogram of the simulated steady-statecell density distribution over different cell types. Stem cells,TA cells and GA cells in stratum basale consist of 22%total cell population, in which proliferating cells accounts for13.2% total cell population, consistent with the experimentaldata [32, 50, 51]. Studies by Bergstresser et al. [52] alsosuggested that 30% of nucleated keratinocytes were in thebasal layer where stem cells occupied 10% population [32].Spinous and granular cells are the majority, consisting of51.3% total keratinocytes with the population of spinous cellsnearly two times that of granular cells, in agreement witha previous prediction by Grabe et al. [9, 48]. Corneocytesconsist of 26.6% of the total cell population. Bauer etal. [50] measured a mean nucleated keratinocytes density of75346 cells/mm2 whereas the non-nucleated corneocytes was

6
100
101
102
103
104
0
1
2
3
4
5x 10
4
(a)
time (day)
cell
den
sity
(m
m−
2)
SC
TA
GA
SP
GC
CC
SC TA GA SP GC CC0
10
20
30
40 (b)
per
centa
ge
(%)
cell type
2.2
11.08.8
34.2
17.1
26.6
FIG. 4. Dynamic and homeostatic keratinocytes density distribution. (a) Temporal evolutions of cell population ofdifferent types of keratinocytes by a deterministic simulation (smooth curves) and a stochastic simulation (fluctuated curves).Deterministic simulations started with an initial stem cell density of 1000 mm−2, which corresponds to 10 cells under a skinarea of 0.01 mm−2 for the stochastic simulation. (b) The histogram of the steady-state cell density distribution. (c) Snapshotsat day 1, 35, 102, and 988 of the visualization of the two-dimensional epidermis with a thickness of 10 µm. Simulation startedwith stem cells randomly located along the basement membrane (day 1). Parameter values used in simulations are listed inTable III.
estimated to be about 18000 cells/mm2, consisting of 19.3%total cell population [51].
Figure 4(c) shows snapshots of temporal evolution oftwo-dimensional epidermal stratification from an initial groupof stem cells distributed along the basement membrane tothe homeostasis. We compute the cell population dynamicsand the cell migration within an area of 1 mm in length by10 µm in width. The cell density is defined over a surfacearea number of keratinocytes per mm2 without explicitlyconsidering the epidermis height. The choice of 10 µm (about
the mean cell size) is to visualize a two-dimensional singlelayer of keratinocytes. The simulated tissue histology showsthat the thickness of the nucleated epidermis is about 60 µm,aligning with observations ranging from 38 µm to 77 µm witha mean of 60 µm in the adult tissue, with little variationacross age groups [42, 47, 50]. A movie of the epidermisrenewal process of the normal tissue is available at URL:http://www.picb.ac.cn/stab/epidermal.html.
7
B. The epidermal turnover time
Another common measure of epidermis homeostasis isthe epidermal turnover time τ . At the tissue level, τis interpreted as a time required for replacing the entireepidermis with new keratinocytes. The epidermal turnovertime varies significantly with age groups, tissue locationsand cell densities. In earlier studies, τ has been reportedapproximately 6-7 weeks in the volar forearm with a nucleatedcell density of 44000 mm−2 [53, 54]. Based on a morerecent count of nucleated cell density of 75346 mm−2 onbreast skin [50], Hoath and Leahy [51] suggested that τshould be calculated as 59.3 days. Renewal of a specificlayer of keratinocytes takes a shorter turnover time. Theturnover times of the stratum basale and the differentiatedcompartment were reported being about 22 and 12 days [54],whereas the stratum corneum has a turnover time thatvaries from 14 days [54, 55] to about 20 days in youngadult [56]. Following the convention [54], we calculate τ asthe ratio of total cell density to the rate of cell loss includingdesquamation and apoptosis, or alternatively, the ratio oftotal cell density to the rate of cell birth by stem cell and TAcell divisions because cell birth and death rates are balancedat homeostasis:
τ =ptot
rgrowth=ptot
rloss, (16)
where the rates of cell growth and cell loss are
rgrowth = [γ1(1− psc/pmaxsc ) + k1a + k1s]psc
+(γ2 + k2a + k2s)pta
rloss = β1psc + β2pta + β3pga + β4psp + β5pgc + αpcc .
Analytical solution to τ can be obtained by substitutingEqs. (5)-(10) into the above equation. Apoptosis eventsrepresent rare ramifications from the central transitionpathway in the normal epidermis renewal. Rate constantof an apoptotic process βi (10−4-10−5/day) is much smallerthan the differentiation and desquamation rate constants kiand α (about 10−1/day, see Table III). We can approximaterloss by the rate of desquamation. By also neglecting thebackconversions, we have
τ = τprolif + τdiff + τcorn , (17)
where
τprolif =
(k2s − γ2
k1a + 2k1s+ 1
)1
k2a + 2k2s(18)
τdiff =1
k3+
1
k4+
1
k5
τcorn =1
α.
τ is the sum of contributions by sub-compartment turnovertimes as keratinocytes migrate from the proliferativecompartment (τprolif) through the differentiated compartment(τdiff) and then through the stratum corneum (τcorn). Wenote that τ is independent of the stem cell self-proliferationγ1 and the stem cell capacity pmax
sc . These two parametersdetermine the steady-state stem cell density psc. Both celldensity and cell growth rate are proportional to psc, whichmasks the effect of stem cell self-proliferation dynamics on theturnover times. The turnover time of a single cell category isthe inverse of the rate constant for the transit to the next cellcategory. Therefore, τ can be dominated by a rate-limiting
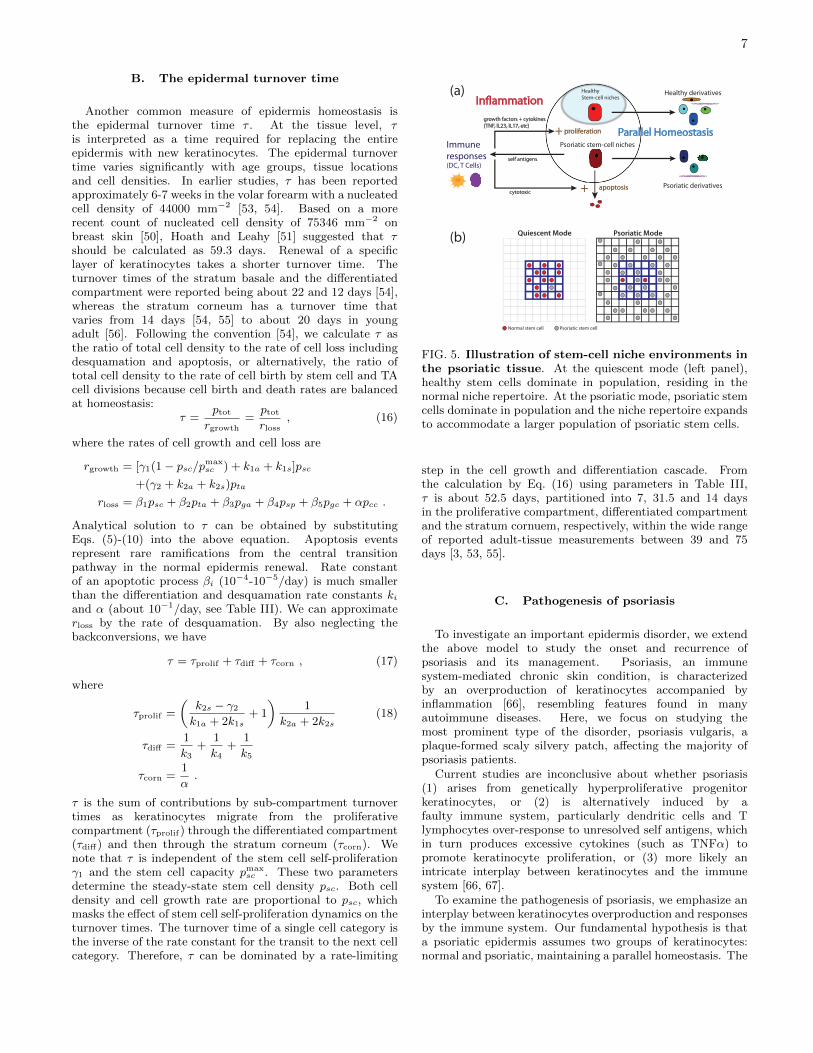
Healthy
Stem-cell niches
Psoriatic stem-cell niches
Healthy derivatives
Psoriatic derivativesapoptosis+
Immune
responses(DC, T Cells)
cytotoxic
proliferation+growth factors + cytokines
(TNF, IL23, IL17, etc)
self antigens
Parallel Homeostasis
In!ammation
Quiescent Mode Psoriatic Mode
Normal stem cell Psoriatic stem cell
(a)
(b)
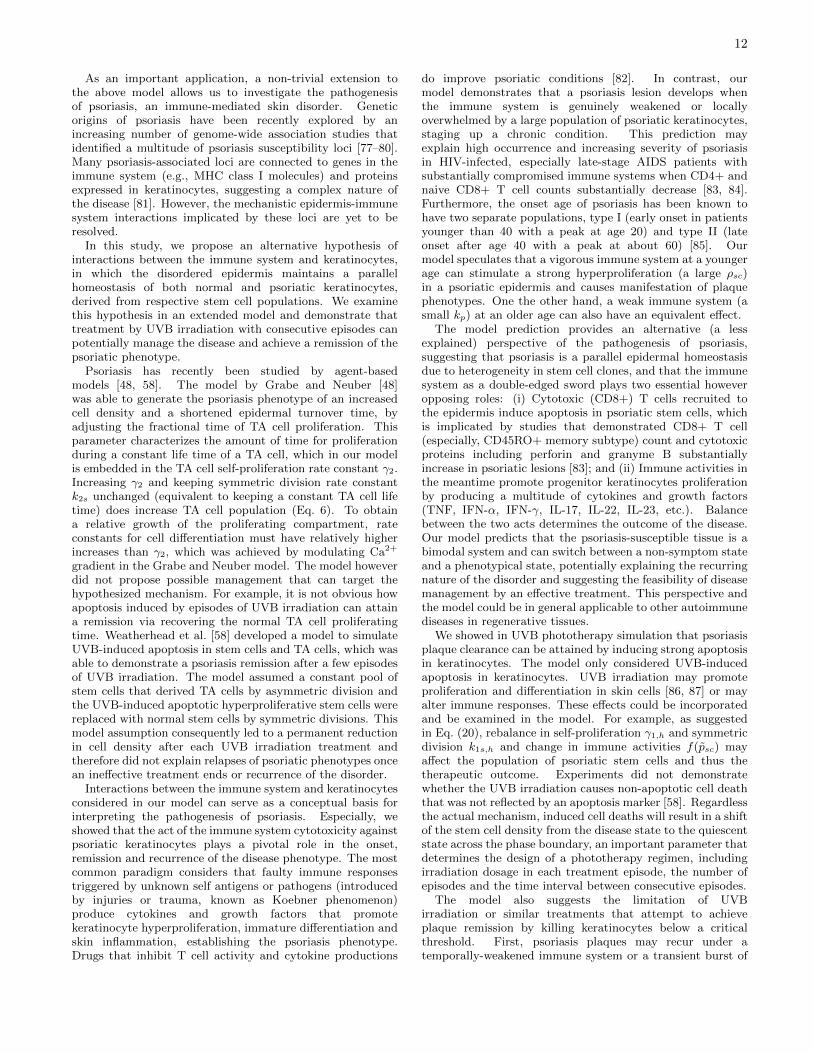
FIG. 5. Illustration of stem-cell niche environments inthe psoriatic tissue. At the quiescent mode (left panel),healthy stem cells dominate in population, residing in thenormal niche repertoire. At the psoriatic mode, psoriatic stemcells dominate in population and the niche repertoire expandsto accommodate a larger population of psoriatic stem cells.
step in the cell growth and differentiation cascade. Fromthe calculation by Eq. (16) using parameters in Table III,τ is about 52.5 days, partitioned into 7, 31.5 and 14 daysin the proliferative compartment, differentiated compartmentand the stratum cornuem, respectively, within the wide rangeof reported adult-tissue measurements between 39 and 75days [3, 53, 55].
C. Pathogenesis of psoriasis
To investigate an important epidermis disorder, we extendthe above model to study the onset and recurrence ofpsoriasis and its management. Psoriasis, an immunesystem-mediated chronic skin condition, is characterizedby an overproduction of keratinocytes accompanied byinflammation [66], resembling features found in manyautoimmune diseases. Here, we focus on studying themost prominent type of the disorder, psoriasis vulgaris, aplaque-formed scaly silvery patch, affecting the majority ofpsoriasis patients.
Current studies are inconclusive about whether psoriasis(1) arises from genetically hyperproliferative progenitorkeratinocytes, or (2) is alternatively induced by afaulty immune system, particularly dendritic cells and Tlymphocytes over-response to unresolved self antigens, whichin turn produces excessive cytokines (such as TNFα) topromote keratinocyte proliferation, or (3) more likely anintricate interplay between keratinocytes and the immunesystem [66, 67].
To examine the pathogenesis of psoriasis, we emphasize aninterplay between keratinocytes overproduction and responsesby the immune system. Our fundamental hypothesis is thata psoriatic epidermis assumes two groups of keratinocytes:normal and psoriatic, maintaining a parallel homeostasis. The
8
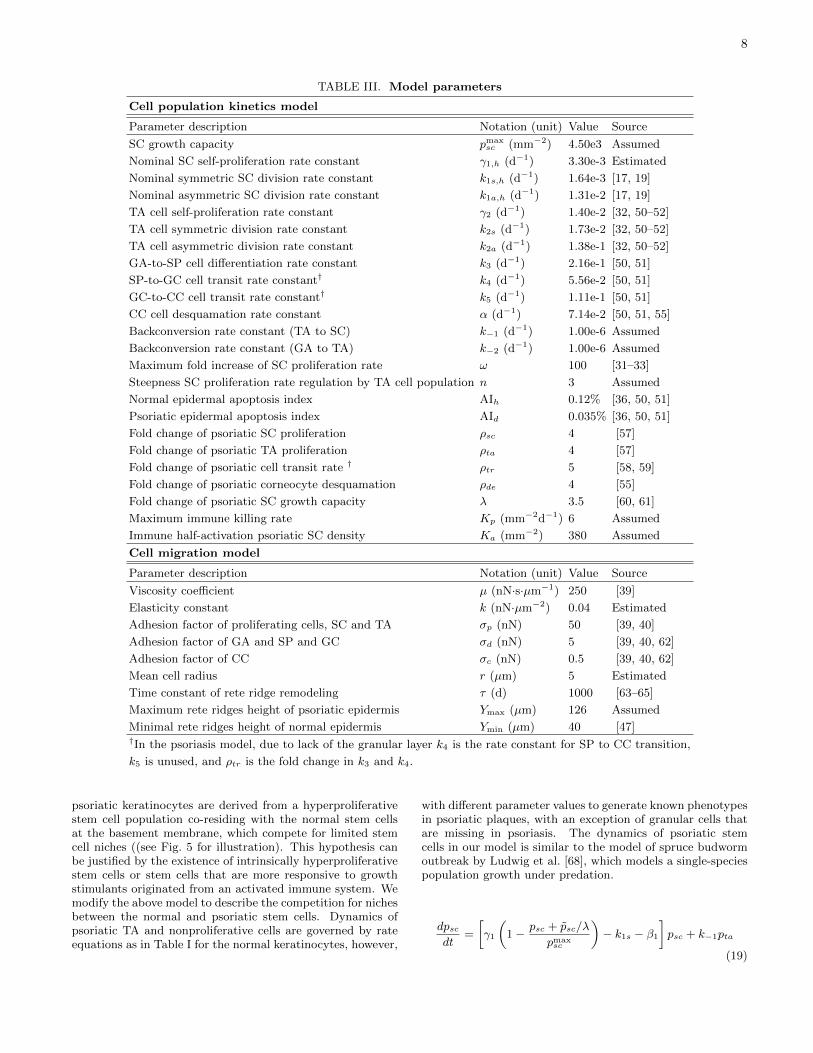
TABLE III. Model parameters
Cell population kinetics model
Parameter description Notation (unit) Value Source
SC growth capacity pmaxsc (mm−2) 4.50e3 Assumed
Nominal SC self-proliferation rate constant γ1,h (d−1) 3.30e-3 Estimated
Nominal symmetric SC division rate constant k1s,h (d−1) 1.64e-3 [17, 19]
Nominal asymmetric SC division rate constant k1a,h (d−1) 1.31e-2 [17, 19]
TA cell self-proliferation rate constant γ2 (d−1) 1.40e-2 [32, 50–52]
TA cell symmetric division rate constant k2s (d−1) 1.73e-2 [32, 50–52]
TA cell asymmetric division rate constant k2a (d−1) 1.38e-1 [32, 50–52]
GA-to-SP cell differentiation rate constant k3 (d−1) 2.16e-1 [50, 51]
SP-to-GC cell transit rate constant† k4 (d−1) 5.56e-2 [50, 51]
GC-to-CC cell transit rate constant† k5 (d−1) 1.11e-1 [50, 51]
CC cell desquamation rate constant α (d−1) 7.14e-2 [50, 51, 55]
Backconversion rate constant (TA to SC) k−1 (d−1) 1.00e-6 Assumed
Backconversion rate constant (GA to TA) k−2 (d−1) 1.00e-6 Assumed
Maximum fold increase of SC proliferation rate ω 100 [31–33]
Steepness SC proliferation rate regulation by TA cell population n 3 Assumed
Normal epidermal apoptosis index AIh 0.12% [36, 50, 51]
Psoriatic epidermal apoptosis index AId 0.035% [36, 50, 51]
Fold change of psoriatic SC proliferation ρsc 4 [57]
Fold change of psoriatic TA proliferation ρta 4 [57]
Fold change of psoriatic cell transit rate † ρtr 5 [58, 59]
Fold change of psoriatic corneocyte desquamation ρde 4 [55]
Fold change of psoriatic SC growth capacity λ 3.5 [60, 61]
Maximum immune killing rate Kp (mm−2d−1) 6 Assumed
Immune half-activation psoriatic SC density Ka (mm−2) 380 Assumed
Cell migration model
Parameter description Notation (unit) Value Source
Viscosity coefficient µ (nN·s·µm−1) 250 [39]
Elasticity constant k (nN·µm−2) 0.04 Estimated
Adhesion factor of proliferating cells, SC and TA σp (nN) 50 [39, 40]
Adhesion factor of GA and SP and GC σd (nN) 5 [39, 40, 62]
Adhesion factor of CC σc (nN) 0.5 [39, 40, 62]
Mean cell radius r (µm) 5 Estimated
Time constant of rete ridge remodeling τ (d) 1000 [63–65]
Maximum rete ridges height of psoriatic epidermis Ymax (µm) 126 Assumed
Minimal rete ridges height of normal epidermis Ymin (µm) 40 [47]†In the psoriasis model, due to lack of the granular layer k4 is the rate constant for SP to CC transition,
k5 is unused, and ρtr is the fold change in k3 and k4.
psoriatic keratinocytes are derived from a hyperproliferativestem cell population co-residing with the normal stem cellsat the basement membrane, which compete for limited stemcell niches ((see Fig. 5 for illustration). This hypothesis canbe justified by the existence of intrinsically hyperproliferativestem cells or stem cells that are more responsive to growthstimulants originated from an activated immune system. Wemodify the above model to describe the competition for nichesbetween the normal and psoriatic stem cells. Dynamics ofpsoriatic TA and nonproliferative cells are governed by rateequations as in Table I for the normal keratinocytes, however,
with different parameter values to generate known phenotypesin psoriatic plaques, with an exception of granular cells thatare missing in psoriasis. The dynamics of psoriatic stemcells in our model is similar to the model of spruce budwormoutbreak by Ludwig et al. [68], which models a single-speciespopulation growth under predation.
dpscdt
=
[γ1
(1− psc + psc/λ
pmaxsc
)− k1s − β1
]psc + k−1pta
(19)

9
TABLE IV. Cell density distribution (mm−2) and turnover times (day)∗
Healthy tissue Psoriasis† Non-symptom†
SC 2268 362+6459 2232+124
TA 11219 77+32098 10715+618
GA 8964 61+20536 8562+395
SP 34799 238+79788 33236+1536
GC 17379 119+0 16598+0
CC 27055 185+77633 25840+1495
Total 101684 1042+216514 97183+4168
τ=τprolif+τdiff+τcorn 52.5=7.0+31.5+14.0 9.8=1.8+4.5+3.5 44.5=6.0+26.5+12.0†Normal+Psoriatic (px + px).∗Results are generated using parameters in Table III.
dpscdt
=
[ρscγ1,h
(1− psc + psc
λpmaxsc
)− ρsck1s,h − β1
]psc
−f(psc) + k−1pta (20)
f(psc) =Kpp
2sc
K2a + p2
sc
. (21)
The psoriatic tissue activates the immune system to combatdisease cells. We assume that repertoires for normal pscand psoriatic psc stem cells are both limited by availableniche environment and psoriatic stem cells can acquire alarger growth capacity. Parameter λ (> 1) accounts forthe fold increase in the growth capacity accessible to stemcells. The density of normal stem cells remains limited bypmaxsc , which is invaded by a fraction (1/λ) of psoriatic stem
cells. Equation (21) models the immune activities triggeredby psoriatic stem cells. An activated immune system inducesapoptosis of psoriatic stem cells. The activity of the immunesystem (the killing rate, f(psc)) is directly regulated bythe psoriatic stem cell density, under the assumption thatthe immune system is activated in a faster time scale thanthe tissue growth. The immune response is significantlyactivated when psc exceeds a threshold parameterized byKa and is saturated at the maximum rate Kp at psc Ka when the psoriatic stem-cell population overwhelms thatof cytotoxic T cells. This approach hypothesizes that theimmune system combats disease stem cells, but does notexclude the commonly-believed role by the immune system ofinducing keratinocyte overproduction, even though the modeldoes not explicitly couple the immune system to stem-cellproliferation.
Proliferation rate constants γ1, k1s and k1a for the normalstem cells are regulated by the total TA cells, pta+pta, similarto Eq. (1):
γ1
γ1,h=
k1a
k1a,h=
k1s
k1s,h=
ω
1 + (ω − 1)[(pta + pta)/pta,h]n.
(22)In comparison, we assume that psoriatic stem cells are notsubject to regulation by the TA cell population and proliferatewith rates ρsc-fold higher than the homeostatic rate constants(γ1,h, k1a,h and k1s,h) of normal stem cells. We assumethat the immune response substantially switches on whenthe psoriatic stem cell population reaches 10% of stem cellpopulation in the normal tissue. This assumption is used toparameterize the steepest change in the removal rate f(psc)in response to psc, which sets the half-activation density at
Ka =√
3psc,h/10. The model does not consider immuneresponses against cells derived from psoriatic stem cells byobserving that reduction in stem cell population results in asubsequent reduction in the derived keratinocyte population.
Despite its mechanistic uncertainties, psoriasis plaqueshave well-defined tissue-level phenotypes, making it a goodcandidate for study by a predictive model. Depending onits severity a plaque exhibits 2-5 times increase in the totalcell density [57, 58, 69] with a relatively higher growth in theproliferative compartment compared to the nonproliferativecompartment [60, 61]. A disordered tissue usually losesthe granular layer due to abnormal differentiation andcontains a subset of nucleated corneocytes. A psoriaticplaque also has a turnover time several fold faster [55,70]. More specifically, studies found in the cell kinetics ofpsoriasis (i) significant increase of cell cycle marker Ki-67 inpsoriatic tissue without much change in cell cycle time [35,71], suggesting a substantial increase in growth fraction;(ii) transit time of keratinocytes through differentiatedcompartment is shortened to 48 hrs from 240-330 hrs, 5-7times faster than in the normal tissue [59]; (iii) transit timethrough the corneum is also shortened from 14 days to 2days [55]. These factors together result in a decrease inthe epidermis turnover time [Eq. (17)]. In addition, thecell apoptotic index decreases nearly four fold from 0.12% to0.035% [36], making a further contribution to keratinocytesoverproduction. Table III lists parameter values based on theabove observations, where coefficients ρta, ρtr and ρde arefold changes over rate constants in normal kinetics of TA-cellproliferating (γ2, k2a and k2s), transit in the nonproliferativecompartment (k3 and k4) and desquamation (α), respectively.Like variations in normal tissues, severity and phenotype ofpsoriasis vary widely across individuals and disease subtypesand therefore for any specific condition or study the modelshould be parameterized accordingly.
As the main result, the model predicts two interconvertinghomeostatic modes of the psoriatic tissue (see the Appendixfor analytical details): (1) a disease state, which generatespsoriasis phenotypes of keratinocytes overproduction anda shortened epidermal turnover time when psoriatic stemcells outcompete normal stem cells for available niches andoverwhelm the immune system; and (2) a quiescent state,which predicts a coexistence of a small number of psoriaticcells with a dominant population of normal keratinocyteswhen the immune system keeps the psoriatic stem cellpopulation low. The quiescent mode with remanent psoriatic
10
10−1
100
101
102
103
104
0
2
4
6
8
10x 10
4
time (day)
cell
den
sity
(m
m−
2)
(a)
psoriasis
UVBirradiation
recovery
SC
TA
GA
SP
GC
CC
0 5 10 15 20
102
103
104
105
time (day)
cell
den
sity
(m
m−
2)
10−1
100
101
102
103
104
105
0
1
2
3
4x 10
4
time (day)
cell
den
sity
(m
m−
2)
solid: 7−episodedashed: 6−episode
psoriatic progenitor(b)
SC
TA
10−1
100
101
102
103
104
105
0
5
10
15
time (day)
cell
den
sity
(m
m−
2)
x10
3
normal progenitor(c)
SC
TA
0
2
4
6
8
10x 10
4
cell
den
sity
(m
m−
2)
HealthyPsoriatic
Recovered
(d)
0
20
40
60
turn
over
tim
e (d
ay)
HealthyPsoriatic
Recovered
(e)τ
prolif.
τdiff.
τcorn.
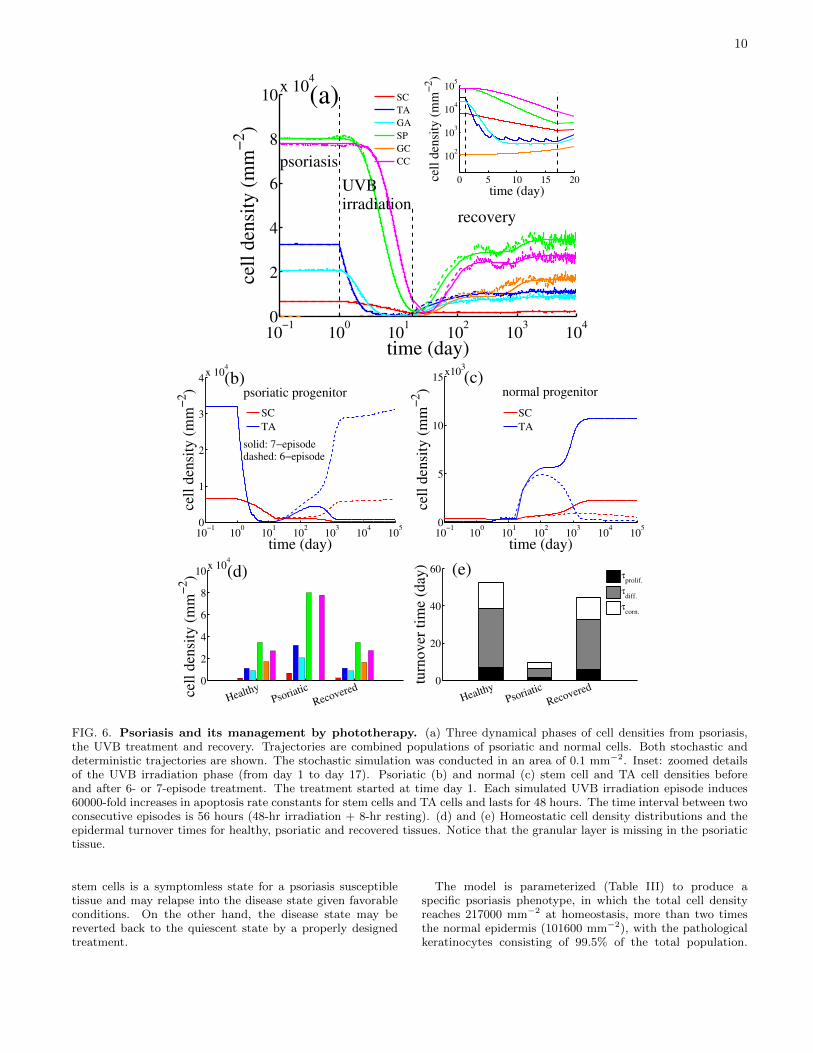
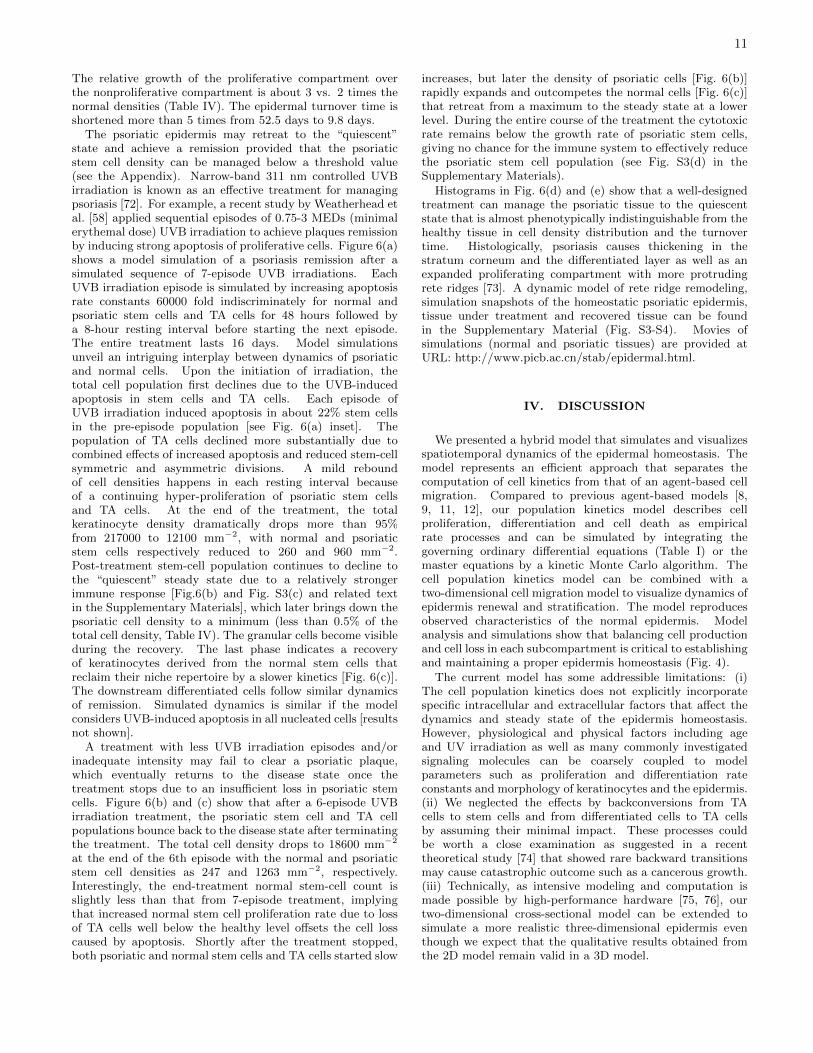
FIG. 6. Psoriasis and its management by phototherapy. (a) Three dynamical phases of cell densities from psoriasis,the UVB treatment and recovery. Trajectories are combined populations of psoriatic and normal cells. Both stochastic anddeterministic trajectories are shown. The stochastic simulation was conducted in an area of 0.1 mm−2. Inset: zoomed detailsof the UVB irradiation phase (from day 1 to day 17). Psoriatic (b) and normal (c) stem cell and TA cell densities beforeand after 6- or 7-episode treatment. The treatment started at time day 1. Each simulated UVB irradiation episode induces60000-fold increases in apoptosis rate constants for stem cells and TA cells and lasts for 48 hours. The time interval between twoconsecutive episodes is 56 hours (48-hr irradiation + 8-hr resting). (d) and (e) Homeostatic cell density distributions and theepidermal turnover times for healthy, psoriatic and recovered tissues. Notice that the granular layer is missing in the psoriatictissue.
stem cells is a symptomless state for a psoriasis susceptibletissue and may relapse into the disease state given favorableconditions. On the other hand, the disease state may bereverted back to the quiescent state by a properly designedtreatment.
The model is parameterized (Table III) to produce aspecific psoriasis phenotype, in which the total cell densityreaches 217000 mm−2 at homeostasis, more than two timesthe normal epidermis (101600 mm−2), with the pathologicalkeratinocytes consisting of 99.5% of the total population.
11
The relative growth of the proliferative compartment overthe nonproliferative compartment is about 3 vs. 2 times thenormal densities (Table IV). The epidermal turnover time isshortened more than 5 times from 52.5 days to 9.8 days.
The psoriatic epidermis may retreat to the “quiescent”state and achieve a remission provided that the psoriaticstem cell density can be managed below a threshold value(see the Appendix). Narrow-band 311 nm controlled UVBirradiation is known as an effective treatment for managingpsoriasis [72]. For example, a recent study by Weatherhead etal. [58] applied sequential episodes of 0.75-3 MEDs (minimalerythemal dose) UVB irradiation to achieve plaques remissionby inducing strong apoptosis of proliferative cells. Figure 6(a)shows a model simulation of a psoriasis remission after asimulated sequence of 7-episode UVB irradiations. EachUVB irradiation episode is simulated by increasing apoptosisrate constants 60000 fold indiscriminately for normal andpsoriatic stem cells and TA cells for 48 hours followed bya 8-hour resting interval before starting the next episode.The entire treatment lasts 16 days. Model simulationsunveil an intriguing interplay between dynamics of psoriaticand normal cells. Upon the initiation of irradiation, thetotal cell population first declines due to the UVB-inducedapoptosis in stem cells and TA cells. Each episode ofUVB irradiation induced apoptosis in about 22% stem cellsin the pre-episode population [see Fig. 6(a) inset]. Thepopulation of TA cells declined more substantially due tocombined effects of increased apoptosis and reduced stem-cellsymmetric and asymmetric divisions. A mild reboundof cell densities happens in each resting interval becauseof a continuing hyper-proliferation of psoriatic stem cellsand TA cells. At the end of the treatment, the totalkeratinocyte density dramatically drops more than 95%from 217000 to 12100 mm−2, with normal and psoriaticstem cells respectively reduced to 260 and 960 mm−2.Post-treatment stem-cell population continues to decline tothe “quiescent” steady state due to a relatively strongerimmune response [Fig.6(b) and Fig. S3(c) and related textin the Supplementary Materials], which later brings down thepsoriatic cell density to a minimum (less than 0.5% of thetotal cell density, Table IV). The granular cells become visibleduring the recovery. The last phase indicates a recoveryof keratinocytes derived from the normal stem cells thatreclaim their niche repertoire by a slower kinetics [Fig. 6(c)].The downstream differentiated cells follow similar dynamicsof remission. Simulated dynamics is similar if the modelconsiders UVB-induced apoptosis in all nucleated cells [resultsnot shown].
A treatment with less UVB irradiation episodes and/orinadequate intensity may fail to clear a psoriatic plaque,which eventually returns to the disease state once thetreatment stops due to an insufficient loss in psoriatic stemcells. Figure 6(b) and (c) show that after a 6-episode UVBirradiation treatment, the psoriatic stem cell and TA cellpopulations bounce back to the disease state after terminatingthe treatment. The total cell density drops to 18600 mm−2
at the end of the 6th episode with the normal and psoriaticstem cell densities as 247 and 1263 mm−2, respectively.Interestingly, the end-treatment normal stem-cell count isslightly less than that from 7-episode treatment, implyingthat increased normal stem cell proliferation rate due to lossof TA cells well below the healthy level offsets the cell losscaused by apoptosis. Shortly after the treatment stopped,both psoriatic and normal stem cells and TA cells started slow
increases, but later the density of psoriatic cells [Fig. 6(b)]rapidly expands and outcompetes the normal cells [Fig. 6(c)]that retreat from a maximum to the steady state at a lowerlevel. During the entire course of the treatment the cytotoxicrate remains below the growth rate of psoriatic stem cells,giving no chance for the immune system to effectively reducethe psoriatic stem cell population (see Fig. S3(d) in theSupplementary Materials).
Histograms in Fig. 6(d) and (e) show that a well-designedtreatment can manage the psoriatic tissue to the quiescentstate that is almost phenotypically indistinguishable from thehealthy tissue in cell density distribution and the turnovertime. Histologically, psoriasis causes thickening in thestratum corneum and the differentiated layer as well as anexpanded proliferating compartment with more protrudingrete ridges [73]. A dynamic model of rete ridge remodeling,simulation snapshots of the homeostatic psoriatic epidermis,tissue under treatment and recovered tissue can be foundin the Supplementary Material (Fig. S3-S4). Movies ofsimulations (normal and psoriatic tissues) are provided atURL: http://www.picb.ac.cn/stab/epidermal.html.
IV. DISCUSSION
We presented a hybrid model that simulates and visualizesspatiotemporal dynamics of the epidermal homeostasis. Themodel represents an efficient approach that separates thecomputation of cell kinetics from that of an agent-based cellmigration. Compared to previous agent-based models [8,9, 11, 12], our population kinetics model describes cellproliferation, differentiation and cell death as empiricalrate processes and can be simulated by integrating thegoverning ordinary differential equations (Table I) or themaster equations by a kinetic Monte Carlo algorithm. Thecell population kinetics model can be combined with atwo-dimensional cell migration model to visualize dynamics ofepidermis renewal and stratification. The model reproducesobserved characteristics of the normal epidermis. Modelanalysis and simulations show that balancing cell productionand cell loss in each subcompartment is critical to establishingand maintaining a proper epidermis homeostasis (Fig. 4).
The current model has some addressible limitations: (i)The cell population kinetics does not explicitly incorporatespecific intracellular and extracellular factors that affect thedynamics and steady state of the epidermis homeostasis.However, physiological and physical factors including ageand UV irradiation as well as many commonly investigatedsignaling molecules can be coarsely coupled to modelparameters such as proliferation and differentiation rateconstants and morphology of keratinocytes and the epidermis.(ii) We neglected the effects by backconversions from TAcells to stem cells and from differentiated cells to TA cellsby assuming their minimal impact. These processes couldbe worth a close examination as suggested in a recenttheoretical study [74] that showed rare backward transitionsmay cause catastrophic outcome such as a cancerous growth.(iii) Technically, as intensive modeling and computation ismade possible by high-performance hardware [75, 76], ourtwo-dimensional cross-sectional model can be extended tosimulate a more realistic three-dimensional epidermis eventhough we expect that the qualitative results obtained fromthe 2D model remain valid in a 3D model.
12
As an important application, a non-trivial extension tothe above model allows us to investigate the pathogenesisof psoriasis, an immune-mediated skin disorder. Geneticorigins of psoriasis have been recently explored by anincreasing number of genome-wide association studies thatidentified a multitude of psoriasis susceptibility loci [77–80].Many psoriasis-associated loci are connected to genes in theimmune system (e.g., MHC class I molecules) and proteinsexpressed in keratinocytes, suggesting a complex nature ofthe disease [81]. However, the mechanistic epidermis-immunesystem interactions implicated by these loci are yet to beresolved.
In this study, we propose an alternative hypothesis ofinteractions between the immune system and keratinocytes,in which the disordered epidermis maintains a parallelhomeostasis of both normal and psoriatic keratinocytes,derived from respective stem cell populations. We examinethis hypothesis in an extended model and demonstrate thattreatment by UVB irradiation with consecutive episodes canpotentially manage the disease and achieve a remission of thepsoriatic phenotype.
Psoriasis has recently been studied by agent-basedmodels [48, 58]. The model by Grabe and Neuber [48]was able to generate the psoriasis phenotype of an increasedcell density and a shortened epidermal turnover time, byadjusting the fractional time of TA cell proliferation. Thisparameter characterizes the amount of time for proliferationduring a constant life time of a TA cell, which in our modelis embedded in the TA cell self-proliferation rate constant γ2.Increasing γ2 and keeping symmetric division rate constantk2s unchanged (equivalent to keeping a constant TA cell lifetime) does increase TA cell population (Eq. 6). To obtaina relative growth of the proliferating compartment, rateconstants for cell differentiation must have relatively higherincreases than γ2, which was achieved by modulating Ca2+
gradient in the Grabe and Neuber model. The model howeverdid not propose possible management that can target thehypothesized mechanism. For example, it is not obvious howapoptosis induced by episodes of UVB irradiation can attaina remission via recovering the normal TA cell proliferatingtime. Weatherhead et al. [58] developed a model to simulateUVB-induced apoptosis in stem cells and TA cells, which wasable to demonstrate a psoriasis remission after a few episodesof UVB irradiation. The model assumed a constant pool ofstem cells that derived TA cells by asymmetric division andthe UVB-induced apoptotic hyperproliferative stem cells werereplaced with normal stem cells by symmetric divisions. Thismodel assumption consequently led to a permanent reductionin cell density after each UVB irradiation treatment andtherefore did not explain relapses of psoriatic phenotypes oncean ineffective treatment ends or recurrence of the disorder.
Interactions between the immune system and keratinocytesconsidered in our model can serve as a conceptual basis forinterpreting the pathogenesis of psoriasis. Especially, weshowed that the act of the immune system cytotoxicity againstpsoriatic keratinocytes plays a pivotal role in the onset,remission and recurrence of the disease phenotype. The mostcommon paradigm considers that faulty immune responsestriggered by unknown self antigens or pathogens (introducedby injuries or trauma, known as Koebner phenomenon)produce cytokines and growth factors that promotekeratinocyte hyperproliferation, immature differentiation andskin inflammation, establishing the psoriasis phenotype.Drugs that inhibit T cell activity and cytokine productions
do improve psoriatic conditions [82]. In contrast, ourmodel demonstrates that a psoriasis lesion develops whenthe immune system is genuinely weakened or locallyoverwhelmed by a large population of psoriatic keratinocytes,staging up a chronic condition. This prediction mayexplain high occurrence and increasing severity of psoriasisin HIV-infected, especially late-stage AIDS patients withsubstantially compromised immune systems when CD4+ andnaive CD8+ T cell counts substantially decrease [83, 84].Furthermore, the onset age of psoriasis has been known tohave two separate populations, type I (early onset in patientsyounger than 40 with a peak at age 20) and type II (lateonset after age 40 with a peak at about 60) [85]. Ourmodel speculates that a vigorous immune system at a youngerage can stimulate a strong hyperproliferation (a large ρsc)in a psoriatic epidermis and causes manifestation of plaquephenotypes. One the other hand, a weak immune system (asmall kp) at an older age can also have an equivalent effect.
The model prediction provides an alternative (a lessexplained) perspective of the pathogenesis of psoriasis,suggesting that psoriasis is a parallel epidermal homeostasisdue to heterogeneity in stem cell clones, and that the immunesystem as a double-edged sword plays two essential howeveropposing roles: (i) Cytotoxic (CD8+) T cells recruited tothe epidermis induce apoptosis in psoriatic stem cells, whichis implicated by studies that demonstrated CD8+ T cell(especially, CD45RO+ memory subtype) count and cytotoxicproteins including perforin and granyme B substantiallyincrease in psoriatic lesions [83]; and (ii) Immune activities inthe meantime promote progenitor keratinocytes proliferationby producing a multitude of cytokines and growth factors(TNF, IFN-α, IFN-γ, IL-17, IL-22, IL-23, etc.). Balancebetween the two acts determines the outcome of the disease.Our model predicts that the psoriasis-susceptible tissue is abimodal system and can switch between a non-symptom stateand a phenotypical state, potentially explaining the recurringnature of the disorder and suggesting the feasibility of diseasemanagement by an effective treatment. This perspective andthe model could be in general applicable to other autoimmunediseases in regenerative tissues.
We showed in UVB phototherapy simulation that psoriasisplaque clearance can be attained by inducing strong apoptosisin keratinocytes. The model only considered UVB-inducedapoptosis in keratinocytes. UVB irradiation may promoteproliferation and differentiation in skin cells [86, 87] or mayalter immune responses. These effects could be incorporatedand be examined in the model. For example, as suggestedin Eq. (20), rebalance in self-proliferation γ1,h and symmetricdivision k1s,h and change in immune activities f(psc) mayaffect the population of psoriatic stem cells and thus thetherapeutic outcome. Experiments did not demonstratewhether the UVB irradiation causes non-apoptotic cell deaththat was not reflected by an apoptosis marker [58]. Regardlessthe actual mechanism, induced cell deaths will result in a shiftof the stem cell density from the disease state to the quiescentstate across the phase boundary, an important parameter thatdetermines the design of a phototherapy regimen, includingirradiation dosage in each treatment episode, the number ofepisodes and the time interval between consecutive episodes.
The model also suggests the limitation of UVBirradiation or similar treatments that attempt to achieveplaque remission by killing keratinocytes below a criticalthreshold. First, psoriasis plaques may recur under atemporally-weakened immune system or a transient burst of
13
cell proliferation caused by conditions such as wound healing.Second, the psoriatic severity may be worsened under agenuinely weak immune system (with a low Kp and/or ahigh threshold Ka), in which the disease phenotype persistsand cannot be adequately reverted by simple reduction inpsoriatic stem cells because the system does not possess aquiescent state [region I in Fig. 7(b)]. In the latter case,other treatment options such as cytokine-targeting biologicand small-molecule drugs should be considered to at leastshift the disorder to the bimodal region where phototherapybecomes effective. However, we note that phototherapy maybe effective through alternatively mechanisms other thaninduction of apoptosis [88, 89], by which it alone may switch aplaque from persistent disorder (region I) to bimodal (regionII) or symptomless (region III) as in Fig. 7(b).
Further insight from the model is that the bimodal psoriasisexhibits hysteresis, by which a mode of the epidermis,psoriatic or quiescent, once reached under a favorablecondition, will tend to be relatively stable. For example,a symptomless epidermis as illustrated in Fig. 7(b) mayswitch to the disease state when Kp is reduced beyond itslower threshold because of weakening in the immune system.However, restrengthening the immune system to revert thedisease state back to the quiescent mode requires elevating Kp
in the model beyond the upper threshold, implying that thedisease is resistant to mild natural or induced perturbations.
One definitive experimental test of our model hypothesisshould aim at simultaneously tracing clones of psoriatic andnormal stem cell lineages. Because of recent advancement intechniques, studies of epidermal stem cells become central tothe understanding of the epidermal homeostasis. Especially,the emerging powerful in vivo lineage tracing technologyallows dynamic monitoring of stem cells and progenitorsclone formation and differentiation and can achieve multicolorsimultaneous tracing of separate clones [27]. The techniquehas already been pioneered to study progenitor fates in normalskin tissue [17] and benign epidermal tumors [90] and can bepotentially applicable to identify the coexistence of normaland psoriatic progenitors in psoriasis. One potential challengeis that in either quiescent or disease state one type of stemcells is in a small population (about a 1:20 ratio, accordingto Table IV), making it difficult for differential labeling.Alternatively, an experiment may tend to identify and isolatethe two competing effects by the immune system on theepidermis: (1) apoptosis in epidermal progenitors by T-cellcytotoxic activities and (2) hyperproliferation due to elevatedcytokines and growth factors.
Appendix A: Analytical details of the psoriasismodel
Psoriasis as a bimodal switch — To illustrate the principleand simplify the analysis, we only present a two-dimensionalmodel that describes dynamic interactions between normaland psoriatic stem cells. The complete model that producedthe results (Fig.6) is more complex and of a higher dimensionbecause of the feedback regulation by TA cell populationon the normal stem cell proliferation (Eq. 22), requiringanalyzing the dynamics of normal and psoriatic TA cellstogether. Again, for convenience in analysis, we neglectthe influences of backconversions and apoptosis. Thissimplification allows us to show insights of the model
behaviors without much mathematical complication. Wework with normalized quantities:
x = psc/Ka, y = psc/Ka, ymax = pmaxsc /Ka, kp = Kp/Ka .
Ratios between the normal stem-cell proliferation rateconstants remain constant despite their dynamic modulationsby the TA cell population (Eq. 1), i.e., k1s/γ1 = k1s,h/γ1,h.Ignoring the trivial steady states of zero density (x = 0,and/or y = 0), based on Eqs. (19-21) we have the steady-stateequations for stem cell densities as
w(
1− x
u
)− x
1 + x2= 0 , (A1)
y =u− xλ
, (A2)
where
w =ρsckp
(1− 1/λ)(γ1,h − k1s,h) ,
u = λymax(1− k1s,h/γ1,h) .
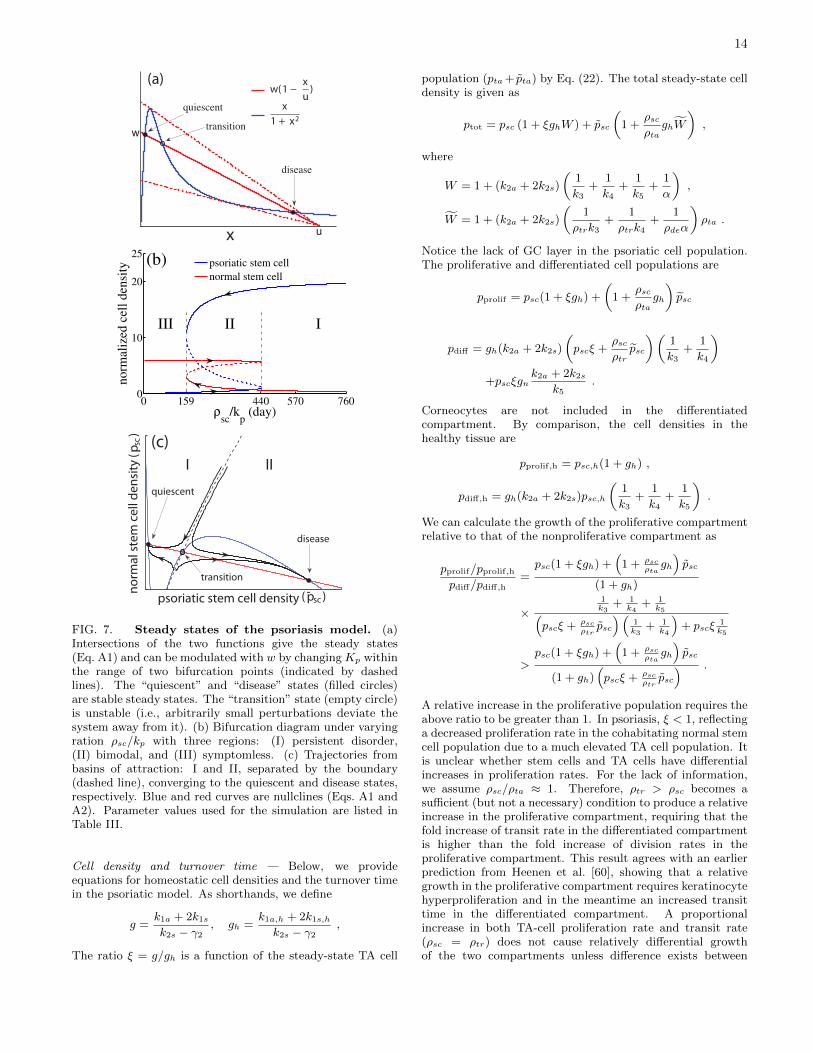
Eq. (A1) can solve for one or three steady-state psoriatic stemcell densities, only depending on choices of two parameters,w and u, which is illustrated in Fig. 7(a).
To study plaque remission and relapse, we are interested inthe region where the system has two stable steady states,“quiescent” and “disease”, and one unstable “transition”steady state. This scenario is illustrated in Fig. 7(a) withthree intersections between the line w(1 − x/u) and thenonparametric curve x/(1 + x2). Determination of thestability of these fixed points requires analysis similar to thespruce budworm model by Ludwig et al. [68]. Figure 7(a)shows that the “quiescent” state is more sensitive to w,whereas the “disease” state is determined by both u andw. This observation provides a guideline to parameterizethe model to attain appropriate psoriatic phenotypes byidentifying disease-related parameters ρsc, λ and kp. Theratio ρsc/kp emerges as the key parameter that characterizesthe interplay between proliferation of keratinocytes andactivity of the immune system (magnitude Kp and thresholdKa), playing a critical role in the interpretation of thepathogenesis of psoriasis.
Bifurcation diagrams in Fig. 7(b) of steady-state stemcell densities shows three classes of behaviors as ρsc/kpvaries. A small population of psoriatic stem cells survivein the “quiescent” state (ρsc/kp <159 day) under a vigorouscytotoxic activity (a large kp, i.e., a low threshold Ka and/or ahigh magnitudeKp) and/or a moderate stem-cell proliferation(a small ρsc). In contrast, a weak immune system (a small kp,i.e., a high threshold Ka and/or a low magnitude Kp) cannotadequately counterbalance the psoriatic hyperproliferation(a large ρsc) and thus the epidermis assumes a persistent“disease” state (ρsc/kp >440 day). A bimodal system withan intermediate ρsc/kp has a potential to switch betweenthe quiescent and disease modes when conditions change.Figure 7(c) shows a two-dimensional phase plane of normaland psoriatic stem-cell densities. Starting from initial stemcell densities, located inside region I or II, a temporaltrajectory will be attracted to the quiescent or the diseasestate, respectively. Those starting on the boundary of the tworegions will in theory converge to the transition state, whichis unsustainable because slight perturbations will dislocate atrajectory into either region I or II.
14
u
w
w(1 −x
u)
x
1 + x2
disease
transition
quiescent
(a)
x
0 159 440 570 7600
10
20
25
III II I
ρsc
/kp (day)
no
rmal
ized
cel
l d
ensi
ty
(b) psoriatic stem cell
normal stem cell
psoriatic stem cell density ( psc )
no
rma
l ste
m c
ell
de
nsi
ty (psc)
(c)
disease
transition
quiescent
I II
FIG. 7. Steady states of the psoriasis model. (a)Intersections of the two functions give the steady states(Eq. A1) and can be modulated with w by changing Kp withinthe range of two bifurcation points (indicated by dashedlines). The “quiescent” and “disease” states (filled circles)are stable steady states. The “transition” state (empty circle)is unstable (i.e., arbitrarily small perturbations deviate thesystem away from it). (b) Bifurcation diagram under varyingration ρsc/kp with three regions: (I) persistent disorder,(II) bimodal, and (III) symptomless. (c) Trajectories frombasins of attraction: I and II, separated by the boundary(dashed line), converging to the quiescent and disease states,respectively. Blue and red curves are nullclines (Eqs. A1 andA2). Parameter values used for the simulation are listed inTable III.
Cell density and turnover time — Below, we provideequations for homeostatic cell densities and the turnover timein the psoriatic model. As shorthands, we define
g =k1a + 2k1s
k2s − γ2, gh =
k1a,h + 2k1s,h
k2s − γ2,
The ratio ξ = g/gh is a function of the steady-state TA cell
population (pta+ pta) by Eq. (22). The total steady-state celldensity is given as
ptot = psc (1 + ξghW ) + psc
(1 +
ρscρta
ghW
),
where
W = 1 + (k2a + 2k2s)
(1
k3+
1
k4+
1
k5+
1
α
),
W = 1 + (k2a + 2k2s)
(1
ρtrk3+
1
ρtrk4+
1
ρdeα
)ρta .
Notice the lack of GC layer in the psoriatic cell population.The proliferative and differentiated cell populations are
pprolif = psc(1 + ξgh) +
(1 +
ρscρta
gh
)psc
pdiff = gh(k2a + 2k2s)
(pscξ +
ρscρtr
psc
)(1
k3+
1
k4
)+pscξgn
k2a + 2k2s
k5.
Corneocytes are not included in the differentiatedcompartment. By comparison, the cell densities in thehealthy tissue are
pprolif,h = psc,h(1 + gh) ,
pdiff,h = gh(k2a + 2k2s)psc,h
(1
k3+
1
k4+
1
k5
).
We can calculate the growth of the proliferative compartmentrelative to that of the nonproliferative compartment as
pprolif/pprolif,h
pdiff/pdiff,h=psc(1 + ξgh) +
(1 + ρsc
ρtagh)psc
(1 + gh)
×1k3
+ 1k4
+ 1k5(
pscξ + ρscρtrpsc)(
1k3
+ 1k4
)+ pscξ
1k5
>psc(1 + ξgh) +
(1 + ρsc
ρtagh)psc
(1 + gh)(pscξ + ρsc
ρtrpsc) .
A relative increase in the proliferative population requires theabove ratio to be greater than 1. In psoriasis, ξ < 1, reflectinga decreased proliferation rate in the cohabitating normal stemcell population due to a much elevated TA cell population. Itis unclear whether stem cells and TA cells have differentialincreases in proliferation rates. For the lack of information,we assume ρsc/ρta ≈ 1. Therefore, ρtr > ρsc becomes asufficient (but not a necessary) condition to produce a relativeincrease in the proliferative compartment, requiring that thefold increase of transit rate in the differentiated compartmentis higher than the fold increase of division rates in theproliferative compartment. This result agrees with an earlierprediction from Heenen et al. [60], showing that a relativegrowth in the proliferative compartment requires keratinocytehyperproliferation and in the meantime an increased transittime in the differentiated compartment. A proportionalincrease in both TA-cell proliferation rate and transit rate(ρsc = ρtr) does not cause relatively differential growthof the two compartments unless difference exists between
15
increases of proliferating rates of stem cells and TA cells,ρsc 6= ρta. Fast migration of differentiated keratinocytesalso offsets overgrowth in the proliferative compartment.An important insight from the model is that increasingkeratinocyte population in psoriasis is not merely causedby elevated proliferation rates but also requires the increasein growth capacity in the progenitor repertoire. Observedmorphological remodeling of the psoriatic epidermis suggestsincreased growth niches for stem cells [73].
Similarly to Eq. (17), the epidermal turnover time can beapproximated as the ratio of the total cell density to the rateof desquamation:
τtot ≈ptot
α(pcc + ρdepcc)
=
(psc + psc
pscξ + ρscpsc
1
gh+pscξ + ρsc
ρtapsc
pscξ + ρscpsc
)1
k2a + 2k2s
+pscξ + ρsc
ρtrpsc
pscξ + ρscpsc
(1
k3+
1
k4
)+
pscξ
pscξ + pscρsc
1
k5+pscξ + ρsc
ρdepsc
pscξ + ρscpsc
1
α,
which can be analyzed for the two psoriasis modes (quiescentor disease). At the quiescent mode, ξ ≈ 1 and psc psc, the
turnover time is approximated by
τtot ≈(
k2s − γ2
k1a + 2k1s+ 1
)1
k2a + 2k2s+
1
k3+
1
k4+
1
k5+
1
α,
converging back to τtot. At the disease mode, ξ < 1 andpsc psc. The turnover time is close to:
τtot ≈(
1
ρscgh+
1
ρta
)1
k2a + 2k2s+
1
ρtr
(1
k3+
1
k4
)+
1
ρde
1
α.
Both cases do not account for the relatively much smallercell loss by the cytotoxic effect from the immune system.Compared to the turnover time of the healthy tissue τtot
(Eq. 17), τtot of the psoriatic tissue is clearly shortenedat each stage from the proliferative compartment (the firstterm) to differentiated compartment (the second term) andto the corneum (the third term). The turnover time of thegranular layer is ignorable because of the minimal normal cellpopulation.
ACKNOWLEDGMENTS
This work was supported by LVMH Recherche throughSprim Inc. and institutional fund to JY. We thank WeirenCui, Eric Perrier, Michael Shleifer, Gallic Beauchef andDelphine de Queral for helpful discussions.
[1] W Montagna, AM Kligman, and KS Carlisle. 1992. Atlasof normal human skin. Springer-Verlag.
[2] T Burns, S Breathnach, N Cox, and C Griffiths, editors.2010. Rook’s textbook of dermatology. Wiley-Blackwell,8th edition.
[3] GD Weinstein, JL McCullough, and P Ross. 1984. Cellproliferation in normal epidermis. J. Invest. Dermatol.,82:623–628.
[4] M Loeffler, CS Potten, and HE Wichmann. 1987.Epidermal cell proliferation. II. A comprehensivemathematical model of cell proliferation and migrationin the basal layer predicts some unusual properties ofepidermal stem cells. Virchows Arch. B Cell Pathol. Incl.Mol. Pathol., 53:286–300.
[5] LM Milstone. 2004. Epidermal desquamation. J.Dermatol. Sci., 36:131–140.
[6] NJ Savill. 2003. Mathematical models of hierarchicallystructured cell populations under equilibrium withapplication to the epidermis. Cell Prolif., 36:1–26.
[7] A Gandolfi, M Iannelli, and G Marinoschi. 2011. Anage-structured model of epidermis growth. J. Math.Biol., 62:111–141.
[8] D Stekel, J Rashbass, and ED Williams. 1995. Acomputer graphic simulation of squamous epithelium. J.Theor. Biol., 175:283–293.
[9] N Grabe and K Neuber. 2005. A multicellular systemsbiology model predicts epidermal morphology, kineticsand Ca2+ flow. Bioinformatics, 21:3541–3547.
[10] T Sutterlin, S Huber, H Dickhaus, and N Grabe. 2009.Modeling multi-cellular behavior in epidermal tissuehomeostasis via finite state machines in multi-agentsystems. Bioinformatics, 25:2057–2063.
[11] T Sun, P McMinn, S Coakley, M Holcombe,R Smallwood, and S MacNeil. 2007. An integratedsystems biology approach to understanding the rulesof keratinocyte colony formation. J. R. Soc. Interface,4:1077–1092.
[12] S Adra, T Sun, S MacNeil, M Holcombe, andR Smallwood. 2010. Development of a three dimensionalmultiscale computational model of the human epidermis.PloS One, 5:e8511.
[13] R Parisi, DPM Symmons, CEM Griffiths, andDM Ashcroft. 2013. Global epidemiology of psoriasis: Asystematic review of incidence and prevalence. J. Invest.Dermatol., 133:377–385.
[14] P Di Meglio, F Villanova, and FO Nestle. 2014. Psoriasis.Cold Spring Harb. Perspect. Med., 4:a015354.
[15] G Denecker, P Ovaere, P Vandenabeele, and W Declercq.2008. Caspase-14 reveals its secrets. J. Cell Biol.,180:451–458.
[16] L De Rosa and M De Luca. 2012. Cell biology: Dormantand restless skin stem cells. Nature, 489:215–217.
[17] E Clayton, DP Doupe, AM Klein, DJ Winton,BD Simons, and PH Jones. 2007. A single type ofprogenitor cell maintains normal epidermis. Nature,446:185–189.
[18] DP Doupe, AM Klein, BD Simons, and PH Jones.2010. The ordered architecture of murine ear epidermisis maintained by progenitor cells with random fate.Develop. Cell, 18:317–323.
[19] G Mascre, S Dekoninck, B Drogat, KK Youssef,S Brohee, PA Sotiropoulou, BD Simons, and C Blanpain.2012. Distinct contribution of stem and progenitor cellsto epidermal maintenance. Nature, 489:257–262.
16
[20] FM Watt and BLM Hogan. 2000. Out of eden: stemcells and their niches. Science, 287:1427–1430.
[21] BD Simons and H Clevers. 2011. Strategies forhomeostatic stem cell self-renewal in adult tissues. Cell,145:851–862.
[22] BD Simons and H Clevers. 2011. Stem cell self-renewalin intestinal crypt. Exp. Cell Res., pages 2719–2724.
[23] T Tumbar, G Guasch, V Greco, C Blanpain, WE Lowry,M Rendl, and E Fuchs. 2004. Defining the epithelial stemcell niche in skin. Science, 303:359–363.
[24] PB Warren. 2009. Cells, cancer, and rareevents: Homeostatic metastability in stochastic nonlineardynamical models of skin cell proliferation. Phys. Rev.E, 80:030903.
[25] AM Klein, DP Doupe, PH Jones, and BD Simons. 2007.Kinetics of cell division in epidermal maintenance. Phys.Rev. E, 76:021910.
[26] A Roshan and PH Jones. 2012. Act your age: Tuningcell behavior to tissue requirements in interfollicularepidermis. Seminars Cell Develop. Biol., 23:884 – 889.
[27] MP Alcolea and PH Jones. 2013. Tracking cells in theirnative habitat: lineage tracing in epithelial neoplasia.Nature Rev. Cancer, 13:161–171.
[28] R Okuyama, K LeFort, and GP Dotto. 2004. Adynamic model of keratinocyte stem cell renewal anddifferentiation: role of the p21WAF1/Cip1 and Notch1signaling pathways. J. Investig. Dermatol. Symp. Proc.,9:248–252.
[29] C Blanpain and E Fuchs. 2009. Epidermal homeostasis:a balancing act of stem cells in the skin. Nat. Rev. Mol.Cell Biol., 10:207–217.
[30] YC Hsu, L Li, and E Fuchs. 2014. Transit-amplifyingcells orchestrate stem cell activity and tissueregeneration. Cell, 157:935–949.
[31] M Heenen, S Thiriar, J-C Noel, and P Galand. 1998.Ki-67 immunostaining of normal human epidermis:comparison with 3H-thymidine labelling and PCNAimmunostaining. Dermatology, 197:123–126.
[32] M Heenen and P Galand. 1997. The growth fraction ofnormal human epidermis. Dermatology, 194:313–317.
[33] R Morris and TS Argyris. 1983. Epidermalcell cycle and transit times during hyperplasticgrowth induced by abrasion or treatment with12-O-tetradecanoylphorbol-13-acetate. Cancer Res.,43:4935–4942.
[34] FACM Castelijns, J Ezendam, MAHE Latijnhouwers,IMJJ Van Vlijmen-Willems, PLJM. Zeeuwen, MJPGerritsen, PCM Van De Kerkhof, and PEJ Van Erp.1998. Epidermal cell kinetics by combining in situhybridization and immunohistochemistry. Histochem. J.,30:869–877.
[35] FA Castelijns, MJ Gerritsen, PE van Erp, and PC van deKerkhof. 2000. Cell-kinetic evidence for increasedrecruitment of cycling epidermal cells in psoriasis: theratio of histone and Ki-67 antigen expression is constant.Dermatology, 201:105–110.
[36] M Laporte, P Galand, D Fokan, C de Graef, andM Heenen. 2000. Apoptosis in established and healingpsoriasis. Dermatology, 200:314–316.
[37] CE Gagna, NJ Chan, PN Farnsworth, HR Kuo,TR Kanthala, AH Patel, NH Patel, A Law, PP Patel,SA Richards, et al. 2009. Localization and quantificationof intact, undamaged right-handed double-strandedB-DNA, and denatured single-stranded DNA in normal
human epidermis and its effects on apoptosis andterminal differentiation (denucleation). Arch. Dermatol.Res., 301:659–672.
[38] EM Purcell. 1977. Life at low reynolds number. Am. J.Phys., 45:3–11.
[39] E Palsson. 2008. A 3-D model used to explore how celladhesion and stiffness affect cell sorting and movementin multicellular systems. J. Theo. Biol., 254:1–13.
[40] X Li, AK Upadhyay, AJ Bullock, T Dicolandrea,J Xu, RL Binder, MK Robinson, DR Finlay, KJ Mills,CC Bascom, et al. 2013. Skin stem cell hypothesesand long term clone survival-explored using agent-basedmodelling. Sci. Reports, 3:1904.
[41] G Schaller and M Meyer-Hermann. 2007. A modellingapproach towards epidermal homoeostasis control. J.Theor. Biol., 247:554–573.
[42] P Corcuff, C Bertrand, and JL Leveque. 1993.Morphometry of human epidermis in vivo by real-timeconfocal microscopy. Arch. Dermatol. Res., 285:475–481.
[43] G Plewig and RR Marples. 1970. Regional differencesof cell sizes in the human stratum corneum. part i. J.Invest. Dermatol., 54:13–18.
[44] G Plewig. 1970. Regional differences of cell sizes in thehuman stratum corneum. ii. effects of sex and age. J.Invest. Dermatol., 54:19–23.
[45] N Kashibuchi, Y Hirai, K O’Goshi, and H Tagami. 2002.Three-dimensional analyses of individual corneocyteswith atomic force microscope: morphological changesrelated to age, location and to the pathologic skinconditions. Skin Res. Technol., 8:203–211.
[46] R Marks, S Nicholls, and CS King. 1981. Studies onisolated corneocytes. Int. J. Cosmet. Sci., 3:251–259.
[47] A Giangreco, SJ Goldie, V Failla, G Saintigny, andFM Watt. 2009. Human skin aging is associated withreduced expression of the stem cell markers β1 integrinand MCSP. J. Invest. Dermatol., 130:604–608.
[48] N Grabe and K Neuber. 2007. Simulating psoriasisby altering transit amplifying cells. Bioinformatics,23:1309–1312.
[49] GM Morris and JW Hopewell. 1990. Epidermal cellkinetics of the pig: a review. Cell Prolif., 23:271–282.
[50] J Bauer, FA Bahmer, J. Worl, W Neuhuber, G Schuler,and M Fartasch. 2001. A strikingly constant ratio existsbetween Langerhans cells and other epidermal cells inhuman skin. A stereologic study using the optical disectormethod and the confocal laser scanning microscope. J.Invest. Dermatol., 116:313–318.
[51] SB Hoath and DG Leahy. 2003. The organization ofhuman epidermis: functional epidermal units and phiproportionality. J. Invest. Dermatol., 121:1440–1446.
[52] PR Bergstresser, RJ Pariser, and JR Taylor. 1978.Counting and sizing of epidermal cells in normal humanskin. J. Invest. Dermatol., 70:280–284.
[53] PR Bergstresser and JR Taylor. 1977. Epidermal‘turnover time’ –a new examination. Br. J. Dermatol.,96:503–506.
[54] H Iizuka. 1994. Epidermal turnover time. J. Dermatol.Sci., 8:215–217.
[55] GD Weinstein and EJ van Scott. 1965. Autoradiographicanalysis of turnover times of normal and psoriaticepidermis1. J. Invest. Dermatol., 45:257–262.
[56] GL Grove and AM Kligman. 1983. Age-associatedchanges in human epidermal cell renewal. J. Gerontol.,38:137–142.
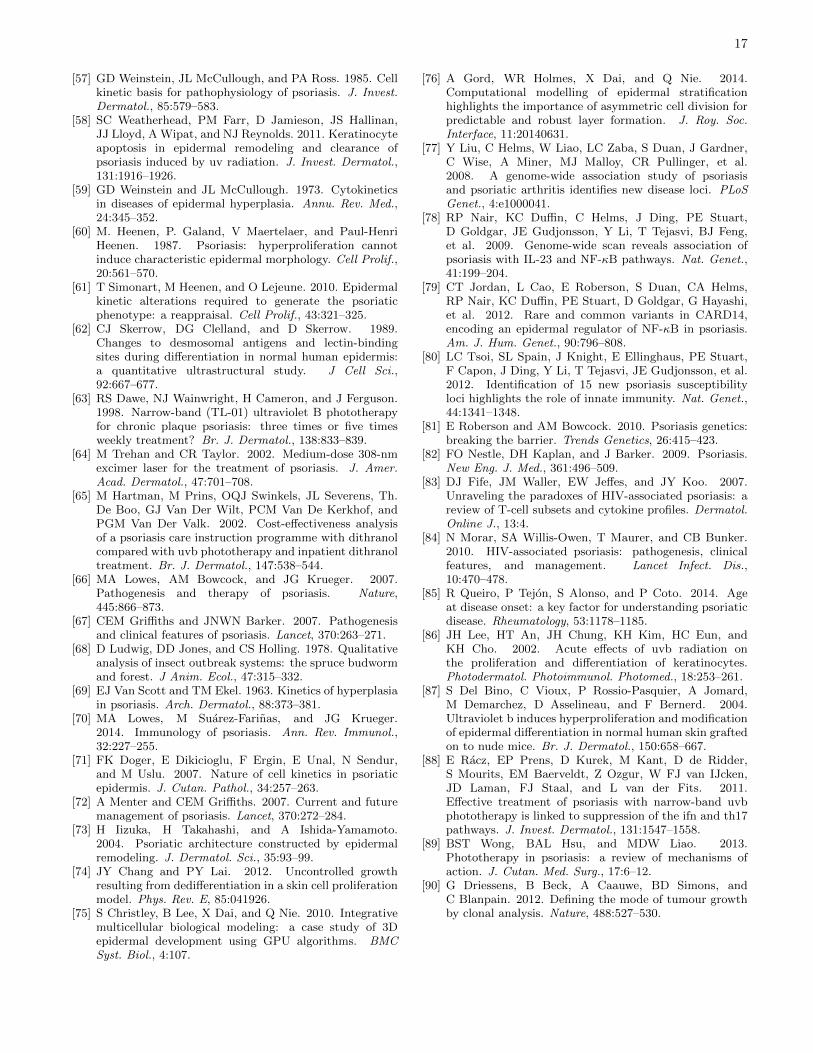
17
[57] GD Weinstein, JL McCullough, and PA Ross. 1985. Cellkinetic basis for pathophysiology of psoriasis. J. Invest.Dermatol., 85:579–583.
[58] SC Weatherhead, PM Farr, D Jamieson, JS Hallinan,JJ Lloyd, A Wipat, and NJ Reynolds. 2011. Keratinocyteapoptosis in epidermal remodeling and clearance ofpsoriasis induced by uv radiation. J. Invest. Dermatol.,131:1916–1926.
[59] GD Weinstein and JL McCullough. 1973. Cytokineticsin diseases of epidermal hyperplasia. Annu. Rev. Med.,24:345–352.
[60] M. Heenen, P. Galand, V Maertelaer, and Paul-HenriHeenen. 1987. Psoriasis: hyperproliferation cannotinduce characteristic epidermal morphology. Cell Prolif.,20:561–570.
[61] T Simonart, M Heenen, and O Lejeune. 2010. Epidermalkinetic alterations required to generate the psoriaticphenotype: a reappraisal. Cell Prolif., 43:321–325.
[62] CJ Skerrow, DG Clelland, and D Skerrow. 1989.Changes to desmosomal antigens and lectin-bindingsites during differentiation in normal human epidermis:a quantitative ultrastructural study. J Cell Sci.,92:667–677.
[63] RS Dawe, NJ Wainwright, H Cameron, and J Ferguson.1998. Narrow-band (TL-01) ultraviolet B phototherapyfor chronic plaque psoriasis: three times or five timesweekly treatment? Br. J. Dermatol., 138:833–839.
[64] M Trehan and CR Taylor. 2002. Medium-dose 308-nmexcimer laser for the treatment of psoriasis. J. Amer.Acad. Dermatol., 47:701–708.
[65] M Hartman, M Prins, OQJ Swinkels, JL Severens, Th.De Boo, GJ Van Der Wilt, PCM Van De Kerkhof, andPGM Van Der Valk. 2002. Cost-effectiveness analysisof a psoriasis care instruction programme with dithranolcompared with uvb phototherapy and inpatient dithranoltreatment. Br. J. Dermatol., 147:538–544.
[66] MA Lowes, AM Bowcock, and JG Krueger. 2007.Pathogenesis and therapy of psoriasis. Nature,445:866–873.
[67] CEM Griffiths and JNWN Barker. 2007. Pathogenesisand clinical features of psoriasis. Lancet, 370:263–271.
[68] D Ludwig, DD Jones, and CS Holling. 1978. Qualitativeanalysis of insect outbreak systems: the spruce budwormand forest. J Anim. Ecol., 47:315–332.
[69] EJ Van Scott and TM Ekel. 1963. Kinetics of hyperplasiain psoriasis. Arch. Dermatol., 88:373–381.
[70] MA Lowes, M Suarez-Farinas, and JG Krueger.2014. Immunology of psoriasis. Ann. Rev. Immunol.,32:227–255.
[71] FK Doger, E Dikicioglu, F Ergin, E Unal, N Sendur,and M Uslu. 2007. Nature of cell kinetics in psoriaticepidermis. J. Cutan. Pathol., 34:257–263.
[72] A Menter and CEM Griffiths. 2007. Current and futuremanagement of psoriasis. Lancet, 370:272–284.
[73] H Iizuka, H Takahashi, and A Ishida-Yamamoto.2004. Psoriatic architecture constructed by epidermalremodeling. J. Dermatol. Sci., 35:93–99.
[74] JY Chang and PY Lai. 2012. Uncontrolled growthresulting from dedifferentiation in a skin cell proliferationmodel. Phys. Rev. E, 85:041926.
[75] S Christley, B Lee, X Dai, and Q Nie. 2010. Integrativemulticellular biological modeling: a case study of 3Depidermal development using GPU algorithms. BMCSyst. Biol., 4:107.
[76] A Gord, WR Holmes, X Dai, and Q Nie. 2014.Computational modelling of epidermal stratificationhighlights the importance of asymmetric cell division forpredictable and robust layer formation. J. Roy. Soc.Interface, 11:20140631.
[77] Y Liu, C Helms, W Liao, LC Zaba, S Duan, J Gardner,C Wise, A Miner, MJ Malloy, CR Pullinger, et al.2008. A genome-wide association study of psoriasisand psoriatic arthritis identifies new disease loci. PLoSGenet., 4:e1000041.
[78] RP Nair, KC Duffin, C Helms, J Ding, PE Stuart,D Goldgar, JE Gudjonsson, Y Li, T Tejasvi, BJ Feng,et al. 2009. Genome-wide scan reveals association ofpsoriasis with IL-23 and NF-κB pathways. Nat. Genet.,41:199–204.
[79] CT Jordan, L Cao, E Roberson, S Duan, CA Helms,RP Nair, KC Duffin, PE Stuart, D Goldgar, G Hayashi,et al. 2012. Rare and common variants in CARD14,encoding an epidermal regulator of NF-κB in psoriasis.Am. J. Hum. Genet., 90:796–808.
[80] LC Tsoi, SL Spain, J Knight, E Ellinghaus, PE Stuart,F Capon, J Ding, Y Li, T Tejasvi, JE Gudjonsson, et al.2012. Identification of 15 new psoriasis susceptibilityloci highlights the role of innate immunity. Nat. Genet.,44:1341–1348.
[81] E Roberson and AM Bowcock. 2010. Psoriasis genetics:breaking the barrier. Trends Genetics, 26:415–423.
[82] FO Nestle, DH Kaplan, and J Barker. 2009. Psoriasis.New Eng. J. Med., 361:496–509.
[83] DJ Fife, JM Waller, EW Jeffes, and JY Koo. 2007.Unraveling the paradoxes of HIV-associated psoriasis: areview of T-cell subsets and cytokine profiles. Dermatol.Online J., 13:4.
[84] N Morar, SA Willis-Owen, T Maurer, and CB Bunker.2010. HIV-associated psoriasis: pathogenesis, clinicalfeatures, and management. Lancet Infect. Dis.,10:470–478.
[85] R Queiro, P Tejon, S Alonso, and P Coto. 2014. Ageat disease onset: a key factor for understanding psoriaticdisease. Rheumatology, 53:1178–1185.
[86] JH Lee, HT An, JH Chung, KH Kim, HC Eun, andKH Cho. 2002. Acute effects of uvb radiation onthe proliferation and differentiation of keratinocytes.Photodermatol. Photoimmunol. Photomed., 18:253–261.
[87] S Del Bino, C Vioux, P Rossio-Pasquier, A Jomard,M Demarchez, D Asselineau, and F Bernerd. 2004.Ultraviolet b induces hyperproliferation and modificationof epidermal differentiation in normal human skin graftedon to nude mice. Br. J. Dermatol., 150:658–667.
[88] E Racz, EP Prens, D Kurek, M Kant, D de Ridder,S Mourits, EM Baerveldt, Z Ozgur, W FJ van IJcken,JD Laman, FJ Staal, and L van der Fits. 2011.Effective treatment of psoriasis with narrow-band uvbphototherapy is linked to suppression of the ifn and th17pathways. J. Invest. Dermatol., 131:1547–1558.
[89] BST Wong, BAL Hsu, and MDW Liao. 2013.Phototherapy in psoriasis: a review of mechanisms ofaction. J. Cutan. Med. Surg., 17:6–12.
[90] G Driessens, B Beck, A Caauwe, BD Simons, andC Blanpain. 2012. Defining the mode of tumour growthby clonal analysis. Nature, 488:527–530.
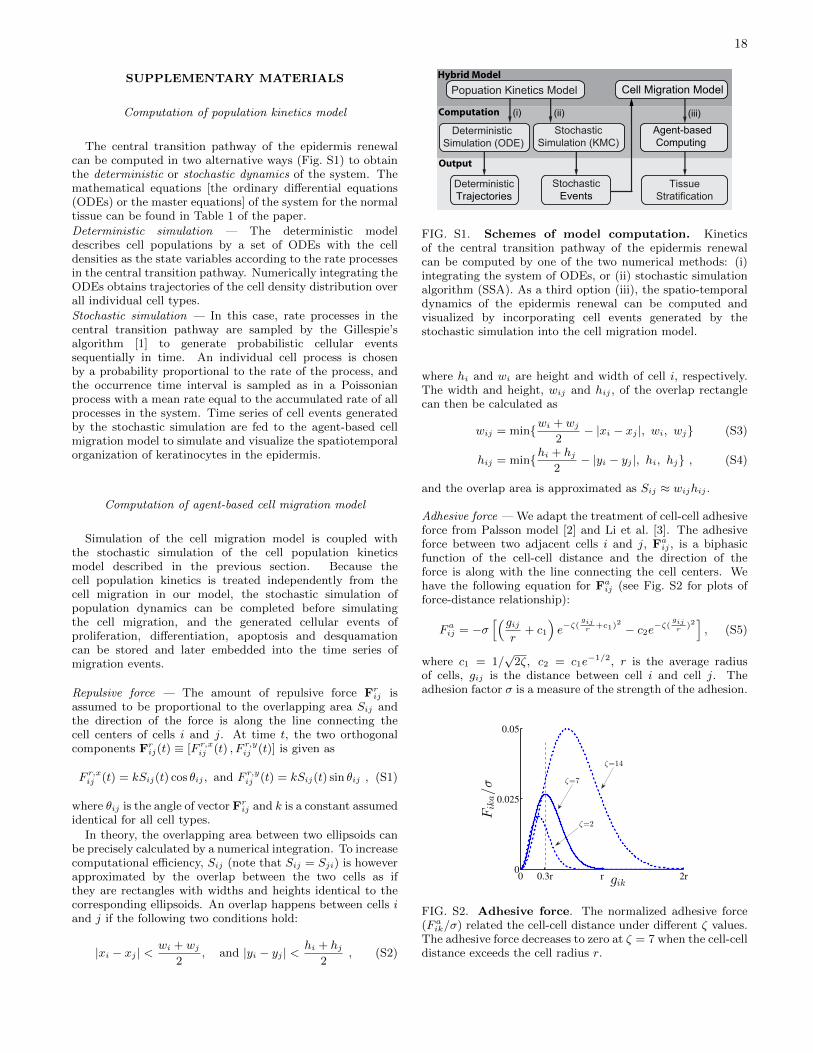
18
SUPPLEMENTARY MATERIALS
Computation of population kinetics model
The central transition pathway of the epidermis renewalcan be computed in two alternative ways (Fig. S1) to obtainthe deterministic or stochastic dynamics of the system. Themathematical equations [the ordinary differential equations(ODEs) or the master equations] of the system for the normaltissue can be found in Table 1 of the paper.
Deterministic simulation — The deterministic modeldescribes cell populations by a set of ODEs with the celldensities as the state variables according to the rate processesin the central transition pathway. Numerically integrating theODEs obtains trajectories of the cell density distribution overall individual cell types.
Stochastic simulation — In this case, rate processes in thecentral transition pathway are sampled by the Gillespie’salgorithm [1] to generate probabilistic cellular eventssequentially in time. An individual cell process is chosenby a probability proportional to the rate of the process, andthe occurrence time interval is sampled as in a Poissonianprocess with a mean rate equal to the accumulated rate of allprocesses in the system. Time series of cell events generatedby the stochastic simulation are fed to the agent-based cellmigration model to simulate and visualize the spatiotemporalorganization of keratinocytes in the epidermis.
Computation of agent-based cell migration model
Simulation of the cell migration model is coupled withthe stochastic simulation of the cell population kineticsmodel described in the previous section. Because thecell population kinetics is treated independently from thecell migration in our model, the stochastic simulation ofpopulation dynamics can be completed before simulatingthe cell migration, and the generated cellular events ofproliferation, differentiation, apoptosis and desquamationcan be stored and later embedded into the time series ofmigration events.
Repulsive force — The amount of repulsive force Frij isassumed to be proportional to the overlapping area Sij andthe direction of the force is along the line connecting thecell centers of cells i and j. At time t, the two orthogonalcomponents Frij(t) ≡ [F r,xij (t) , F r,yij (t)] is given as
F r,xij (t) = kSij(t) cos θij , and F r,yij (t) = kSij(t) sin θij , (S1)
where θij is the angle of vector Frij and k is a constant assumedidentical for all cell types.
In theory, the overlapping area between two ellipsoids canbe precisely calculated by a numerical integration. To increasecomputational efficiency, Sij (note that Sij = Sji) is howeverapproximated by the overlap between the two cells as ifthey are rectangles with widths and heights identical to thecorresponding ellipsoids. An overlap happens between cells iand j if the following two conditions hold:
|xi − xj | <wi + wj
2, and |yi − yj | <
hi + hj2
, (S2)
Output
Hybrid Model
Computation
Deterministic
Trajectories
Stochastic
Events
Agent-based
Computing
Tissue
Stratification
Deterministic
Simulation (ODE)
Stochastic
Simulation (KMC)
Popuation Kinetics Model Cell Migration Model
(i) (ii) (iii)
FIG. S1. Schemes of model computation. Kineticsof the central transition pathway of the epidermis renewalcan be computed by one of the two numerical methods: (i)integrating the system of ODEs, or (ii) stochastic simulationalgorithm (SSA). As a third option (iii), the spatio-temporaldynamics of the epidermis renewal can be computed andvisualized by incorporating cell events generated by thestochastic simulation into the cell migration model.
where hi and wi are height and width of cell i, respectively.The width and height, wij and hij , of the overlap rectanglecan then be calculated as
wij = minwi + wj2
− |xi − xj |, wi, wj (S3)
hij = minhi + hj2
− |yi − yj |, hi, hj , (S4)
and the overlap area is approximated as Sij ≈ wijhij .
Adhesive force — We adapt the treatment of cell-cell adhesiveforce from Palsson model [2] and Li et al. [3]. The adhesiveforce between two adjacent cells i and j, Faij , is a biphasicfunction of the cell-cell distance and the direction of theforce is along with the line connecting the cell centers. Wehave the following equation for Faij (see Fig. S2 for plots offorce-distance relationship):
F aij = −σ[(gij
r+ c1
)e−ζ(
gijr
+c1)2 − c2e−ζ(gijr
)2], (S5)
where c1 = 1/√
2ζ, c2 = c1e−1/2, r is the average radius
of cells, gij is the distance between cell i and cell j. Theadhesion factor σ is a measure of the strength of the adhesion.
0 0.3r r 2r0
0.025
0.05
gik
Fika/σ
ζ=2
ζ=7
ζ=14
FIG. S2. Adhesive force. The normalized adhesive force(F aik/σ) related the cell-cell distance under different ζ values.The adhesive force decreases to zero at ζ = 7 when the cell-celldistance exceeds the cell radius r.

19
0 2000 4000 60000
2
4
6
8
10x 10
4
time (day)
cell
den
sity
(m
m−
2)
(a)SC
TA
GA
SP
GC
CC
7-episode UVB
0 2000 4000 60000
2
4
6
8
10x 10
4
time (day)
cell
den
sity
(m
m−
2)
(b) SC
TA
GA
SP
GC
CC
6-episode UVB
10−1
100
101
102
103
104
0
5
10
15
20
time (day)
rate
(day
−1)
psoriasisUVBirradiation
remission
(c) Cytotoxic effect
PSC net proliferation
10−1
100
101
102
103
104
0
5
10
15
20
time (day)
rate
(day
−1)
psoriasisUVBirradiation
relapse
(d) Cytotoxic effect
PSC net proliferation
FIG. S3. Psoriasis phototherapy by multi-episode UVB irradiation. (a) 7-episode and (b) 6-episode UVB irradiationtreatments. The model simulated an area of length 5 mm × width 0.01 mm =0.05 mm2 (i.e., a single-cell sheet of theepidermis). Simulations started with a mixed population of normal (solid) and psoriatic (dashed) stem cells (about a 20:200ratio). Temporal evolution of the cytotoxic killing rate and psoriatic stem cell (PSC) net proliferation rate (selfproliferationrate - symmetric division rate) in (c) 7-episode and (d) 6-episode UVB irradiation. Note that compared to (a) and (b), timeaxes are shifted in plots (c) and (d) to remove the initial transient dynamics to psoriatic homeostasis. The UVB treatmentsfollow the same protocol described in the main text (Fig. 6). Parameter values used in the simulations are listed in the maintext (Table 3).
The density of desmosomes (typical cell junctions) has anonuniform distribution across different layers indicatingvarying adhesion strength in different cell types [3–5]. σ canbe adjusted for different keratinocytes to reflect this variation.We assume that the adhesion strength in proliferating cellsis the strongest and decreases from inner to outer layerin non-proliferating compartment due to decreased densityof desmosomes. For example, the corneocytes has reducedadhesion as Skerrow et al. [4] reported that the ratio ofdesmosome densities of differentiated layers and corneocytelayer was about 6. For calculating the adhesion forces betweendifferent cell types a and b, the mean σab = (σa+σb)/2 is used.We also note that stem cells are located on niches and movelaterally along the basement membrane.
Parameter ζ is usually assumed to be 7 with which theadhesive force is almost zero when the distance between twocells is larger than the mean cell radius r. The force increasesas the distance increases from zero and reaches a max forcewhen the distance is about 0.3r (see Fig. S2). As thedistance increases further, the adhesion declines to zero. Forcomputational efficiency, the distance between two adjacentcells is approximated by the shortest distance between cellsrepresented as rectangles with widths and heights identical
to the corresponding ellipsoids. The cell-cell distance iscalculated by
gij =√x2ij + y2
ij . (S6)
where
xij = max|xi − xj | −wi2− wj
2, 0 (S7)
yij = max|yi − yj | −hi2− hj
2, 0 (S8)
The equation of motion for cell migration
µdxidt
+ Fri + Fai = 0 , (S9)
Fri =∑
j=O(i)
Frij , Fai =∑j=Ω(i)
Faij (S10)
can be numerically solved for individual cells by a finitedifference method. With a small time step ∆tc, given thelocation of cell i at time t, xi(t), one can estimate the celllocation xi(t+ ∆tc) as a first-order approximation,
xi(t+ ∆tc) ≈ xi(t)−Fri (t) + Fai (t)
µ∆tc . (S11)
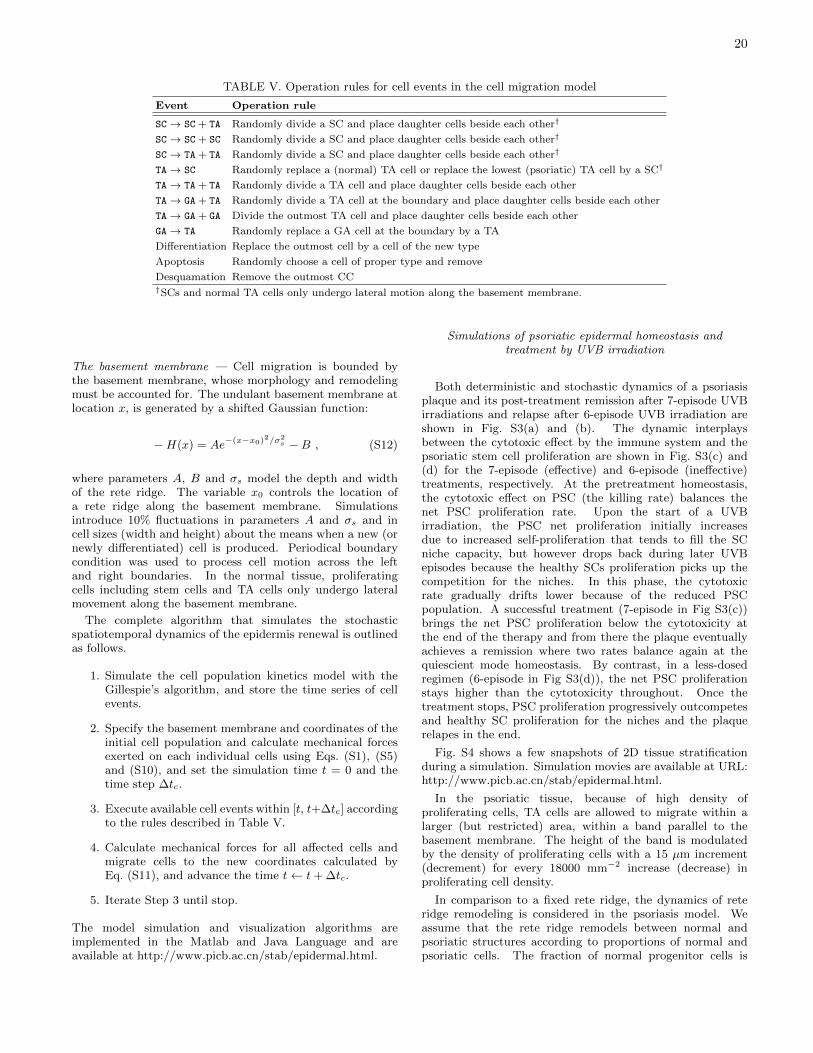
20
TABLE V. Operation rules for cell events in the cell migration model
Event Operation rule
SC → SC + TA Randomly divide a SC and place daughter cells beside each other†
SC → SC + SC Randomly divide a SC and place daughter cells beside each other†
SC → TA + TA Randomly divide a SC and place daughter cells beside each other†
TA → SC Randomly replace a (normal) TA cell or replace the lowest (psoriatic) TA cell by a SC†
TA → TA + TA Randomly divide a TA cell and place daughter cells beside each other
TA → GA + TA Randomly divide a TA cell at the boundary and place daughter cells beside each other
TA → GA + GA Divide the outmost TA cell and place daughter cells beside each other
GA → TA Randomly replace a GA cell at the boundary by a TA
Differentiation Replace the outmost cell by a cell of the new type
Apoptosis Randomly choose a cell of proper type and remove
Desquamation Remove the outmost CC†SCs and normal TA cells only undergo lateral motion along the basement membrane.
The basement membrane — Cell migration is bounded bythe basement membrane, whose morphology and remodelingmust be accounted for. The undulant basement membrane atlocation x, is generated by a shifted Gaussian function:
−H(x) = Ae−(x−x0)2/σ2s −B , (S12)
where parameters A, B and σs model the depth and widthof the rete ridge. The variable x0 controls the location ofa rete ridge along the basement membrane. Simulationsintroduce 10% fluctuations in parameters A and σs and incell sizes (width and height) about the means when a new (ornewly differentiated) cell is produced. Periodical boundarycondition was used to process cell motion across the leftand right boundaries. In the normal tissue, proliferatingcells including stem cells and TA cells only undergo lateralmovement along the basement membrane.
The complete algorithm that simulates the stochasticspatiotemporal dynamics of the epidermis renewal is outlinedas follows.
1. Simulate the cell population kinetics model with theGillespie’s algorithm, and store the time series of cellevents.
2. Specify the basement membrane and coordinates of theinitial cell population and calculate mechanical forcesexerted on each individual cells using Eqs. (S1), (S5)and (S10), and set the simulation time t = 0 and thetime step ∆tc.
3. Execute available cell events within [t, t+∆tc] accordingto the rules described in Table V.
4. Calculate mechanical forces for all affected cells andmigrate cells to the new coordinates calculated byEq. (S11), and advance the time t← t+ ∆tc.
5. Iterate Step 3 until stop.
The model simulation and visualization algorithms areimplemented in the Matlab and Java Language and areavailable at http://www.picb.ac.cn/stab/epidermal.html.
Simulations of psoriatic epidermal homeostasis andtreatment by UVB irradiation
Both deterministic and stochastic dynamics of a psoriasisplaque and its post-treatment remission after 7-episode UVBirradiations and relapse after 6-episode UVB irradiation areshown in Fig. S3(a) and (b). The dynamic interplaysbetween the cytotoxic effect by the immune system and thepsoriatic stem cell proliferation are shown in Fig. S3(c) and(d) for the 7-episode (effective) and 6-episode (ineffective)treatments, respectively. At the pretreatment homeostasis,the cytotoxic effect on PSC (the killing rate) balances thenet PSC proliferation rate. Upon the start of a UVBirradiation, the PSC net proliferation initially increasesdue to increased self-proliferation that tends to fill the SCniche capacity, but however drops back during later UVBepisodes because the healthy SCs proliferation picks up thecompetition for the niches. In this phase, the cytotoxicrate gradually drifts lower because of the reduced PSCpopulation. A successful treatment (7-episode in Fig S3(c))brings the net PSC proliferation below the cytotoxicity atthe end of the therapy and from there the plaque eventuallyachieves a remission where two rates balance again at thequiescient mode homeostasis. By contrast, in a less-dosedregimen (6-episode in Fig S3(d)), the net PSC proliferationstays higher than the cytotoxicity throughout. Once thetreatment stops, PSC proliferation progressively outcompetesand healthy SC proliferation for the niches and the plaquerelapes in the end.
Fig. S4 shows a few snapshots of 2D tissue stratificationduring a simulation. Simulation movies are available at URL:http://www.picb.ac.cn/stab/epidermal.html.
In the psoriatic tissue, because of high density ofproliferating cells, TA cells are allowed to migrate within alarger (but restricted) area, within a band parallel to thebasement membrane. The height of the band is modulatedby the density of proliferating cells with a 15 µm increment(decrement) for every 18000 mm−2 increase (decrease) inproliferating cell density.
In comparison to a fixed rete ridge, the dynamics of reteridge remodeling is considered in the psoriasis model. Weassume that the rete ridge remodels between normal andpsoriatic structures according to proportions of normal andpsoriatic cells. The fraction of normal progenitor cells is

21
defined as
r =normal SC + TA cells
total SC + TA cells, (S13)
Let y be the rete ridge height in time and Y is the targethomeostatic rete ridge height. We assume that the dynamicsof the rete ridge follows a first-order dynamics
τdy
dt= Y − y , (S14)
where τ is the time constant for the dynamics. We furtherassume Y is linearly regulated by r:
Y = Ymax − (Ymax − Ymin)r , (S15)
where Ymax (Ymin) is reached at r = 0 (r = 1).Eq. (S14) is numerically solved by the finite difference
method as follows:
y(t+ ∆tbm) =Y (t)− y(t)
τ∆tbm + y(t), (S16)
where Y (t) is calculated from Eq. (S15).We set Ymin =40 µm to match the healthy tissue when
normal stem cells dominate at the homestasis and Ymax =126µm, about 3 times higher than the normal epidermis.Based on data from successful UVB treatments showing thatpsoriasis plaques achieved remission in about 3-4 months [6–8], we set the time constant τ =100 day and ∆tbm was chosenas 20 day. In a simulation, whenever the basement membraneremodels, all stem cells and normal TA cells are relocatedalong with the membrane accordingly and other cells stayabove the basement membrane.
Identification of model parameters
We archive parameter values in Table 2 and 3 in themain text. The literature that reported parameter values
or provided information to derive the parameter values islisted in the tables. For example, cell sizes of keratinocytes atdifferent stages are reported in histology studies, and rateconstants for proliferation and differentiation are assignedbased on measurements (such as the stem cell proliferationrate) or identified from cell density distribution data andthe measured epidermal turnover time. We list multiplereferences for a parameter value if available for confirmation,but we acknowledge that the reference list may not beexhaustive. We also note that these parameter values serveas references and should not be considered as fixed becauseof variations of the epidermis homeostasis at skin location,age, gender and pathological conditions and uncertainties inexperimental measurements.
Parameters that are not measured are estimated orassumed (as indicated in the Tables). Assumed parametervalues are justifiable based on available information. Forexample, the stem cell growth capacity pmax
sc in the healthytissue is assumed as 4.5e3 mm2, about 2 times the homeostaticdensity, considering significant loss of stem cells throughsymmetric division and apoptosis. In comparison, the growthcapacity in the psoriatic tissue is extended (λ = 3.5 foldlarger), which was suggested by the histology data thatshowed extending rete ridge. Correspondingly, the maximumrete ridge height Ymax is assumed more than 3 times that ofthe healthy one. Parameters such as the maximum cytotoxicrate Kp have not been experimentally measured, which ischosen to predict a psoriasis mode (e.g., Kp = 6 mm−2day−1
is chosen to parameterize a switchable psoriatic tissue).
[1] DT Gillespie. 2007. Stochastic simulation of chemicalkinetics. Annu. Rev. Phys. Chem, 58:35–55.
[2] E Palsson. 2008. A 3-D model used to explore how celladhesion and stiffness affect cell sorting and movementin multicellular systems. J. Theo. Biol., 254:1–13.
[3] X Li, AK Upadhyay, AJ Bullock, T Dicolandrea,J Xu, RL Binder, MK Robinson, DR Finlay, KJ Mills,CC Bascom, et al. 2013. Skin stem cell hypothesesand long term clone survival-explored using agent-basedmodelling. Sci. Reports, 3.
[4] CJ Skerrow, DG Clelland, and D Skerrow. 1989.Changes to desmosomal antigens and lectin-bindingsites during differentiation in normal human epidermis:a quantitative ultrastructural study. J Cell Sci.,92:667–677.
[5] RA Foty and MS Steinberg. 2005. The differentialadhesion hypothesis: a direct evaluation. Develop. Biol.,278:255–263.
[6] RS Dawe, NJ Wainwright, H Cameron, and J Ferguson.1998. Narrow-band (TL-01) ultraviolet B phototherapy
for chronic plaque psoriasis: three times or five timesweekly treatment? Br. J. Dermatol., 138:833–839.
[7] M Trehan and CR Taylor. 2002. Medium-dose 308-nmexcimer laser for the treatment of psoriasis. J. Amer.Acad. Dermatol., 47:701–708.
[8] M Hartman, M Prins, OQJ Swinkels, JL Severens, Th.De Boo, GJ Van Der Wilt, PCM Van De Kerkhof, andPGM Van Der Valk. 2002. Cost-effectiveness analysisof a psoriasis care instruction programme with dithranolcompared with uvb phototherapy and inpatient dithranoltreatment. Br. J. Dermatol., 147:538–544.
[9] H Iizuka, H Takahashi, and A Ishida-Yamamoto.2004. Psoriatic architecture constructed by epidermalremodeling. J. Dermatol. Sci., 35:93 – 99.
[10] SC Weatherhead, PM Farr, D Jamieson, JS Hallinan,JJ Lloyd, A Wipat, and NJ Reynolds. 2011. Keratinocyteapoptosis in epidermal remodeling and clearance ofpsoriasis induced by uv radiation. J. Invest. Dermatol.,131:1916–1926.
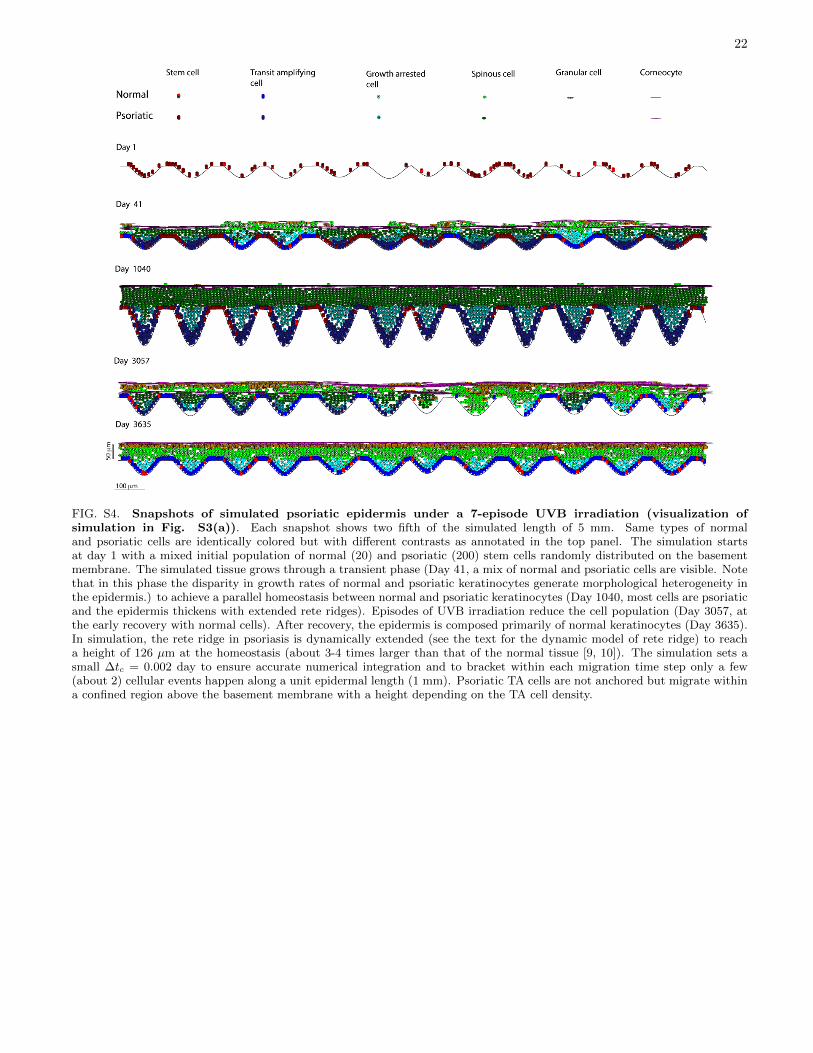
22
FIG. S4. Snapshots of simulated psoriatic epidermis under a 7-episode UVB irradiation (visualization ofsimulation in Fig. S3(a)). Each snapshot shows two fifth of the simulated length of 5 mm. Same types of normaland psoriatic cells are identically colored but with different contrasts as annotated in the top panel. The simulation startsat day 1 with a mixed initial population of normal (20) and psoriatic (200) stem cells randomly distributed on the basementmembrane. The simulated tissue grows through a transient phase (Day 41, a mix of normal and psoriatic cells are visible. Notethat in this phase the disparity in growth rates of normal and psoriatic keratinocytes generate morphological heterogeneity inthe epidermis.) to achieve a parallel homeostasis between normal and psoriatic keratinocytes (Day 1040, most cells are psoriaticand the epidermis thickens with extended rete ridges). Episodes of UVB irradiation reduce the cell population (Day 3057, atthe early recovery with normal cells). After recovery, the epidermis is composed primarily of normal keratinocytes (Day 3635).In simulation, the rete ridge in psoriasis is dynamically extended (see the text for the dynamic model of rete ridge) to reacha height of 126 µm at the homeostasis (about 3-4 times larger than that of the normal tissue [9, 10]). The simulation sets asmall ∆tc = 0.002 day to ensure accurate numerical integration and to bracket within each migration time step only a few(about 2) cellular events happen along a unit epidermal length (1 mm). Psoriatic TA cells are not anchored but migrate withina confined region above the basement membrane with a height depending on the TA cell density.