Embed Size (px)
Citation preview
MODELING FIXED RATE MBS PREPAYMENTS
Ted Hong
ABSTRACT This paper demonstrates our prepayment framework that has combined some fundamental economic thought about the prepayment decision with the empirical study based on the historical data of the US residential mortgages.
The spline functional form, especially cubic spline, is employed for modeling the prepayment behavior throughout the article. Using different forms of the spline, we were able to filter various prepayment factors out such as refinance, age and burnout.
The refinance factor measures refinancing incentive based on the cumulated in-the-money call options through the maturity, it is considered as the primary incentive for prepayments. One the other hand, the age factor discounts some of the prepayment impact for less seasoned loans. Mortgagors usually have less incentive to prepayment initially due to the fixed financing cost. The burn-out factor which is caused by the population heterogeneity, on the other hand, discounts the refinancing incentive via the remaining principal factor of the mortgages. A synthetic principal factor that only accumulates in-the-money prepayment options is introduced to more accurately capture the burnout.
While the model filters several important prepayment factors, other components such as the housing turn-over rate, initial financing expense, and the issue year for pooling the mortgage loans are the exogenous non-neglected variables that need for fine-tuning from time to time. The seasonality factor is to measure the different impact on prepayment due to the seasonality over the year. The yield curve factor enables us to measure cross maturities refinancing.
All of them were quantified to form our prepayment model.
I. INTRODUCTION
Modeling prepayments is an on-ongoing research project. We however, with some innovations, like to shed a light on prepayment behaviors. The importance of prepayment analysis has been recognized since people started to trade mortgages because mortgage prepayment can severely affect the price performance of an underlying mortgage. It was even more important than ever since the Mortgage-Backed Securities (MBS) market became the fastest growing and largest sector in the United States capital markets in last decade. The considerably good liquidity and relatively high refinance MBS products have attracted a wide range of investors. Furthermore, mortgage derivatives and structured products that can be highly sensitive to prepayments and require more advanced pricing technique such as options adjusted refinance have been commonly used for sales and trading in the fixed income markets.
Recently, the recent interest rate environment that play a key determinant to mortgage prepayments, is at its lowest moment over the last forty years and has triggered a new wave of refinance and pushed the prepayment to new high record. Mortgage research obviously requires sophisticated analytical tools with prepayment modeling capability. A collection of
various types of the mortgage prepayment models that could provide constant updates and feedbacks with respect to the market momentum becomes even more viable for the investors.
To construct a prepayment model, data mining on the historical data is usually the first step to construct basic summary statistics. Then an economic model with functional form will be helpful to consistently understand prepayment phenomenon over time. Empirically fitting the historical prepayment data certainly would add further research creditability for the model. Finally, systematically projecting prepayments in a consistent basis would be useful and practical for the market to utilizing the model.
As we mentioned, the empirical results based on the prepayment model provide the support and certain creditability for the model. However, if any up-to-date news that was not originally considered as the model parameters were fitted, the additional fine tuning capability on coefficients helps to compensate the most up-to-date feedbacks and missing observations.
The applications of the model can be used not only for prepayment forecast but also for pricing, options adjusted spread evaluation, and scenario analysis for mortgages and mortgage backed securities.
Our prepayment model was based on the fundamental economic theory that analyzed mortgagor's prepayment behaviors with the empirical study over the actual US residential prepayment experience. In the model, we selected essential mortgage characteristics such as maturity, age, contract coupon rate, principal factor and crucial economic variables such as the prevailing market mortgage rate and yield curve information over time to build our prepayment basic components. The model was mainly designed for capturing statistically significant prepayment factors. Any idiosyncratic prepayment behavior was not the focus based on the parsimonious principal.
The rest of paper is arranged as follows. The next section describes the prepayment data in summary. The section III examines our prepayment components in the individual basis and provides theoretic framework and its detailed model specification. The empirical results and its numerical illustration are presented in section IV. Finally, we draw the conclusion for our findings, the parameters updating procedure and forward looking.
II. DATA
We selected the US residential mortgage data based on three government agencies, Federal Home Loan Mortgage Corporation (FHLMC), Federal National Mortgage Association (FNMA), and Government National Mortgage Association (GNMA). The data were monthly updated prepayment historical data in pool basis from January 1982. We compiled the data in both Single Monthly Mortality (SMM) and Constant Prepayment Rate (CPR) format over the period in the cohort data format. Our cohort prepayment data were categorized by government agencies and amortization types. Within each category, mortgages were pooled by mortgage issue year and net coupon rates. Each pool then can be represented by Gross Weighted average Maturity (WAM), Weighted Average Coupon (WAC), total outstanding balance, weighted average remaining principal factor, Weighted Average Age (AGE), and prepayment rate in SMM and CPR formats.
2
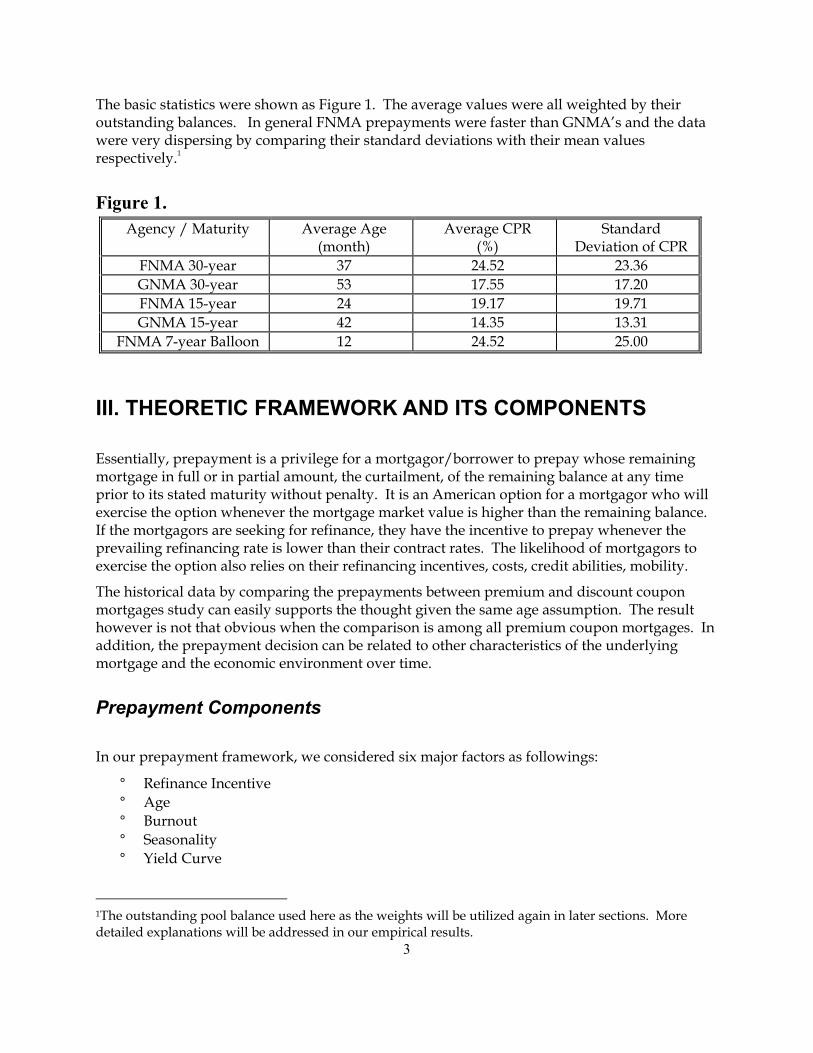
The basic statistics were shown as Figure 1. The average values were all weighted by their outstanding balances. In general FNMA prepayments were faster than GNMA’s and the data were very dispersing by comparing their standard deviations with their mean values respectively.1
Figure 1. Agency / Maturity Average Age
(month) Average CPR
(%) Standard
Deviation of CPR FNMA 30-year 37 24.52 23.36 GNMA 30-year 53 17.55 17.20 FNMA 15-year 24 19.17 19.71 GNMA 15-year 42 14.35 13.31
FNMA 7-year Balloon 12 24.52 25.00
III. THEORETIC FRAMEWORK AND ITS COMPONENTS
Essentially, prepayment is a privilege for a mortgagor/borrower to prepay whose remaining mortgage in full or in partial amount, the curtailment, of the remaining balance at any time prior to its stated maturity without penalty. It is an American option for a mortgagor who will exercise the option whenever the mortgage market value is higher than the remaining balance. If the mortgagors are seeking for refinance, they have the incentive to prepay whenever the prevailing refinancing rate is lower than their contract rates. The likelihood of mortgagors to exercise the option also relies on their refinancing incentives, costs, credit abilities, mobility.
The historical data by comparing the prepayments between premium and discount coupon mortgages study can easily supports the thought given the same age assumption. The result however is not that obvious when the comparison is among all premium coupon mortgages. In addition, the prepayment decision can be related to other characteristics of the underlying mortgage and the economic environment over time.
Prepayment Components
In our prepayment framework, we considered six major factors as followings:
° ° ° ° °
Refinance Incentive Age Burnout Seasonality Yield Curve
3
1The outstanding pool balance used here as the weights will be utilized again in later sections. More detailed explanations will be addressed in our empirical results.

The prepayment incentive stems from refinancing portion and measured by the difference between the mortgage rate and its prevailing refinancing rate is commonly recognized as the refinance factor. The initial origination fee and loan closing expense usually takes first few years to depreciate and that discourage mortgagors to prepay their mortgages in the beginning is contributed as the age factor. The mobility of mortgagor such as timing of housing construction, school year, and weather considerations can be considered as seasonality. The heterogeneity of refinancing population that mortgagors can respond different prepayment incentive reaction to the same refinancing rate can be filtered out as the burnout. The cross maturities refinancing incentive that relates to yield curve shape can be measured by the yield curve factor. Each factor will be discussed in turn.
Mortgage Agencies and Amortization Types Since the mortgage agencies have their own criteria to underwrite and pool their mortgages, their prepayment behaviors are not necessary the same. For example, the GNMA mortgage pools, which are either insured by FHA or guaranteed by VA loans, qualify only low income and veterans. Their prepayments can behave quite different from the conventional loans which are backed by FNMA or FHLMC. The amortization types can be based on amortization schedule and maturity term such as 30-year, 15-year, 7-year balloon, and 5-year balloon. Different payment types such as fixed rate, adjustable rate, or GPM can also result in different type of prepayments. Their prepayment structures can be demographically different and should be estimated separately. This paper only focuses only on the fixed rate residential mortgage. Other types of prepayment modeling will reserved for another paper for detailed discussion.
Refinancing Incentive It is essential and well known that mortgagors tend to prepay whenever the mortgage rate is greater than the prevailing refinancing rate.2 In other words, mortgagors tend to prepay while their prepayment option is in-the-money. The refinancing costs such as origination points, processing expenses, title insurance, and loan qualification difficulties, however, determine whether the option is worthy to be exercised or not. Since the drop in interest rates increases the value of prepayment option, prepayments speed up while interest rates decrease. Due to processing time for the loan origination, lagged interest rates are more relevant to prepayments.
Let the averaged conventional commitment rates of primary mortgage market surveyed by Freddie Mac be our refinancing incentive threshold (current coupon mortgage rate) and let refinancing incentive be the refinance between WAC and FRM30Y. An S-shaped refinancing pattern can be drawn based on historical prepayments. Figure 2 displays FNMA 30-year CPR versus refinancing incentive of three age brackets based on actual prepayments from January, 1990 to October, 1993. The brackets new, moderately seasoned, and seasoned denote mortgage age to be less than 30, between 30 and 60, and greater than 60 months respectively. The lower
4
2The prevailing interest rate is the threshold of exercising a prepayment option which can be thought as current coupon mortgage rate. Any greater/lower contract rate mortgage is considered as premium/discount coupon mortgage. Note that the prevailing mortgage rate can be greater than the actual FNMA current coupon rate due to heterogeneous refinancing costs.
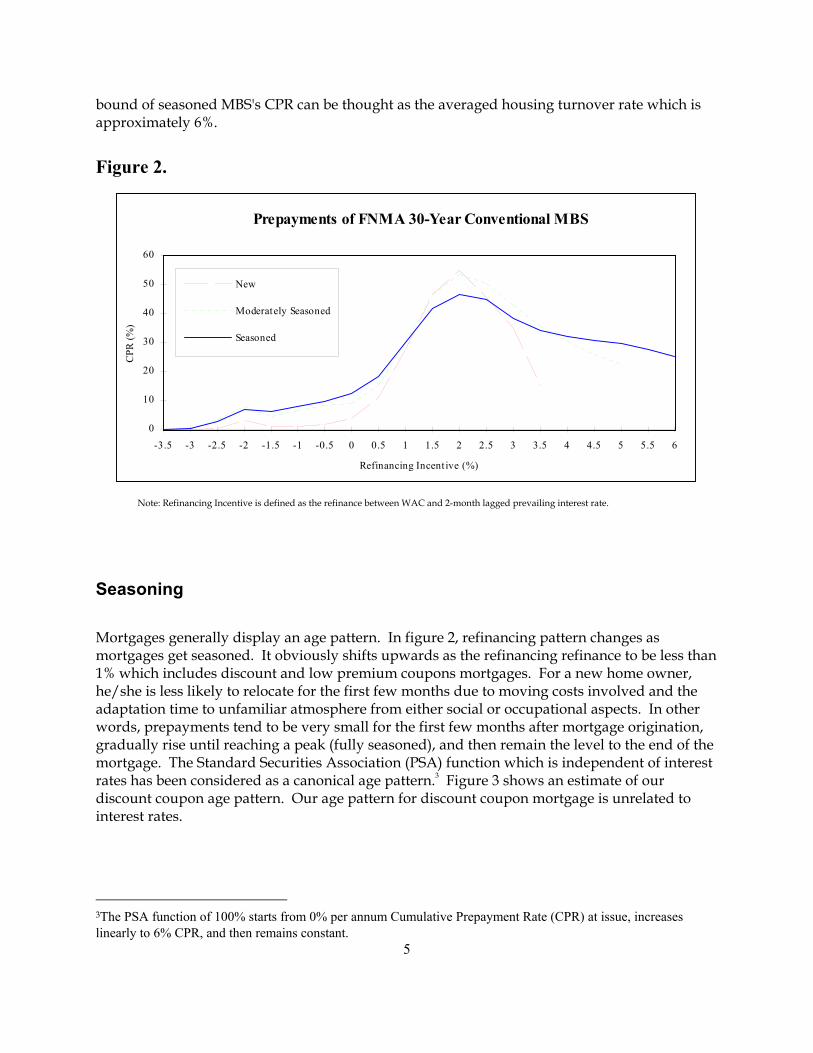
bound of seasoned MBS's CPR can be thought as the averaged housing turnover rate which is approximately 6%.
Figure 2.
Prepayments of FNMA 30-Year Conventional MBS
Refinancing Incentive (%)
CPR
(%)
0
10
20
30
40
50
60
-3.5 -3 -2.5 -2 -1.5 -1 -0.5 0 0.5 1 1.5 2 2.5 3 3.5 4 4.5 5 5.5 6
New
Moderately Seasoned
Seasoned
Note: Refinancing Incentive is defined as the refinance between WAC and 2-month lagged prevailing interest rate.
Seasoning
Mortgages generally display an age pattern. In figure 2, refinancing pattern changes as mortgages get seasoned. It obviously shifts upwards as the refinancing refinance to be less than 1% which includes discount and low premium coupons mortgages. For a new home owner, he/she is less likely to relocate for the first few months due to moving costs involved and the adaptation time to unfamiliar atmosphere from either social or occupational aspects. In other words, prepayments tend to be very small for the first few months after mortgage origination, gradually rise until reaching a peak (fully seasoned), and then remain the level to the end of the mortgage. The Standard Securities Association (PSA) function which is independent of interest rates has been considered as a canonical age pattern.3 Figure 3 shows an estimate of our discount coupon age pattern. Our age pattern for discount coupon mortgage is unrelated to interest rates.
5
3The PSA function of 100% starts from 0% per annum Cumulative Prepayment Rate (CPR) at issue, increases linearly to 6% CPR, and then remains constant.
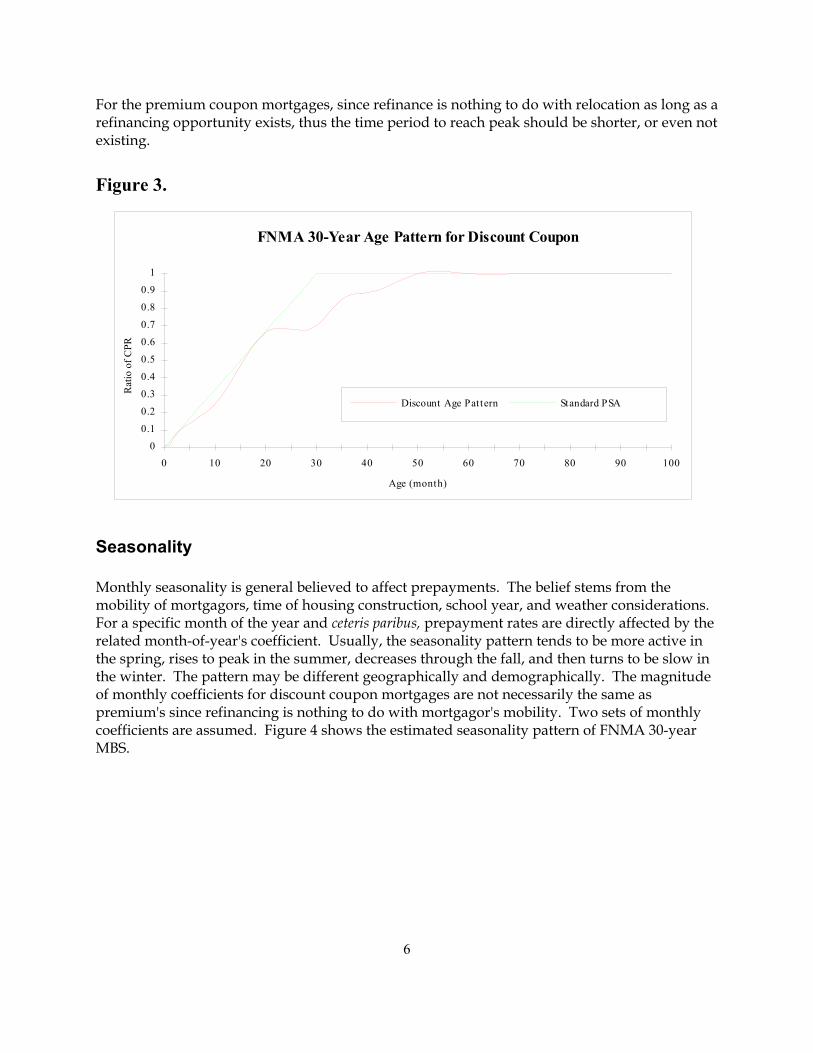
For the premium coupon mortgages, since refinance is nothing to do with relocation as long as a refinancing opportunity exists, thus the time period to reach peak should be shorter, or even not existing.
Figure 3.
FNMA 30-Year Age Pattern for Discount Coupon
Age (month)
Rat
io o
f CPR
0
0.1
0.2
0.3
0.4
0.5
0.6
0.7
0.8
0.9
1
0 10 20 30 40 50 60 70 80 90 100
Discount Age Pat tern Standard PSA
Seasonality Monthly seasonality is general believed to affect prepayments. The belief stems from the mobility of mortgagors, time of housing construction, school year, and weather considerations. For a specific month of the year and ceteris paribus, prepayment rates are directly affected by the related month-of-year's coefficient. Usually, the seasonality pattern tends to be more active in the spring, rises to peak in the summer, decreases through the fall, and then turns to be slow in the winter. The pattern may be different geographically and demographically. The magnitude of monthly coefficients for discount coupon mortgages are not necessarily the same as premium's since refinancing is nothing to do with mortgagor's mobility. Two sets of monthly coefficients are assumed. Figure 4 shows the estimated seasonality pattern of FNMA 30-year MBS.
6
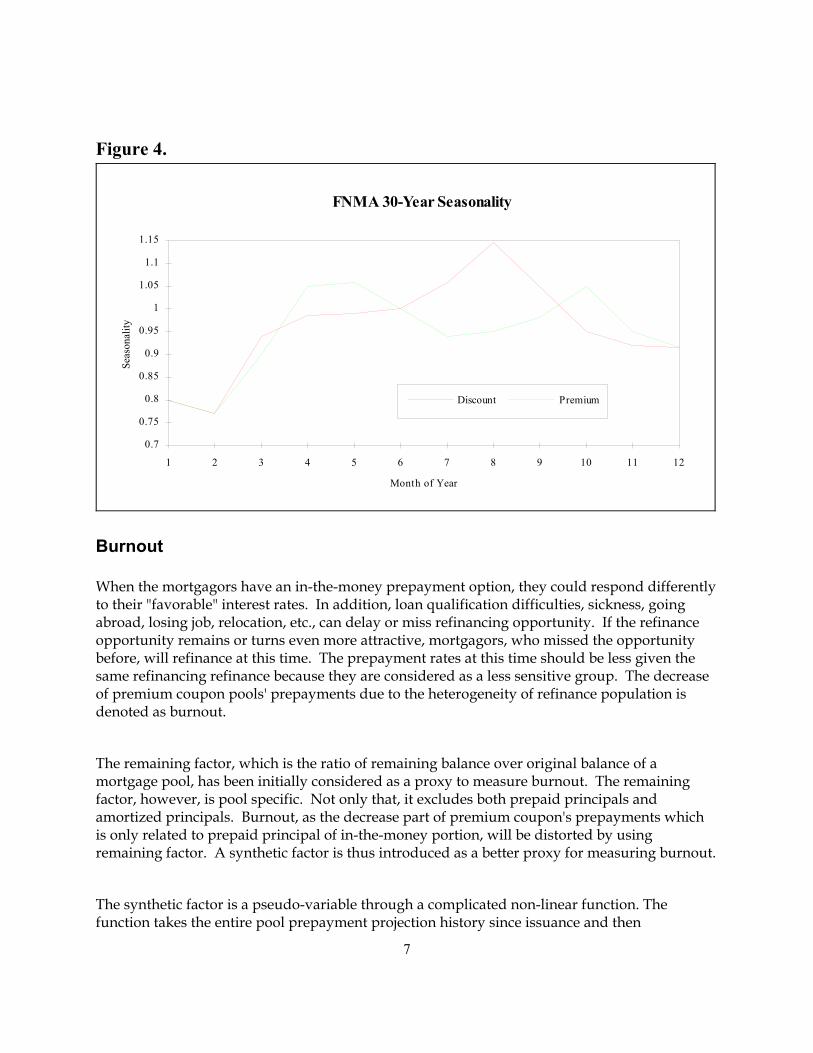
Figure 4.
FNMA 30-Year Seasonality
Month of Year
Seas
onal
ity
0.7
0.75
0.8
0.85
0.9
0.95
1
1.05
1.1
1.15
1 2 3 4 5 6 7 8 9 10 11 12
Discount Premium
Burnout When the mortgagors have an in-the-money prepayment option, they could respond differently to their "favorable" interest rates. In addition, loan qualification difficulties, sickness, going abroad, losing job, relocation, etc., can delay or miss refinancing opportunity. If the refinance opportunity remains or turns even more attractive, mortgagors, who missed the opportunity before, will refinance at this time. The prepayment rates at this time should be less given the same refinancing refinance because they are considered as a less sensitive group. The decrease of premium coupon pools' prepayments due to the heterogeneity of refinance population is denoted as burnout.
The remaining factor, which is the ratio of remaining balance over original balance of a mortgage pool, has been initially considered as a proxy to measure burnout. The remaining factor, however, is pool specific. Not only that, it excludes both prepaid principals and amortized principals. Burnout, as the decrease part of premium coupon's prepayments which is only related to prepaid principal of in-the-money portion, will be distorted by using remaining factor. A synthetic factor is thus introduced as a better proxy for measuring burnout.
The synthetic factor is a pseudo-variable through a complicated non-linear function. The function takes the entire pool prepayment projection history since issuance and then
7

accumulates only in-the-money portion prepayments to form the factor. The usage of the synthetic factor serves four purposes. First, it decreases only as refinance incentives emerge which is immune from the principal amortization schedule. Second, it checks the whole historical prepayment projections, preventing specific pool factor distortion. Third, it uses mortgage's age for the accumulation of the factor so that a seasoned mortgage issued earlier than securitized date which produces a higher remaining factor would be irrelevant to burnout. Finally, it merely accumulates the excess parts over current coupon's prepayments since issuance that takes only in-the-money portions into account. Figure 5 shows an estimate of FNMA 30-year burnout versus synthetic factor.
Figure 5.
FNMA 30-Year Burnout
Synthet ic Factor (%)
Bur
nout
(%)
0
10
20
30
40
50
60
70
80
90
100
0 10 20 30 40 50 60 70 80 90 100
Yield Curve
Since late 1991, interest rates have dropped and they are currently at the lowest points for past twenty-five years. Although faster prepayments were anticipated, the huge volume of refinancing activities through 1992 is still beyond people's expectations. With such a steep yield curve environment (more than 300 basis points refinance between 1- and 10-year Treasuries over the year of 1992 as shown in figure 6), the shape of yield curve has won the attention as the prepayment component of cross maturities refinance.
8
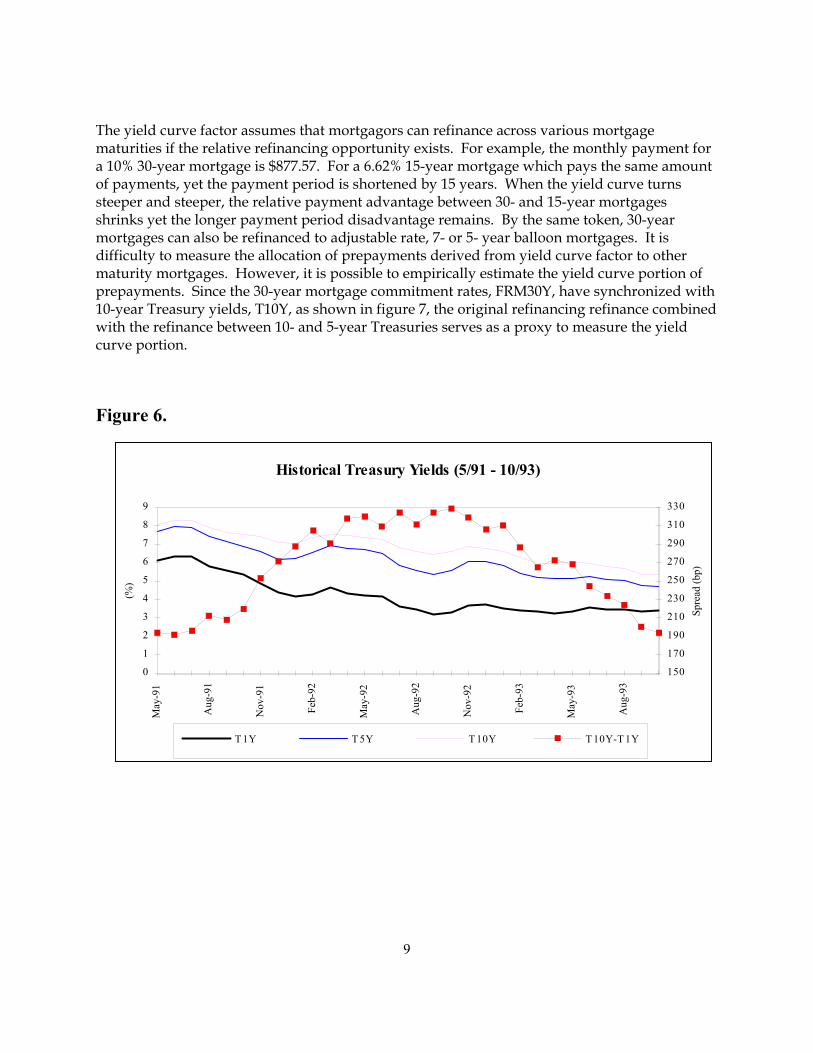
The yield curve factor assumes that mortgagors can refinance across various mortgage maturities if the relative refinancing opportunity exists. For example, the monthly payment for a 10% 30-year mortgage is $877.57. For a 6.62% 15-year mortgage which pays the same amount of payments, yet the payment period is shortened by 15 years. When the yield curve turns steeper and steeper, the relative payment advantage between 30- and 15-year mortgages shrinks yet the longer payment period disadvantage remains. By the same token, 30-year mortgages can also be refinanced to adjustable rate, 7- or 5- year balloon mortgages. It is difficulty to measure the allocation of prepayments derived from yield curve factor to other maturity mortgages. However, it is possible to empirically estimate the yield curve portion of prepayments. Since the 30-year mortgage commitment rates, FRM30Y, have synchronized with 10-year Treasury yields, T10Y, as shown in figure 7, the original refinancing refinance combined with the refinance between 10- and 5-year Treasuries serves as a proxy to measure the yield curve portion.
Figure 6.
Historical Treasury Yields (5/91 - 10/93)
(%)
0
1
2
3
4
5
6
7
8
9
May
-91
Aug
-91
Nov
-91
Feb-
92
May
-92
Aug
-92
Nov
-92
Feb-
93
May
-93
Aug
-93
150
170
190
210
230
250
270
290
310
330
Spre
ad (b
p)
T 1Y T 5Y T 10Y T 10Y-T 1Y
9

Figure 7.
Historical Mortgage Rates (5/91 - 10/93)
(%)
5
6
7
8
9
10
Mar
-91
Jun-
91
Sep-
91
Dec
-91
Mar
-92
Jun-
92
Sep-
92
Dec
-92
Mar
-93
Jun-
93
Sep-
93
FRM30Y T 10Y
MODEL SPECIFICATION In order to constructing a prepayment model, variable selection, model specification, statistical estimation, and predictability are usually inevitable. A priori is essential for the model specification. A prepayment model with same variables yet different specification may conclude results differently. The statistical estimation and goodness of fit also affect our criteria of model selection.
Our prepayment model which employs economic variables discussed as before includes prepayment components:
° Issuer Agency ° Amortization Type ° Prepayment Pool Issue Year ° Initial Financing Expense ° National Housing Turn-over Rate ° Seasoning – Age Factor ° Seasonality – Seasonal Factor ° Refinancing Incentive – Refinance Factor ° Population Heterogeneity – Burnout Factor ° Cross maturity Refinancing – Yield Curve Factor
Essentially, agency and amortization types are considered as demographic variables, their prepayments are modeled separately within each category. The model is multiplicative among
10
age, seasonal, rate and burnout factors and is additive in the logarithm format while estimation was taken place to ensure a non-negative prepayments. In each factor, a spine function is applied and cubic spine is used for certain factor to ensure a higher degree continuity and smoothness. This design provides us an elegant but flexible mathematical specification.
A Multiplicative Spline Model Let CPR be the annualized Constant Prepayment Rate, our prepayment model is the multiplicative product of following five components, Refinance, Age, Seasonality, Burnout, and Yield Curve and is formulated as followings:4
[Prepayment] = [Refinance] ⋅ [Age] ⋅ [Seasonality] ⋅ [Burnout] ⋅ [Yield Curve]
Each component or factor forms a separate spline function. The Refinance factor that utilizes cubic spline functional form provides the primary the prepayment backbone while the Age, Seasonality, Burnout and Yield Curve factors are constructed as the relative ratio to support the Refinance factor.
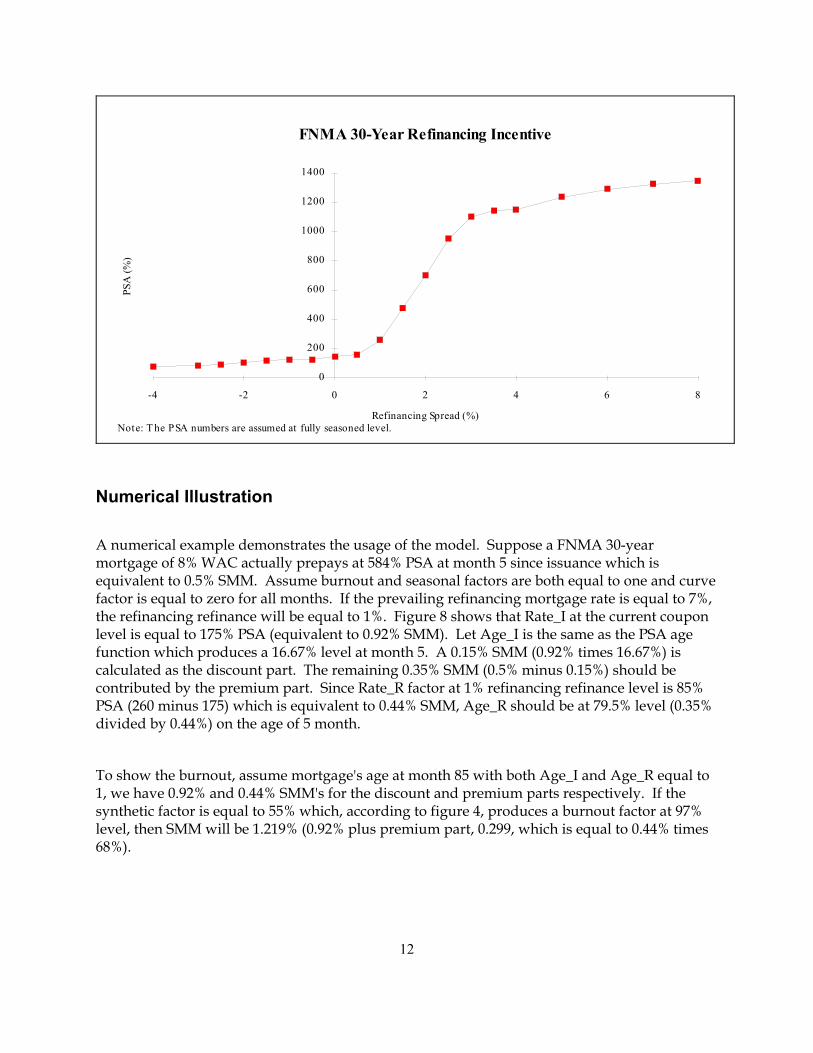
Figure 8 provides an example of estimated FNMA 30-year MBS refinancing function on a PSA basis. The PSA format is used for helping the intuition of prepayment measuring unit. The corresponding SMM can be easily converted via a fully seasoned PSA schedule. A 150% PSA, for instance, should be equal to 0.78% SMM. A 375% PSA, however, should be equal to 1.05% plus 0.92% SMM instead of 2.10% because current coupon PSA is at 175% level.
Figure 8. Estimated Refinancing Function
4See appendix I for more details of model specification.
11
FNMA 30-Year Refinancing Incentive
Refinancing Spread (%)
PSA
(%)
0
200
400
600
800
1000
1200
1400
-4 -2 0 2 4 6 8
Note: T he PSA numbers are assumed at fully seasoned level.
Numerical Illustration
A numerical example demonstrates the usage of the model. Suppose a FNMA 30-year mortgage of 8% WAC actually prepays at 584% PSA at month 5 since issuance which is equivalent to 0.5% SMM. Assume burnout and seasonal factors are both equal to one and curve factor is equal to zero for all months. If the prevailing refinancing mortgage rate is equal to 7%, the refinancing refinance will be equal to 1%. Figure 8 shows that Rate_I at the current coupon level is equal to 175% PSA (equivalent to 0.92% SMM). Let Age_I is the same as the PSA age function which produces a 16.67% level at month 5. A 0.15% SMM (0.92% times 16.67%) is calculated as the discount part. The remaining 0.35% SMM (0.5% minus 0.15%) should be contributed by the premium part. Since Rate_R factor at 1% refinancing refinance level is 85% PSA (260 minus 175) which is equivalent to 0.44% SMM, Age_R should be at 79.5% level (0.35% divided by 0.44%) on the age of 5 month.
To show the burnout, assume mortgage's age at month 85 with both Age_I and Age_R equal to 1, we have 0.92% and 0.44% SMM's for the discount and premium parts respectively. If the synthetic factor is equal to 55% which, according to figure 4, produces a burnout factor at 97% level, then SMM will be 1.219% (0.92% plus premium part, 0.299, which is equal to 0.44% times 68%).
12
Since seasonal factor merely denoted as monthly coefficients, continuing to previous case, SMM will be 1.618% which comprises 1.334%, 0.92% multiplied by 1.45 for discount part, and 0.284%, 0.299% multiplied by 0.95 for premium part.
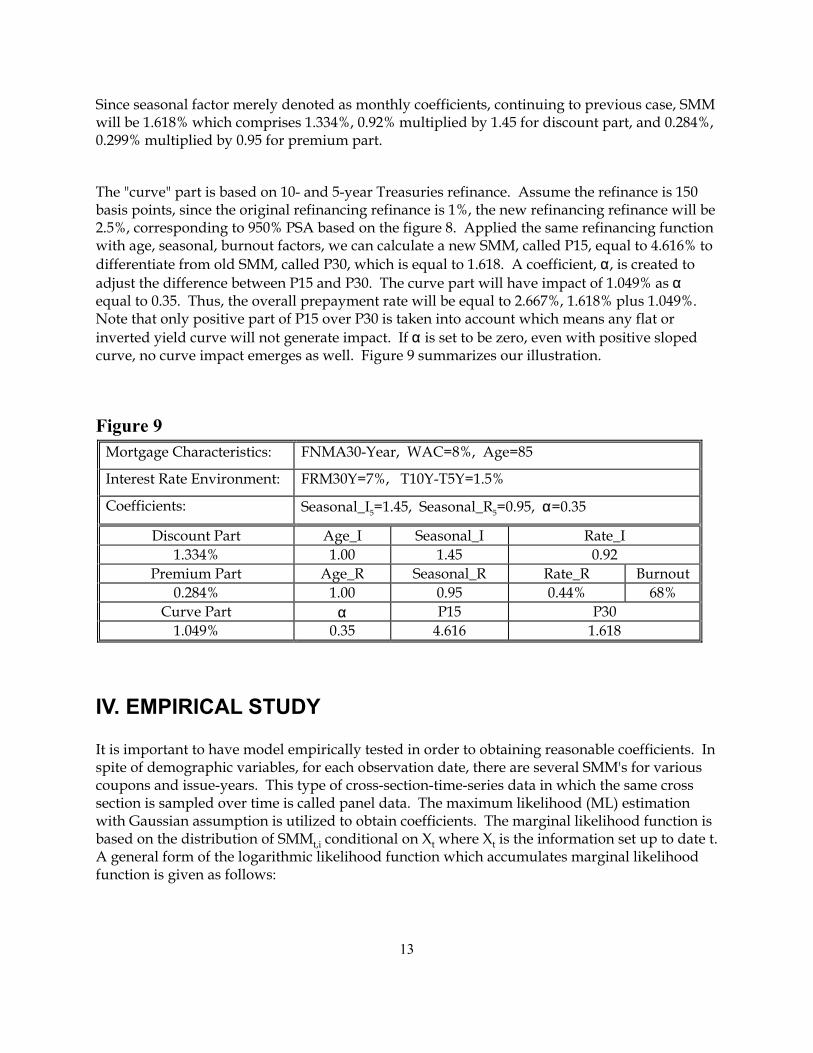
The "curve" part is based on 10- and 5-year Treasuries refinance. Assume the refinance is 150 basis points, since the original refinancing refinance is 1%, the new refinancing refinance will be 2.5%, corresponding to 950% PSA based on the figure 8. Applied the same refinancing function with age, seasonal, burnout factors, we can calculate a new SMM, called P15, equal to 4.616% to differentiate from old SMM, called P30, which is equal to 1.618. A coefficient, α, is created to adjust the difference between P15 and P30. The curve part will have impact of 1.049% as α equal to 0.35. Thus, the overall prepayment rate will be equal to 2.667%, 1.618% plus 1.049%. Note that only positive part of P15 over P30 is taken into account which means any flat or inverted yield curve will not generate impact. If α is set to be zero, even with positive sloped curve, no curve impact emerges as well. Figure 9 summarizes our illustration.
Figure 9 Mortgage Characteristics: FNMA30-Year, WAC=8%, Age=85
Interest Rate Environment: FRM30Y=7%, T10Y-T5Y=1.5%
Coefficients: Seasonal_I5=1.45, Seasonal_R5=0.95, α=0.35
Discount Part Age_I Seasonal_I Rate_I 1.334% 1.00 1.45 0.92
Premium Part Age_R Seasonal_R Rate_R Burnout 0.284% 1.00 0.95 0.44% 68%
Curve Part α P15 P30 1.049% 0.35 4.616 1.618
IV. EMPIRICAL STUDY It is important to have model empirically tested in order to obtaining reasonable coefficients. In spite of demographic variables, for each observation date, there are several SMM's for various coupons and issue-years. This type of cross-section-time-series data in which the same cross section is sampled over time is called panel data. The maximum likelihood (ML) estimation with Gaussian assumption is utilized to obtain coefficients. The marginal likelihood function is based on the distribution of SMMt,i conditional on Xt where Xt is the information set up to date t. A general form of the logarithmic likelihood function which accumulates marginal likelihood function is given as follows:
13
⋅−+⋅= ∑∑∑∑
T
ttit
i
iitit
T
ttit
i
iT wXfSMMwXL
tt
1=
2,
1=,,
1=,
1=}]/));({[()/ln(2)|( ln σθσθ
Where θ is a vector of parameters; the indices t, i represents time and mortgage type (such as net coupon and issue-year) correspondingly; wt,i denotes the weights for each observation. Heteroskedascity (non-constant variance of the error term) and local maximum problems, however, are concerned. The goodness of fit and out-of-sample predictability serves the criteria in our fitting process.
The constant variance assumption over the whole data set, i.e., (σt / wt,i) to be constant, may be too strong for panel data. Different method to weight data, however, can result in substantially different estimated coefficients. With the simple assumption of σt to be constant, our weights, wt,i's, are based on their outstanding pool balances which presumably give more weights on recent data especially on the current coupon mortgages. These weights, not only targeting more accuracy on larger pools, but also implicitly emphasizing more validity on recent current coupon mortgage observations due to the fast growing MBS market for last several years. It may not be the best proxy to justify heteroskedascity, yet it provides us a better sense of fitting in practice. The complexity of non-linearity in parameter space may cause local maximum convergence while employing MLE. An improper assumption on initial values can lead the model converging to a non-intuitive set of coefficients. A carefully designed initial values set with economic intuition is important prior to estimation. The R2 statistics, which are 94.7% and 90.2% for GNMA and FNMA 30-year MBS's respectively, are fairly high although they is not very meaningful due to the heteroskedastic adjustment.
Empirical Results
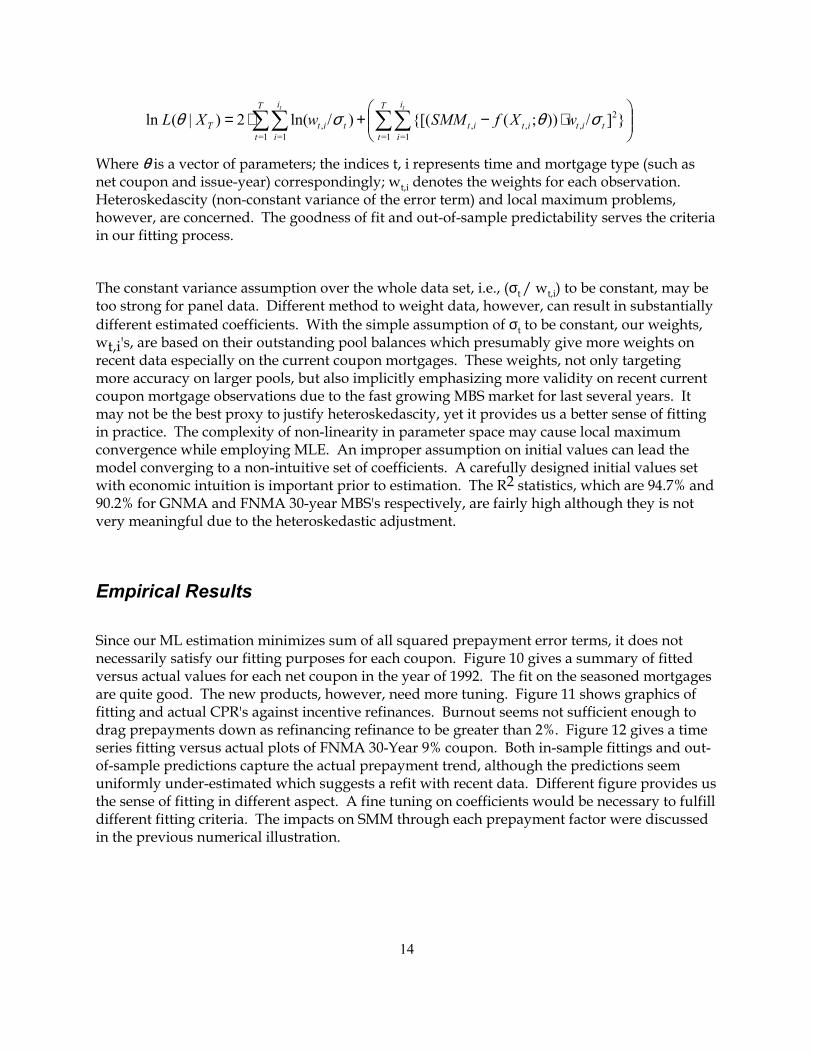
Since our ML estimation minimizes sum of all squared prepayment error terms, it does not necessarily satisfy our fitting purposes for each coupon. Figure 10 gives a summary of fitted versus actual values for each net coupon in the year of 1992. The fit on the seasoned mortgages are quite good. The new products, however, need more tuning. Figure 11 shows graphics of fitting and actual CPR's against incentive refinances. Burnout seems not sufficient enough to drag prepayments down as refinancing refinance to be greater than 2%. Figure 12 gives a time series fitting versus actual plots of FNMA 30-Year 9% coupon. Both in-sample fittings and out-of-sample predictions capture the actual prepayment trend, although the predictions seem uniformly under-estimated which suggests a refit with recent data. Different figure provides us the sense of fitting in different aspect. A fine tuning on coefficients would be necessary to fulfill different fitting criteria. The impacts on SMM through each prepayment factor were discussed in the previous numerical illustration.
14
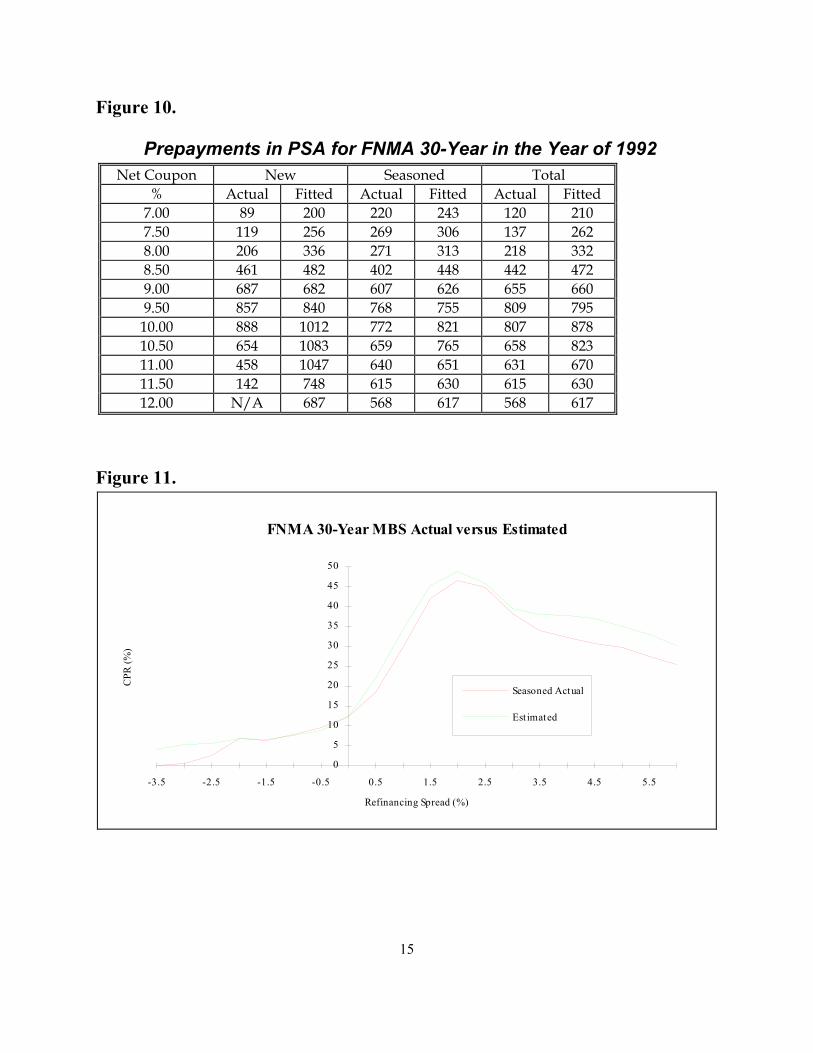
Figure 10.
Prepayments in PSA for FNMA 30-Year in the Year of 1992 Net Coupon New Seasoned Total
% Actual Fitted Actual Fitted Actual Fitted 7.00 89 200 220 243 120 210 7.50 119 256 269 306 137 262 8.00 206 336 271 313 218 332 8.50 461 482 402 448 442 472 9.00 687 682 607 626 655 660 9.50 857 840 768 755 809 795
10.00 888 1012 772 821 807 878 10.50 654 1083 659 765 658 823 11.00 458 1047 640 651 631 670 11.50 142 748 615 630 615 630 12.00 N/A 687 568 617 568 617
Figure 11.
FNMA 30-Year MBS Actual versus Estimated
Refinancing Spread (%)
CPR
(%)
0
5
10
15
20
25
30
35
40
45
50
-3.5 -2.5 -1.5 -0.5 0.5 1.5 2.5 3.5 4.5 5.5
Seasoned Actual
Estimated
15
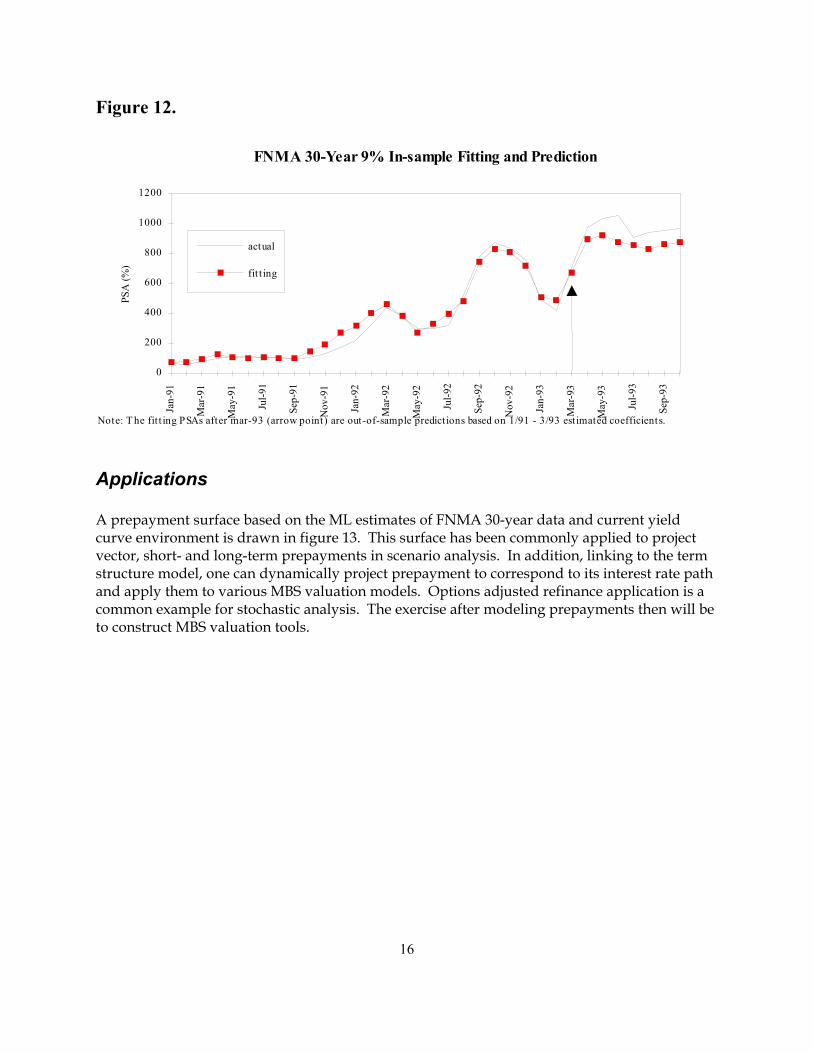
Figure 12.
FNMA 30-Year 9% In-sample Fitting and Prediction
PSA
(%)
0
200
400
600
800
1000
1200
Jan-
91
Mar
-91
May
-91
Jul-9
1
Sep-
91
Nov
-91
Jan-
92
Mar
-92
May
-92
Jul-9
2
Sep-
92
Nov
-92
Jan-
93
Mar
-93
May
-93
Jul-9
3
Sep-
93
actual
fit t ing
Note: T he fit t ing PSAs after mar-93 (arrow point) are out-of-sample predict ions based on 1/91 - 3/93 est imated coefficients.
Applications A prepayment surface based on the ML estimates of FNMA 30-year data and current yield curve environment is drawn in figure 13. This surface has been commonly applied to project vector, short- and long-term prepayments in scenario analysis. In addition, linking to the term structure model, one can dynamically project prepayment to correspond to its interest rate path and apply them to various MBS valuation models. Options adjusted refinance application is a common example for stochastic analysis. The exercise after modeling prepayments then will be to construct MBS valuation tools.
16
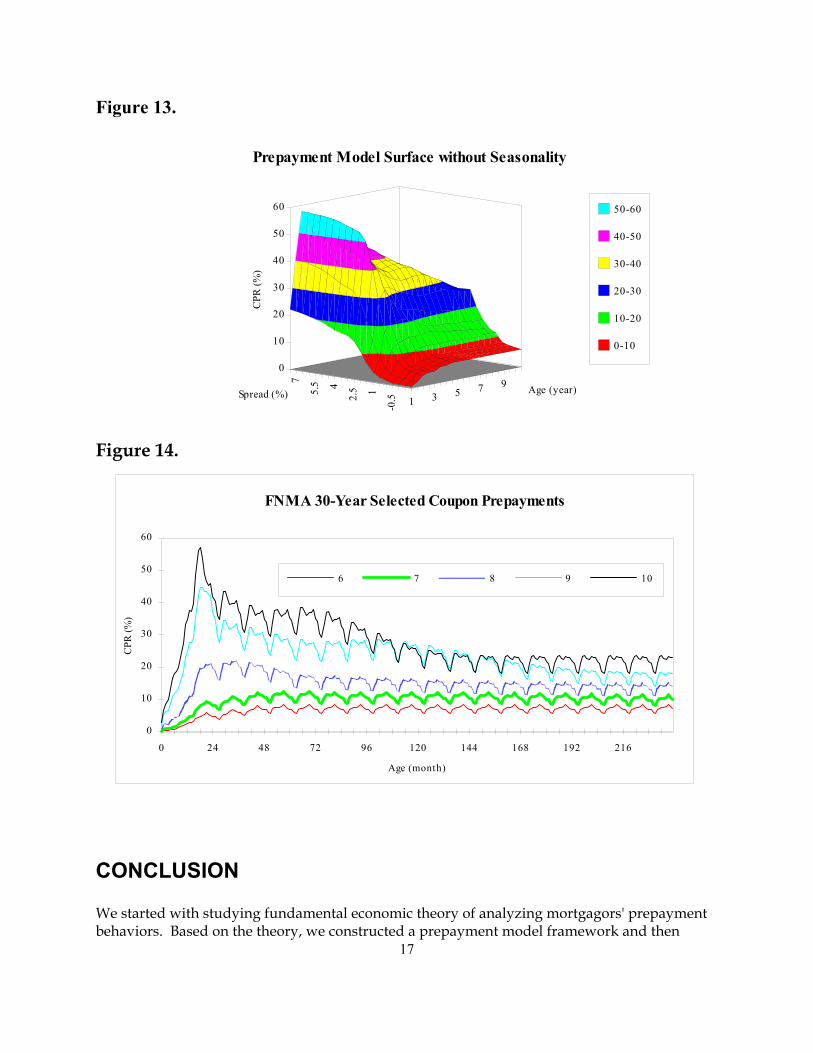
Figure 13.
1 3 5 7 9 Age (year)-0
.512.545.
57
Spread (%)
0
10
20
30
40
50
60
CPR
(%)
Prepayment Model Surface without Seasonality
50-60
40-50
30-40
20-30
10-20
0-10
Figure 14.
FNMA 30-Year Selected Coupon Prepayments
Age (month)
CPR
(%)
0
10
20
30
40
50
60
0 24 48 72 96 120 144 168 192 216
6 7 8 9 10
CONCLUSION
17
We started with studying fundamental economic theory of analyzing mortgagors' prepayment behaviors. Based on the theory, we constructed a prepayment model framework and then

empirically tested it. Linking to the term structure of interest rates, one can apply the model to a variety of applications such as scenario analysis, total rate of return, and options adjusted refinance.
In our model specification, we employ a multiplicative spline model to filter various prepayment factors. A cubic spline functional form is employed across the rate, age, and burnout factors. The innovative idea of synthetic factor, which only accumulates in-the-money part of prepayment rates since issuance, captures the burnout. The yield curve factor, which exploits the information of Treasuries 5- and 10-years, enables us to measure relative opportunity of different maturities. The empirical results of in-sample fitting and out-of-sample forecasting support our belief of the model specification. Nevertheless, tuning on coefficients to fulfill different fitting purpose can be useful.
Modeling prepayments can be a never ending job since more data and new innovative mortgage instruments may provide us more information about mortgagor's prepayment decision. Periodical updating of the coefficients would be necessary. Based on our findings and innovations, we merely try to shed a light on prepayment behaviors.
18

APPENDIX
I. Model Specification
The model per se employs cubic spline functions over a variety of variables. Let Single Monthly Mortality (SMM) be formulated as follows:
[CPR] = [SP] ⋅ [AG] ⋅ [SN] ⋅ [BF] ⋅ [YC] ⋅ [FE] ⋅ [IY]
where BF: Burnout factor SP: Refinance factor, prepayments from the cumulated in-the-money call options. AG: Age factor from premium coupon part SN: Seasonal factor from premium coupon part YC: Yield curve factor, prepayments due to cross maturity incentive FE: Financing Expense Component. IY: Issue Year Component
Age Factor: AG = AG(k) is a spline function of age k.
Seasonal Factor: SN = SNj is a constant coefficient on the j_th month of the year
Refinance Factor: SP = SP(x) is a cubic spline function of refinance x.
where x is the ratio refinance of the underlying mortgage rate over a lagged prevailing 30-year mortgage rate multiplied by 10.
Curve Factor YC = YC(xc) is a spline function of refinance xc.
where xc is the refinance of WAC over two months lagged prevailing 15-year mortgage rate the 15-year mortgage rate takes [x + (tsy10-tsy5)] as the proxy.
Burnout Factor:
B = B(St) is a spline function of synthetic factor St.
19

where
St = ∏ Max(1-SMMi, 0) i 1
t
=
S0= 1
II: DEFINITION OF THE CUBIC SPLINE FUNCTION
A function f(x) is a cubic spline function of x if it satisfies the follows:
f (x) AijMax(x d j , 1)ii 1
4
subject to f (d ) = f (d )
f ' (d ) = f ' (d )f "(d ) = f "(d )
j = 1,...,m
j j+1
j j+1
j j+1
= −=∑
∀
20

21
REFERENCES
Carron, Andrew S., E. Firestone, R. Gerber, G. Patruno, and W. Welch "Prepayment Models for Fixed and Adjustable Rate Mortgages", First Boston Fixed Income Research, August 1988.
Carron, Andrew S. "A Guide to Mortgage Prepayment Analysis: FHA, CPR, SMM, PSA", Shearson Lehman Brother Mortgage Finance Research, June 1985.
Chamberlain, Gary "Panel Data", Handbook of Econometrics, Vol II, Chapter 22, North Holland press
Edens, Lynn M., Harrison, Tim, and Wizon, Adam "The Impact of the Yield Curve on Mortgage Prepayment Rates", Goldman Sachs Mortgage Securities Research, August 1992
Kang, Pan and Zenios, Stavros A. "Complete Prepayment Models for Mortgage-backed Securities", Management Science, Vol. 38, No. 11, November 1992.
Lofaso, Anthony "UBS prepayment Model", November, 1992
Richard, Scott F. and Edens, Lynn M. "Prepayment and Valuation Modeling for Adjustable Rate Mortgage-backed Securities", Goldman Sachs Mortgage Securities Research, September 1990.
Richard, Scott F. and Roll, Richard "Modeling Prepayments on Fixed Rate Mortgage-Backed Securities", Goldman Sachs Mortgage Research, September, 1988
Schorin, Charles N. "Modeling and Projecting MBS prepayments" The Handbook of Mortgage-backed Securities (Editor: Frank J. Fabozzi), 3rd edition, Chapter 10, Probus Publishing Company, 1992.
Schwartz, Eduardo S. and Torous, Walter N. "Prepayment and the Valuation of Mortgage-backed Securities", The Journal of Finance, Vol. XLIV, No. 2, June 1989.


![[Bank of America] Prepayments on Agency Hybrid ARM MBS](https://img.pdfslide.net/doc/110x75/577d38c61a28ab3a6b9877d9/bank-of-america-prepayments-on-agency-hybrid-arm-mbs.jpg)