Embed Size (px)
Citation preview
Modeling framework for estimation of regional CO2 fluxes using
concentration measurements from a ring of towers
Modeling framework for estimation of regional CO2 fluxes using
concentration measurements from a ring of towers
Marek Uliasz and Scott DenningDepartment of Atmospheric Science
Colorado State University
Marek Uliasz and Scott DenningDepartment of Atmospheric Science
Colorado State University
Ninth Symposium on Integrated Observing and Assimilation Systems for the Atmosphere, Oceans, and Land Surface - 2005 AMS Annual Meeting9-13 January, 2005, San Diego, California
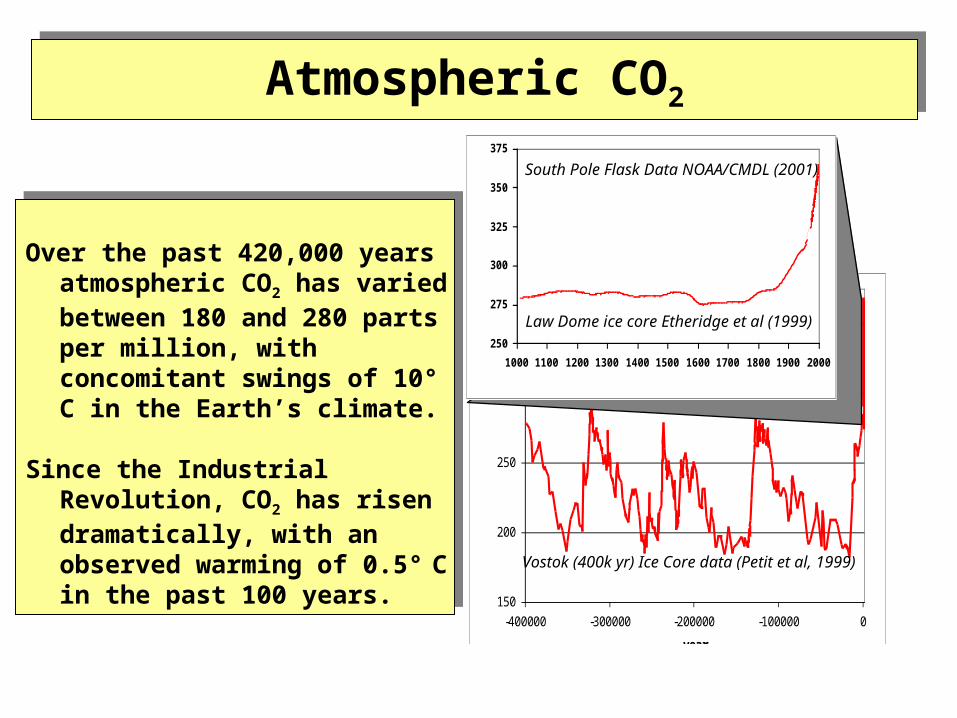
Over the past 420,000 years atmospheric CO2 has varied between 180 and 280 parts per million, with concomitant swings of 10° C in the Earth’s climate.
Since the Industrial Revolution, CO2 has risen dramatically, with an observed warming of 0.5° C in the past 100 years.
150
200
250
300
350
-400000 -300000 -200000 -100000 0
year
CO2 (ppm)
370 ppm
250
275
300
325
350
375
1000 1100 1200 1300 1400 1500 1600 1700 1800 1900 2000
Vostok (400k yr) Ice Core data (Petit et al, 1999)
Law Dome ice core Etheridge et al (1999)
South Pole Flask Data NOAA/CMDL (2001)
Atmospheric CO2Atmospheric CO2
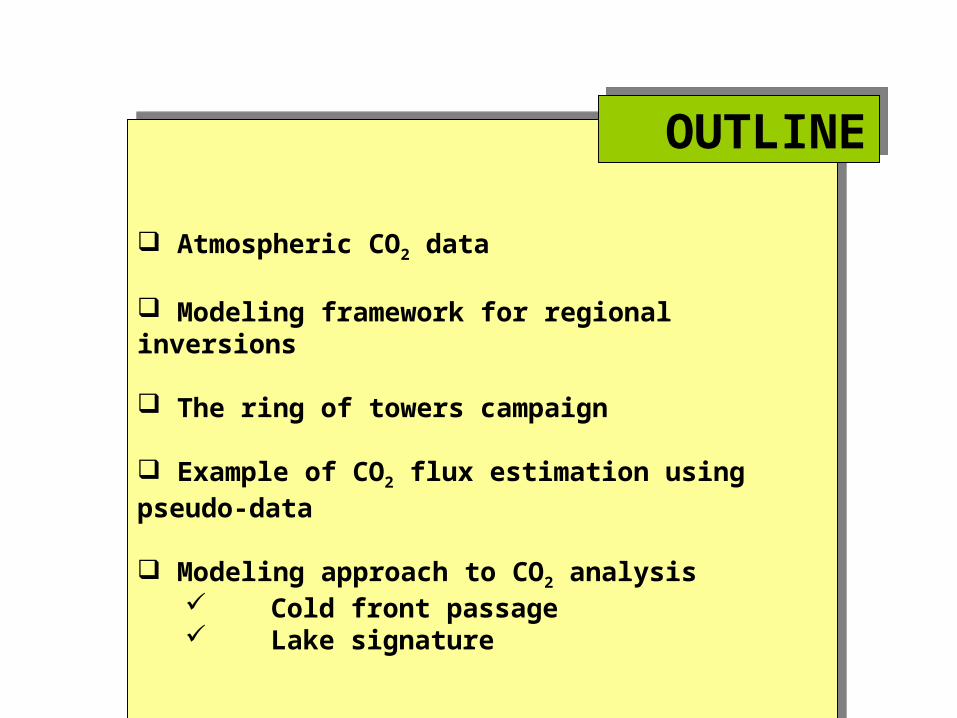
Atmospheric CO2 data
Modeling framework for regional inversions
The ring of towers campaign
Example of CO2 flux estimation using pseudo-data
Modeling approach to CO2 analysis Cold front passage Lake signature
Atmospheric CO2 data
Modeling framework for regional inversions
The ring of towers campaign
Example of CO2 flux estimation using pseudo-data
Modeling approach to CO2 analysis Cold front passage Lake signature
OUTLINE OUTLINE
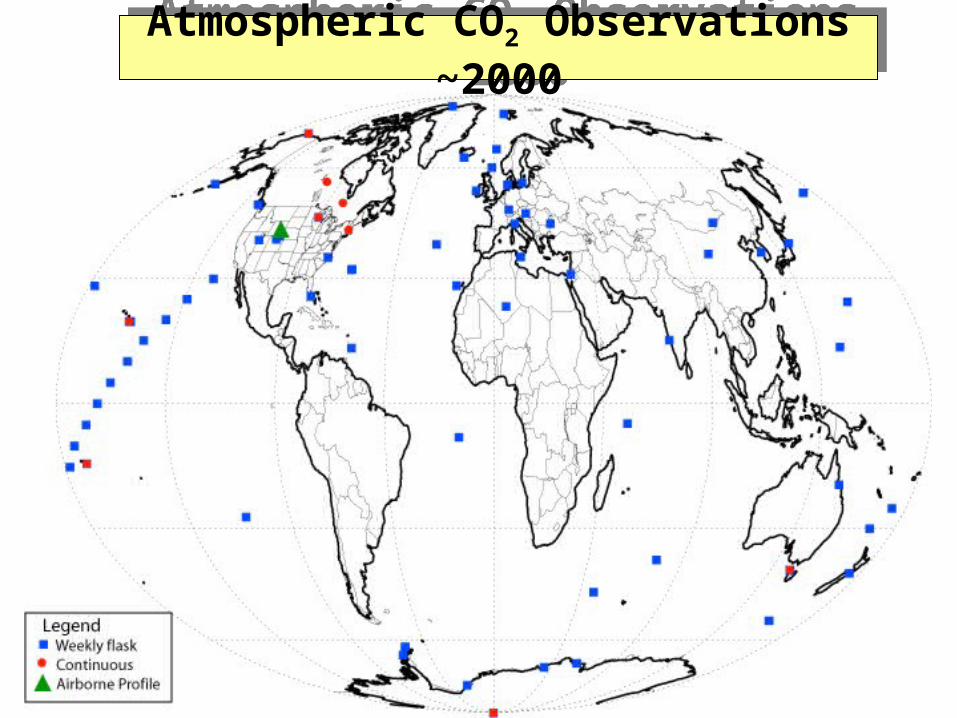
Atmospheric CO2 Observations ~2000Atmospheric CO2 Observations ~2000
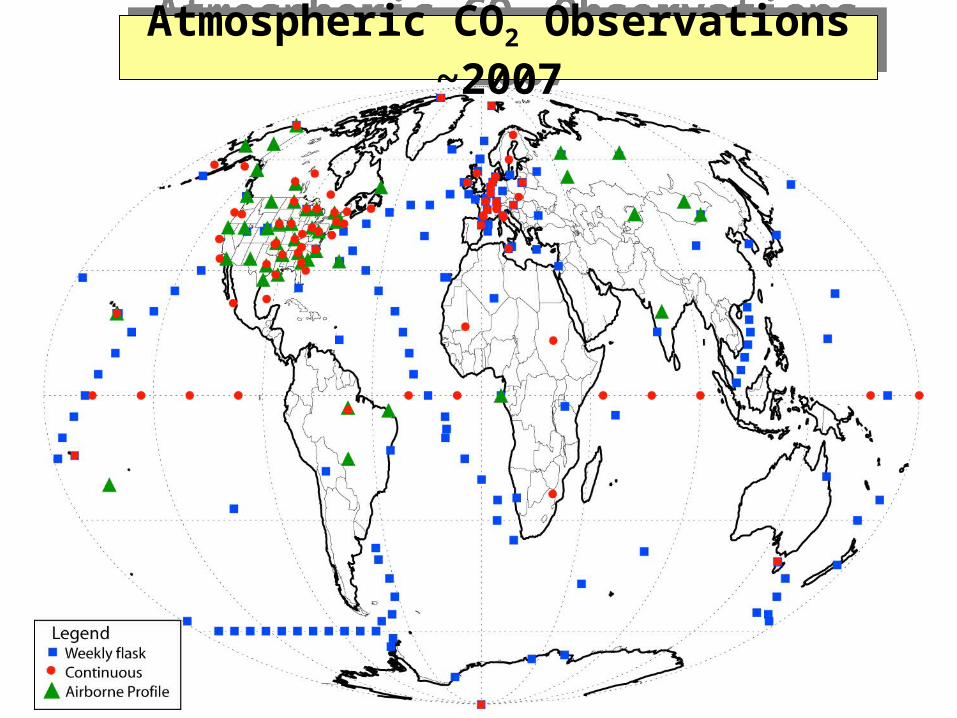
Atmospheric CO2 Observations ~2007Atmospheric CO2 Observations ~2007
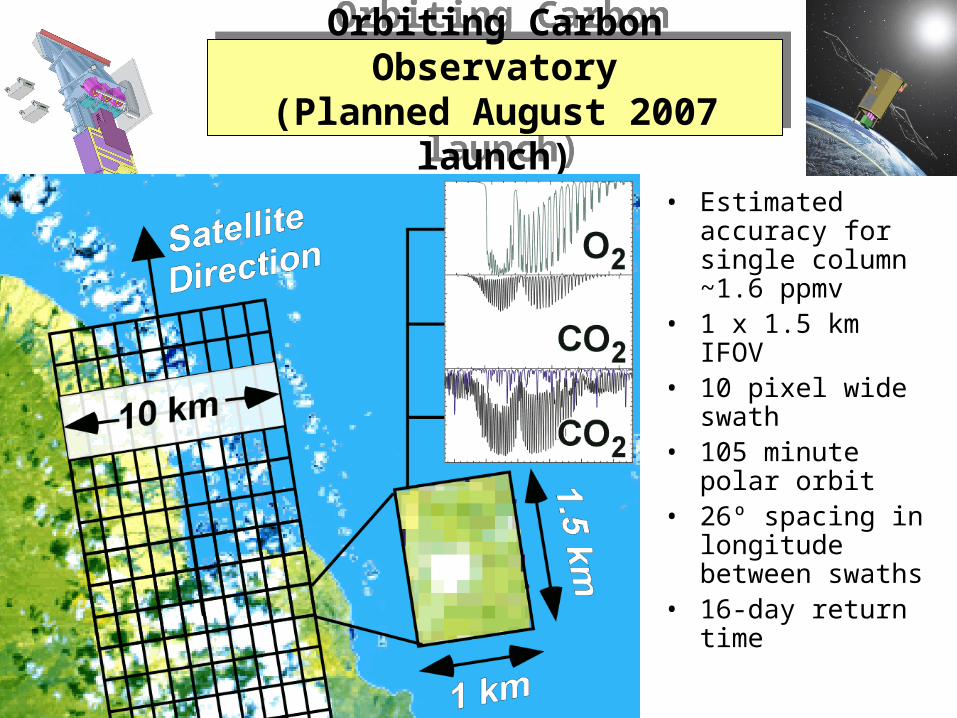
Orbiting Carbon Observatory(Planned August 2007 launch)Orbiting Carbon Observatory(Planned August 2007 launch)
• Estimated accuracy for single column ~1.6 ppmv
• 1 x 1.5 km IFOV• 10 pixel wide swath• 105 minute polar
orbit• 26º spacing in
longitude between swaths
• 16-day return time
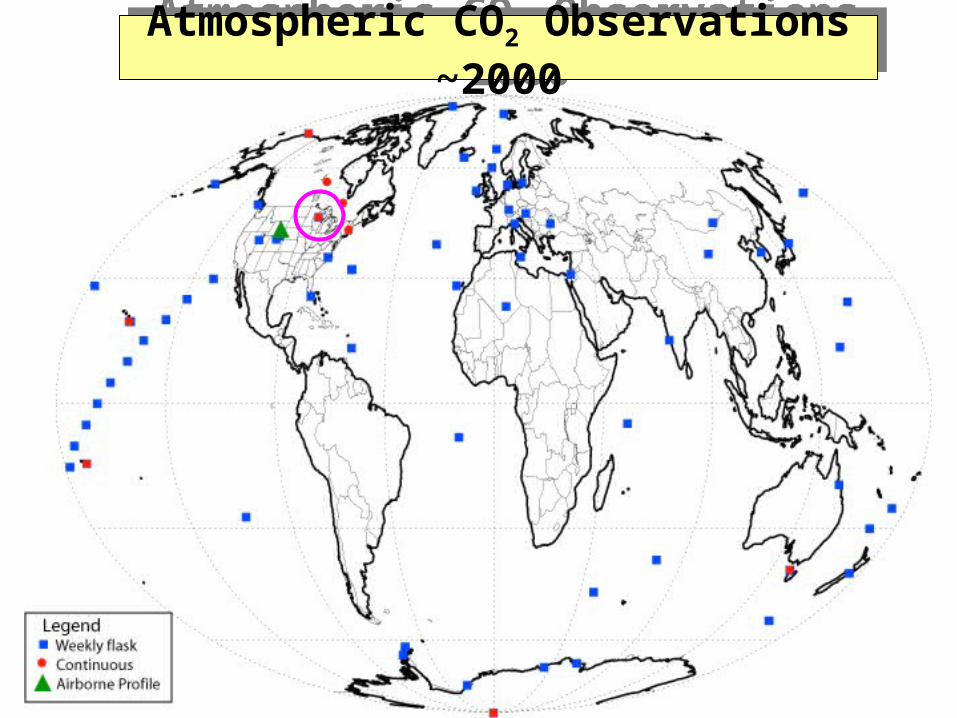
Atmospheric CO2 Observations ~2000Atmospheric CO2 Observations ~2000
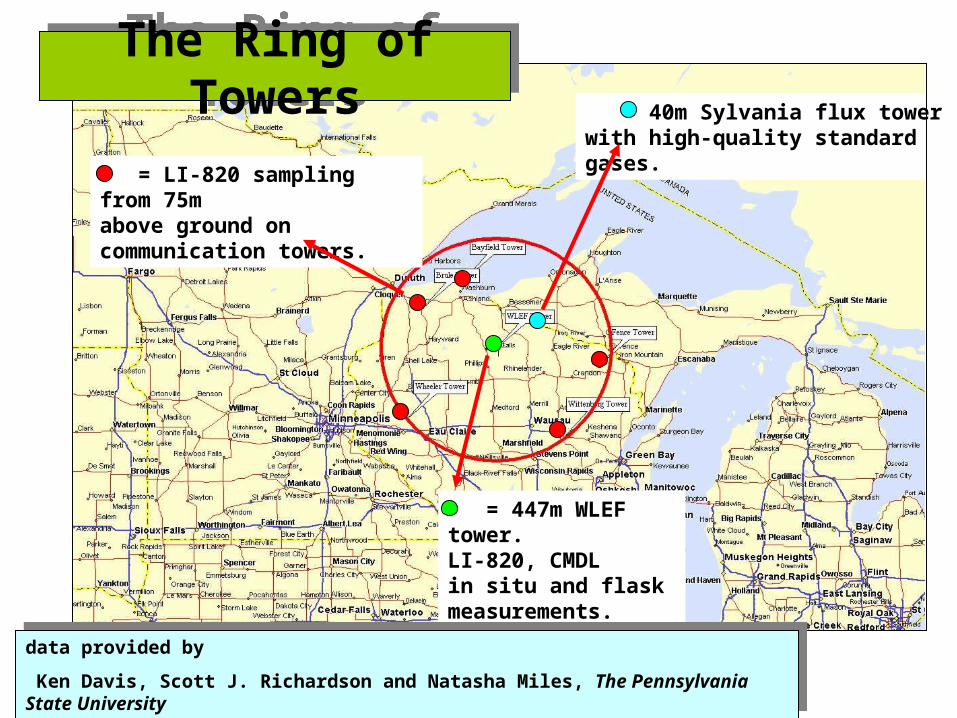
= LI-820 sampling from 75m above ground oncommunication towers.
= 40m Sylvania flux towerwith high-quality standardgases.
= 447m WLEF tower. LI-820, CMDLin situ and flaskmeasurements.
The Ring of Towers
The Ring of Towers
data provided by
Ken Davis, Scott J. Richardson and Natasha Miles, The Pennsylvania State University
data provided by
Ken Davis, Scott J. Richardson and Natasha Miles, The Pennsylvania State University
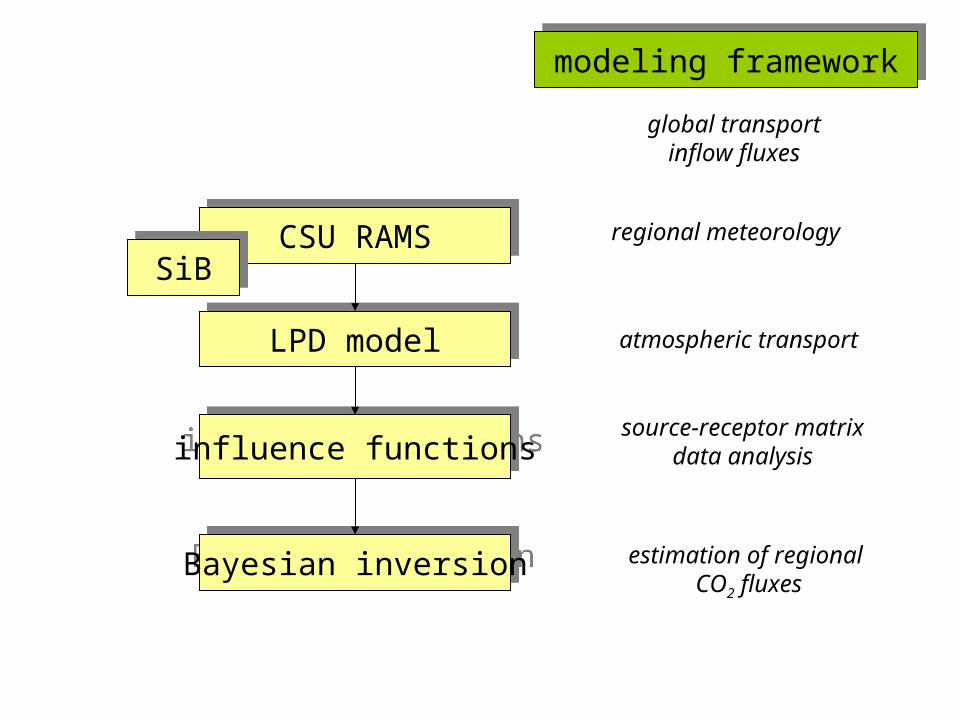
CSU RAMSCSU RAMS
LPD modelLPD model
influence functionsinfluence functions
Bayesian inversionBayesian inversion
modeling frameworkmodeling framework
regional meteorology
atmospheric transport
source-receptor matrixdata analysis
estimation of regional CO2 fluxes
global transportinflow fluxes
SiBSiB
CSU RAMSCSU RAMS
LPD modelLPD model
influence functionsinfluence functions
Bayesian inversionBayesian inversion
modeling frameworkmodeling framework
regional meteorology
atmospheric transport
source-receptor matrixdata analysis
estimation of regional CO2 fluxes
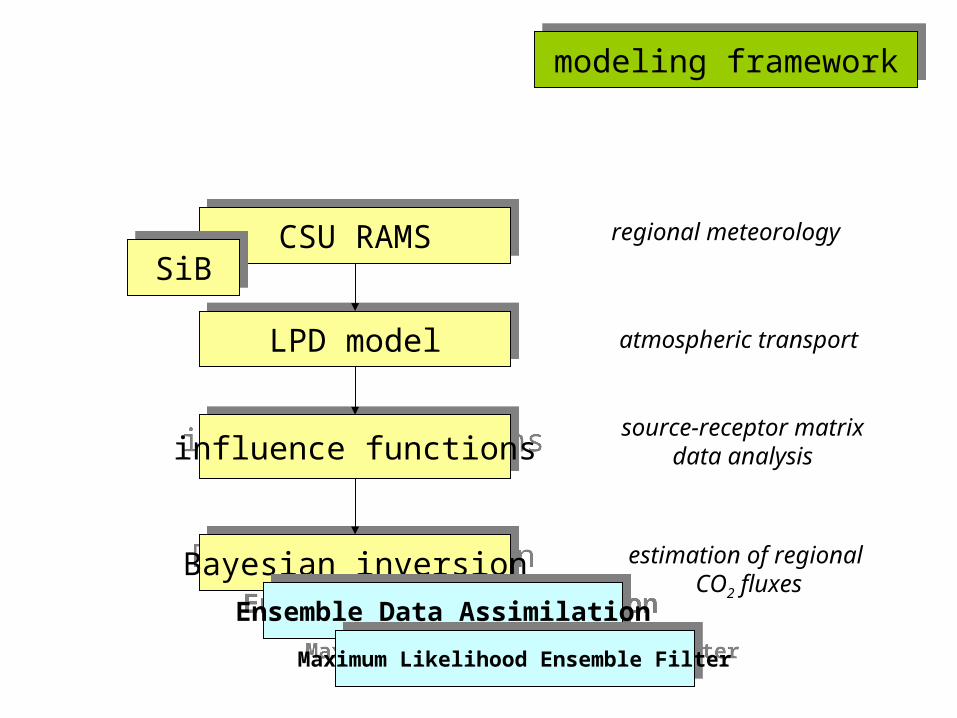
SiBSiB
Ensemble Data AssimilationEnsemble Data Assimilation
Maximum Likelihood Ensemble FilterMaximum Likelihood Ensemble Filter
CSU RAMSCSU RAMS
LPD modelLPD model
influence functionsinfluence functions
Bayesian inversionBayesian inversion
modeling frameworkmodeling framework
regional meteorology
atmospheric transport
source-receptor matrixdata analysis
estimation of regional CO2 fluxes
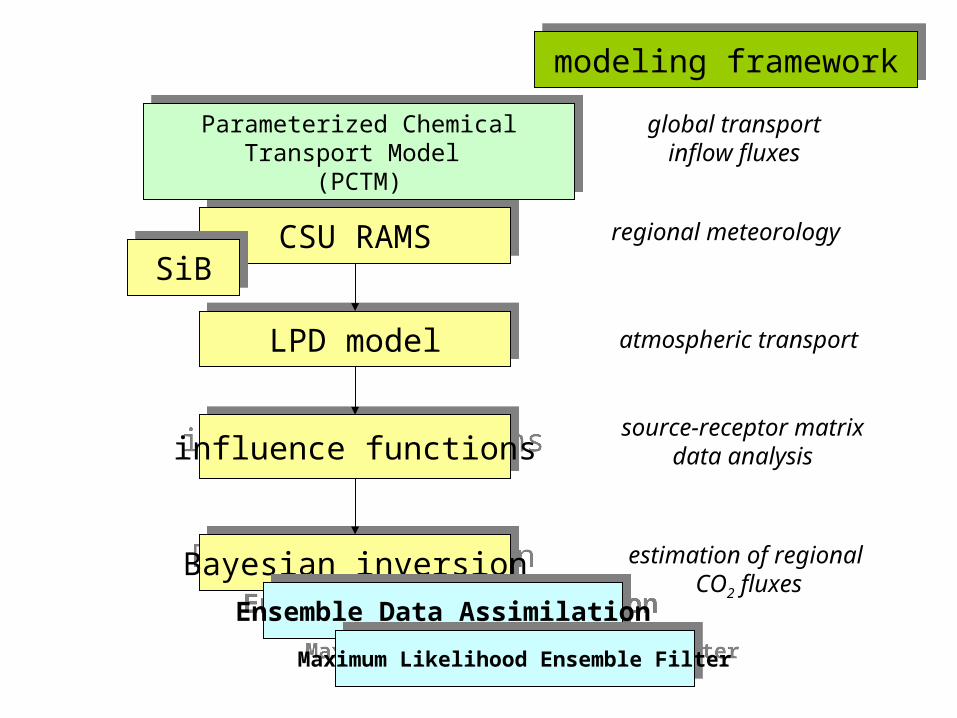
Parameterized Chemical Transport Model (PCTM)
Parameterized Chemical Transport Model (PCTM)
global transportinflow fluxes
SiBSiB
Ensemble Data AssimilationEnsemble Data Assimilation
Maximum Likelihood Ensemble FilterMaximum Likelihood Ensemble Filter
200 400 600 800 1000
x [km]
200
400
600
800
1000
y [km]
WLEF tower - single level (76m)
200 400 600 800 1000
x [km]
200
400
600
800
1000
WLEF tower - all levels
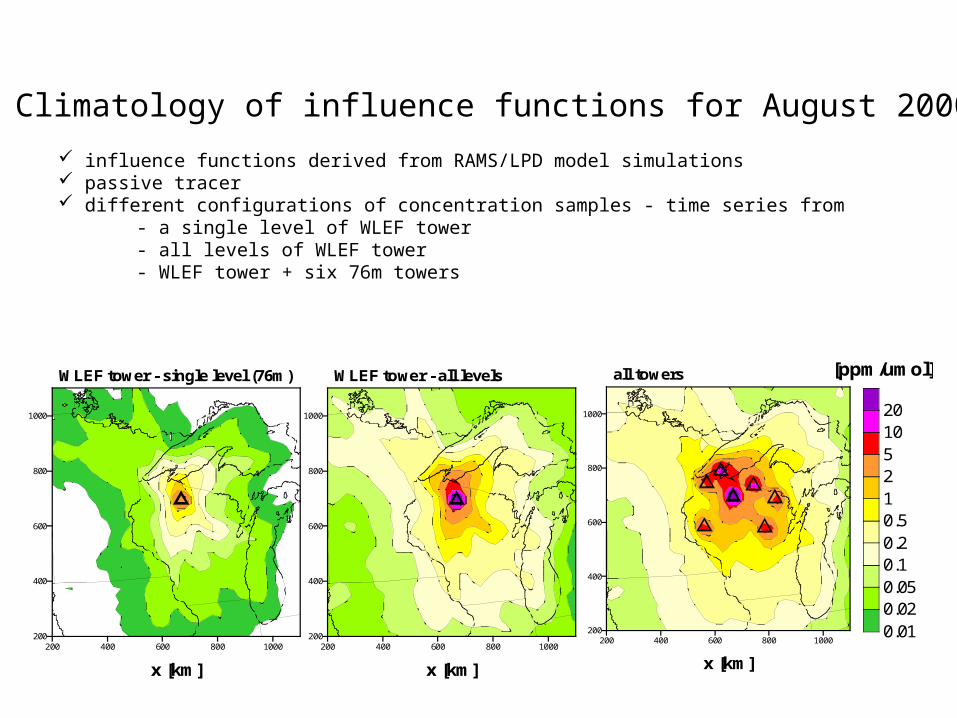
Climatology of influence functions for August 2000
influence functions derived from RAMS/LPD model simulations passive tracer different configurations of concentration samples - time series from - a single level of WLEF tower - all levels of WLEF tower - WLEF tower + six 76m towers
200 400 600 800 1000
x [km]
200
400
600
800
1000
all towers
0.010.020.050.10.20.51251020
[ppm/umol]
0 300 600 900 1200
0
300
600
900
1200 N
E
S
W
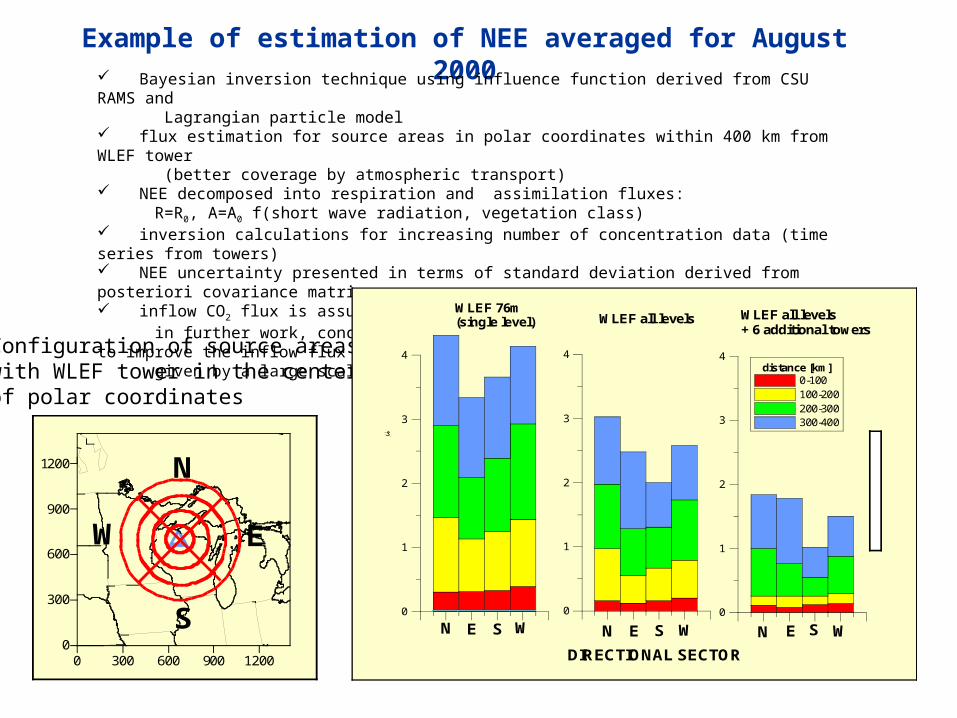
Configuration of source areaswith WLEF tower in the centerof polar coordinates
Example of estimation of NEE averaged for August 2000 Bayesian inversion technique using influence function derived from CSU RAMS and Lagrangian particle model flux estimation for source areas in polar coordinates within 400 km from WLEF tower (better coverage by atmospheric transport) NEE decomposed into respiration and assimilation fluxes: R=R0, A=A0 f(short wave radiation, vegetation class) inversion calculations for increasing number of concentration data (time series from towers) NEE uncertainty presented in terms of standard deviation derived from posteriori covariance matrix inflow CO2 flux is assumed to be known from a large scale transport model in further work, concentration data from additional tower will be used to improve the inflow flux given by a large scale model
0
1
2
3
4
0
1
2
3
4
a-priori NEE uncertainty
0
1
2
3
4
NEE estimation uncertainty [mol/s/m
2] distance [km]
0-100100-200200-300300-400
WLEF 76m(single level) WLEF all levels WLEF all levels
+ 6 additional towers
N N NE S W E S W E S W
DIRECTIONAL SECTOR
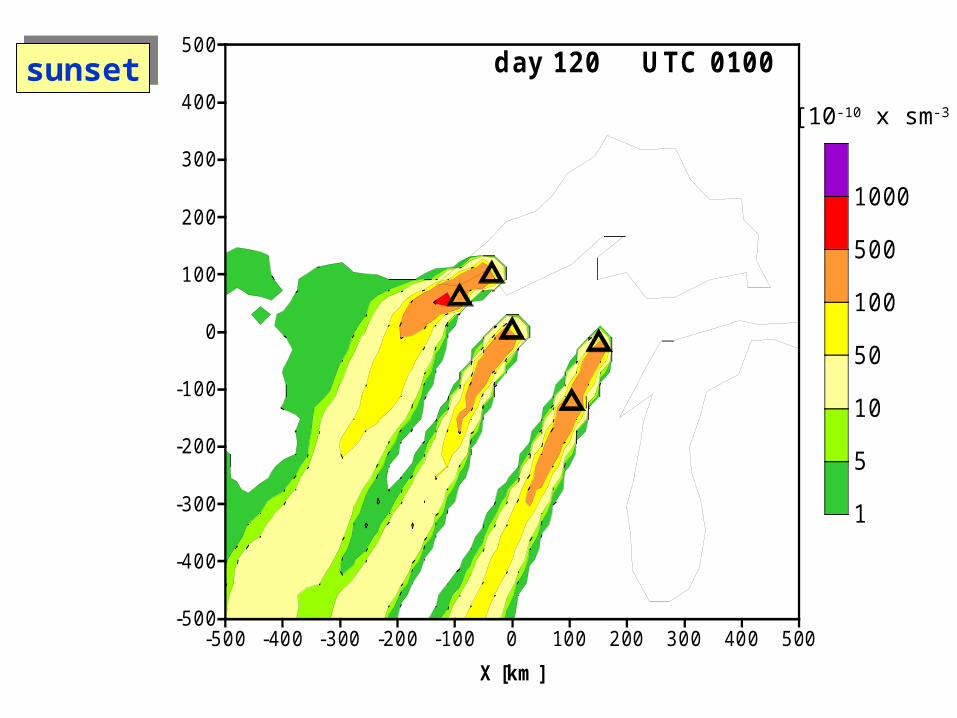
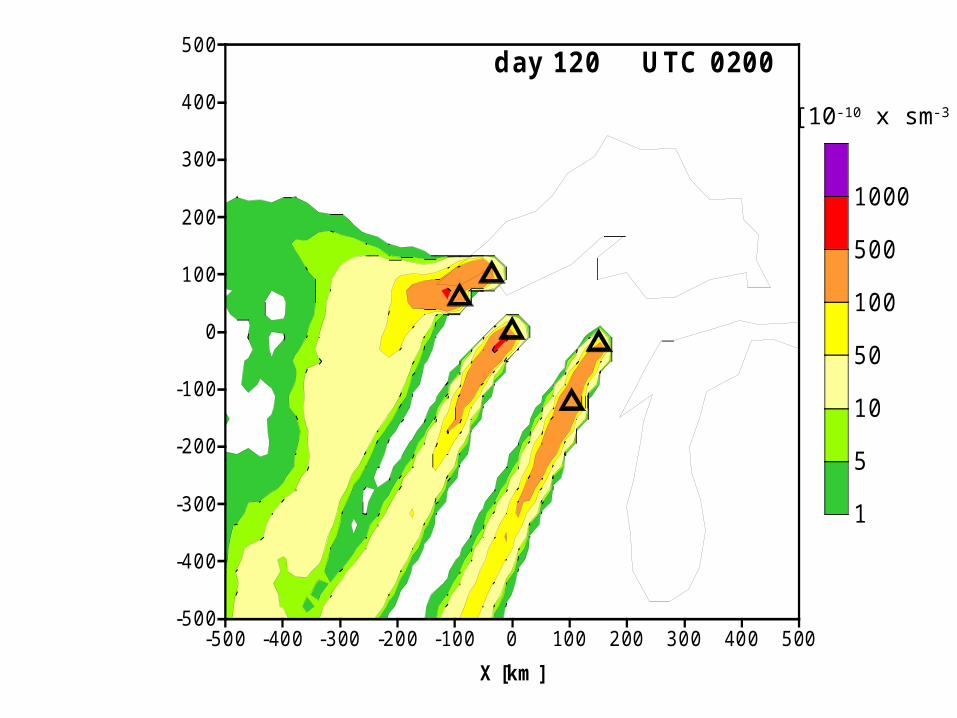
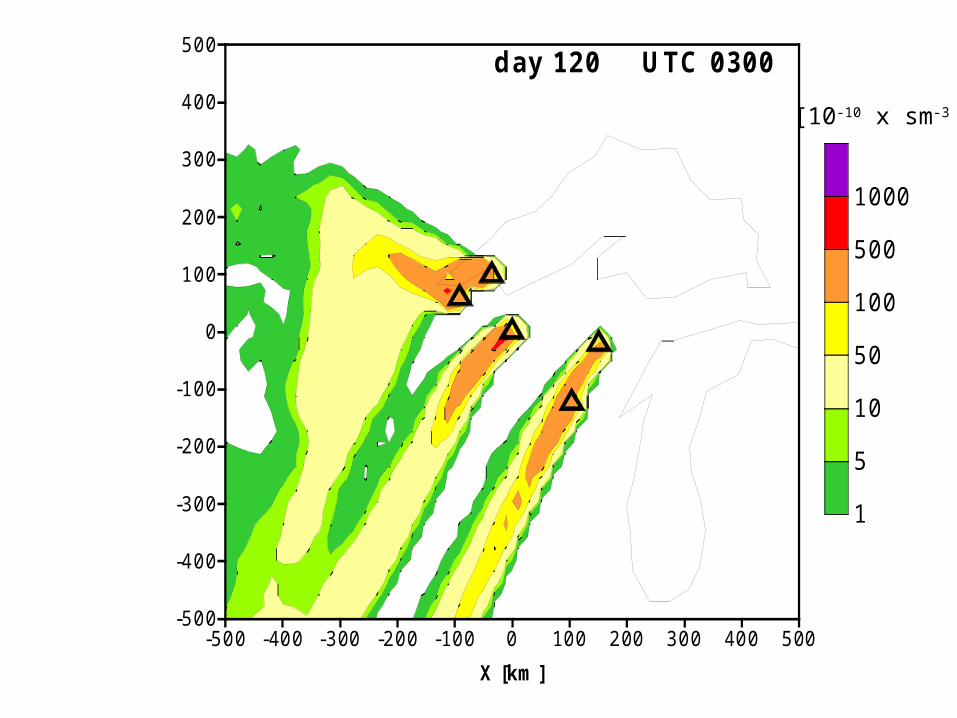
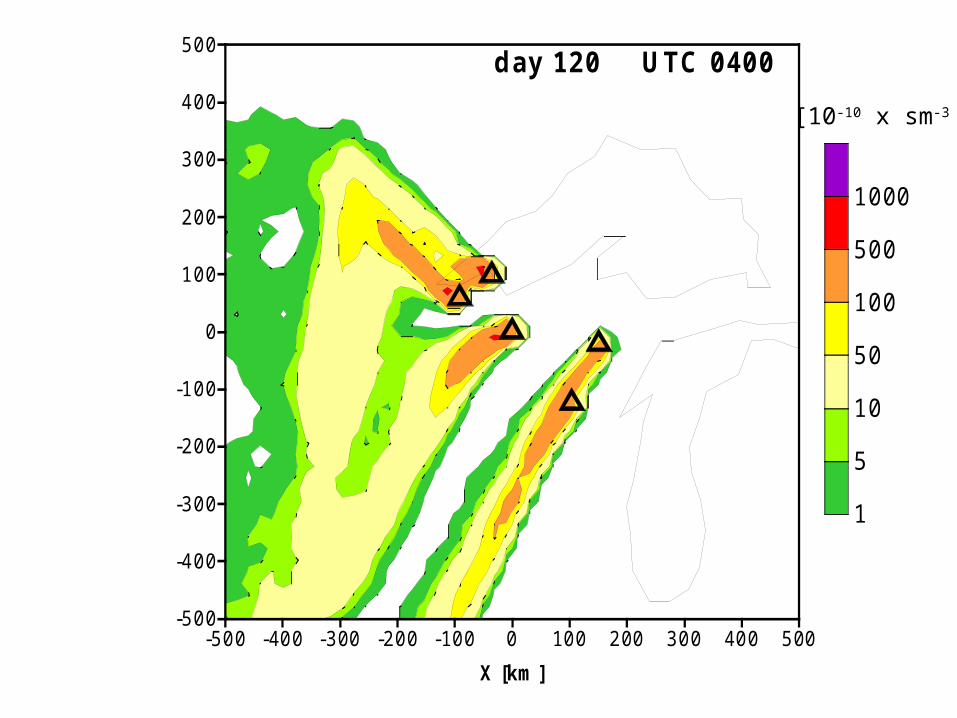
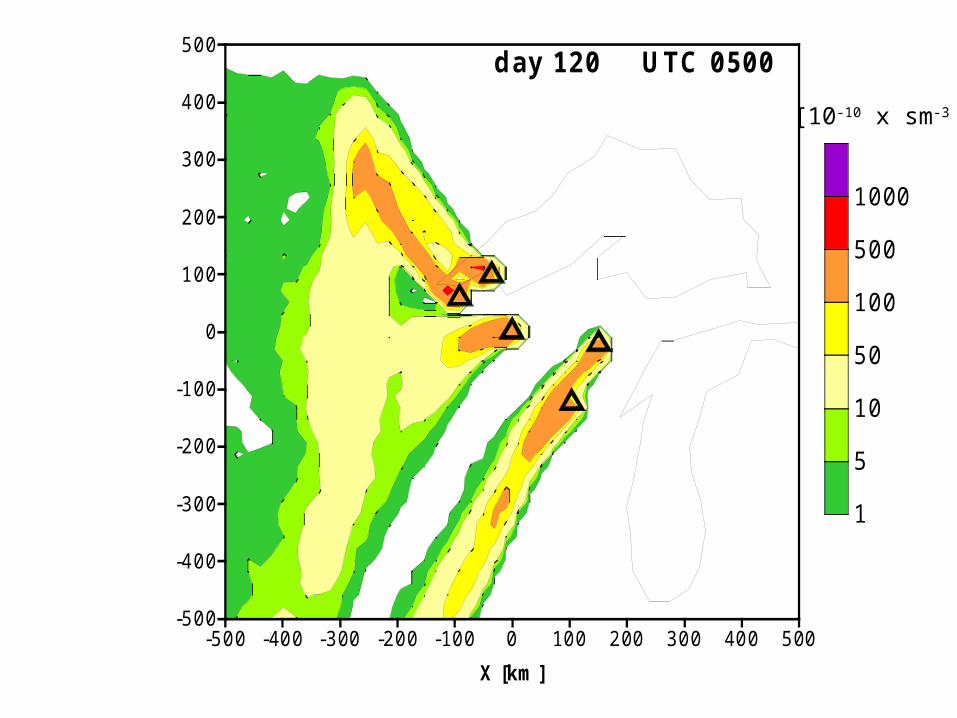
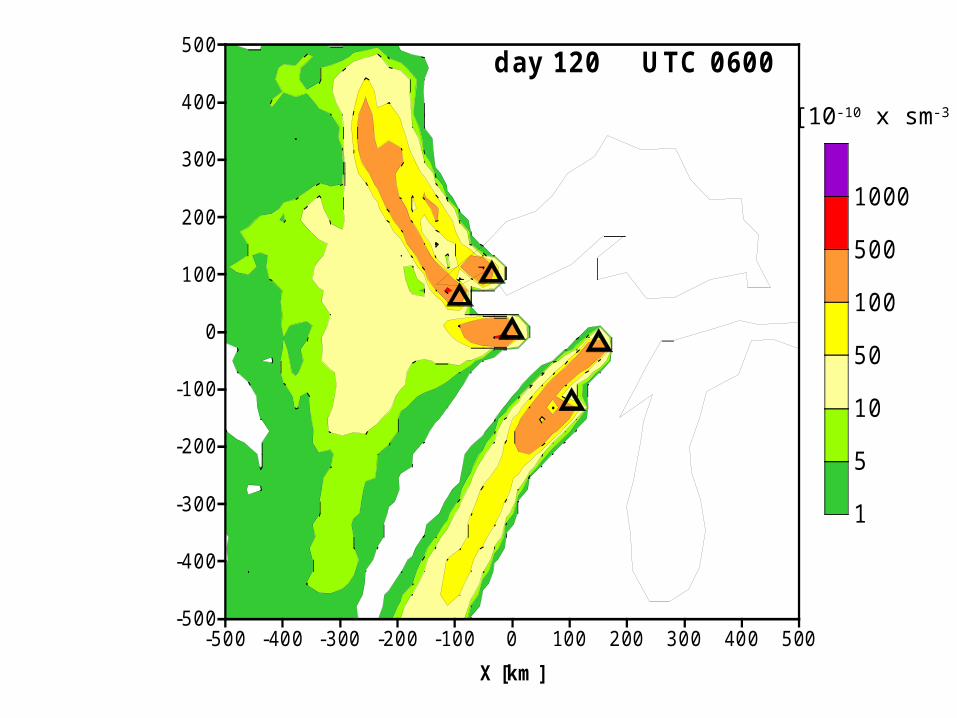
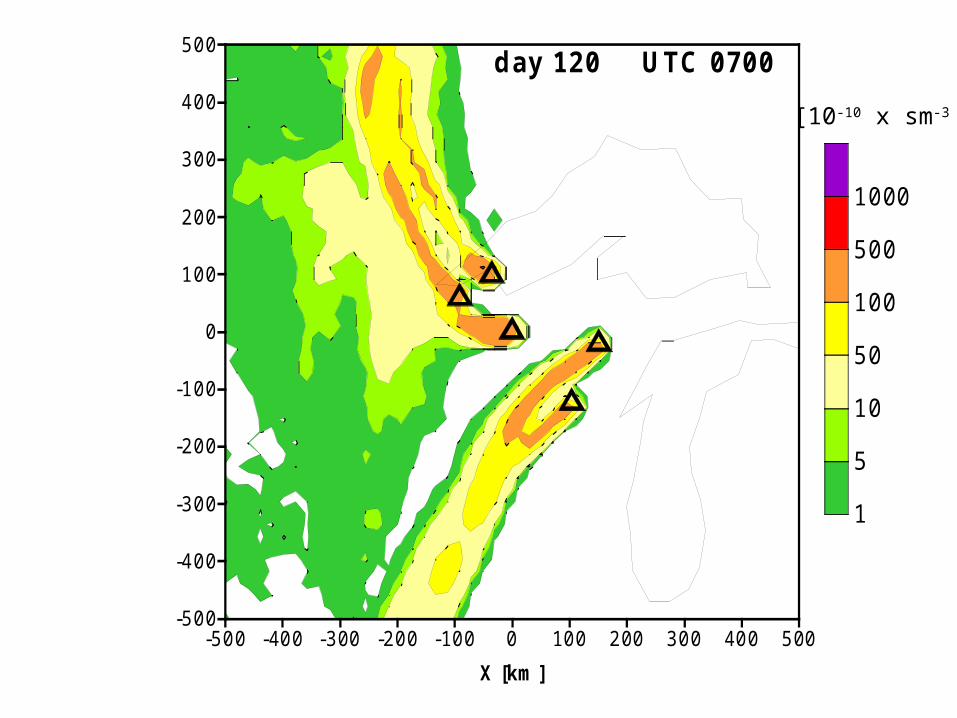
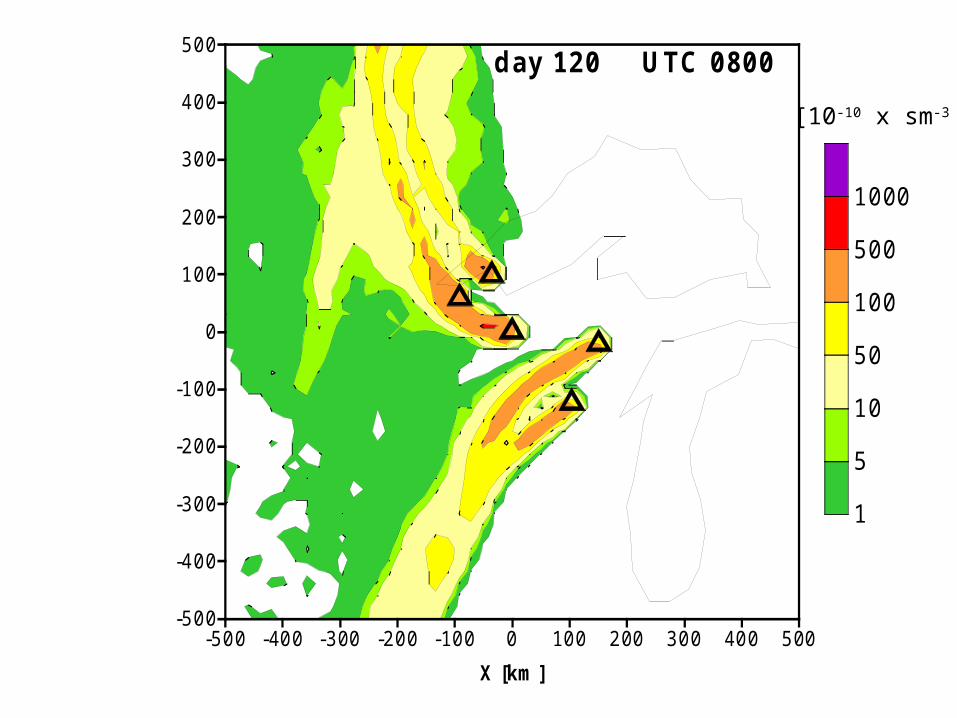
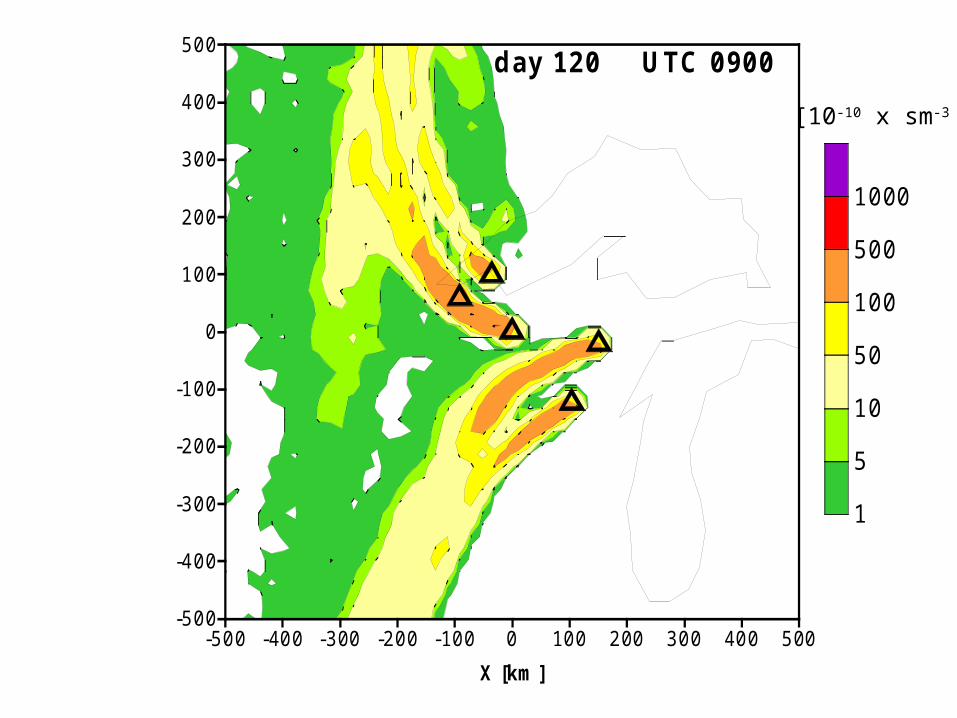
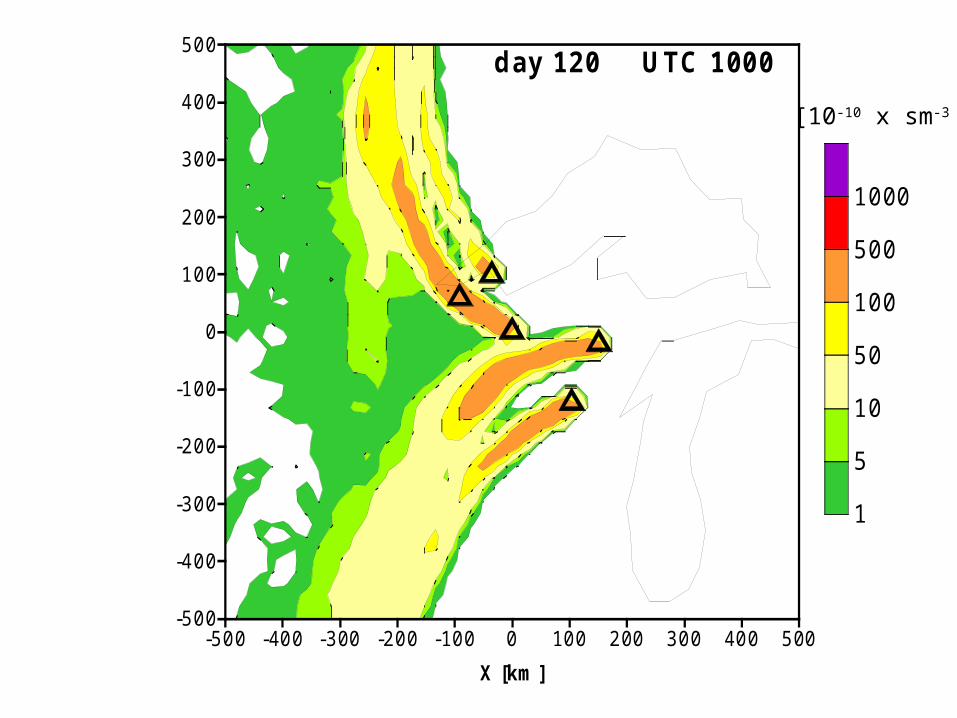
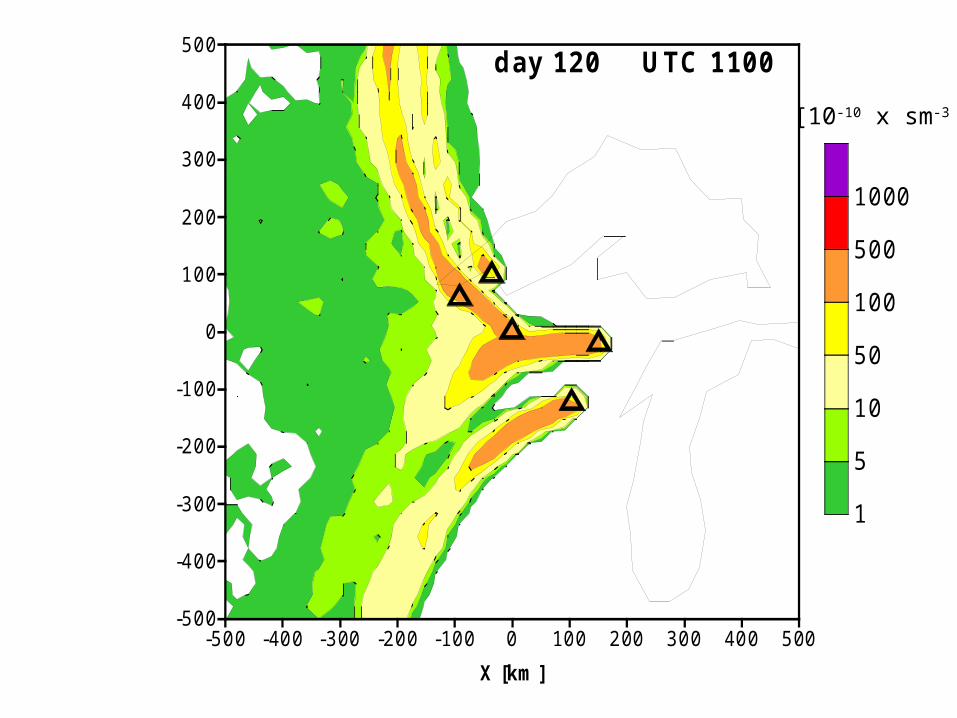
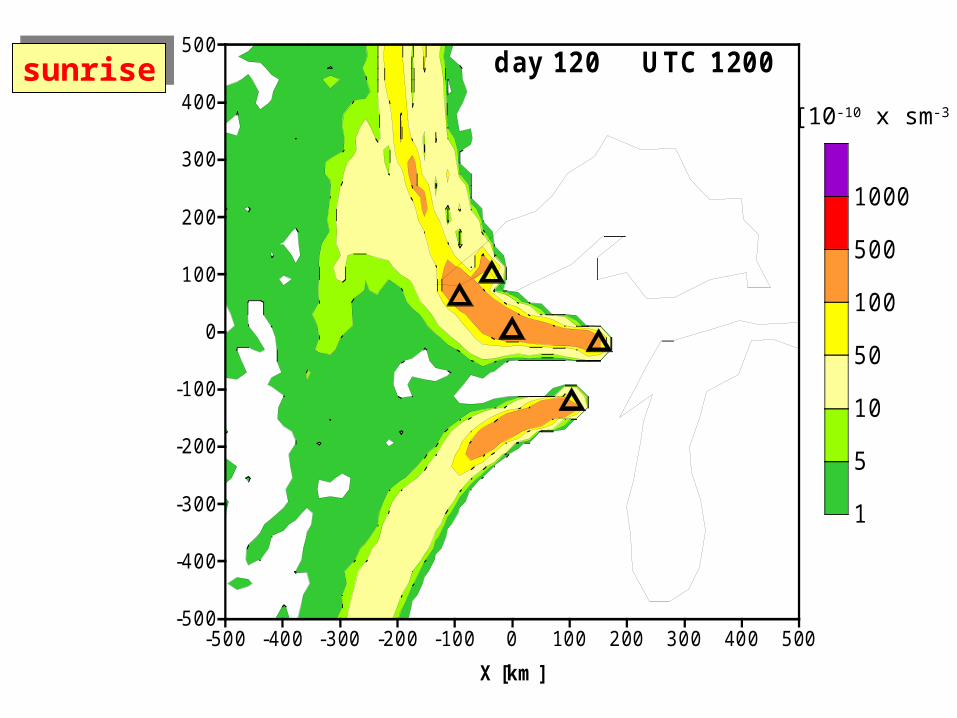
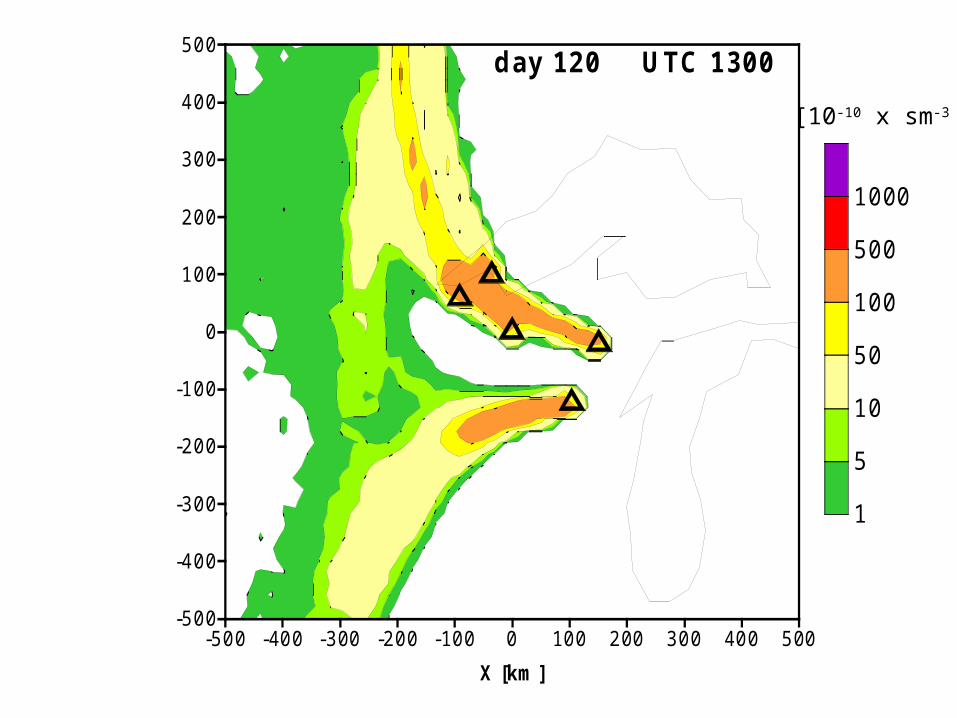
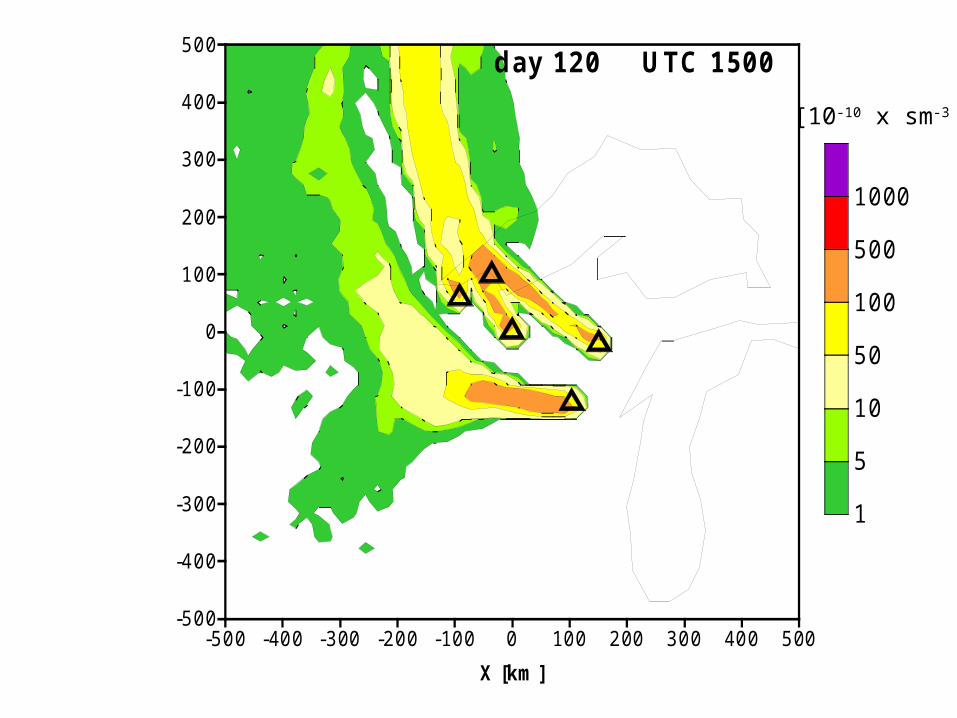
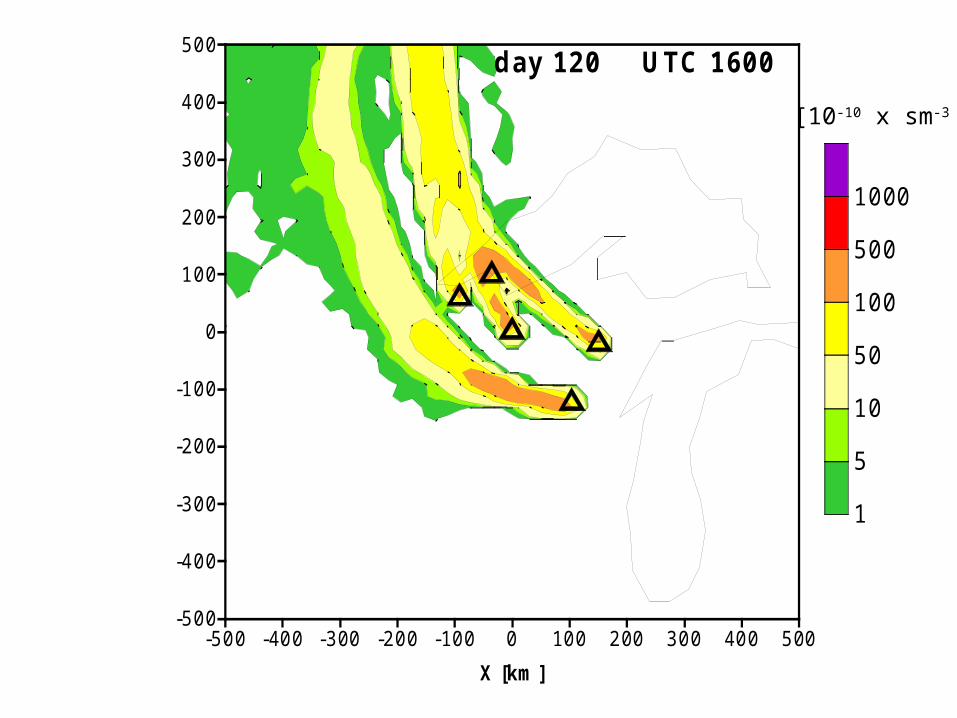
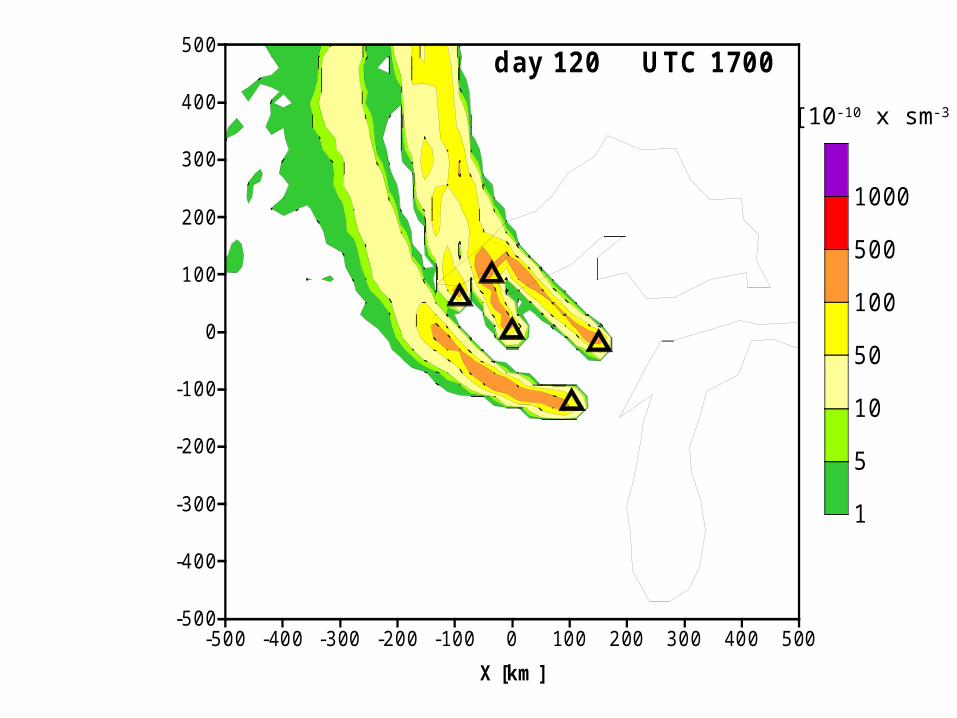
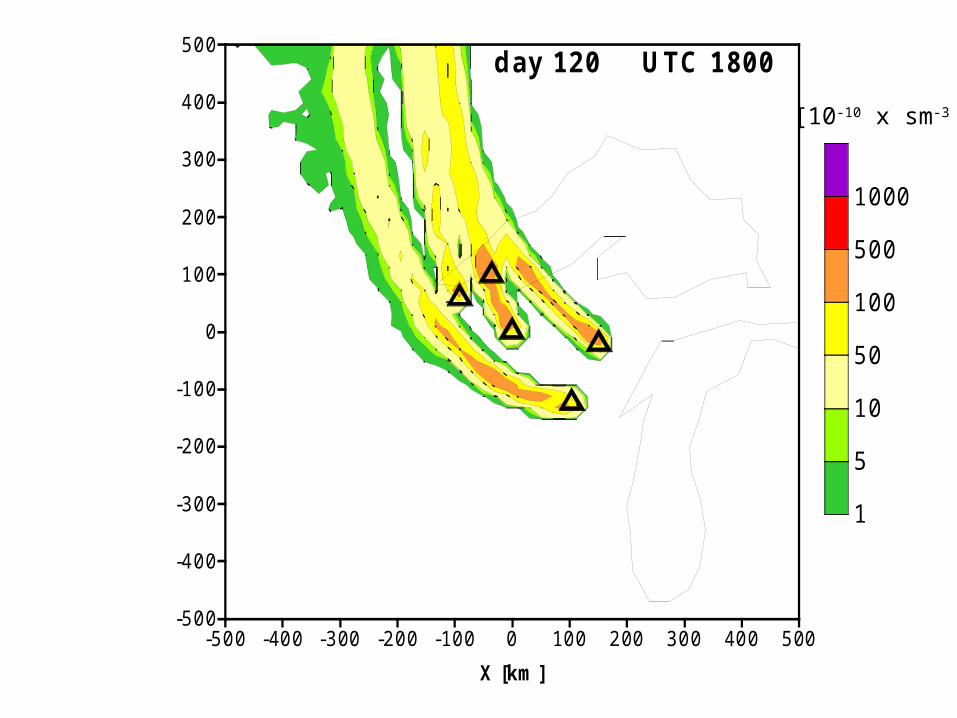
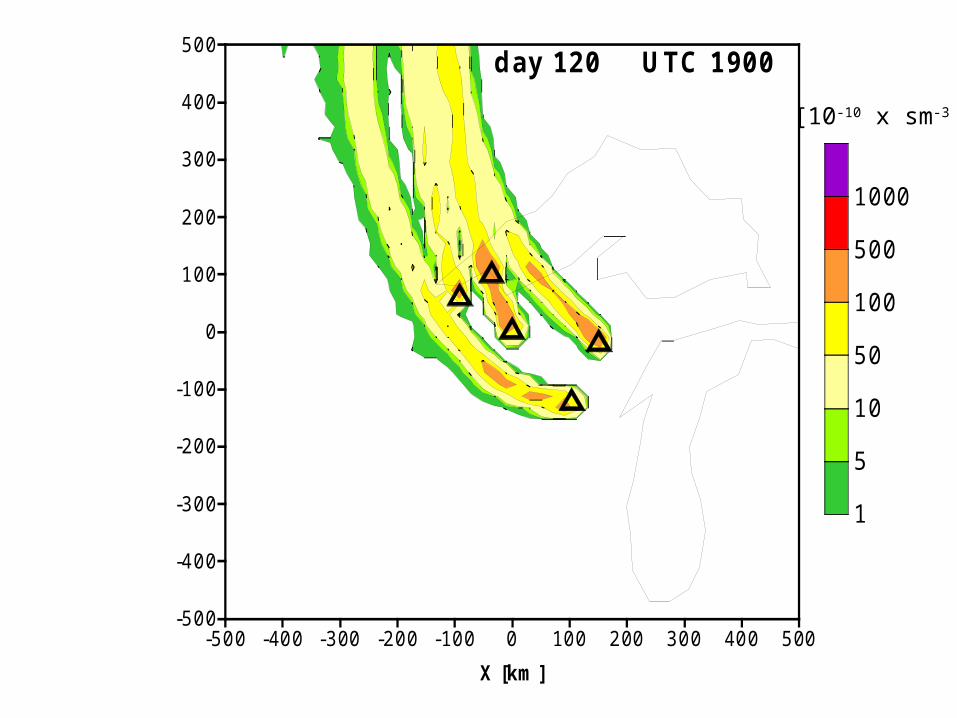
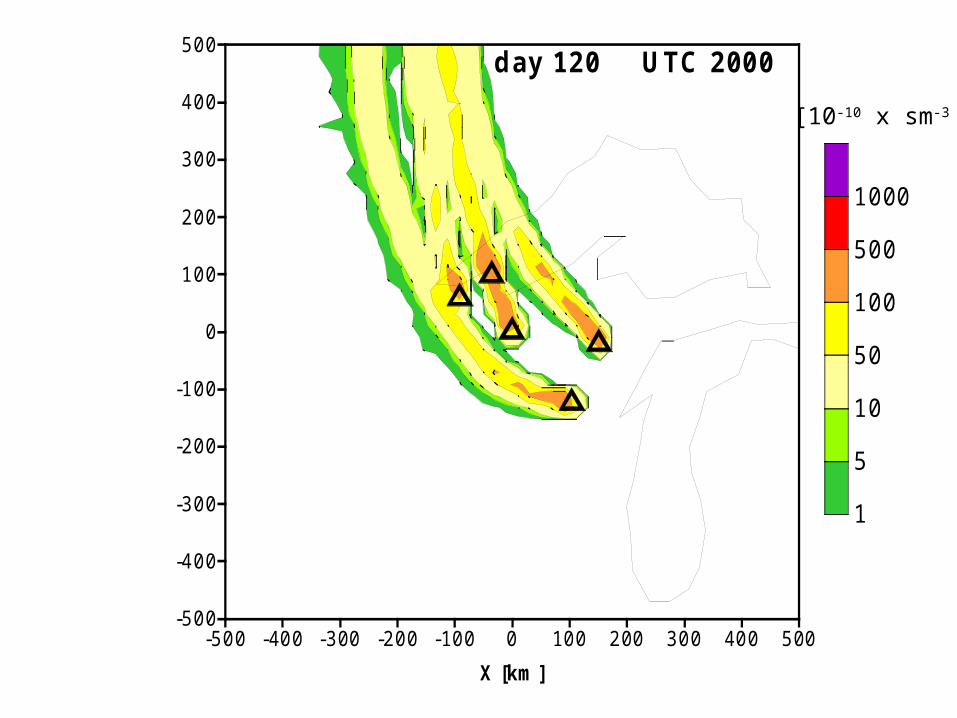
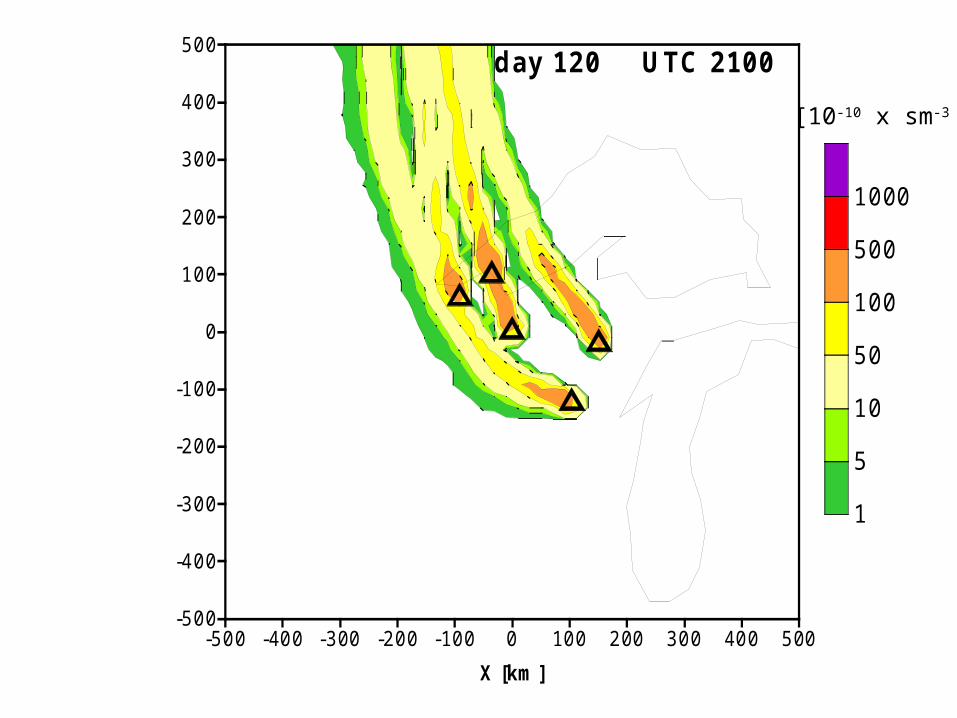
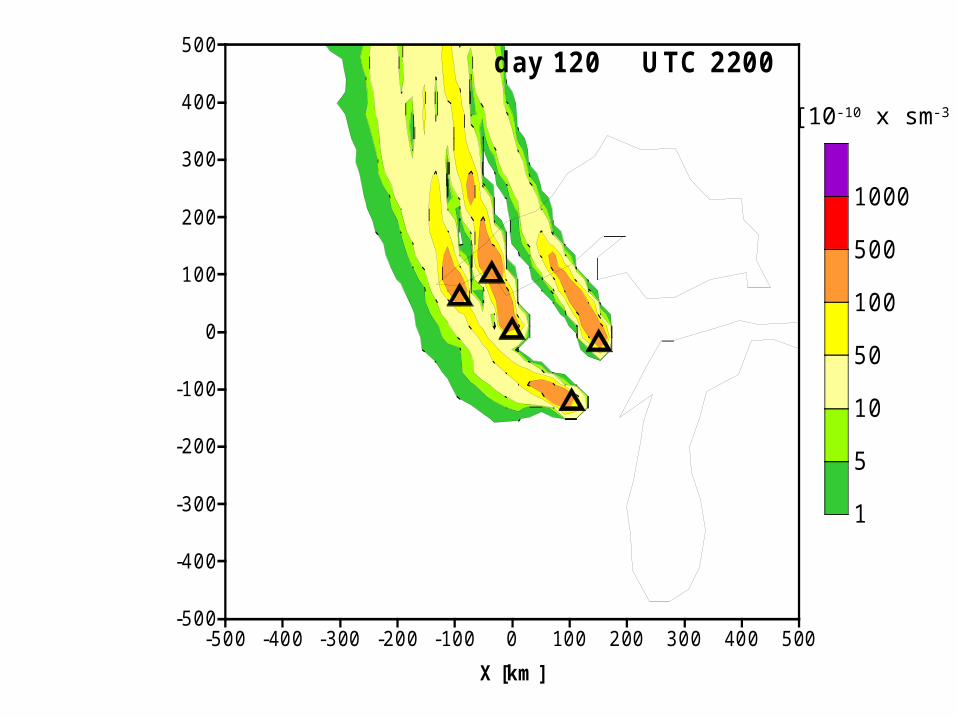
Cold front passage across the ringCold front passage across the ring
modeling approach to CO2 data analysismodeling approach to CO2 data analysis
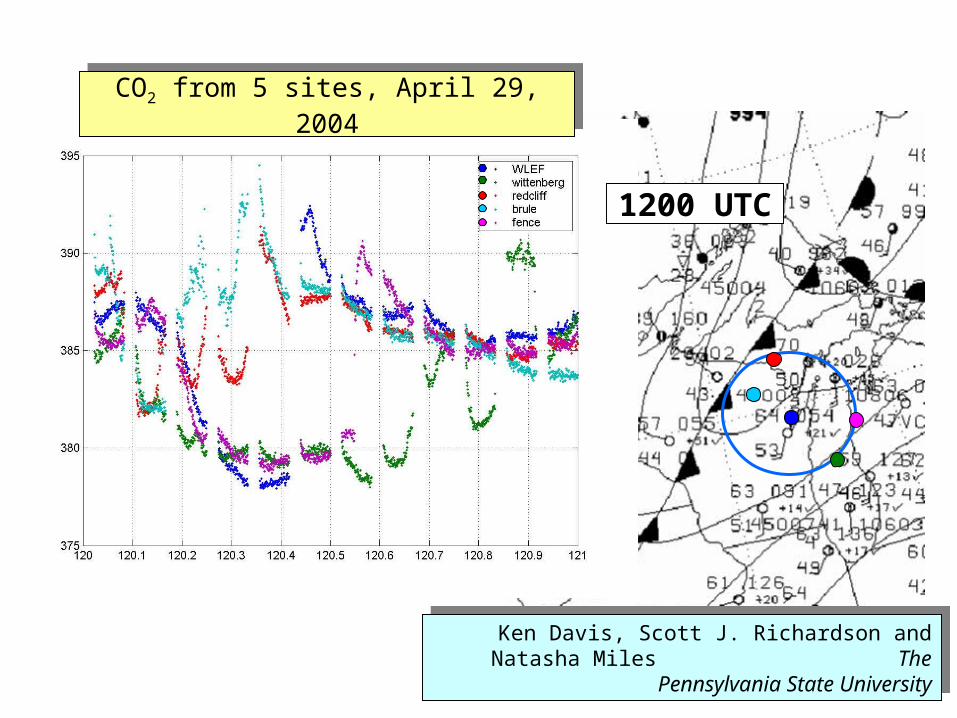
1200 UTC
CO2 from 5 sites, April 29, 2004CO2 from 5 sites, April 29, 2004
Ken Davis, Scott J. Richardson and Natasha Miles The Pennsylvania State
University
Ken Davis, Scott J. Richardson and Natasha Miles The Pennsylvania State
University
-500 -400 -300 -200 -100 0 100 200 300 400 500
X [km ]
-500
-400
-300
-200
-100
0
100
200
300
400
500
Y [km]
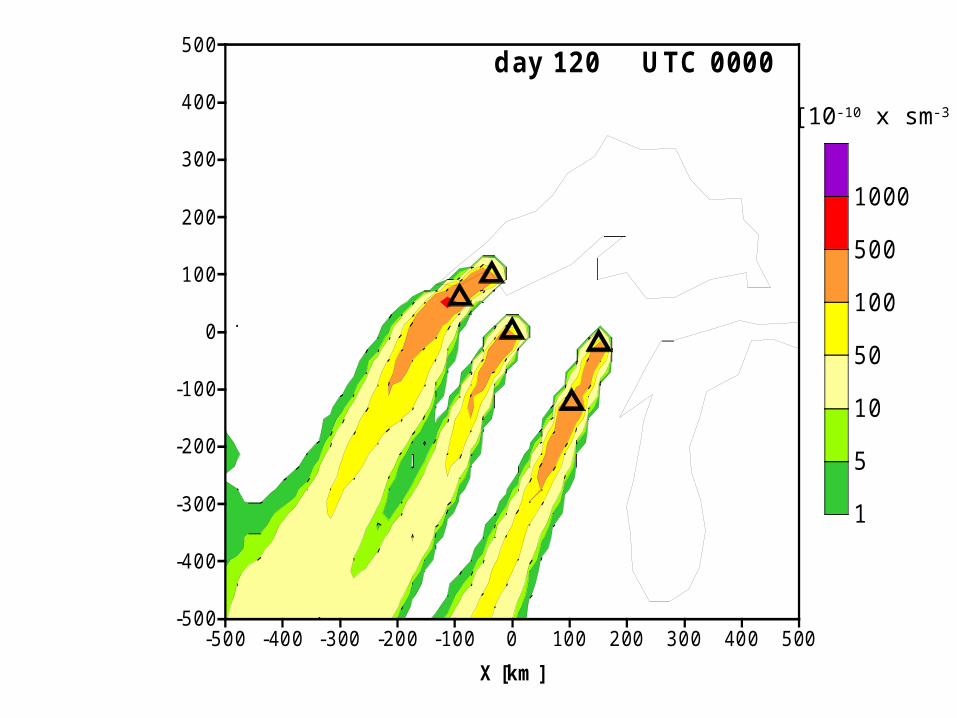
day 120 UTC 0000
1
5
10
50
100
500
1000
[10-10 x sm-3 ]
-500 -400 -300 -200 -100 0 100 200 300 400 500
X [km ]
-500
-400
-300
-200
-100
0
100
200
300
400
500
Y [km]
day 120 UTC 0100
1
5
10
50
100
500
1000
[10-10 x sm-3 ]
sunsetsunset
-500 -400 -300 -200 -100 0 100 200 300 400 500
X [km ]
-500
-400
-300
-200
-100
0
100
200
300
400
500
Y [km]
day 120 UTC 0200
1
5
10
50
100
500
1000
[10-10 x sm-3 ]
1
5
10
50
100
500
1000
[10-10 x sm-3 ]
-500 -400 -300 -200 -100 0 100 200 300 400 500
X [km ]
-500
-400
-300
-200
-100
0
100
200
300
400
500
Y [km]
day 120 UTC 0400
1
5
10
50
100
500
1000
[10-10 x sm-3 ]
-500 -400 -300 -200 -100 0 100 200 300 400 500
X [km ]
-500
-400
-300
-200
-100
0
100
200
300
400
500
Y [km]
day 120 UTC 0500
1
5
10
50
100
500
1000
[10-10 x sm-3 ]
-500 -400 -300 -200 -100 0 100 200 300 400 500
X [km ]
-500
-400
-300
-200
-100
0
100
200
300
400
500
Y [km]
day 120 UTC 0600
1
5
10
50
100
500
1000
[10-10 x sm-3 ]
-500 -400 -300 -200 -100 0 100 200 300 400 500
X [km ]
-500
-400
-300
-200
-100
0
100
200
300
400
500
Y [km]
day 120 UTC 0700
1
5
10
50
100
500
1000
[10-10 x sm-3 ]
-500 -400 -300 -200 -100 0 100 200 300 400 500
X [km ]
-500
-400
-300
-200
-100
0
100
200
300
400
500
Y [km]
day 120 UTC 0800
1
5
10
50
100
500
1000
[10-10 x sm-3 ]
-500 -400 -300 -200 -100 0 100 200 300 400 500
X [km ]
-500
-400
-300
-200
-100
0
100
200
300
400
500
Y [km]
day 120 UTC 0900
1
5
10
50
100
500
1000
[10-10 x sm-3 ]
-500 -400 -300 -200 -100 0 100 200 300 400 500
X [km ]
-500
-400
-300
-200
-100
0
100
200
300
400
500
Y [km]
day 120 UTC 1000
1
5
10
50
100
500
1000
[10-10 x sm-3 ]
-500 -400 -300 -200 -100 0 100 200 300 400 500
X [km ]
-500
-400
-300
-200
-100
0
100
200
300
400
500
Y [km]
day 120 UTC 1100
1
5
10
50
100
500
1000
[10-10 x sm-3 ]
-500 -400 -300 -200 -100 0 100 200 300 400 500
X [km ]
-500
-400
-300
-200
-100
0
100
200
300
400
500
Y [km]
day 120 UTC 1200
1
5
10
50
100
500
1000
[10-10 x sm-3 ]
sunrisesunrise
-500 -400 -300 -200 -100 0 100 200 300 400 500
X [km ]
-500
-400
-300
-200
-100
0
100
200
300
400
500
Y [km]
day 120 UTC 1300
1
5
10
50
100
500
1000
[10-10 x sm-3 ]

-500 -400 -300 -200 -100 0 100 200 300 400 500
X [km ]
-500
-400
-300
-200
-100
0
100
200
300
400
500
Y [km]
day 120 UTC 1300
1
5
10
50
100
500
1000
[10-10 x sm-3 ]
-500 -400 -300 -200 -100 0 100 200 300 400 500
X [km ]
-500
-400
-300
-200
-100
0
100
200
300
400
500
Y [km]
day 120 UTC 1500
1
5
10
50
100
500
1000
[10-10 x sm-3 ]
-500 -400 -300 -200 -100 0 100 200 300 400 500
X [km ]
-500
-400
-300
-200
-100
0
100
200
300
400
500
Y [km]
day 120 UTC 1600
1
5
10
50
100
500
1000
[10-10 x sm-3 ]
-500 -400 -300 -200 -100 0 100 200 300 400 500
X [km ]
-500
-400
-300
-200
-100
0
100
200
300
400
500
Y [km]
day 120 UTC 1700
1
5
10
50
100
500
1000
[10-10 x sm-3 ]
-500 -400 -300 -200 -100 0 100 200 300 400 500
X [km ]
-500
-400
-300
-200
-100
0
100
200
300
400
500
Y [km]
day 120 UTC 1800
1
5
10
50
100
500
1000
[10-10 x sm-3 ]
-500 -400 -300 -200 -100 0 100 200 300 400 500
X [km ]
-500
-400
-300
-200
-100
0
100
200
300
400
500
Y [km]
day 120 UTC 1900
1
5
10
50
100
500
1000
[10-10 x sm-3 ]
-500 -400 -300 -200 -100 0 100 200 300 400 500
X [km ]
-500
-400
-300
-200
-100
0
100
200
300
400
500
Y [km]
day 120 UTC 2000
1
5
10
50
100
500
1000
[10-10 x sm-3 ]
-500 -400 -300 -200 -100 0 100 200 300 400 500
X [km ]
-500
-400
-300
-200
-100
0
100
200
300
400
500
Y [km]
day 120 UTC 2100
1
5
10
50
100
500
1000
[10-10 x sm-3 ]
-500 -400 -300 -200 -100 0 100 200 300 400 500
X [km ]
-500
-400
-300
-200
-100
0
100
200
300
400
500
Y [km]
day 120 UTC 2200
1
5
10
50
100
500
1000
[10-10 x sm-3 ]

-500 -400 -300 -200 -100 0 100 200 300 400 500
X [km ]
-500
-400
-300
-200
-100
0
100
200
300
400
500
Y [km]
day 120 UTC 2300
1
5
10
50
100
500
1000
[10-10 x sm-3 ]
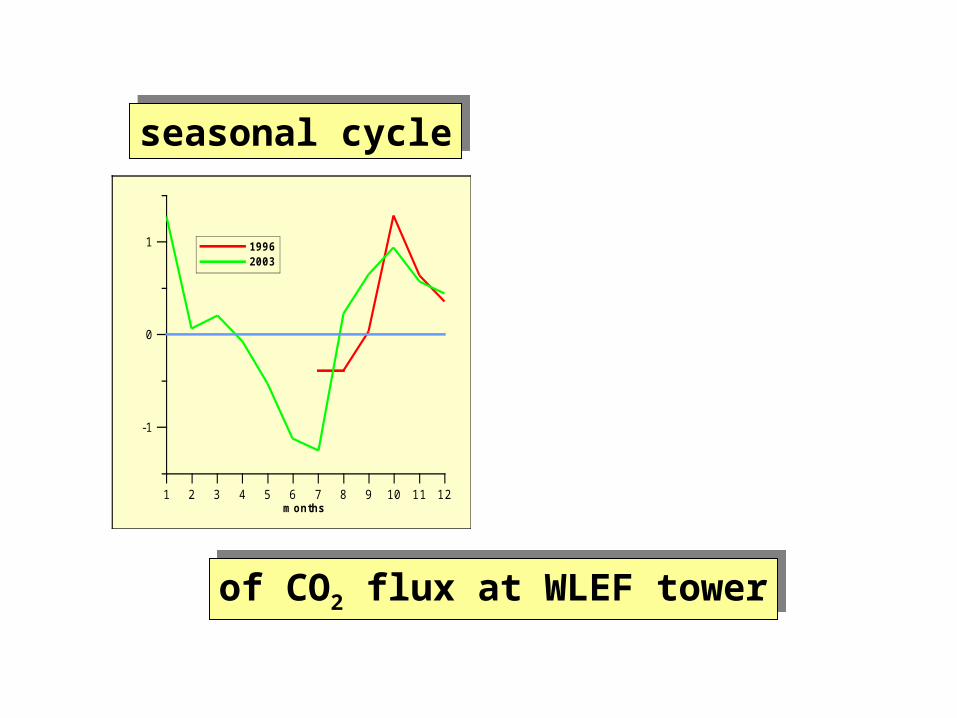
1 2 3 4 5 6 7 8 9 10 11 12m onths
-1
0
1
NEE [umol m-2 s-1]
19962003
seasonal cycleseasonal cycle
of CO2 flux at WLEF towerof CO2 flux at WLEF tower
1 2 3 4 5 6 7 8 9 10 11 12m onths
-1
0
1
NEE [umol m-2 s-1]
19962003
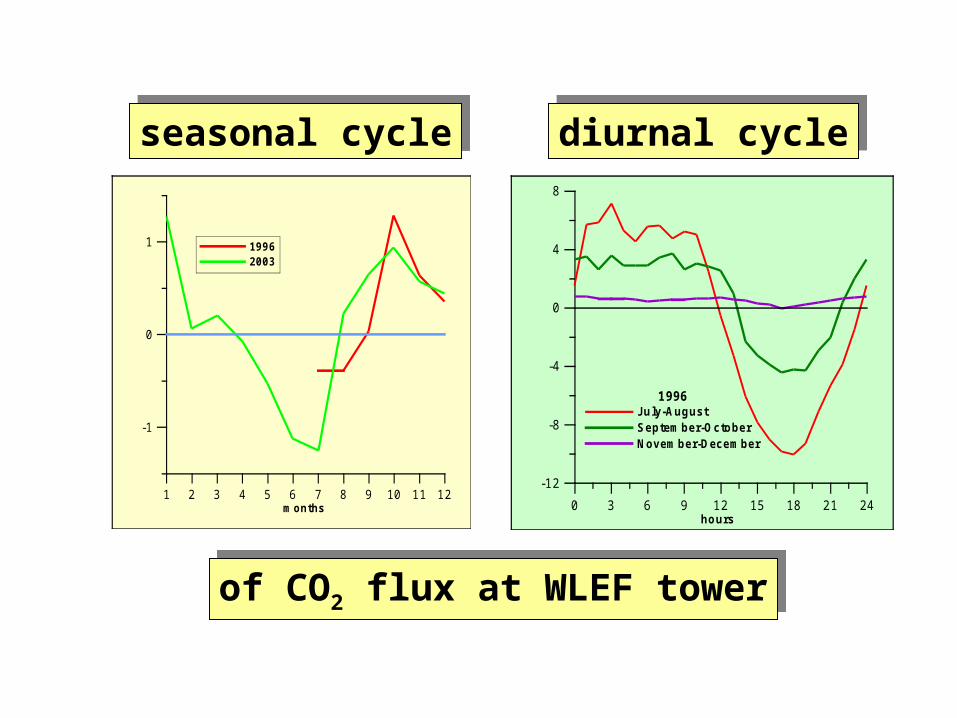
0 3 6 9 12 15 18 21 24hours
-12
-8
-4
0
4
8
CO2 flux [umol m-2 s-1]
1996Ju ly-AugustSeptem ber-OctoberNovem ber-Decem ber
seasonal cycleseasonal cycle diurnal cyclediurnal cycle
of CO2 flux at WLEF towerof CO2 flux at WLEF tower
Lake signature in CO2 dataLake signature in CO2 data
modeling approach to CO2 data analysismodeling approach to CO2 data analysis
200 300 400 500 600 700 800 900 1000 1100
X [km]
200
300
400
500
600
700
800
900
1000
1100
Y [km]
0
0.001
0.005
0.01
0.05
0.1
0.5
1
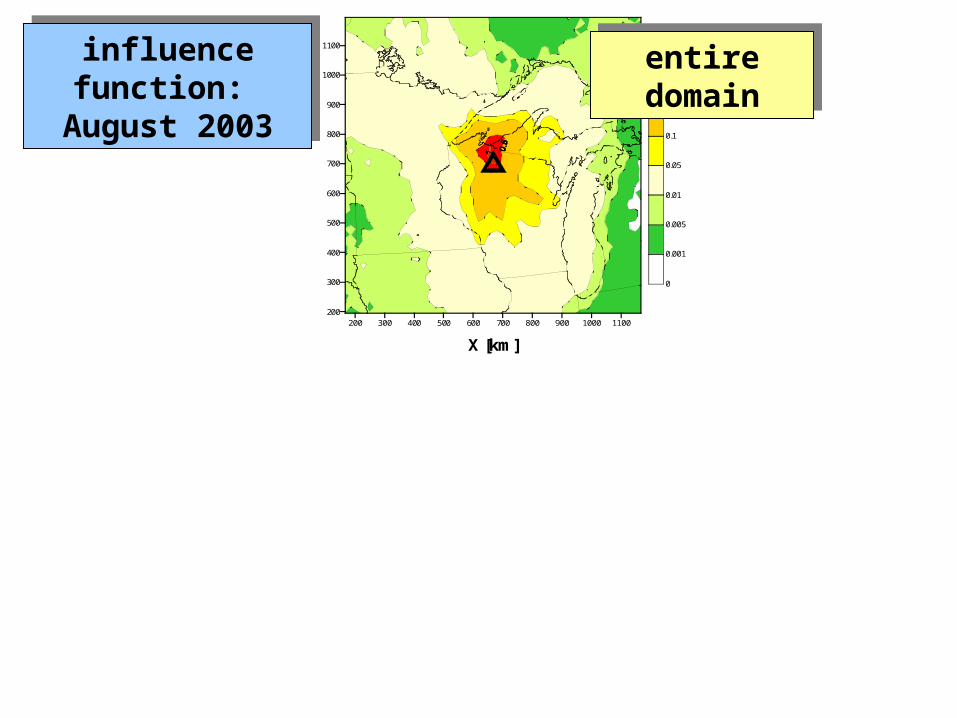
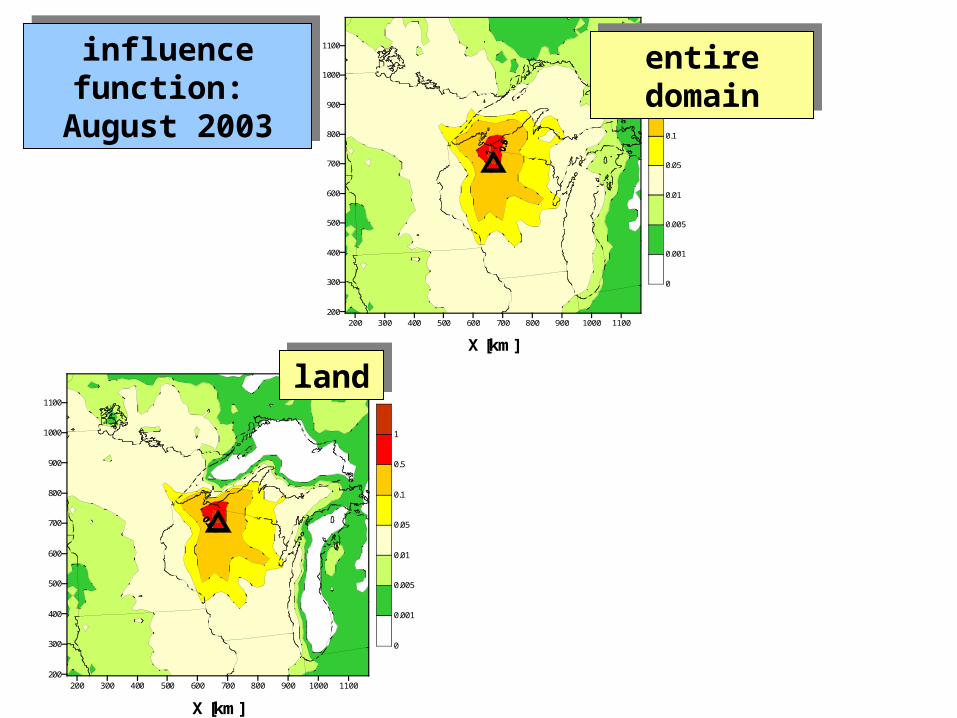
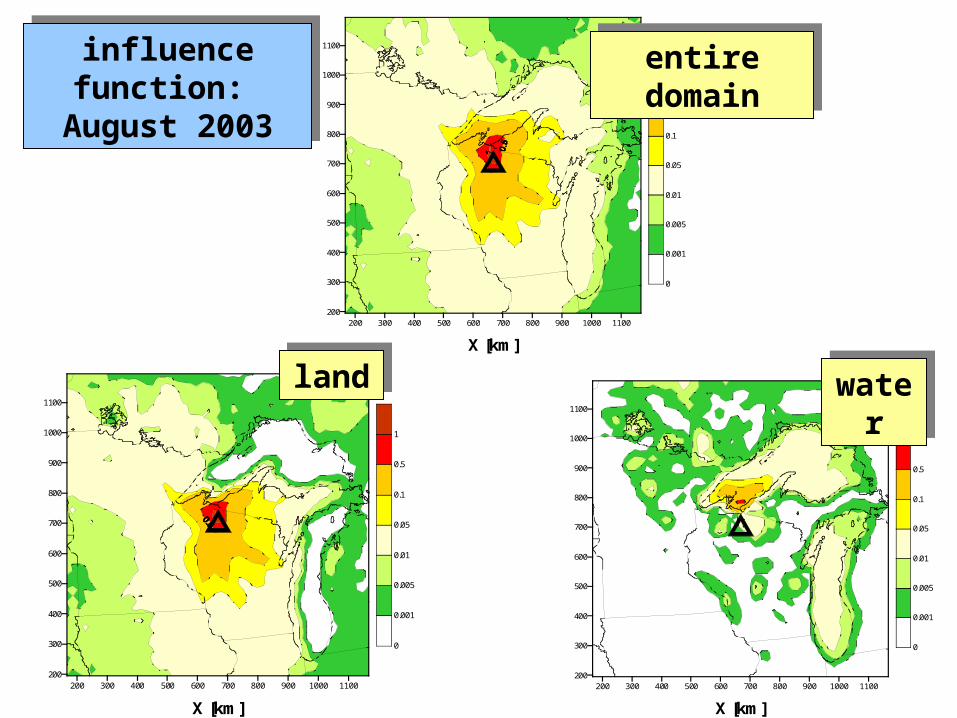
influence function: August 2003
influence function: August 2003
entire domainentire domain
200 300 400 500 600 700 800 900 1000 1100
X [km]
200
300
400
500
600
700
800
900
1000
1100
Y [km]
0
0.001
0.005
0.01
0.05
0.1
0.5
1
influence function: August 2003
influence function: August 2003
200 300 400 500 600 700 800 900 1000 1100
X [km]
200
300
400
500
600
700
800
900
1000
1100
Y [km]
0
0.001
0.005
0.01
0.05
0.1
0.5
1
landland
entire domainentire domain
200 300 400 500 600 700 800 900 1000 1100
X [km]
200
300
400
500
600
700
800
900
1000
1100
Y [km]
0
0.001
0.005
0.01
0.05
0.1
0.5
1
influence function: August 2003
influence function: August 2003
200 300 400 500 600 700 800 900 1000 1100
X [km]
200
300
400
500
600
700
800
900
1000
1100
Y [km]
0
0.001
0.005
0.01
0.05
0.1
0.5
1
200 300 400 500 600 700 800 900 1000 1100
X [km]
200
300
400
500
600
700
800
900
1000
1100
Y [km]
0
0.001
0.005
0.01
0.05
0.1
0.5
1
landland waterwater
entire domainentire domain
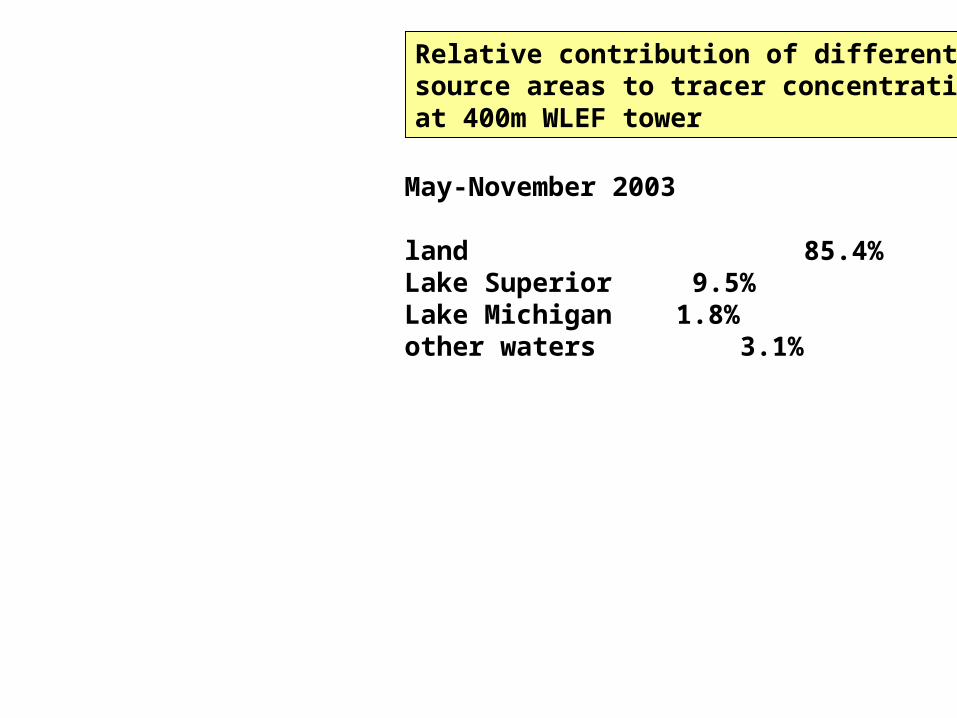
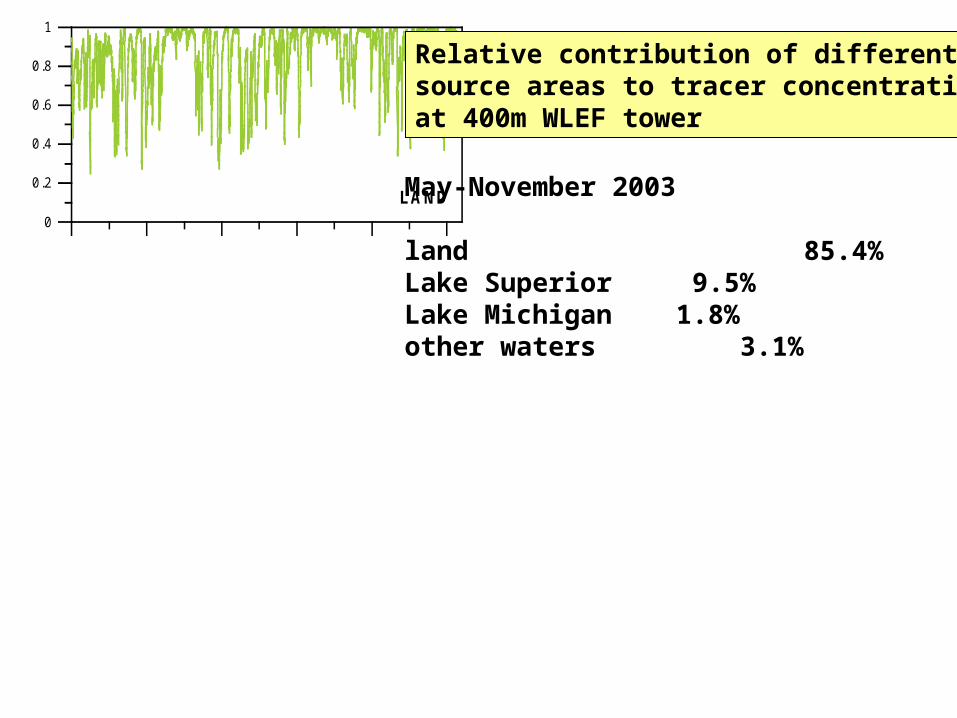
Relative contribution of differentsource areas to tracer concentrations at 400m WLEF tower
May-November 2003
land 85.4%Lake Superior 9.5%Lake Michigan 1.8%other waters 3.1%
0
0.2
0.4
0.6
0.8
1
LA ND
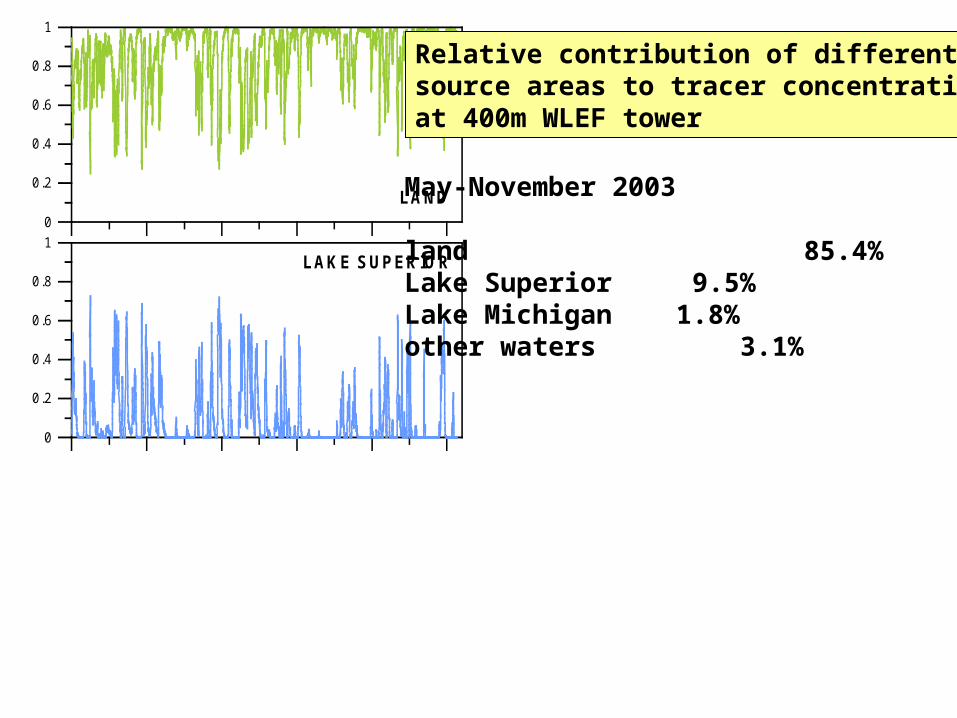
Relative contribution of differentsource areas to tracer concentrations at 400m WLEF tower
May-November 2003
land 85.4%Lake Superior 9.5%Lake Michigan 1.8%other waters 3.1%
0
0.2
0.4
0.6
0.8
1
LA ND
0
0.2
0.4
0.6
0.8
1
LAK E SUPER IOR
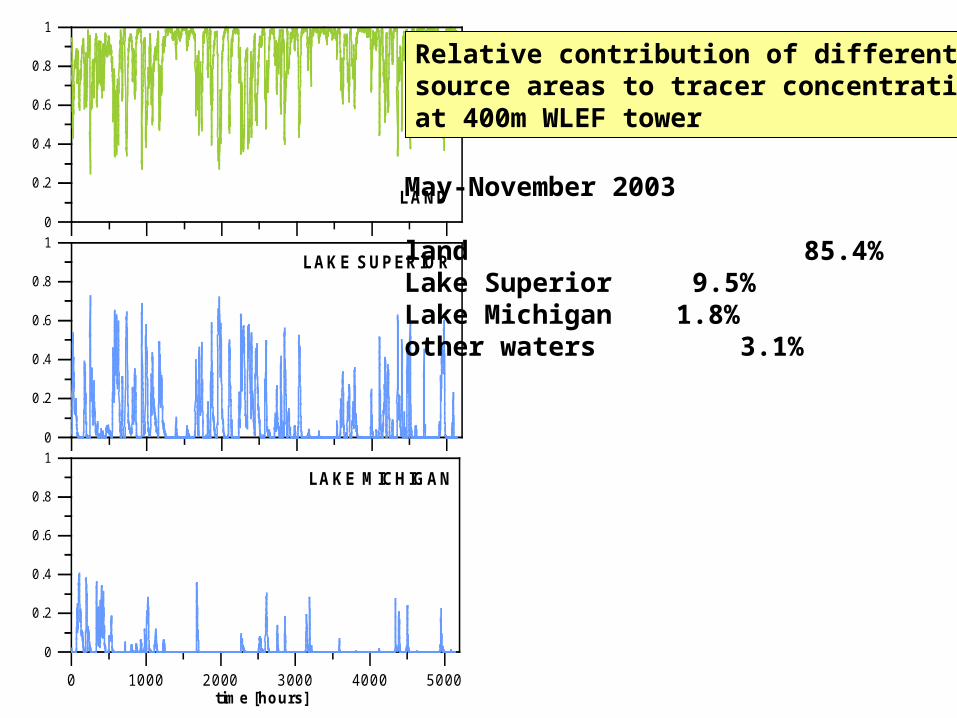
Relative contribution of differentsource areas to tracer concentrations at 400m WLEF tower
May-November 2003
land 85.4%Lake Superior 9.5%Lake Michigan 1.8%other waters 3.1%
0
0.2
0.4
0.6
0.8
1
LA ND
0
0.2
0.4
0.6
0.8
1
LAK E SUPER IOR
0 1000 2000 3000 4000 5000tim e [hours]
0
0.2
0.4
0.6
0.8
1
LA KE M ICH IGAN
0 1000 2000 3000 4000 5000tim e [hours]
0
0.2
0.4
0.6
0.8
1OTHER W A TERS
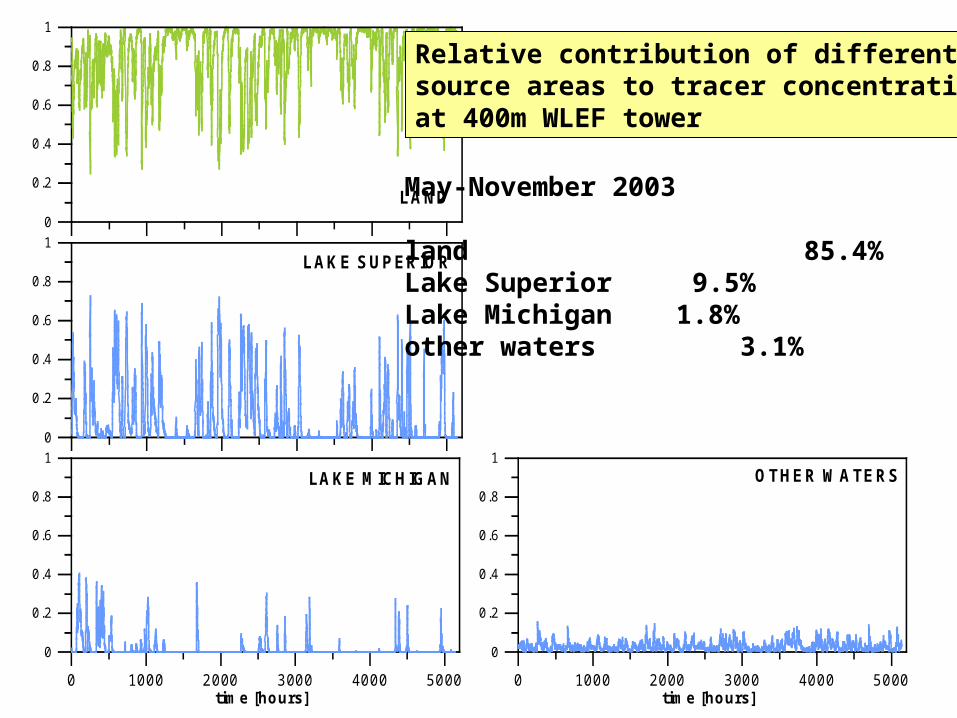
Relative contribution of differentsource areas to tracer concentrations at 400m WLEF tower
May-November 2003
land 85.4%Lake Superior 9.5%Lake Michigan 1.8%other waters 3.1%
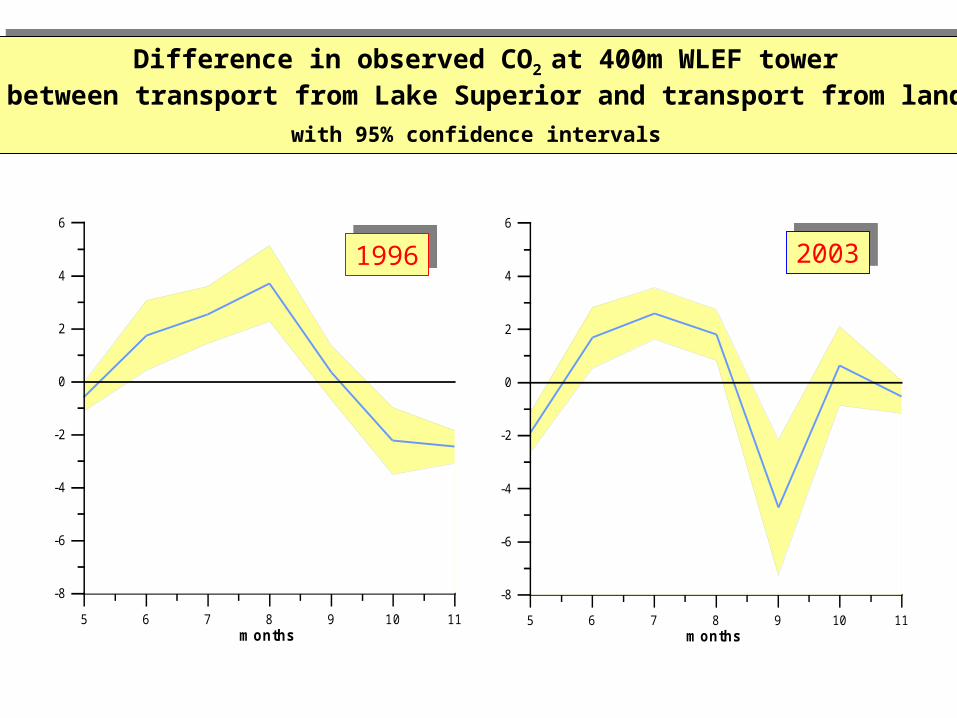
Difference in observed CO2 at 400m WLEF towerbetween transport from Lake Superior and transport from land
with 95% confidence intervals
Difference in observed CO2 at 400m WLEF towerbetween transport from Lake Superior and transport from land
with 95% confidence intervals
5 6 7 8 9 10 11m onths
-8
-6
-4
-2
0
2
4
6
!CO2 [ppm]
5 6 7 8 9 10 11m onths
-8
-6
-4
-2
0
2
4
6
!CO2 [ppm]
19961996 20032003
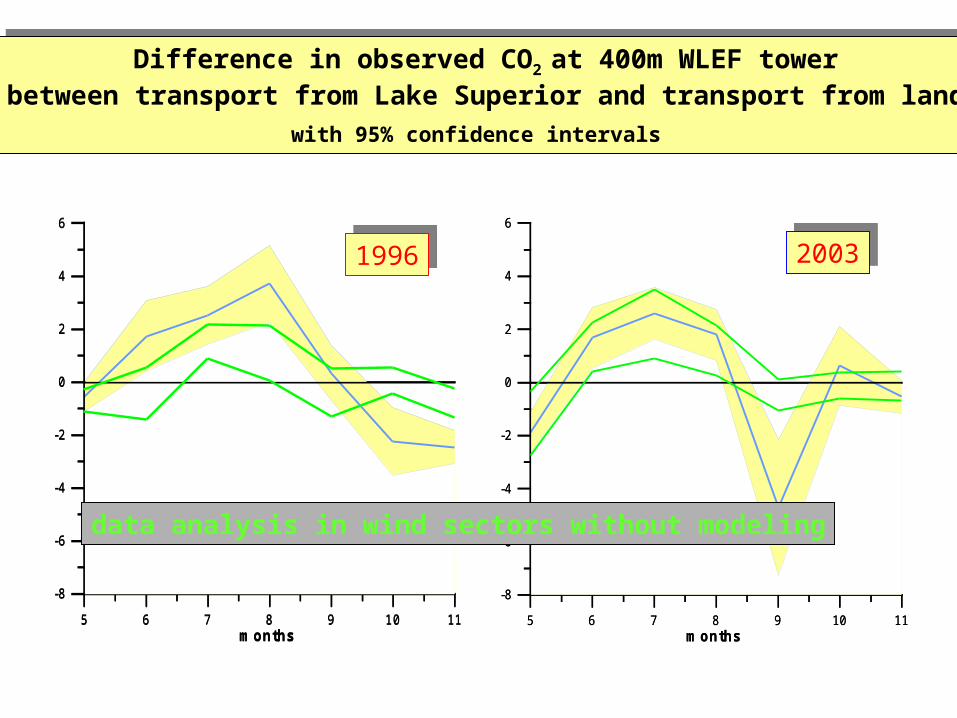
Difference in observed CO2 at 400m WLEF towerbetween transport from Lake Superior and transport from land
with 95% confidence intervals
Difference in observed CO2 at 400m WLEF towerbetween transport from Lake Superior and transport from land
with 95% confidence intervals
5 6 7 8 9 10 11m onths
-8
-6
-4
-2
0
2
4
6
!CO2 [ppm]
5 6 7 8 9 10 11m onths
-8
-6
-4
-2
0
2
4
6
!CO2 [ppm]
19961996 20032003
5 6 7 8 9 10 11m onths
-8
-6
-4
-2
0
2
4
6
!CO2 [ppm]
5 6 7 8 9 10 11m onths
-8
-6
-4
-2
0
2
4
6
!CO2 [ppm]
data analysis in wind sectors without modeling
0 12 24 36 48 60
tim e [hours]
0
0.02
0.04
0.06
0.08
0.1
0.12
frequency [-]
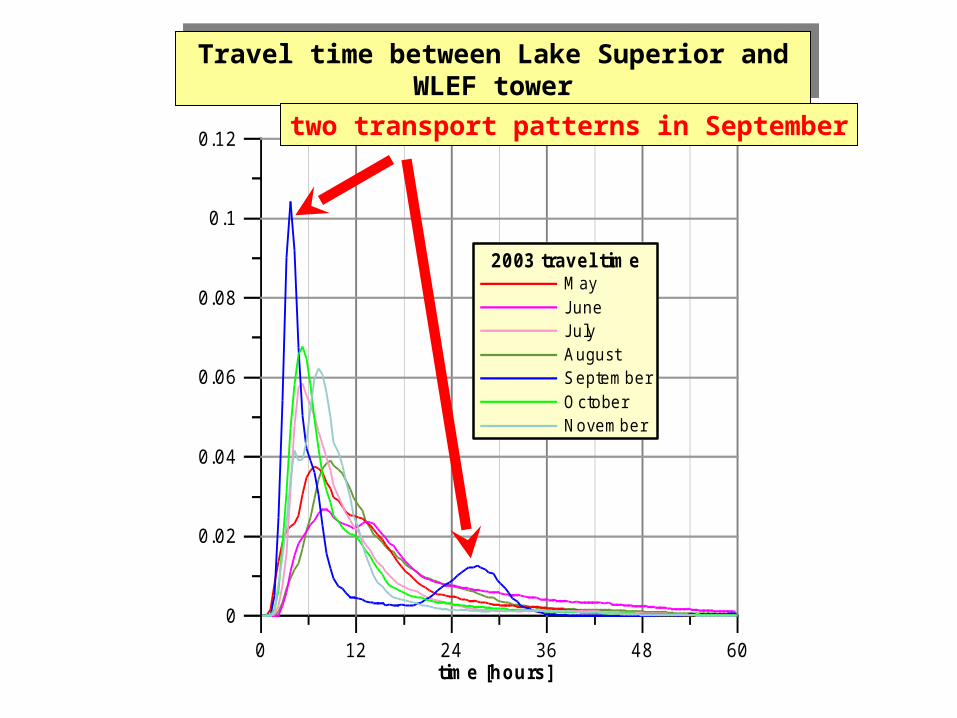
2003 travel tim eM ayJuneJulyAugustSeptemberO ctoberNovember
Travel time between Lake Superior and WLEF towerTravel time between Lake Superior and WLEF tower
two transport patterns in September
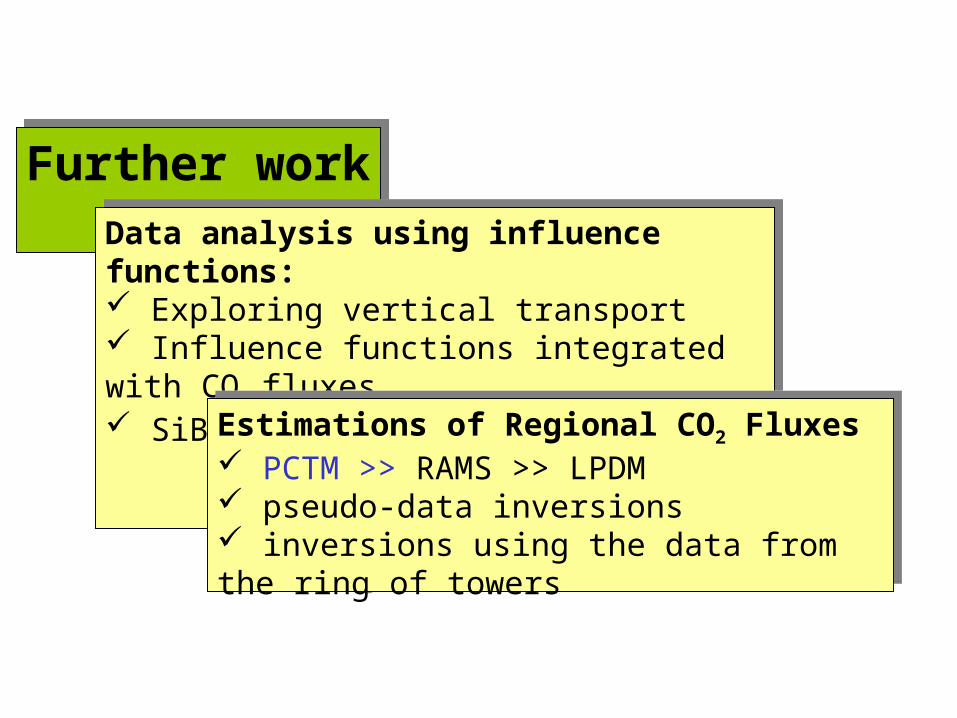
Further workFurther workData analysis using influence functions: Exploring vertical transport Influence functions integrated with CO2 fluxes SiB-RAMS simulation
Data analysis using influence functions: Exploring vertical transport Influence functions integrated with CO2 fluxes SiB-RAMS simulation
Estimations of Regional CO2 Fluxes PCTM >> RAMS >> LPDM pseudo-data inversions inversions using the data from the ring of towers
Estimations of Regional CO2 Fluxes PCTM >> RAMS >> LPDM pseudo-data inversions inversions using the data from the ring of towers