Embed Size (px)
Citation preview

Modeling is for developing
InsightsInvited Panel PresentationState Water Resources Control Board Workshop 3:Analytical Tools for Evaluating the Water Supply, Hydrodynamic, and Hydropower Effects of the Bay‐Delta Plan QuestionsNovember 2012

Panelists
Jon Burau (USGS)John DeGeorge (RMA) John Durand (UC Davis) Greg Gartrell (CCWD)Marianne Guerin (CWEMF)
Jay Lund (UC Davis)Pete Smith (USGS – ret.)William Smith (MWH)Mark Stacy (UCB)Staff ‐ Chris Enright (DSC)

Models and management Modeling is for insights, not numbers
How the Delta Works 1 – Basic Physics Getting better‐established insights for the Board from modeling results
How the Delta Works 2 –Management Examples Insights, estimates, and controversy Questions
Overview
3

The Delta is Rivers flowing into an Estuary Mixing and Movement drives much of water quality and ecosystem
Primary Mechanisms Net Flow Tidal Mixing Gravitational Circulation
Animations from model results (and observed data) can illustrate these mechanisms
How the Delta Works, Part One(Movement and Connections)
4

Key Aspects in Calibrating/Testing a Delta Model Matching point observations on tidal and tidally averaged basis
Stage Flow Salinity (EC)
Look for how well a model represents Important net‐flow splits (e.g., Sac. River to Delta Cross Channel) Gate/barrier operations (e.g., Clifton Court Gates) Delta Island Consumptive Use Delta Exports Low flow, high flow, and transition periods The yearly cycle of salt intrusion and flushing Spring‐neap tidal variation
5
But first, why would you believe what a model shows you??

Observed versus Computed…What can you see in the wiggly lines?
Stage
EC
Flow
6
Tidal Time Scale
Tidally Averaged Time Scale
Statistical Comparison
Example plots from RMA Model Calibration, Water Year 2002

Observed versus Computed…What can you see in the wiggly lines?
Stage
EC
Flow
7
Tide Phase and Amplitude
Rate of salt intrusion
Effect of Exports on net Flow
Spring‐Neap Cycle
Regional effect of Clifton Court
Operation
Example plots from RMA Model Calibration, Water Year 2002

• Tidal flows dominate the Western Delta
• Net transport of fresh water from north to south typical of summer and fall operation
• As Sacramento Inflow increases, more of the North Delta becomes riverine
• As San Joaquin flow increases the net flows change from south to north in the southern Delta
8
Tidal and Net FlowDemonstration of increasing river inflows to bring the net Delta outflow from 2,000 to 100,000 cfs with typical summer exports (not an historic condition)
Tidal Flow
Net Flow
Animation created by Resource Management Associates, using RMA Model results

• Riverine flow in the Sacramento River down to the Cross Channel
• Some particles pushed in to the Cross Channel and Georgiana Slough primarily on flood tide
• Once particles reach the Rio Vista on the Sacramento River and San Andreas on the San Joaquin River the motion is dominated by tidal flows
9
River and EstuaryParticles released hourly near Sacramento during a low flow
period with the Delta Cross Channel open
Animation created by Resource Management Associates, using RMA Model results
Delta Cross Channel

10
Out‐migrant Salmon TracksObservations from acoustic tagged salmon release
Animation created by Jon Burau, USGS, from acoustic monitoring data

• Tidal Excursion is on the order of 6 to 9 miles(!) in this area of the Delta
• The water velocity varies vertically and laterally in a channel
• Turbulent mixing causes a group of particles released at one location experience slightly different velocities causing the group to spread over time
11
Excursion and MixingGroups of Particles released at two locations on the lower Sacramento
River near the center of the channel
~6 mi
~9 mi
Animation created by Resource Management Associates, using RMA Model results

• The distribution of particles after traveling for one tidal cycle (~24.75 hours) illustrates the impact of tidal mixing, one of the key processes that brings ocean salinity into the Delta
12
Excursion and MixingParticles released hourly at two cross sections of the lower Sacramento
River and stopping after traveling for one tidal cycle
Animation created by Resource Management Associates, using RMA Model results

• Fresh water moves from north to south drawn by the south Delta exports and in‐Delta demand
• Sacramento River water moves through Threemile Slough to the San Joaquin on flood tide
• Tidal flows move higher salinity water from the lower San Joaquin to False River where it is drawn into Franks Tract
13
SalinityMixing in the Central Delta during a typical low flow period
Animation created by Resource Management Associates, using RMA Model results

• Salt water is heavier than fresh water and will tend to push upstream under the fresh water outflow creating vertical stratification
• Energy from tides and riverine flow can overcome stratification
• The balance of net Delta outflow, tidal mixing, and gravitational circulation controls the intrusion of ocean salt into the Delta
14
Gravitational CirculationTidally Averaged Salinity Profile
Animation created by Edward Gross using TRIM3D results

12 thoughts organized into: Framing comments on modeling Near‐term recommendations Managing models for Board deliberations
Preparing for the Future
Report has some thoughts on specific models
Managing Models for the Board
15

How do we explore a large, complex, controversial problem?
Framing Comments on Modeling
16

“What is the best model?” Model, input data, modeler are all important Modeler is often the most important
1. Models do not stand alone
17

There is no one best model Having a variety of models available helps explore and test insights and estimates
2. Different models for different problems
18

Models summarize and integrate understanding with greater precision and transparency
Design of most complex systems rely on computer models –buildings, bridges, aircraft, …
Models needed for adaptive management and planning
3. Models summarize understanding
19

Getting more useful insights from modeling efforts
Near‐Term Recommendations
20

Many policy discussions are not based on a full understanding of physical processes in the Delta
Developing a library of model visualizations on “How the Delta Works” might help improve: Broader understanding of the Delta Ability of policy discussants to benefit from model‐based insights
4. ShowHow the Delta Works
21

22
Many available models can provide critical insights
But models should be: More thoroughly documented More explicitly tested More thoughtfully and critically interpreted
in both model development and application
5. Models must be documented and interpreted more critically

All model results are imperfect Modelers should best know model weaknesses and limitations and state them with their results
Inadequate presentation of weaknesses and limitations reflects poorly on model and modeler reliability
Boards and agencies should insist on more complete interpretations of results, including weaknesses
We suggest tests for Delta hydrodynamic models
6. Each model application should include strengths, weaknesses, and limitations
23

Modeling is a search for insights What are the Board’s desired states for the Delta?
Clear statement of objectives improves: Exploration and discussion of solutions Estimation of implications and impacts
Otherwise, presented model results may simply be searches for stakeholders’ desired outcomes
7. What are we looking for? ‐ Need clear statements of desired states
24

Strategically: Use a group of independent experts to advise on modeling issues
Employ independent experts to assess and summarize the body of presented modeling results
Encourage stakeholder groups to present consolidated, organized, and documented sets of modeling results, with syntheses for policy
Independent technical assessments can raise overall quality of testimony and insights from results
8. Board can make better use of modeling
25

Plan should include: Plan for near‐term modeling efforts and testing Plan for long‐term model and data development (5‐15 years)
Modeling needs exceed the capacity of any one agency, so approach should be “community‐based”
“Community‐based” modeling should dampen combat science
9. The State needs a plan for Delta‐related modeling
26

“Community‐based” modeling involves: More than one developer Database of commonly used, QA/QC’d data Set of generic tools for data development and presentation of model results
Other components, included in our documentation
27
9. The State needs a plan for Delta‐related modeling (cont.)

The Delta is a changing problem Useful models and data take time to develop
Preparing for the Future (5‐15 years)
28
Integrated understanding requires an integration of modeling
Better ability to: Find insights and solutions which cross model boundaries
Evaluate implications of proposed solutions Test models, modeling results, and insights
This will require stronger state leadership
10. Integrate our understanding by integrating our models
29

Each agency has limited financial resources and expertise for modeling and data development
Interests of individual agencies are often too narrow to develop broader insights and solutions
Community based modeling efforts seem promising for overcoming these limitations
State Board is in a good position to encourage cooperative data and model development efforts
11. Model and data development are too important for any one agency
30
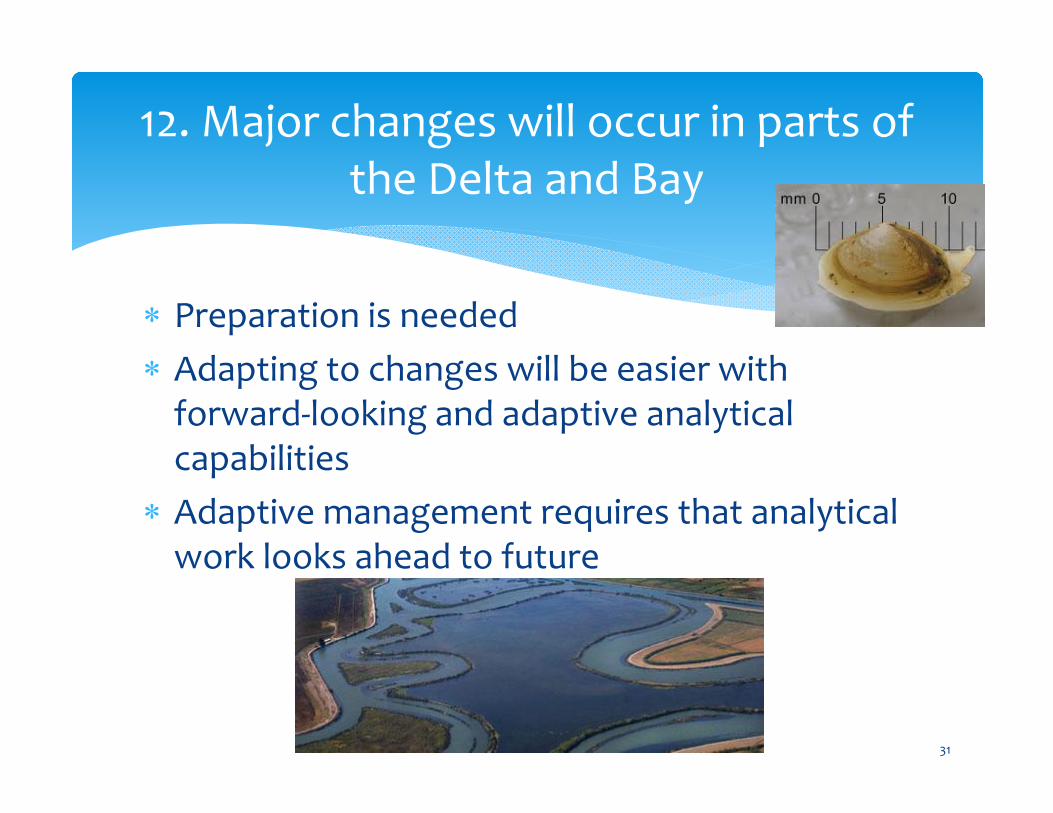
Preparation is needed Adapting to changes will be easier with forward‐looking and adaptive analytical capabilities
Adaptive management requires that analytical work looks ahead to future
12. Major changes will occur in parts of the Delta and Bay
31

Managing Salt Accumulation over the Dry Season Water Exports Affect Water Source Distribution Some Residence Time Results
How the Delta Works, Part Two(Some Management Issues)
32

• Sacramento River water drawn into the south Delta by exports
• San Joaquin River inflow typically higher in salt than other tributary inflows
• Salt from the ocean boundary moves slowly eastward over the summer and fall period
33
SalinityTidally averaged Delta salinity distribution (as Electrical
Conductivity) , 2002 Historic Conditions
Animation created by Resource Management Associates, using RMA Model results

• River inflow held constant while south Delta exports increased from 0 to maximum pumping (lowest net Delta outflow ~3000 cfs)
• With increasing exports
• Most of San Joaquin and Mokelumne flows taken in by exports
• Sacramento Water drawn downs Old and Middle River
• Seawater drawn farther into western Delta
34
Source Water Fingerprinting Illustration of the impact of south Delta Exports on the distribution of source water (not an historic condition)
% Source Water
Animation created by Resource Management Associates, using RMA Model results
Sacramento Mokelumne
Ocean Boundary San Joaquin

• Exposure time is lowest in the riverine areas of the Delta
• The longest exposure times occur in dead end sloughs
• Exposure time in western Delta is low during periods of high net Delta outflow and increases significantly through the summer and fall
• Exposure time in the south Delta is mitigated by south Delta exports
35
ExposureAmount of time water has been in the Delta (between River inflow locations and Martinez), Historic 2003 conditions
Animation created by Resource Management Associates, using RMA Model results

• Tracer loading in Liberty Island increases concentration by 1 unit per day, which can be interpreted as the exposure time to Liberty Island
• Outside of Liberty Island, the tracer indicates the region influenced by processes occurring in Liberty Island
• This approach is just one of many analysis techniques related to residence time and influence of discrete regions of the Delta
36
Exposure Time and InfluenceLiberty Island
No Flow in Yolo Bypass Low Flow in Yolo Bypass

Board procedures should: Increase the demonstrable quality and discussion of modeling results and conclusions
Improve the organization and coherence of modeling work and insights
Improve the long‐term development of analytical tools and data among many groups
Organize policy‐making to better employ modeling results
Insights, Estimates, and Controversy
37