Embed Size (px)
Citation preview

Separations
Modeling Multicomponent Gas SeparationUsing Hollow-Fiber Membrane Cohtactors
D. T. Coker and B. D. FreemanDept. of Chemical Engineering, North Carolina State University, Raleigh, NC 27695
G. K. FlemingAir Liquide, Newport, DE 19804
A model developed for multicomponent gas separation using hollow-fiber contactorspermits simulation of cocurrent, countercurrent, and crossflow contacting patterns withpermeate purging (or sweep). The numerical approach proposed permits simulationto much higher stage cuts than previously published work and provides rapid andstable solutions for cases with many components, with widely varying permeability coef-ficients. This new approach also permits the rational and straighqorward incorporationof efjects such as permeate sweep, pressure-dependent permeability coeficients, andbore side pressure gradients. Simulation results are presented for separation of commer-cially significant multicomponent gas mixtures using polymer permeation properties sim-ilar to those of polysulfone. The effect of permeate pqing on separation per$ormance isexplored for air separation. The influence of pressure ratio on hydrogen separation per-formance for a refinery stream is presented. Air is modeled as a four-component mixtureof 02, N2, C02, and Hz0 and the refinery stream contains five components: Hz, CH4,C2 H4, C2 H6, and C3 Hs. In air separation, permeate purging with a small fraction ofthe residue stream provides a very eflective method for improving module efficiency fordrying but is not eflcient for improving nitrogen purity or recovery. In multicomponentmixtures, maxima in the compositions of components of intermediate permeability maybe observed as a function of distance along the hollow fiber. This result suggests the useof membrane staging to capture these components at their maximum concentratbn.
IntroductionThe use of polymeric membranes for gas separation is be-
coming a standardized unit operation for several applica-tions. One of the earliest commercial applications usingmembranes was related to hydrogen recovery from ammoniapurge gas (Maclean et al., 1980). Membrane-based hydrogenseparation from mixtures of gases containing componentssuch as methane, carbon monoxide, and nitrogen continuesto be important in industrial applications such as syngas(H&O) ratio adjustment (Zolandz and Bleming, 1992) andhydrogen recovery from hydrocarbons in refineries andpetrochemical processes (Bollinger et al., 1984). Membrane-
Correspondence concerning this article should be addressed to B. D. Freeman.Current address of D. T. Coker: Air Liquide, 2700 Post Oak Boulevard, Suite 18CKl,
Houston, TX 77056.
based air separation is used to produce nitrogen at concen-trations as high as 99.5%, but membranes are most efficientproducing Nz in the 99.9% purity range (Spillman, 1989). Theproduction of nitrogen-enriched air-using membranes is im-portant in inert gas blanketing of fresh fruits and vegetablesand inflammable liquids (Spillman, 19891. Raw natural gasfrequently contains impurities such as carbon dioxideand hydrogen sulfide which must be removed prior to deliv-ery by pipelines (Spillman, 1989). Both carbon dioxide andhydrogen sulfide are much more permeable than methane,enabling concentrated methane to be recovered as a high-pressure stream using membrane processes (Spillman, 1989).Dehydration of natural gas occurs simultaneously with CO2removal since water is typically highly permeable. Reduction
AIChE Jourual June 1998 Vol. 44, No. 6 1289

in the water vapor driving force due to concentration polar-ization at the downstream surface can be minimized by pro-viding a dry gas sweep at ambient pressure at the down-stream side (Zolandz and Fleming, 1992). Usually, a part ofthe dry gas produced by the membrane is used as the sweep(Zolandz and Fleming, 1992). In addition to dehydration ofnatural gas, air can be dehydrated using membrane systems,and such systems supply dry air for small laboratory and in-strumentation applications (Wang et al., 1992). The recoveryof volatile organic compounds from mixtures with air or otherpermanent gases such as methane or hydrogen is a recentlycommercialized membrane-based separation used for remov-ing low levels of condensable organics from gas streams em-ploying novel, vapor-selective membrane materials (Baker etal., 1987; Freeman and Pinnau, 1997; Morisato et al., 1996).Such membrane systems are used to recover vinyl chloridemonomer from (polyvinyl chloride) reactor vent streams,chlorofluorocarbons from coating operations, and ethyleneand propylene from purge bin off-gas streams in the produc-tion of polyethylene and polypropylene.
+ Ar
Figure 1. Hollow-fiber module.
In each of the applications described above, models arerequired to predict the performance of gas separation mod-ules for process design and optimization. For the currentstudy as well as for many of the modeling studies in the liter-ature, hollow-fiber membrane modules are the focus of themodeling efforts due to their widespread industrial use formembrane-based gas separation,
low fiber bundle is sealed on both ends by epoxy tubesheetsand is contained inside a high-pressure housing. Feed gas maybe introduced on the bore of the hollow fibers (as shown inFigure 1) or on the shell side of the module. For air separa-tion, bore side feed is commonly used commercially. Forhydrogen separations such as the refinery applications dis-cussed in this work, transmembrane pressures are muchgreater and shell side feed is common.
Excellent reviews of existing models of membrane gas per-meators are presented by Kowali et al. (1992) and by Lip-scomb (1996). For highly simplified cases (such as perfectlymixed residue and feed), analytical solutions are available(Naylor and Backer, 1955; Smith et al., 1996; Weller andSteiner, 1950). Solutions for more complex cases are gener-ally obtained by series approximations or asymptotic analysesof the underlying differential equations governing mass-transfer and pressure distribution in the module (Basaran andAuvil, 1988; Boucif et al., 1984; Krowidi et al., 1992) or bysolving the governing differential equations directly as a twopoint boundary value problem using shooting techniques(Kowali et al., 1992).
This study presents a multicomponent model that permitsrapid solution of the governing differential mass and pressuredistribution in a hollow-fiber gas separation contactor using acomputational scheme that does not rely on conventionalshooting techniques, which may be unstable, for numericalintegration. Our numerical scheme permits rapid resolutionof the differential mass and pressure distribution equationseven at very high stage cuts ( > 95%) for mixtures containingmultiple components and wide variations in component per-meances. The model is developed for countercurrent, cocur-rent, and cross-flow contacting patterns with or without per-meate purging. Results presented for air separation show theeffect of permeate purging on nitrogen purity and recovery,as well as Hz0 dew point of residue gas. In multicomponentmixtures, the composition of components of intermediatepermeability may go through a maximum with position in thecontactor, and this phenomenon is presented and discussed.
Typically, a set of coupled, nonlinear differential equationsare solved to determine mole fractions of each component inthe feed and permeate, pressure in the fiber lumen (that is,the bore of the hollow fiber) and in the module shell, andfeed and permeate flow rate as a function of axial positionalong the length of the hollow fiber module. The resulting setof 2( R - 1) + 4 differential equations (where R is the numberof components in the feed) together with specified feed flowrate, feed pressure, feed composition, and permeate outletpressure form a two point boundary value problem. Manyexamples in the literature describe so-called “shooting” tech-niques to solve this problem iteratively (Kowali et al., 1992).However, this methodology becomes cumbersome when thereare more than two components, when the permeability coef-ficients are functions of pressure and composition, and whentemperature effects are included. These techniques can beunstable when calculations are performed at very high per-meate recoveries of one or more components. For these rea-sons, we have adopted an alternative strategy which is notbased on the standard shooting techniques. The presenttreatment provides a simple, flexible framework for modelingthe separation of multicomponent mixtures and permits therapid implementation of effects such as expansion-drivenheating or cooling of the gas mixture and pressure, composi-tion, and temperature-dependent permeability coefficients.
Mathematical Model
The principal assumptions underpinning the model are:(1) Shell side pressure change is negligible.(2) Bore side pressure change is given by the Hagen-
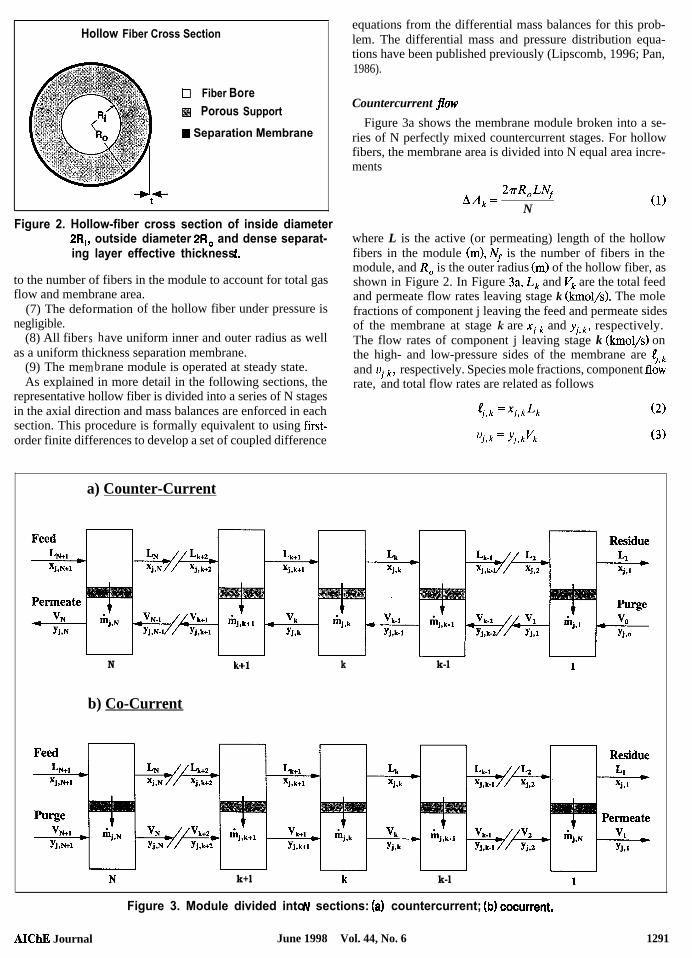
Poiseuille equation.(3) The hollow 1fbers consist of a very thin membrane sep-
aration layer on a porous support as shown in Figure 2. Allmass-transfer resistance is confined to the separation mem-brane or the total membrane wall.
(4) There is no axial mixing of shell or lumen side gases inthe direction of bulk gas flow.
(5) The gas on the shell side of the hollow fibers and inthe lumen is in plug flow.
Figure 1 shows the flow configuration and internal struc- (6) The performance of a single hollow fiber is calculatedture of a typical hollow-fiber gas separation module. The hol- in the simulation and these results are scaled in proportion
1290 June 1998 Vol. 44, No. 6 AIChE Journal
Hollow Fiber Cross Section
Fiber Bore
Porous Support
m Separation Membrane
Figure 2. Hollow-fiber cross section of inside diameter2R,, outside diameter 2R0 and dense separat-ing layer effective thickness f.
to the number of fibers in the module to account for total gasflow and membrane area.
(7) The deformation of the hollow fiber under pressure isnegligible.
(8) All fibers have uniform inner and outer radius as wellas a uniform thickness separation membrane.
(9) The membrane module is operated at steady state.As explained in more detail in the following sections, the
representative hollow fiber is divided into a series of N stagesin the axial direction and mass balances are enforced in eachsection. This procedure is formally equivalent to using first-order finite differences to develop a set of coupled difference
equations from the differential mass balances for this prob-lem. The differential mass and pressure distribution equa-tions have been published previously (Lipscomb, 1996; Pan,1986).
Countercurrent jlow
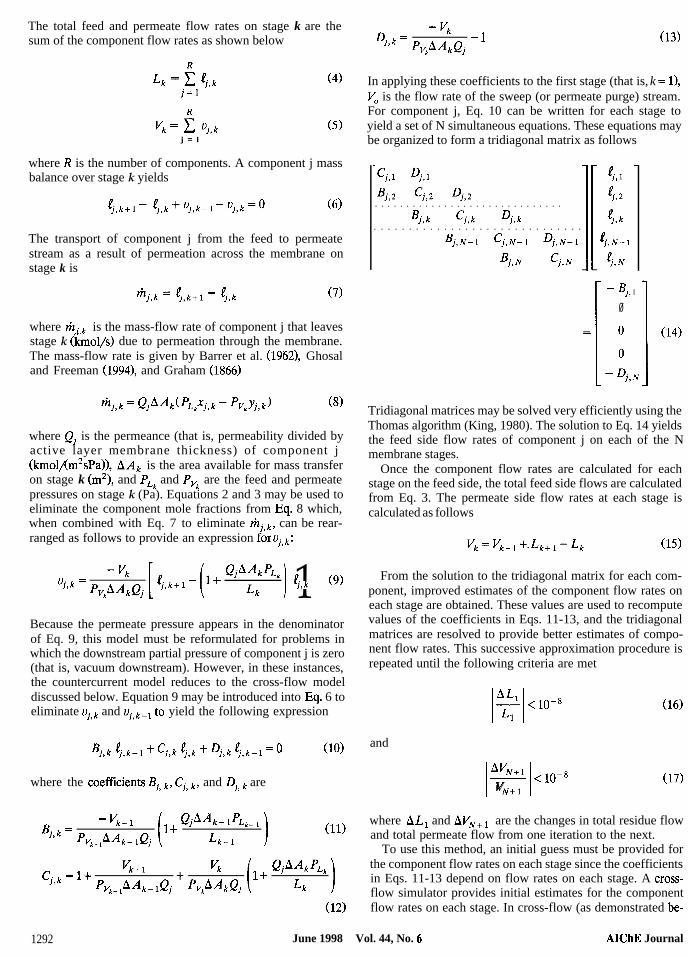
Figure 3a shows the membrane module broken into a se-ries of N perfectly mixed countercurrent stages. For hollowfibers, the membrane area is divided into N equal area incre-ments
AAk =2vRoLNf
N(11
where L is the active (or permeating) length of the hollowfibers in the module (m), Nf is the number of fibers in themodule, and R. is the outer radius (m) of the hollow fiber, asshown in Figure 2. In Figure 3a, Lk and Vk are the total feedand permeate flow rates leaving stage k (kmol/s). The molefractions of component j leaving the feed and permeate sidesof the membrane at stage k are ~j k and yj,~, respectively.The flow rates of component j leaving stage k (kmol/s) onthe high- and low-pressure sides of the membrane are 4 kand ~j k, respectively. Species mole fractions, component flo&rate, and total flow rates are related as follows
q,k = xj,kLk c9
‘j,k = Yj,kvk (3)
a) Counter-Current
N
b) Co-Current
k k-l
k+l k k-l
Figure 3. Module divided into N sections: (a) countercurrent; (b) cocurrent.
AIChl3 Journal June 1998 Vol. 44, No. 6 1291
The total feed and permeate flow rates on stage k are thesum of the component flow rates as shown below
‘k = 5 fj,kj=l
vkz ? vj,kj = l
where R is the number of components. A component j massbalance over stage k yields
$k+l- {,k+ vj,k-l~vj,k~o 6)
The transport of component j from the feed to permeatestream as a result of permeation across the membrane onstage k is
.mj,k = ‘j,k+l - ‘j,k (7)
where ~j k is the mass-flow rate of component j that leavesstage k (kmol/s) due to permeation through the membrane.The mass-flow rate is given by Barrer et al. (1962), Ghosaland Freeman (1994), and Graham (1866)
where Qj is the permeance (that is, permeability divided byactive layer membrane thickness) of component j(kmOl/(II12Sh)), bik is the area available for mass transferon stage k (m2), and PLk and Pvk are the feed and permeatepressures on stage k (Pa). Equations 2 and 3 may be used toeliminate the component mole fractions from Eq. 8 which,when combined with Eq. 7 to eliminate ~j,k, can be rear-ranged as follows to provide an expression for Vj,k:
- vk
‘jyk = pvpkQjI 1p,
j,k cg)
Because the permeate pressure appears in the denominatorof Eq. 9, this model must be reformulated for problems inwhich the downstream partial pressure of component j is zero(that is, vacuum downstream). However, in these instances,the countercurrent model reduces to the cross-flow modeldiscussed below. Equation 9 may be introduced into Eq. 6 toeliminate Vj,k and Vj,k_ 1 to yield the following expression
‘j,k ‘j,k-I i- cj,k ‘j,k -b Dj,k $,k+l =E ’ wo
where the Coefficients Bj, k, Cj, k, and Dj, k are
Bj,k =- vk-l
Pvk_ IAAk- IQj1 + QjAAk-- lhk_ 1
Lk-l
vk-l ‘k
“~’ =” P~~_~AAk_~Qj + PvkAAkQj1 + QjAAkPLk
‘k
Dj,k =- ‘k
PvkAAkQj-1 03)
In applying these coefficients to the first stage (that is, k = 11,V. is the flow rate of the sweep (or permeate purge) stream.For component j, Eq. 10 can be written for each stage toyield a set of N simultaneous equations. These equations maybe organized to form a tridiagonal matrix as follows
vcj,l Dj,l
Bj,2 cj,2 Dj,2. . . . . . . . . . . . . . . . . . . . . . . . . . . . . .
Bj,k cj,k Dj,k. . . . . . . . . . . . . . . . . . . . . . . . . . . . . .
Bj,N-l cj,N-l Dj,N-l
Bj,N cj,N
- Bj,l0 1
Tridiagonal matrices may be solved very efficiently using theThomas algorithm (King, 1980). The solution to Eq. 14 yieldsthe feed side flow rates of component j on each of the Nmembrane stages.
Once the component flow rates are calculated for eachstage on the feed side, the total feed side flows are calculatedfrom Eq. 3. The permeate side flow rates at each stage iscalculated as follows
From the solution to the tridiagonal matrix for each com-ponent, improved estimates of the component flow rates oneach stage are obtained. These values are used to recomputevalues of the coefficients in Eqs. 11-13, and the tridiagonalmatrices are resolved to provide better estimates of compo-nent flow rates. This successive approximation procedure isrepeated until the following criteria are met
4l-l < lo-8J%
and
WV+1I IJT do-V(171
where ALI and AVN+ l are the changes in total residue flowand total permeate flow from one iteration to the next.
To use this method, an initial guess must be provided forthe component flow rates on each stage since the coefficientsin Eqs. 11-13 depend on flow rates on each stage. A cross-flow simulator provides initial estimates for the componentflow rates on each stage. In cross-flow (as demonstrated be-
1292 June 1998 Vol. 44, No. 6 AICbJ3 Journal

low), the composition of gas produced on a stage dependsonly on the upstream compositions, permeances, and up-stream and downstream pressure. That is, the permeate com-position on a stage is independent of the composition of gasproduced downstream by permeation in other stages. For thisreason, the cross-flow model is straightforward and rapid tosolve. Moreover, by treating the module as a series of cross-flow stages, the variation in residue side gas concentrationwith position in the module is introduced, which provides amuch more accurate initial guess for the countercurrent sim-ulator than simpler models, such as the complete mixingmodel. In the cross-flow model, the mole fraction of compo-nent j produced on stage k is given by (Shindo et al., 1985)
From Eq. 18, a set of R - 1 independent algebraic equationsmay be written for the compositions on each stage. Beginningat the feed end of the module, these equations are solvedsimultaneously using Newton’s method to give the composi-tion of permeate gas produced in each stage. For all stagesexcept stage N (the feed stage), the initial guesses of perme-ate composition required by Newton’s method are given bythe composition of permeate gas produced on the previousstage. For stage N, the initial guesses of Yj,N for components1, 2, 3, . . . , R - 1 are provided by (Geankoplis, 1993)
which represents the solution to Eq. 18 in the limit when theratio of feed to permeate pressure is much greater thanmembrane selectivity (that is, selectivity limited separation),If Eq. 19 predicts that the partial pressure of any componentin the permeate is greater than its partial pressure in thefeed, then the composition of that component is estimated by(Geankoplis, 1993)
The pressure on the shell side of the fibers is generallytaken to be constant and equal to the feed pressure. As iscustomary for hollow-fiber membrane separator models(Kowali et al., 1992; Lipscomb, 1996), the tube-side (that is,permeate) pressure change from stage to stage is calculatedusing the Hagen-Poiseuille relation for laminar flow of anincompressible fluid in an impermeable tube (Bird et al.,1960)
where pmk is the gas mixture viscosity (Pa + s), which is com-puted using the Wilke equation (Bird et al., 1960), Ri is theinner radius of the hollow fiber (m), and AZ is the length offiber in the stage Cm) (AZ = L/Nf). After calculating and up-dating the mass flow by the procedure outlined above, thebore side pressure profile is recomputed using Eq. 21 and theupdated flow rates at each stage. For bore-side feed vk isreplaced by Lk, Pvk on the righthand side is replaced by PLk,mcl PVk_1 - Pvk is replaced by PLk+l - PLk.
As these membrane units are used to separate compress-ible gas mixtures and the hollow fibers are permeable, onecould modify Eq. 21 to account for the effects of gas com-pressibility and fiber permeability on lumen pressure profile.This modification is straightforward and is presented in theAppendix. As shown by the example calculations in the Ap-pendix, for the simulation cases presented in this study, theinfluence of gas compressibility and gas flow through the sidewalls of the fibers on the lumen pressure profile are negligi-ble.
In order to perform a simulation, a value for the numberof stages N must be selected. This value is important sinceselecting too few stages will lead to inaccuracies in the solu-tion and selecting too many stages wiI1 result in simulationsrequiring more computer time than necessary. We select Nbased on a conservative estimate of the number of stagesneeded to accurately represent the composition profile ofeach component. We use Eqs. 1, 7, and 8 for this calculation.The permeate pressure is set to zero in Eq. 8, since the largestamount of mass transfer will occur if the downstream partialpressure is zero. The upstream pressure is set equal to thefeed pressure PF (Pa) since this gives the highest driving forcefor mass transfer. We calculate the area in a single stage ofthe separator which would allow a maximum change in themole fraction of each component AX~= away from its valuein the feed XF,. With these conditions, we set Eq. 7 equal toEq. 8 and introduce Eq. 1 to obtain
PYj,N = xj,NF cm
vN
which is the maximum possible permeate purity when selec-tivity is much greater than the ratio of feed to permeate pres-sure (that is, pressure ratio limited separation). This limitcorresponds to the case when the partial pressure of eachcomponent is equal in the permeate and feed and, therefore,the driving force for further mass transfer is zero (Gean-koplis, 1993). If the sum of the mole fractions of all permeatecomponents on stage N are greater than one, the guessedpermeate compositions are renormalized to unity.
From Eq. 8, the amount of permeate gas produced on eachstage may be calculated. From these results, the change inresidue flow rate from stage to stage is calculated using Eq.7. The total permeate gas composition and flow rate are com-puted from the compositions and flow rates on each stage.
N =2vRoLNf(l- Xq + AXmax)Qjf’FXF,
FA%nax(221
In the simulations presented in this study, the value of AXE=is 0.005. Reducing AXE= below this value never significantlychanged the computed compositions, flow rates, or pressures.We use Eq. 22 to calculate a value of N for each componentand use the maximum number in subsequent calculations.This maximum number was rounded up io the nearest 100stages. Most simulation results were obtained using N =the minimum value. For some cases, when the stage cut
lo&was
AIChE Journal June 1998 Vol. 44, No. 6 1293

extremely high ( > 90%), the required number of stages wasas large as 1,000. For cases with widely varying feed composi-tions and permeabilities, one could also set AX,_ to a frac-tion of the feed composition rather than an absolute number.
The cross-flow model generally provides an excellent start-ing point for the countercurrent or cocurrent model and,therefore, largely alleviates potential problems associatedwith the limited radius of convergence of our successive sub-stitution method. One could, of course, use more sophisti-cated numerical techniques, such as the Newton-Raphsonapproach. However, this approach would require more com-putation overhead. Typical countercurrent simulations re-quire no more than 5-15 iterations for a four- or five-compo-nent mixture, and such a case takes a fraction of a secondwhen the simulator is run using a personal computer.
Cocurrent jlow
Figure 3b depicts ideal cocurrent flow in a membrane unit.The modeling approach described for countercurrent flow isfollowed.
For ideal cocurrent flow, a component j mass balance onstage k is given by
and the mass flow of component j leaving stage k due topermeation is
(24)
Equation 24 is rewritten to give the following expression forthe permeate flow of component j leaving stage k
Equation 25 is combined with Eq. 23 to give an expressionfor the residue flow leaving stage k
$,k=
In applying these coefficients to the first stage (that is, k = N),VN is the sweep flow rate. For component j, Eq. 26 is solvedbeginning at the feed end of the module (k = N) whereand vj k + l
4, k+ 1
are known. The calculation proceeds from stage tostage Until the residue end of the permeator is reached, Thecocurrent case does not require the tridiagonal matrix solu-tion outlined for countercurrent flow. Initial guesses for theoverall flow rates and pressures on each stage are providedfrom the cross-flow model. The calculation of the flow ratesof each component on each stage from Eq. 26 provides im-proved estimates for the total flow rates and pressures, andthe calculation is repeated until the change in component flow
Table 1. Module and Process Simulation Parameters
Air Temaq I.32Separation Separation Separation
FeedFeed Pres. (bara)Permeate Pres. (bara)Feed Temp. CC)Fiber OD/ID ( pm)Fiber Length (m)Fiber Pot Length (m)No. of FibersActive Memb. Area (m2)*
Bore10
140
300/150
0:1300,ooo
226
Shell10
125
300/1501
0.1350,000
264
Shell76.9/42.442.4/7.9
503oo/l50
O!l500,000
377
*Active membrane area is calculated as n (Fiber ODxFiber Length-2(Fiber Pot Length)XNumber of Fibers). The module configuration cor-responds to the active separating layer on the exterior of the fiber. Thefibers are assumed to be potted on each end.
rates is within a defined tolerance limit. This successive ap-proximation procedure is repeated until
4l-lVl< 1oV
where AVl is the change in total permeate flow from oneiteration to the next.
Results and DiscussionAir separation
The simulation results described in the remainder of thisstudy are for countercurrent contacting. The conditions usedfor the membrane module are presented in Table 1. For theair separation case, permeances of the membrane to air gasesand physical property inforrnation related to the air gas com-ponents are recorded in Table 2. The membrane permeancesare selected to be similar to thoie which might be observedwith a polysulfone membrane with an effective separatinglayer thickness of approximately 0.1 pm (Anonymous, 1995).In these simulations, the air fed to the module is modeled asa four component mixture of 78.41% nitrogen, 20.84% oxy-gen, 0.03% carbon dioxide, and 0.72% water (Felder andRousseau, 1986). The water composition corresponds to satu-ration at 4O’C and ten atmospheres total pressure.
The generation of purified Nz is an important industrialapplication of membranes. Several recent patents describe thedevelopment of membrane module designs with integral in-ternal purge to simplify the implementation of permeate
Table 2. Permeance and Feed Composition for AirSeparation Simulations
Air Separation
Component Feed Mole FractionPermeance
(GPU)*N2 0.7841 3.5702 0.2084 20
(332 0.0003 60I420 0.0072 1,000
*1 GPU = 10m6 cm3CSTPIAcmz*s*cm Hg) = 7.501 x 1OK” m3~STP~~rnz~s*Pa) = 3.346~ lo-l3 kmolAm2*s*PaI.
1294 June 1998 Vol. 44, No. 6 AIChE Journal

purging (Kalthod, 1996; Nicolas et al., 1995). Nicolas et al.teach a method to prepare a hollow-fiber membrane modulewith an internal purge valve that may be regulated to vary theamount of the residue or nonpermeate product that is intro-duced into the permeate stream as a purge (Nicolas et al.,1995) Kalthod teaches a method of permitting permeatepurge in a hollow fiber membrane module by shortening someof the hollow fibers in the hollow fiber bundle so that theydischarge feed gas directly into the permeate (bore side feed)or so that gas flows directly into the fibers without first per-meating through their walls (shell side feed) (Kalthod, 1996).In addition to drying air, Kalthod teaches that purging canimprove oxygen production at a fixed oxygen permeate pu-rity.
The effect of permeate purge on nitrogen purity andresidue recovery is presented in Figures 4 and 5 for two feedpressures. Residue recovery is the fraction of the feed flowthat exits the module in the residue stream. In these simula-tions, the purge stream is taken from the residue product.Residue recovery is based on residue flow after the purge gashas been removed from the residue stream. A purge level of10% implies that 10% of the residue gas exiting the moduleis introduced into the permeate stream on the residue end ofthe module. Feed flow rate is varied to generate thepurity/recovery curves presented in Figure 4. In all cases, asexpected, as flow rate is increased (which decreases the gascontact time with the hollow fibers in the module), residuerecovery increases (cf. Figure 5) and nitrogen purity de-creases (cf. Figure 4). That is, there is a tradeoff betweenproduct purity and recovery. For any recovery and any purgelevel, nitrogen purity increases with increasing feed pressure.(In fact, as discussed in more detail later, it is more appropri-ate to discuss feed pressure changes in terms of pressure ra-tio, which is the ratio of feed pressure to permeate pressure.However, when permeate pressure is constant, any change infeed pressure results in a proportional change in pressureratio, so feed pressure effects in these air separation simula-
1.0
0.95
za 0.80t
0 % P u r g e -5 bar
0.75’ I ’ ’ ’ ’ ’ ’ ’ I ’0 20 40 60 80 100Overall Residue Recovery (%)
Figure 4. Effect of permeate purge and feed pressureon nitrogen purity in residue.Solid lines correspond to a feed pressure of 5 bara, anddashed lines correspond to a feed pressure of 10 bara.
5 bar
1 L II In 11 11 1 11 10 1 2 3 4 5 6 7
Feed Flow/Area (m3(STP)/(m2 hour))
Residue recovery and feed flow as a functionof permeate purge and feed pressure.
tions may be discussed either in terms of feed pressure orpressure ratio.) At higher feed pressure, the driving force formass transfer is increased and, therefore, the nitrogen purityof the residue is enhanced. From Figure 5, as purge fractionincreases at fixed feed pressure and feed flow, overall inerts(that is, residue) recovery decreases, and as upstream pres-sure increases at fixed purge rate and fixed feed flow, theoverall residue recovery is lower. Of course, the lower recov-ery is accompanied by higher purity as shown in Figure 4.
For producing purified nitrogen, the most advantageousoperating conditions are those which yield both high NZ pu-rity and high NZ recovery in the residue. As the fraction ofthe residue gas used for permeate purging increases, there isan unfavorable shift in the nitrogen purity/recovery tradeoffcurve (cf. Figure 4). This trend is presented explicitly in Fig-ure 6. In this figure, the effect of permeate purge on residuerecovery at fixed purity is presented using two definitions ofrecovery, R”/F and RI/F. These symbols are depicted in Fig-ure 7. Recovery R”/F is defined based on the residue flowrate at the exit from the hollow-fiber separator. On the otherhand, the overall system recovery R’/F is defined based onthe residue flow rate after removing the purge stream andrepresents the amount of residue gas which would be avail-able from this module for downstream uses. In Figures 4 and5, overall system recovery RI/F is used.
As expected, purging the permeate of a hollow-fiber mem-brane separator acts to increase the driving force for masstransfer and higher recovery at a fixed residue purity is ob-served when recovery is based on residue flow rate at themodule exit R”/F (Li et al., 1990; Pan and Habgood, 1974;Wang et al,, 1992). However, the overall system recovery R’/Fdecreases due to consumption of potential product gas forthe purge (or sweep) stream. As the permeate purge fractionincreases, residue recovery at a fixed residue purity wouldincrease, all other factors being equal. However, when theresidue stream is used as the source for the purge gas, theperformance of the module is penalized by the removal ofthe purge gas from the residue product. The results in Figure
AIChE Journal June 1998 Vol. 44, No. 6 1295

’ 95% Purity
/98% Purity
LLk . . . . . .~.-...-..A........A........
0 2 4 6 8 10Purge (% of residue flowrate)
Figure 6, Effect of permeate purge on residue recoveryat fixed purity.
4 indicate that the removal of the purge gas from the residuestream does not provide a sufficient increase in residue re-covery in the module to offset the amount of product usedfor the purge. As a result, overall system residue recoveryRI/F at fixed purity is reduced by purging.
The influence of upstream pressure on inerts recovery as afunction of purge fraction is presented in Figure 8. At allpurity and purge values considered in Figure 8, recovery ishigher at higher feed pressure or, equivalently, at higherpressure ratio. Based on the ratio of OZ and NZ permeancesin Table 2, the O/N2 selectivity is 5.6. The results in Figure8 were generated at pressure ratios of 5 and 10, values whichbracket the membrane selectivity. As demonstrated by Bakerand Wijmans (1994), permeate composition increases with in-creasing pressure ratio and is most sensitive to pressure ratiowhen selectivity and pressure ratio have similar values. Thus,higher feed pressures increase the efficiency of separation byincreasing the pressure ratio, which translates to higher re-covery at fixed purity or higher purity at fixed recovery.
The calculations summarized above also yield informationabout the permeate purity and recovery. The effect of feedpressure and purge fraction on oxygen purity and permeaterecovery is presented in Figure 9. Like the nitrogen results,operating at higher pressure improves oxygen purity at a fixedpermeate recovery, and purging the permeate with residuegas dilutes the permeate product and results in unfavorabletradeoffs on the purity/recovery map presented in Figure 9.4t low permeate recovery values ( < 5% without purging and< 30% with 10% purging), oxygen purity decreases as recov-
Figure 7. Definitions of recovery for cases with perme-ate purge.
50
.*....-............
40
30.*.............-...
200 2 4 6 8 10Purge (% of residue)
Figure 8. Effect of permeate purge on residue recoveryRIF at fixed nitrogen product purity and fixedfeed pressure.
ery decreases. With a tubeside feed module, at very lowpermeate recoveries, feed flow rates are very high and thetransmodule pressure drop in the bore of the hollow fibersbecomes large. For example, at 5% permeate recovery, a feedpressure of 10 atmospheres and no purging, the pressure atthe residue end of the fibers is only 8.7 atmospheres, a 13%decrease relative to the feed pressure. This large pressuredecrease along the length of the fiber results in a lower aver-age driving force for mass transfer which, in turn, leads tolower oxygen purity in the permeate. For cases with purge,the decrease in purity with decreasing permeate recovery (thatis, increasing feed flow rate) is exacerbated by the tendencyof the higher purge flow rates at higher feed flow rates todilute the permeate. Of course, as shown in Eq. 21, the feed
!?! 0.308E$ 0.25n
0% Purge, 10 bar
0.20’ ’ ’ a ’ I ’ I ’ I ’0 20 40 60 80 100
Overall Permeate Recovery (%)
Figure 9. Effect of permeate purge and feed pressureon permeate oxygen purity.
1296 June 1998 Vol. 44, No. 6 AIChE Journal

to residue pressure drop is a strong function of fiber innerdiameter, and values used for this example are believed to bereasonable based on information describing the state of theart for hollow fibers.
Permeate purging can be used to assist the removal of lowconcentrations of highly permeable impurities in a feed gasmixture. The use of permeate purging to reduce requiredmembrane area for such applications has been described ingeneral (Pan and Habgood, 1974) and for the removal of CO2from sealed life support systems such as submarines and spacecapsules (Li et al., 1990). Membrane-based air drying is prac-ticed using permeate purging to enhance the rate of removalof water from the feed gas (Wang et al., 1992). The followingsimulation of air drying demonstrates the effect of purge rateon water removal from air. Figure 10 presents the residuestream dew point temperature as a function of purge fractionfor various nitrogen residue purity values and two values ofwater permeance. The dew point temperature decreasesmonotonically with increasing purge fraction. As the purgegas is obtained from the residue stream, an increase in purgefraction increases the feed flow to the module to maintain afixed nitrogen purity, and this increase in feed flow rate de-creases the residence time of gas in the module, which tendsto increase the concentration of water in the residue and,therefore, the dew point of the residue gas. The residue purgegas also increases the driving force for transport of water,and this tends to decrease the dew point temperature of theproduct residue gas. The results in Figure 10 suggest that thelatter effect is more important than the former, and purgingeffectively decreases the dew point temperature at fixed ni-trogen purity.
High permeability components present in low concentra-tions, such as water in air, are particularly sensitive to con-centration polarization (or mass-transfer limitations) and
2Oy--J___! _ I ’ ’
0
0 2 4 6 0 10Purge (% of residue)
Figure 10. Effect of permeate purging on residue dewpoint temperature at fixed nitrogen residuepurity.Solid lines correspond to simulations with water perme-ante of 1,000 GPU and the dashed lines represent simula-tions with a water permeance of 350 GPU. Other moduleand membrane parimeters are recorded in Tables 1 and 2.
shell-side fluid flow maldistribution (Wang et al., 1992). Thesefactors act to decrease the efficiency of the separator for re-moving such components from the feed gas. To provide arough qualitative guide of the influence of such effects on theresults just presented, we have recomputed these results us-ing an effective water permeance of 350 GPU rather than1,000 GPU. These results are also presented in Figure 10 asdashed lines. As expected, the residue dew point is higherwhen the water permeance is lower. Moreover, the effect ofpurging on residue dew point temperature is weaker whenwater permeance is lower. For example, at 86% NZ purity,10% purge decreases the dew point by nearly 5O’C from-41.6’C to - 89.7’C. In contrast, when the effective waterpermeance is only 350 GPU, the dew point decreases by lessthan 20°C, from - 15.0°C to -34.1°C, as the purge is in-creased from 0 to 10% of the residue flow rate at 86% residueNZ purity.
Hydrogen separation
Hydrotreatment is a common unit operation in refineries.In this process, petroleum intermediates are contacted withhydrogen under appropriate conditions to reduce the sulfur,nitrogen, metals, asphaltene, and carbon residue content ofthe feedstock. This process requires substantial amounts ofhydrogen gas, and much of the excess hydrogen is availablefor recycle. Membranes are often used to purify the recycledhydrogen. The major impurities are light hydrocarbons. Thecomposition of a typical feedstream to a membrane hydrogenpurification from a hydrotreater is given in Table 3. For thesimulations described below, the membrane permeance val-ues are roughly those expected for a polysulfone membranewith an 0.1 pm thick effective separating layer (Anonymous,1995).
The hydrogen product produced by the membrane is in thepermeate stream, so the purified hydrogen is available atlower pressure than the feed. The permeate pressure is animportant process variable since the utility of the hydrogenproduced by the membrane process depends, in part, on thepressure at which the hydrogen is produced. Generally, thehydrogen produced in the permeate stream is more valuableor useful if it is produced at higher permeate pressure tominimize or avoid recompression costs.
To illustrate the effect of pressure or, more appropriately,pressure ratio on hydrogen purity and recovery, two cases arepresented in Figure 11. The simulation parameters used forthis separation are provided in Tables 1 and 3. Feed flowrate is varied to obtain results at various purity/recovery val-ues. In both cases, the pressure difference between the feed
Table 3. Permeance and Feed Composition for HydrogenSeparation Simulations
Component
H2
c2H4
CHJC2%
c3H8
Hydrogen Separation
Feed Mole Fraction
0.6500.0250.2100.080
0.035
Permeance(GPU)
1003.032.862.001.89
AIChE Journal June 1998 Vol. 44, No. 6 I297

70
65 I , I 1 I , I , I0 20 40 60 a0 100
HZ Recovery (%)
Figure 11. Influence of pressure ratio on hydrogen pu-rity/recovery characteristics in hydrotreaterapplications.The pressure difference between the feed and permeatepressure is maintained constant at 34.7 bar (500 psi). Inthis figure, ppressure (Pa f
is the feed pressure, and pp is the permeate.
and permeate streams is maintained constant at 34.7 bar (500psi). However, the ratio of feed to permeate pressure is quitedifferent for the two cases, 5.3 when the feed pressure is 42.4bar and 1.8 when the feed pressure is 76.9 bar. When thepressure ratio is higher, hydrogen recovery is higher at eachhydrogen purity or, alternatively, hydrogen purity in the per-meate is higher at any recovery even though absolute feedpressure is lower. However, this improvement in separationperformance comes at a penalty, since the permeate pressureis lower in the higher-pressure ratio case and would, there-fore, result in more recompression costs if the HZ needed tobe supplied to a downstream process or recycled at, for ex-ample, the feed pressure. These results suggest a complexeconomic tradeoff between compression costs, hydrogen re-covery, and hydrogen purity that is probably rather unique toeach hydrogen application.
Concentration profiles for two components, hydrogen andmethane, are presented as a function of axial position in themodule in Figure 12. In this figure, z/L is the normalizedaxial coordinate in the module, and L is the active fiberlength, which is the total fiber length (1 m) less than the lengthof the potted ends of the fibers (0.2 m). The residue end ofthe module is at z = 0, and t = L corresponds to the feedand permeate end of the module (see Figure 1). The concen-tration profiles are presented for a case which exhibits ex-tremely high permeate recovery (94.6%). As expected, thecomposition of hydrogen decreases rapidly from the feed endof the module (that is, z/L = 1) where most of the hydrogenis stripped from the feed and appears in the permeate. (Atthis high recovery, only about 20% of the module membranearea is efficiently used for HZ purification.) While this recov-ery is higher than one would typically find in industrial prac-tice, this case serves to illustrate the following two points.First, the composition of methane, a component of interme-
diate permeability in this mixture, exhibits a maximum withaxial position. Such maxima were not observed in the binarycase and prompted further simulation studies of a ternarymixture to probe the observed maxima in composition pro-files. Secondly, the hydrogen concentration on both the high-and low-pressure sides of the membranes becomes very smallnear the residue end of the fibers. In the region where thehydrogen concentration profile appears flat in Figure 12 (0 <z/L < 0.751, the hydrogen partial pressure is practically equalon both the high- and low-pressure sides of the fibers. Intests we ran using shooting methods to solve the governingdifferential equations, we found the numerical methods to beunstable and were unable to achieve convergence in suchcases. Therefore, this case also illustrates the robustness ofthe model for simulation conditions at very high recoverywhen an extremely permeable component is removed to suchan extent that the partial pressures on both the high- andlow-pressure side of the membrane become practically equal.One would expect this situation to occur rather frequently indehydration applications since water is usually much morepermeable than any other component in the mixture.
Model three component separation
A ternary case was selected for studies of the maxima incomposition profiles because this is the simplest case which,with constant permeability coefficients, can exhibit the max-ima in compositions seen in the five component refinery case.The simulation conditions are presented in Tables 1 and 4.We have selected an equimolar feed mixture with a maxi-mum selectivity of 50. Typical composition profiles are pre-sented in Figure 13 for a feed flow rate of 283.2 m3 (STP)/h(10,000 SCFH). The residue and permeate composition of themost permeable component (that is, component 1) decreasesas z/L (that is, distance from the residue end of the perme-ator) decreases since this component is most efficientlystripped from the feed. The residue and permeate composi-tions of component 3, the least permeable component, in-crease monotonically as z/L decreases, which reflects the
1298 June 1998 Vol. 44, No. 6 AIChE Journal
0.6
Hz P e r m e a t e d , 1
P, = 42.4 bar
% = 7.9 bar
Permeate: solid linesResidue: dashed lines
Residue0.2 0.4 0.6 0.8
Axial Position, z/L FeledPermeate
Figure 12. Hydrogen and ethylene concentration pro-files in hydrotreater application.In this figure, pf is the feed pressure, and p is the perme-ate pressure (Pa). The feed flow rate is 2g%.2 m3(STP)/h(10,000 SCFH), and the total permeate recovery is 94.4%.

Table 4. Permeance and Feed Composition for TernarySeparation Simulations
Component
Ternary Separation
Feed Mole FractionPermeance
(GPIJ)1 0.3333 5ocl2 0.3333 1003 0.3334 10
systematic enrichment of the residue stream in this compo-nent (due to selective removal of the other more permeablespecies) as distance from the feed end of the permeator in-creases. The residue and permeate compositions of compo-nent 2, whose permeability is intermediate between that ofthe other components, exhibit a maximum. In a mixture oftwo components, the composition of the more permeablecomponent always increases in the permeate and residue asthe distance from the closed (that is, residue) end of the fibersis increased and U& uema for the less permeable component.In a three-component mixture, a very permeable componentwill be largely removed from the feed in a relatively shortdistance from the feed end of the fibers, which will increasethe composition of the remaining two components in theresidue. Then, the composition of the second most perme-able component must begin to decrease as this component isselectively removed from the residue, and the composition ofthe least permeable component will continue to increase overthe entire length of the fibers. In this way, in mixtures with atleast three components, maxima in the compositions of com-ponents of intermediate composition may be observed. Stag-ing of membrane modules in series could be used to harvestcomponents of intermediate permeability at maximum con-centration.
ConclusionsA model for multicomponent gas separation using a hol-
low-fiber contactor is presented. The model permits simula-
1
0.8
.! 0 . 6
.Z$Q
g 0.40
0.2
00 0.2 0.4 0.6 0.8
Residue Axial Position, z/L FJedPermeate
Figure 13. Residue (xi) and permeate (yi) concentra-tion profiles in ternary case.
tion of cocurrent, countercurrent, and cross-flow contactingpatterns with permeate purging (or sweep). Examples of useof the model are provided by three separate case studies. Inair separation, permeate purging using a fraction of theresidue stream is shown to be an inefficient means to im-prove nitrogen or oxygen purity. However, for air drying,purging the permeate with a small fraction of the residuestream can markedly reduce the dew point of the residuestream. In 3 + component mixtures, maxima in the composi-tion of components of intermediate permeability may be ob-served.
AcknowledgmentsThe authors gratefully acknowledge partial support of this work
from the National Science Foundation (CT!%9257911 (NSF YoungInvestigator Award-BDF)). One of the authors (BDF) benefited sig-nificantly from conversations with Dr. Steve Auvil of Air Productsand Chemicals, Inc., Allentown, PA, regarding membrane-based airdrying.
NotationF= total feed flow rate &mol/s)
A Lk = difference in total residue flow rate on stage k between twoiterations &mol/s)
R” = total residue flow rate from module &mol/s)R’ = total residue flow rate after removing purge stream &mol/slv= total permeate flow rate (kmol/s)
Avk = difference in total permeate flow rate on stage k between twoiterations (kmol/s)
x~, = feed mole fraction of component ji = axial distance along the active section of the hollow fibers
measured from the residue end of the module, m
Literature CitedAnonymous, Petmeability and Other Film Propetiies, Plastics Design
Library, New York (1995).Baker, R. W., and J. G. Wijmans, “Membrane Separation of Organic
Vapors from Gas Streams,” Polymeric Gas Separation Membranes,D. R. Paul and Y. P. Yampol’skii, eds., CRC Press, Boca Raton,FL, p. 353 (1994).
Baker, R. W., N. Yoshioka, J. M. Mohr, and A. J. Khan, “Separationof Organic Vapors from Air,” J. Memb. Sci., 31, 259 (1987).
Barrer, R. M., J. A. Barrie, and N. K. Raman, “Solution and Diffu-sion in Silicone Rubber: I. A Comparison with Natural Rubber,”Polymer, 3, 595 (1962).
Basaran, 0. A., and S. R. Auvil, “Asymptotic Analysis of Gas Sepa-ration by a Membrane Module,” AIChE J., 34, 1726 (1988).
Bird, R. B., W. E. Stewart, and E. N. Lightfoot, Transport Phenom-ena, Wiley, New York (19601.
Bolhnger, W. A., S. P. Long, and T. R. Metzer, “Optimizing Hydro-cracker Hydrogen,” Chem. Eng. Prog., SN51, 510984).
Boucif, N., S. Majumdar, and K. K. Sirkar, “Series Solutions for aGas Permeator with Countercurrent and Cocurrent Flow,” Ind.Eng. Chem. Fundam., 23, 470 (1984).
Felder, R. M., and R. W. Rousseau, Elementary Principles of Chemi-cal Processes, 2nd ed., Wiley, New York (1986).
Freeman, B. D., and I. Pinnau, “Separation of Gases Using Solubil-ity-Selective Polymers,” Trends in Poly. Sci., 5, 167 (1997).
Geankoplis, C. J., Transpoti Processes and Unit Operations, 3rd ed.,Prentice Hall, Englewood Cliffs, NJ, p. 921 (1993).
Ghosal, K., and B. D. Freeman, “Gas Separation Using PolymerMembranes: An Overview,” PoZy. for Adu. TechnoZ., 5, 673 (1994).
Graham, T., “On the Absorption and Dialytic Separation of Gasesby Colloid Septa: I. Action of a Septum of Caoutchouc,” Phil. Msg.,32, 401 (1866).
Kalthod, D. G., “Production of Enriched Oxygen Gas Stream Utiliz-ing Hollow Fiber Membranes,” U.S. Patent 5,500,036, assigned toAir Products and Chemicals, Inc. (1996).
King, C. J., Separation Processes, 2nd ed., McGraw Hill, New York, p.466 (1980).
AIChE Journal June 1998 Vol. 44, No. 6 1299

Kowali, A. S., S. Vemury, K. R. Krowidi, and A. A. Khan, “Modelsand Analyses of Membrane Gas Permeators,” J. Memb. Sci., 73, 1(1992).
Krowidi, K. R., A. S. Kowali, S. Vermury, and A. A. Khan, “Ap-proximate Solutions for Gas Permeators Separating Binary Mix-tures,” J. Memb. Sci., 66, 103 (1992).
Li, K., D. R. Acharya, and R. Hughes, “Membrane Gas Separationwith Permeate Purging,” Gus Sep. und Putif., 4(2), 81 (1990).
Lipscomb, G. G., “Design of Hollow Fiber Contactors for Mem-brane Gas Separations,” l7ze 1996 Memb. Technol. Rev., D. Mulloy,ed., Business Communications Co., Norwalk, CT, p. 23 (19961.
Maclean, D. L., C. E. Prince, and Y. C. Chae, “Energy Saving Modi-fications in Ammonia Plants,” Chem. Eng. Prog., 76, 98 (1980).
Morisato, A., H. C. Shen, S. S. Sankar, B. D. Freeman, I. Pirmau,and C. G. Casillas, “Polymer Characterization and Gas Permeabil-ity of Poly(l-Trimethylsilyl-1-Propyne) [PTMSP], Polfil-Phenyl-l-Propyne) [PPP], and PTMSP/PPP Blends,” J. PO&. Sci.: PoZy. Phys.Ed., 34, 2209 (1996).
Naylor, R. W., and P. 0. Backer, “Enrichment Calculations inGaseous Diffusion: Large Separation Factor,” AIChE J., 1, 95(1955).
Nicolas, P. S., B. Bikson, S. Giglia, and D. R. Thompson, “FluidSeparation Assembly Having an Purge Control Valve,“U.S. Patent5411,662, assigned to Praxair Technology, Inc. (1995).
Pan, C. Y., “Gas Separation by High-FhJx Asymmetric Hollow-FiberMembrane,” AIChE J., 32, 2020 (1986).
Pan, C. Y., and H. W. Habgood, “An Analysis of the Single-StageGaseous Permeation Process,” Ind. Eng. Chem., Fundam., 13, 323(1974).
Shindo, Y., T. Hakuta, H. Yoshitome, and H. Inoue, “CalculationMethods for Multicomponent Gas Separation by Permeation,“Sep.Sci. and Tech., 20, 445 (1985).
Smith, S. W., B. D. Freeman, C. K. Hall, and R. Rautenbach, “Ana-lytical Gas-Permeation Models for Binary Gas Mixture SeparationUsing Membrane Modules,” J. Memb. Sci., 118, 289 (1996).
Spillman, R. W., “Economics of Gas Separation Membranes,” Chem.Eng. Prog., 85(1), 41 (1989).
Wang, K. L., S. H. McCray, D. D. Newbold, and E. L. Cussler, “Hol-low Fiber Air Drying,” J. Memb. Sci., 72, 231 (19921.
Weller, S., and W. A. Steiner, “Fractional Permeation ThroughMembranes,” Chem. Eng. Prog., 46, 585 (1950).
Zolandz, R. R., and G. K. Fleming, “Gas Permeation,” MembraneHandbook, W. S. W. Ho and K. K. Sirkar, eds., Van NostrandReinhold, New York, p. 17 (1992).
Appendix: Mechanical Energy Balance to Calcu-late Shell Side Pressure Drop
The Hagen-Poiseuille relation is most often used to calcu-late shell side pressure variations in hollow fiber gas separa-tion simulations (Kowali et al., 1992; Lipscomb, 1996). Strictlyspeaking, this relation (Eq. 21) is only valid for steady-state,laminar, incompressible flow of a Newtonian fluid in a circu-lar pipe with impermeable walls. In this appendix, we use thesteady-state mechanical energy balance to derive a more gen-eral result for pressure changes in a permeable hollow fiberof constant radius &, through which a compressible gas flows.This result is then used to identify the criteria for which theHagen-Poiseuille relation would not provide an adequate de-scription of the pressure distribution in the hollow fiber.
Figure Al presents a cross-sectional view of stage k of ahollow fiber of length AZ. In this figure, high-pressure gaspermeates from the interior to the exterior of the fiber. Thiscorresponds to a bore side feed case. Modification of thederivation below for shell side feed is obvious.
The steady-state, isothermal mechanical energy balance forgas in plug flow through the section of hollow fiber in FigureAl is given by (Bird et al., 1960)
yk+l
Figure Al. Cross-sectional view of stage k section ofhollow fiber.
L
where Zk+l, iYk, and Z,,, are the average velocities of gas en-tering stage k (m/s) from the previous stage, leaving stage kfor the next stage, and leaving stage k as a result of perme-ation through the wall of the hollow fiber. P0 is a referencepressure, p is the specific volume of the gas mixture (mykg),f is the Fanning friction factor, and AZ C = L/N) is the lengthof stage k. As the gas flow rates encountered in the simula-tions discussed in this article are in the laminar flow regime,the friction factor is given by (Bird et al., 1960)
If situations other than laminar flow are of interest, the ap-propriate relation between the friction factor and theReynolds number may be introduced as needed. We restrictour analysis to ideal gases, for which the specific volume isgiven by (Bird et al., 1960)
where M is the mole-fraction weighted molecular weight(kg/kmol) of the gas mixture, T is the absolute temperature(K), R is the gas constant [m3* Pa&nol) l K], and P is pres-sure &mol/s). This assumption may, of course, be relaxed byintroducing another equation of state to describe the rela-tionship between temperature, pressure, and gas specific vol-ume.
The average axial velocity may be written as follows
(A4)
where A is the cross-sectional area of the fiber (7rRf).Inserting Eqs. A4, A3, and A2 into Al, carrying out the
required integrations, and combining terms, the following ex-
1300 June 1998 Vol. 44, No. 6 AIChE Journal

pression, which describes the pressure distribution in the boreof the hollow fibers, is obtained
PLk+tl n - = 8Pmix ‘k Lk m’ Uk/W2
P---+_-
2l Lk
Lkx[; p[L
k + l 2M P;k
‘k pLk- - -2 M _2[Lk+l-Lkl
k + l P wdLk+ 1
)]+Evw ,$+I
The first term on the righthand side of Eq. A5 represents thecontribution of viscous forces to pressure changes in the fiber,the second term corresponds to the effect of gas compress-ibility on pressure changes, and the last term describes theimpact of loss (or gain) of gas due to permeation of gasthrough the fiber walls in bore side (or shell side) feed.
If the second and third terms on the righthand side of Eq.M are negligible, then Eq. A5 reduces to the Hagen-Poiseuille relation in Eq. 21. Equation A5 may be used inplace of Eq. 21 to compute the pressure profile in each stageof the hollow fiber module. Unlike the Hagen-Poiseuilleequation, Eq. A5 requires an iterative solution procedure. TheHagen-Poiseuille relation should provide an excellent initialguess for the iteration process.
In the following sections, we derive expressions for theconditions under which gas compressibility and gas loss dueto permeation through the hollow fibers are negligible rela-tive to viscous forces. The results are expressed in terms ofdimensionless numbers, which can easily be calculated to de-termine the relative importance of each term in Eq. A5.
Influence of Gas Compressibility on PressureProfile
To determine the criteria under which gas compressibilityeffects are insignificant, we first simplify Eq. A5 We neglectthe influence of gas loss (or gain) through the permeable fiberwalls (that is, we neglect the last term in Eq. A5). We thenconsider a SeCtiOn Of fiber short enough so that Lk = Lk+ land that the lefthand side of Eq. A5 may be expanded in aTaylor series to give
g&-&kAPz--RTM ( L&!l)2 P 2
Rf Az-TT- Yl- 2cLk D 11P
6461Lk+l
where the pressure change across the section of the hollowfiber AP is AP = PLk - PLk+l. When the section of the hol-low fiber is short, the term in brackets on the righthand sideof Eq. A5 may be expanded in a Taylor series as follows
P 2I- L!i
( 1
AP- =__2_P
Lk+lP
Lk+l
(A7)
Inserting Eq. A7 into A6 and rearranging yields
AP=-8 &ni$k/Rf
I_RTM(Lk/A)2 ‘=16481
pLkpLk + 1
AIChE Journal June 1998
Clearly, gas compressibility effects will be negligible when thefollowing criterion is met. (For the purpose of this analysis, itis appropriate to introduce the approximation: PLk+l = PLk.)
‘?kR’I%&!,k/‘/i)2
2s 1 (A91
In the simulations described in this article, a high value offeed gas flow rate to a module containing 300,000 fibers wouldbe 283.2 m3(STP)/h (10,000 SCFH). This corresponds to amaximum flow rate per fiber ,!,k of 2.62 X 10h7 m3 (STP)/s or1.17~ 10e8 kmol/s. If the fibers have an inside radius of 75x lo-’ m, the cross-sectional area A is 1.77X lo-’ m2. Thetemperature is 323 K, the highest used in our simulations,the pressure is one bara (the lowest value used in our simula-tions), and the gas molecular weight is 44 kg/kmol, the high-est value used in the simulations. The flow rate per unit areaLk/A is 0.661 kmol/(m20 s). With these values, the numericalvalue of the term in Eq. A8 is 200, which is much greaterthan one. The values used in this example were selected toprovide a conservative (that is, low) value of the term in Eq.A9. This result means that viscous effects are 200 times moreimportant than gas compressibility effects on the axial pres-sure profile for this case. Therefore, for all of the cases whichwe have considered, gas compressibility effects are negligible.
Influence of Fiber Wall Permeability on PressureProfile
To evaluate the influence of fiber wall permeability on thepressure profile, we use the approach outlined in the previ-ous section, that is, we evaluate the importance of the perme-able fiber contribution to Eq. A5 relative to that of viscousforces. Neglecting the gas compressibility term and choosinga short enough section of fiber such that the Taylor seriesexpansion of the lefthand side of Eq. A5 is valid, we obtain
AP 8/~,,,~ i& ,!Jk-AZ-&;
M k + l - Lk]-=---
PLk ‘? ‘,!Q ‘k+l L
(Al01k + l
The average velocitydue to permeation is
of gas exiting or entering the fiber wall
where Aw is the active area for permeation through the fiberwall and is taken to be 27rR0Az, consistent with Eq. 1 andthe fact that the separation membrane is typically on the out-side of the hollow fiber. The difference in flow rate at theentrance and exit of the fiber is due to permeation throughthe fiber wall and, using Eq. 8, can be written as follows
L k + l - Lo = Aw ~ ~j,k 6413j = l
For convenience, we define the pressure-normalized totalpermeance Q [krnol/(m2+ s l Pa)] as follows
Vol. 44, No. 6 1301
Introducing Eqs. All, A12, and Al3 into Eq. AlO, we obtain
n MRTQ3PLk
‘k+l 1 A Z (Al4)
Clearly, the influence of wall perrneation on the pressureprofile inside the fibers will be negligible when the first terminside the brackets of Eq. Al4 is much larger than the secondterm
8knix Ek Lk---%n MRTQ3PLk
R: pLk Lk+l L W5)k + l
Inserting Eq. A4 into Al5 and rearranging, we arrive at thecriteria for which permeation through the fiber walls makes anegligible contribution to the pressure profile inside the hol-low fibers
8 pti L; 1- - - -v2 R;&, M (QPLkj3
Z+ 1
As an example calculation representative of our simula-tions, we take the gas viscosity to be 2 x 10m5 Pa - s (0.02 cp)and the fiber inner radius to be the same as in the previousexample 75 X 10m6 m. The gas molecular weight is 2 kg/kmol,that of hydrogen, one of the most permeable componentsconsidered in our study. We use the maximum value of pres-sure 76.9 bara, and outer radius is 15OX lo-‘j m. The valueof Q is taken to be 100 GPU (3.346 x lo-” kmolAm2* s l Pa)),which corresponds to the maximum value of this function ifwe treat the feed gas to be pure hydrogen and allow the per-meate pressure to be zero. Basically, setting Q to this largevalue and using the highest feed pressure considered in thisstudy and zero permeate pressure maximizes the amount ofgas which can permeate through the fiber wall. With thesevalues, we find that the lefthand side of Eq. Al6 is 1.4 x 10⁷,which is much greater than one. This result means that pres-sure changes due to viscous losses are roughly 14,000,OOOtimes as large as pressure changes due to permeation throughthe fiber walls. Even at feed flow rates orders of magnitudeless than those considered in this example, the gas permeabil-ity effect on the bore side pressure profile would be negligi-ble.
In this Appendix, we have derived the criteria to deter-mine whether or not gas compressibility and fiber permeabil-ity influence the pressure profile in the bore of the hollowfibers. In all cases considered in this article, these effects arenegligible and the pressure distribution should, therefore, bewell-represented by the Hagen-Poiseuille equation.
Manuscript received Dec. 10, 1997, and revision received Feb. 26, 1998.
1302 June 1998 Vol. 44, No. 6 AIChE Jourual