Embed Size (px)
Citation preview
1
Modeling of PARAMETER-SF4 experiment
with SOCRAT/V1 code
Vienna, Austria, 2-5 September 2019
K.S. Dolganov, A.E. Kiselev, D.Yu. Tomashchik, T.A. Yudina
2
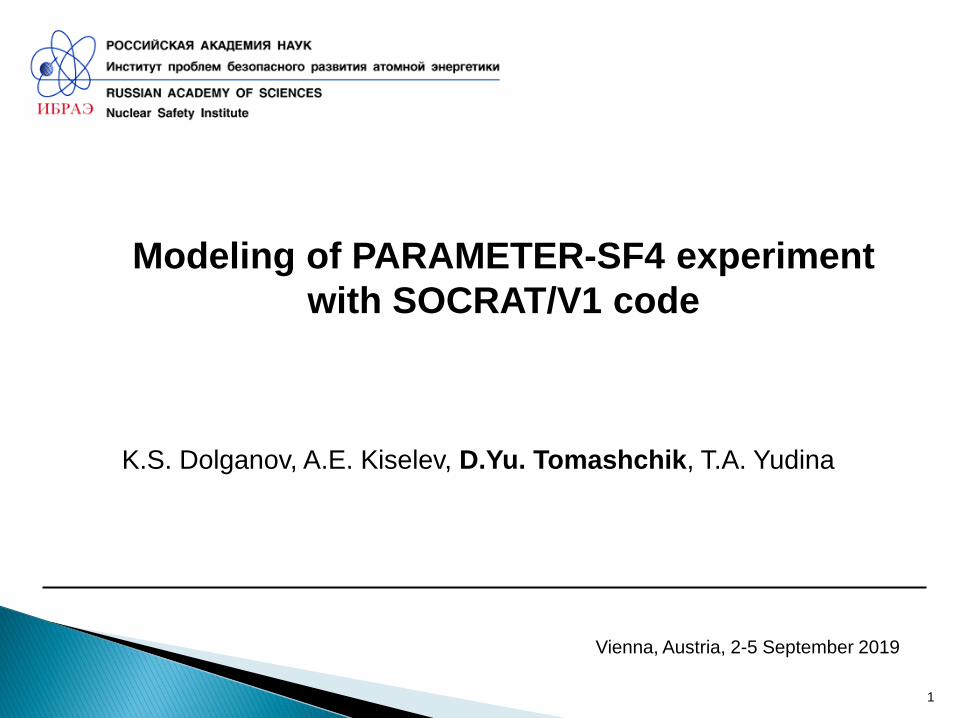
The experiment SF4 was conducted with the aim to study the
model of VVER-1000 FA under simulated conditions of a
severe accident including the stages of air ingress and
further quenching by the bottom flooding with water, namely:
❑study of the behavior of FA structural components (fuel
pellets and claddings, spacer grids);
❑study of the oxidation degree of FA structural components;
❑study of interaction and structural-phase changes in the
materials of FA model (fuel pellets and claddings);
❑study of the hydrogen release.
Aim of PARAMETER-SF4 experiment
3
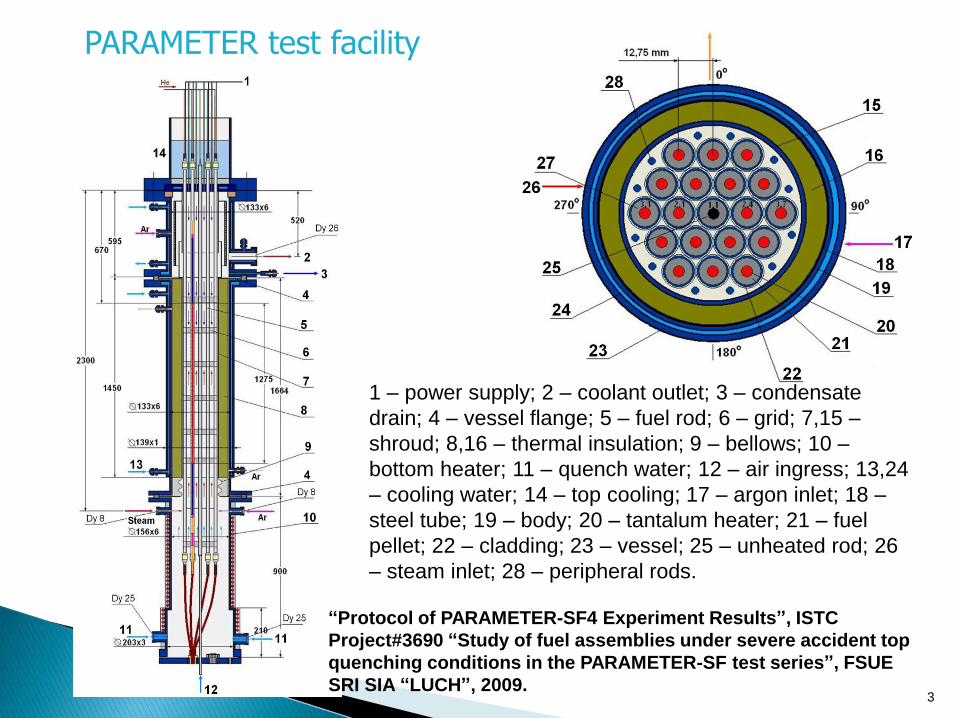
PARAMETER test facility
1 – power supply; 2 – coolant outlet; 3 – condensate
drain; 4 – vessel flange; 5 – fuel rod; 6 – grid; 7,15 –
shroud; 8,16 – thermal insulation; 9 – bellows; 10 –
bottom heater; 11 – quench water; 12 – air ingress; 13,24
– cooling water; 14 – top cooling; 17 – argon inlet; 18 –
steel tube; 19 – body; 20 – tantalum heater; 21 – fuel
pellet; 22 – cladding; 23 – vessel; 25 – unheated rod; 26
– steam inlet; 28 – peripheral rods.
“Protocol of PARAMETER-SF4 Experiment Results”, ISTC
Project#3690 “Study of fuel assemblies under severe accident top
quenching conditions in the PARAMETER-SF test series”, FSUE
SRI SIA “LUCH”, 2009.
4
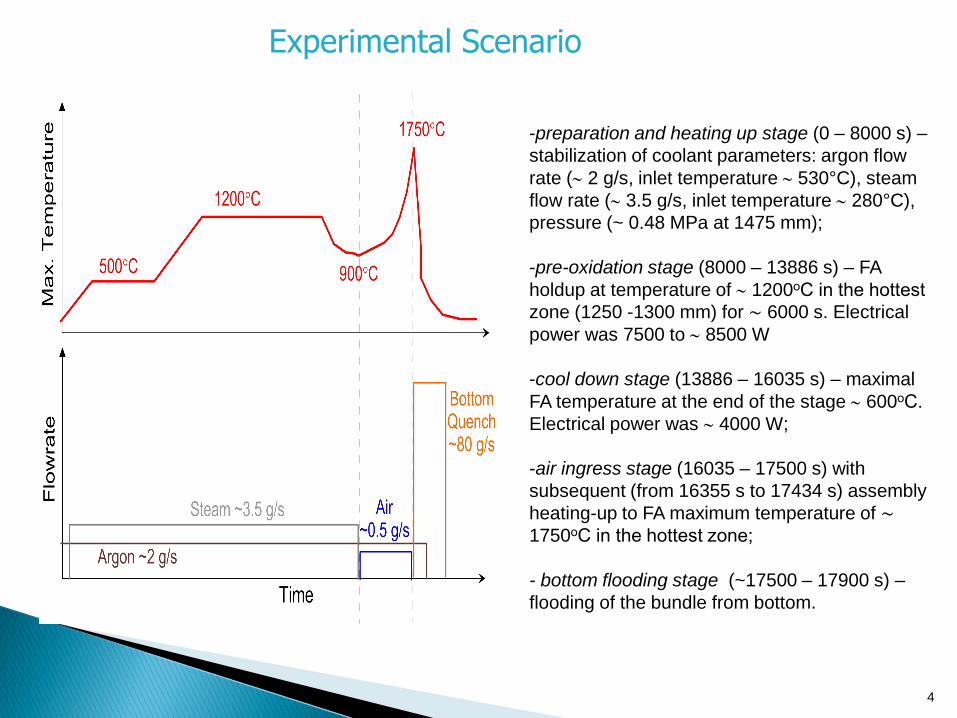
Experimental Scenario
-preparation and heating up stage (0 – 8000 s) –
stabilization of coolant parameters: argon flow
rate ( 2 g/s, inlet temperature 530°C), steam
flow rate ( 3.5 g/s, inlet temperature 280°C),
pressure (~ 0.48 MPa at 1475 mm);
-pre-oxidation stage (8000 – 13886 s) – FA
holdup at temperature of 1200оС in the hottest
zone (1250 -1300 mm) for ∼ 6000 s. Electrical
power was 7500 to 8500 W
-cool down stage (13886 – 16035 s) – maximal
FA temperature at the end of the stage 600оС.
Electrical power was 4000 W;
-air ingress stage (16035 – 17500 s) with
subsequent (from 16355 s to 17434 s) assembly
heating-up to FA maximum temperature of ∼1750оС in the hottest zone;
- bottom flooding stage (~17500 – 17900 s) –
flooding of the bundle from bottom.
5
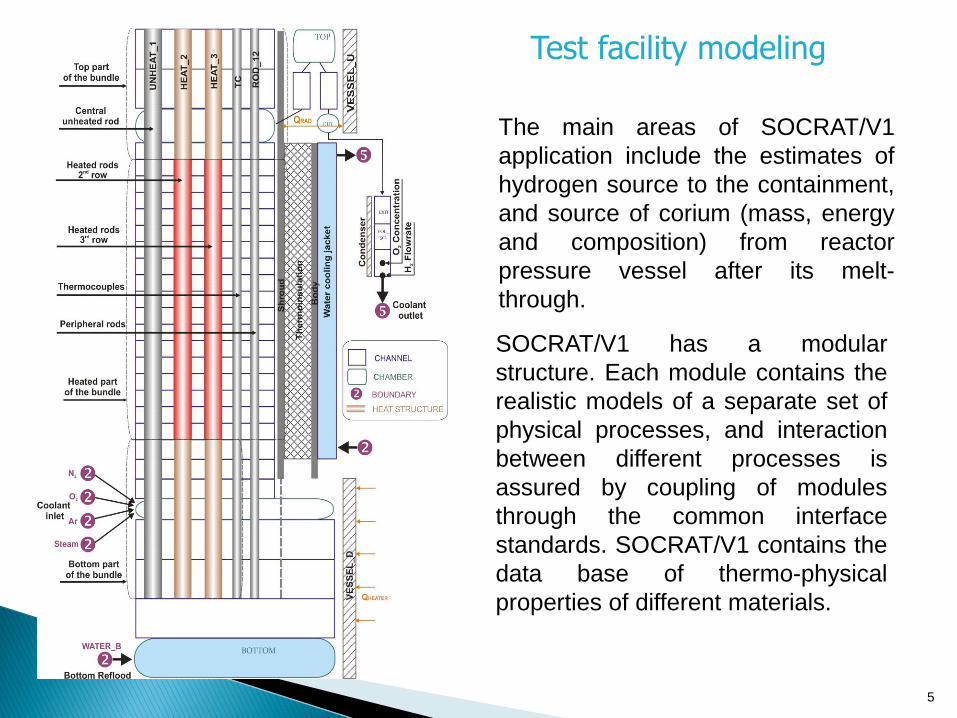
Test facility modeling
The main areas of SOCRAT/V1
application include the estimates of
hydrogen source to the containment,
and source of corium (mass, energy
and composition) from reactor
pressure vessel after its melt-
through.
SOCRAT/V1 has a modular
structure. Each module contains the
realistic models of a separate set of
physical processes, and interaction
between different processes is
assured by coupling of modules
through the common interface
standards. SOCRAT/V1 contains the
data base of thermo-physical
properties of different materials.
6
❑ 20 years Project (since 1999). Versions V1, V3
❑ One-through coupled modeling of SA at LWR reactors
❑ Validated on experimental data
System Of Codes for Realistic AssessmenT of severe accidents
SOCRAT description (1)
The code is essentially developed to model VVER NPPs but it
was also applied to simulate the severe accidents at integral-
type light water reactors, BWRs (Fukushima Daiichi) and
PWR reactors (TMI-2).
Bolshov, L.A., Dolganov, K.S., Kiselev A.E., Strizhov V.F., Results of SOCRAT code
development, validation and applications for NPP safety assessment under severe
accidents, Nuclear Engineering and Design, Volume 341, 2019, Pages 326-345.
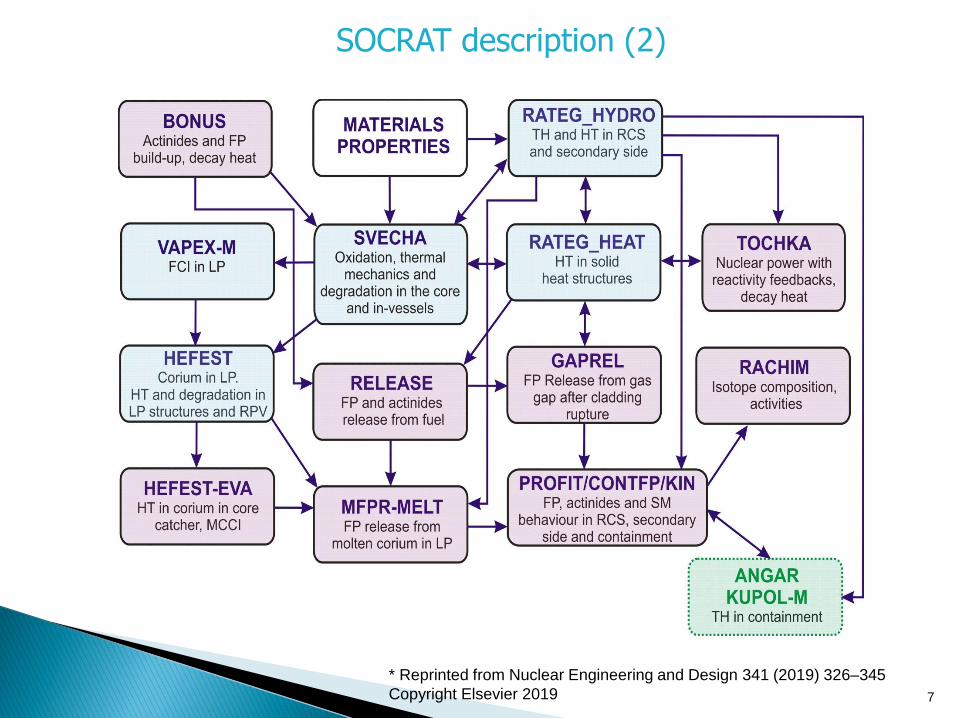
7
SOCRAT description (2)
* Reprinted from Nuclear Engineering and Design 341 (2019) 326–345
Copyright Elsevier 2019
8
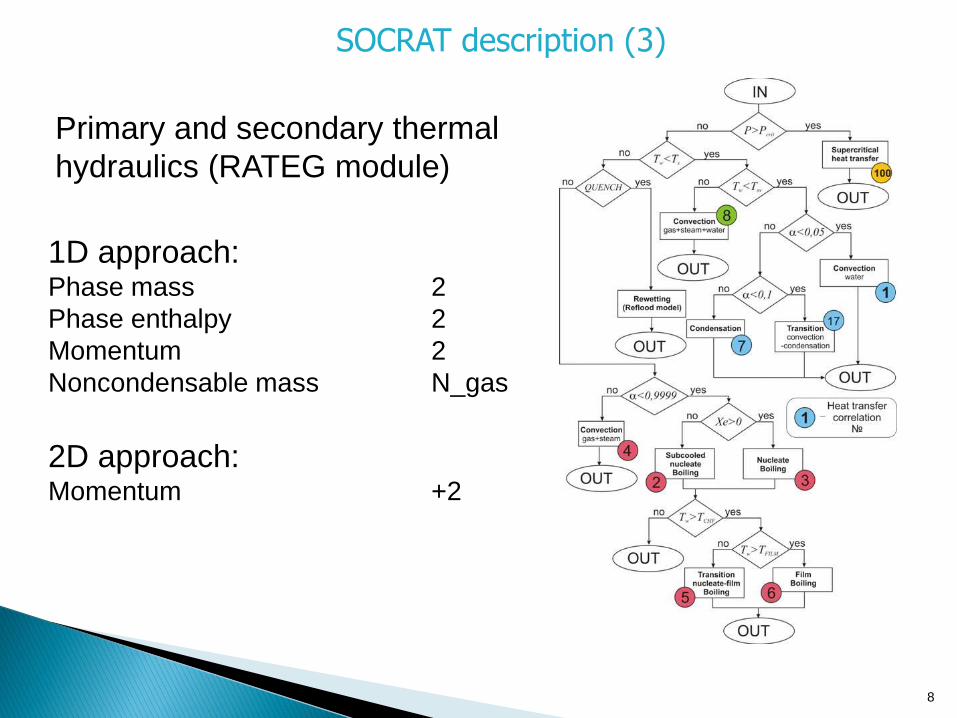
SOCRAT description (3)
Primary and secondary thermal
hydraulics (RATEG module)
1D approach:Phase mass 2
Phase enthalpy 2
Momentum 2
Noncondensable mass N_gas
2D approach:Momentum +2
9
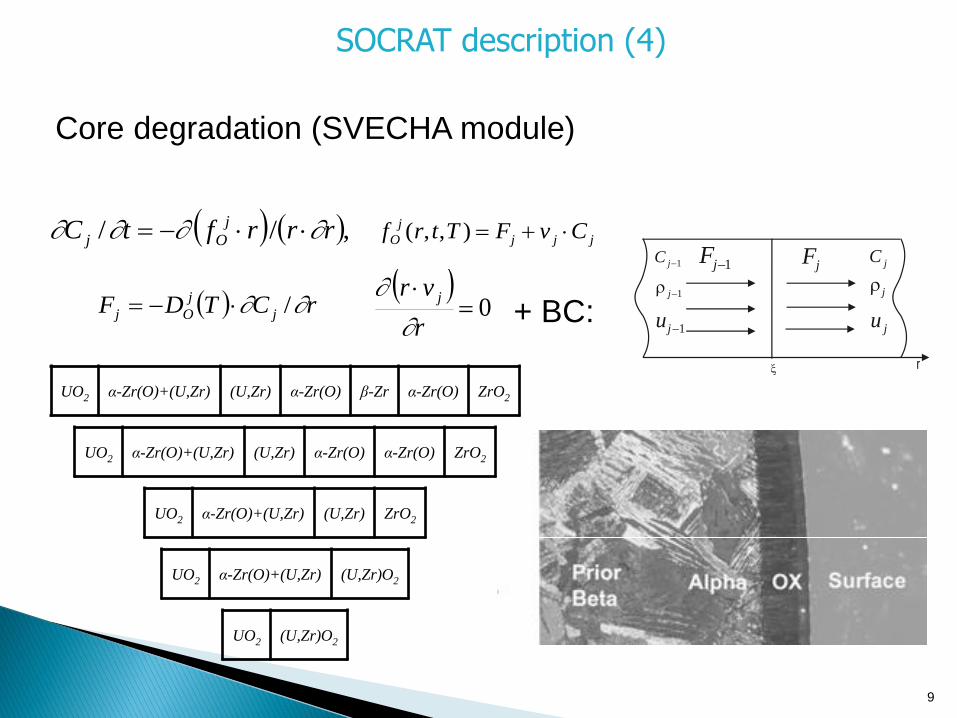
SOCRAT description (4)
( ) ( ),// rrrftC j
Oj −=
( )0=
r
vr j
jjj
j
O CvFTtrf +=),,(
( ) rCTDF j
j
Oj /−=
1−jFjF jC
j
ju
1−jC
1−j
1−ju
+ BC:
UO2 α-Zr(O)+(U,Zr) (U,Zr) α-Zr(O) β-Zr α-Zr(O) ZrO2
UO2 α-Zr(O)+(U,Zr) (U,Zr) α-Zr(O) α-Zr(O) ZrO2
UO2 α-Zr(O)+(U,Zr) (U,Zr) ZrO2
UO2 α-Zr(O)+(U,Zr) (U,Zr)O2
UO2 (U,Zr)O2
Core degradation (SVECHA module)
10
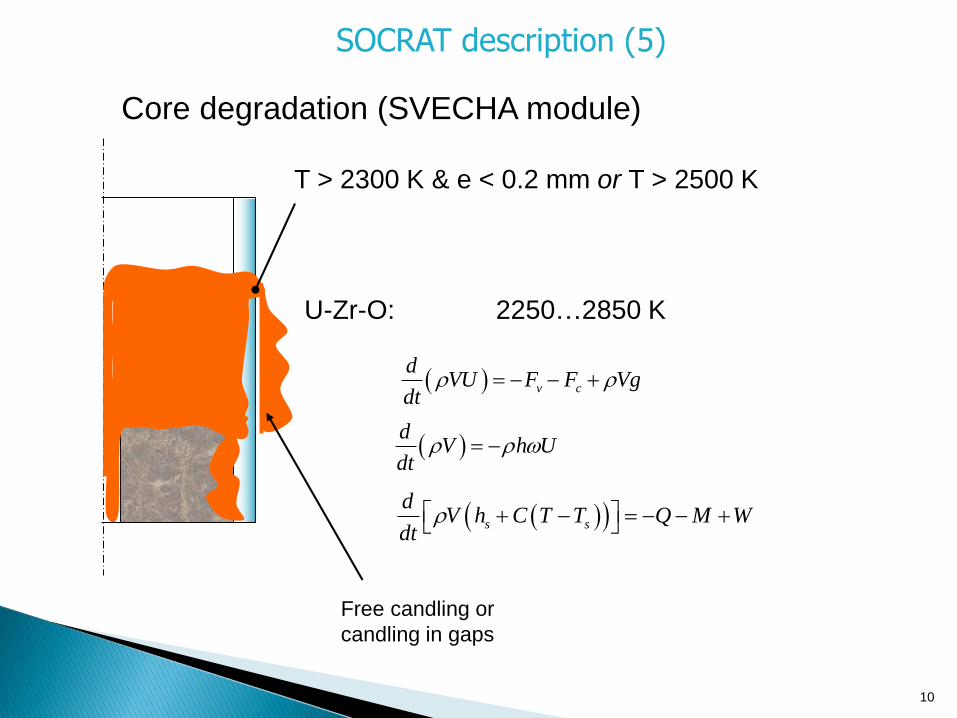
SOCRAT description (5)
T > 2300 K & e < 0.2 mm or T > 2500 K
U-Zr-O: 2250…2850 K
( ) v c
dVU F F Vg
dt = − − +
( )d
V h Udt
= −
( )( )s s
dV h C T T Q M W
dt + − = − − +
Free candling or
candling in gaps
Core degradation (SVECHA module)
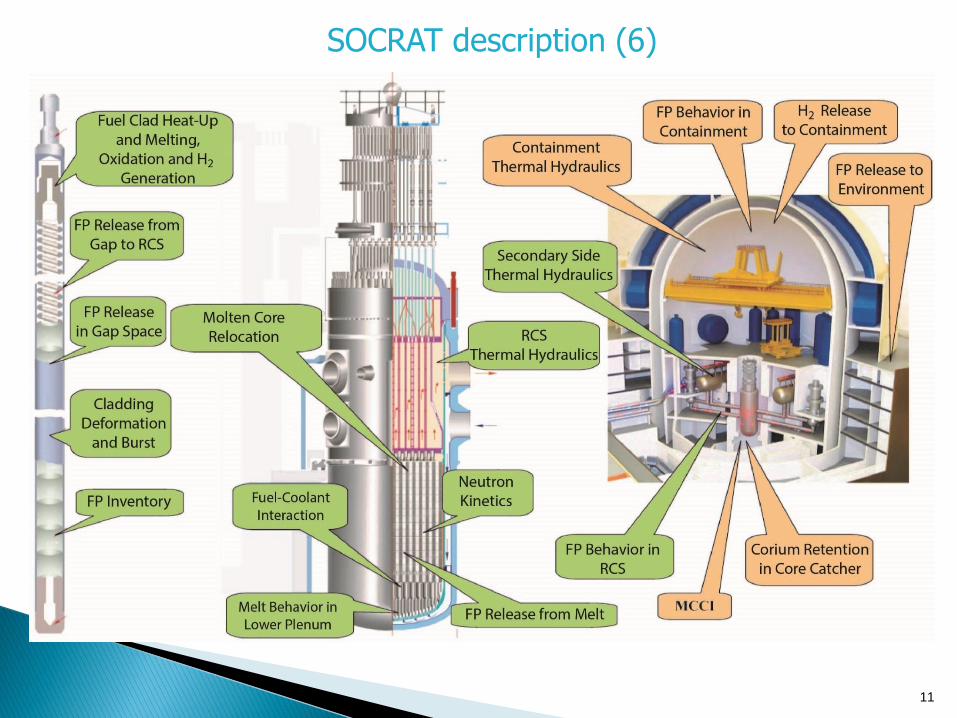
11
SOCRAT description (6)
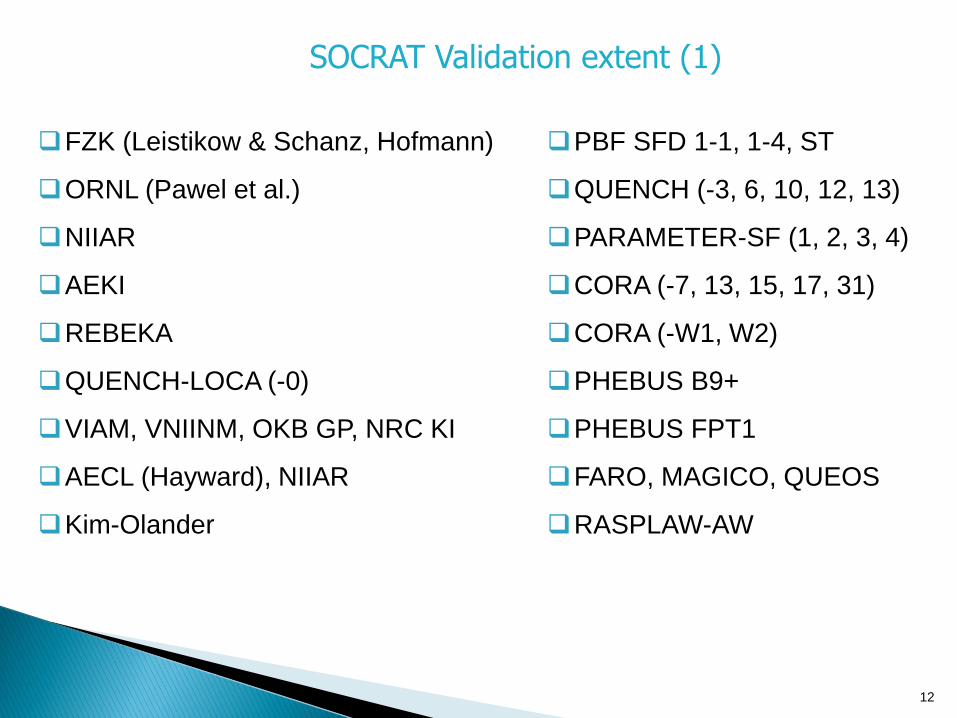
12
SOCRAT Validation extent (1)
❑PBF SFD 1-1, 1-4, ST
❑QUENCH (-3, 6, 10, 12, 13)
❑PARAMETER-SF (1, 2, 3, 4)
❑CORA (-7, 13, 15, 17, 31)
❑CORA (-W1, W2)
❑PHEBUS B9+
❑PHEBUS FPT1
❑FARO, MAGICO, QUEOS
❑RASPLAW-AW
❑FZK (Leistikow & Schanz, Hofmann)
❑ORNL (Pawel et al.)
❑NIIAR
❑AEKI
❑REBEKA
❑QUENCH-LOCA (-0)
❑VIAM, VNIINM, OKB GP, NRC KI
❑AECL (Hayward), NIIAR
❑Kim-Olander
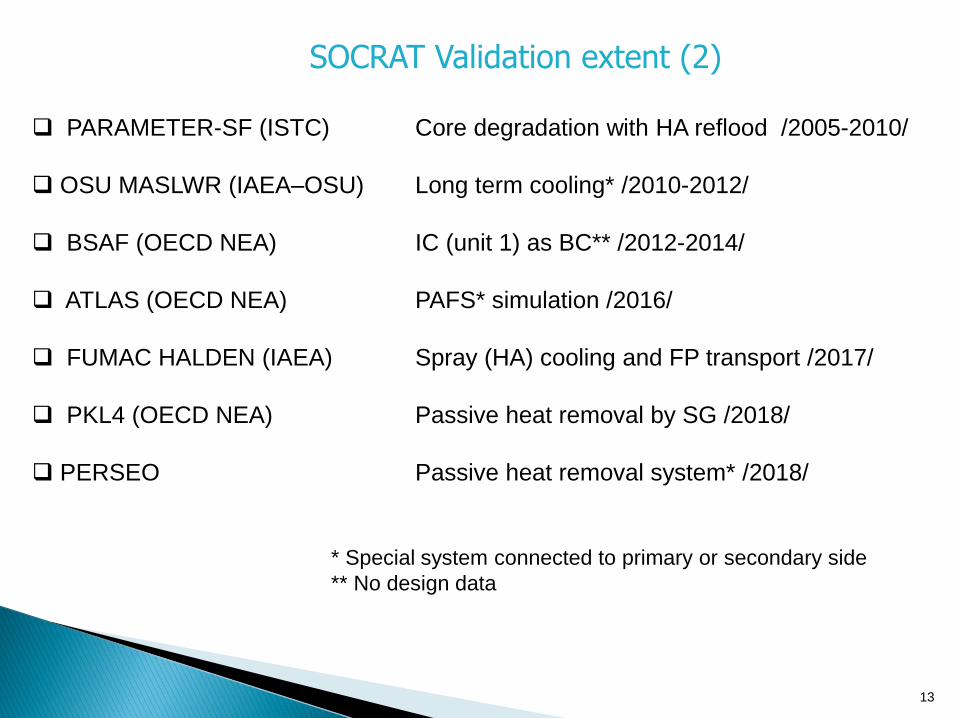
13
SOCRAT Validation extent (2)
❑ PARAMETER-SF (ISTC) Core degradation with HA reflood /2005-2010/
❑ OSU MASLWR (IAEA–OSU) Long term cooling* /2010-2012/
❑ BSAF (OECD NEA) IC (unit 1) as BC** /2012-2014/
❑ ATLAS (OECD NEA) PAFS* simulation /2016/
❑ FUMAC HALDEN (IAEA) Spray (HA) cooling and FP transport /2017/
❑ PKL4 (OECD NEA) Passive heat removal by SG /2018/
❑ PERSEO Passive heat removal system* /2018/
* Special system connected to primary or secondary side
** No design data
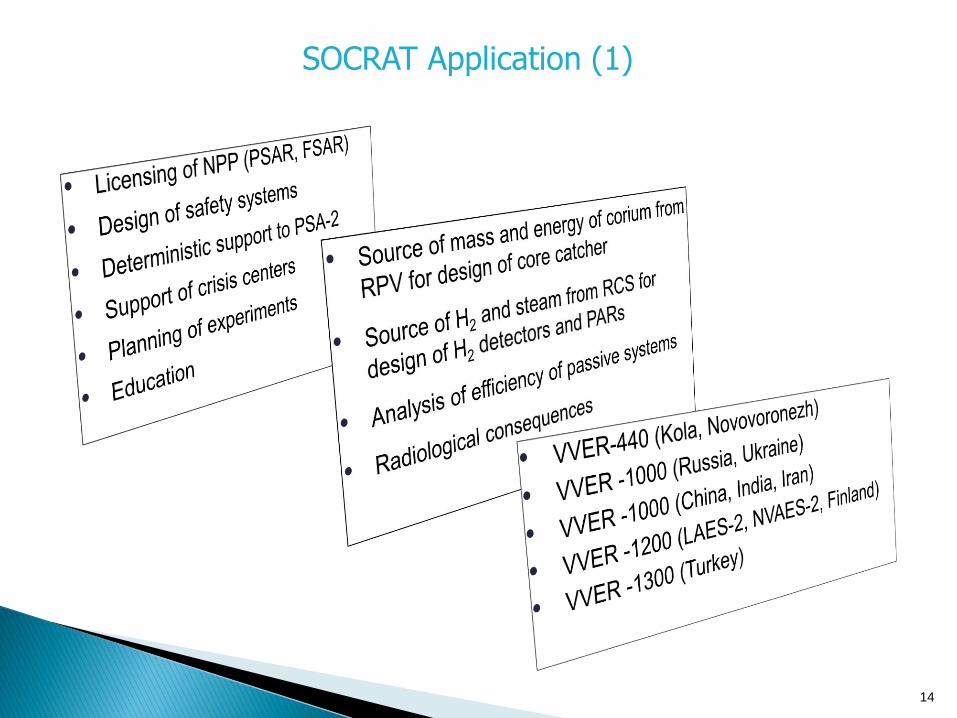
14
SOCRAT Application (1)
15
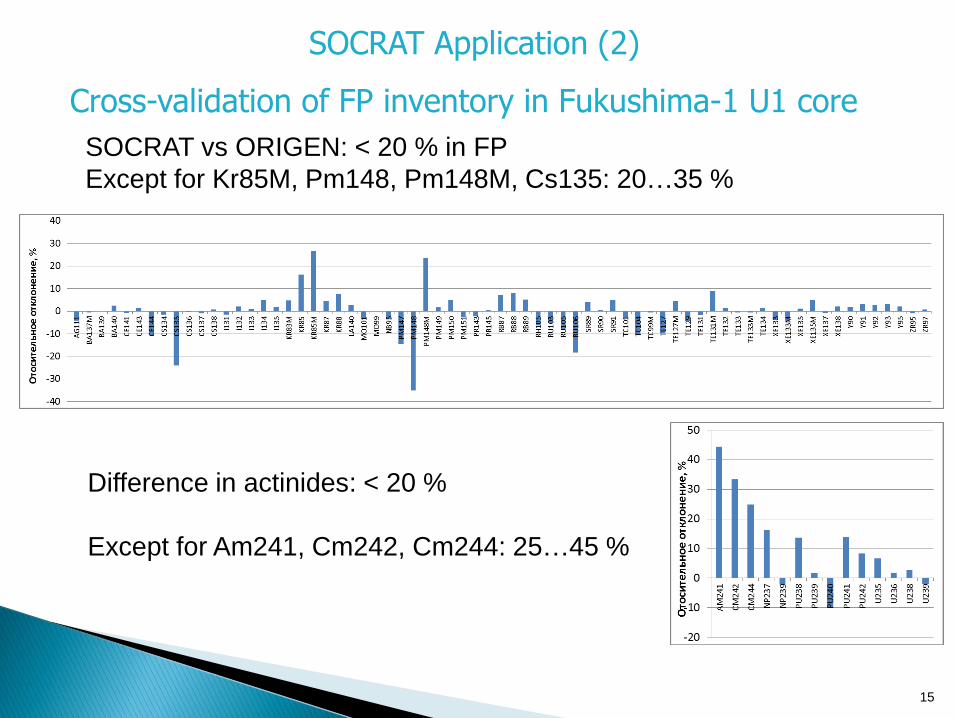
SOCRAT vs ORIGEN: < 20 % in FP
Except for Kr85M, Pm148, Pm148M, Cs135: 20…35 %
Difference in actinides: < 20 %
Except for Am241, Cm242, Cm244: 25…45 %
Cross-validation of FP inventory in Fukushima-1 U1 core
SOCRAT Application (2)
16
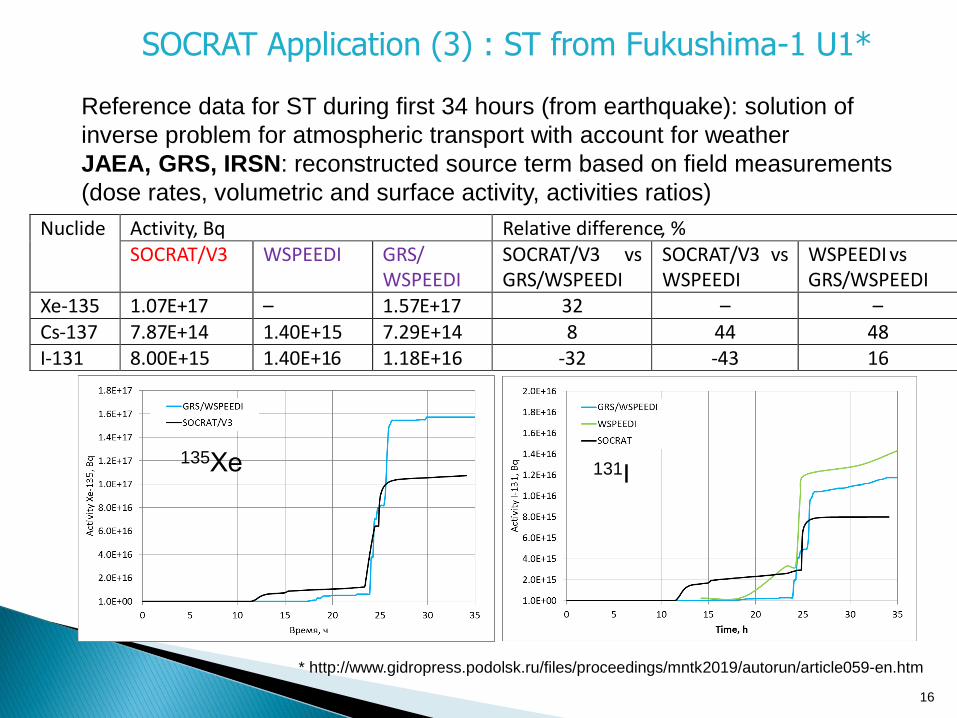
Reference data for ST during first 34 hours (from earthquake): solution of
inverse problem for atmospheric transport with account for weather
JAEA, GRS, IRSN: reconstructed source term based on field measurements
(dose rates, volumetric and surface activity, activities ratios)
Nuclide Activity, Bq Relative difference, %SOCRAT/V3 WSPEEDI GRS/
WSPEEDISOCRAT/V3 vsGRS/WSPEEDI
SOCRAT/V3 vs WSPEEDI
WSPEEDI vsGRS/WSPEEDI
Xe-135 1.07E+17 – 1.57E+17 32 – –Cs-137 7.87E+14 1.40E+15 7.29E+14 8 44 48I-131 8.00E+15 1.40E+16 1.18E+16 -32 -43 16
135Хе 131I
SOCRAT Application (3) : ST from Fukushima-1 U1*
* http://www.gidropress.podolsk.ru/files/proceedings/mntk2019/autorun/article059-en.htm
17
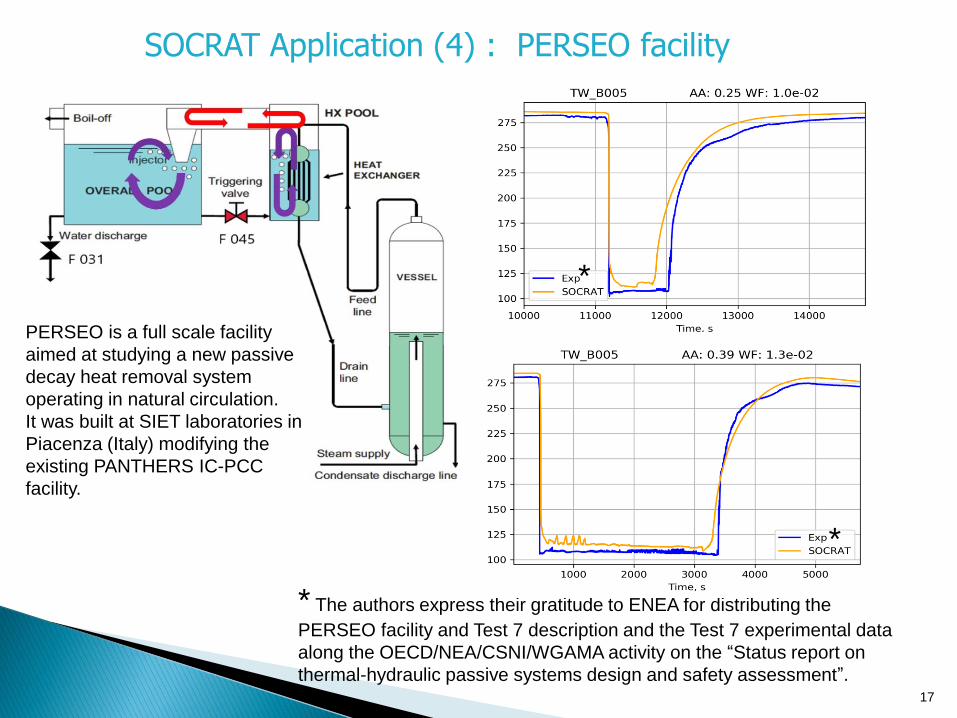
SOCRAT Application (4) : PERSEO facility
PERSEO is a full scale facility
aimed at studying a new passive
decay heat removal system
operating in natural circulation.
It was built at SIET laboratories in
Piacenza (Italy) modifying the
existing PANTHERS IC-PCC
facility.
* The authors express their gratitude to ENEA for distributing the
PERSEO facility and Test 7 description and the Test 7 experimental data
along the OECD/NEA/CSNI/WGAMA activity on the “Status report on
thermal-hydraulic passive systems design and safety assessment”.
*
*
18
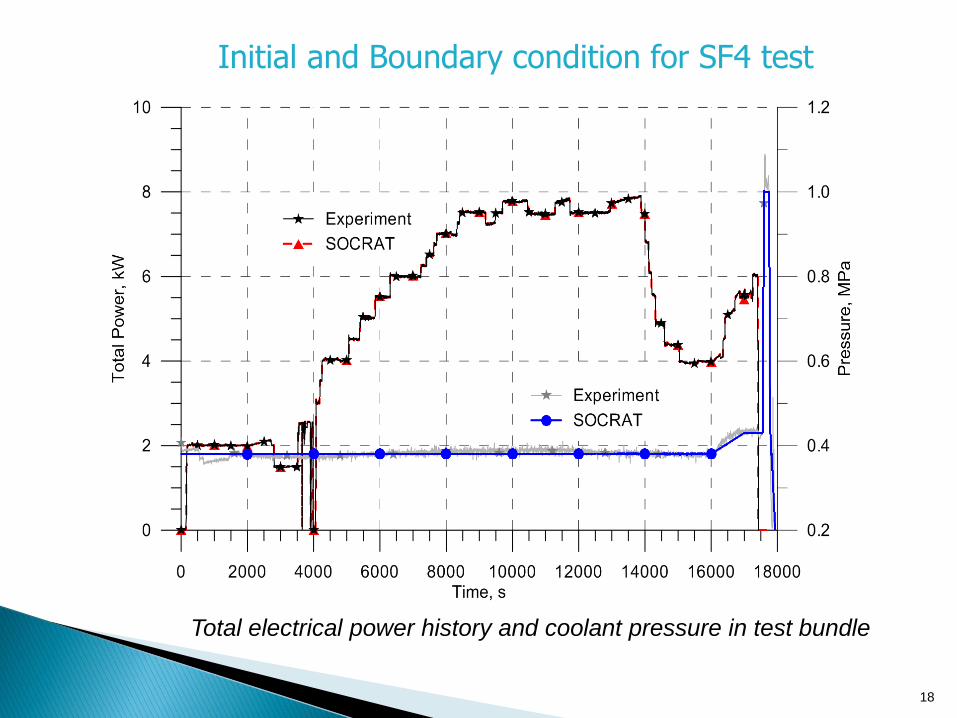
Initial and Boundary condition for SF4 test
Total electrical power history and coolant pressure in test bundle
19
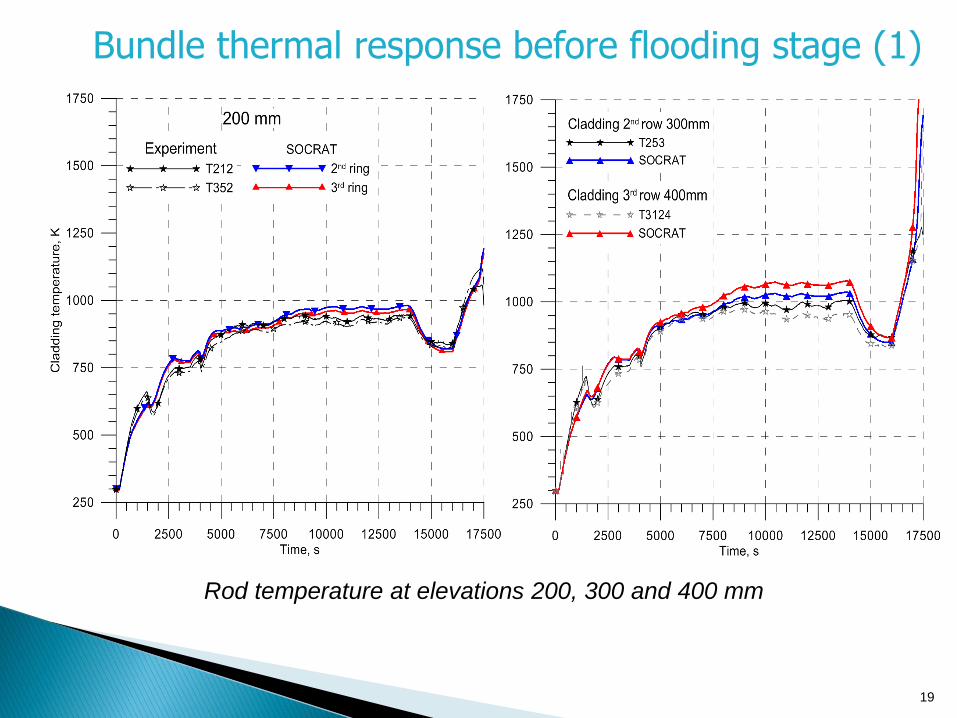
Bundle thermal response before flooding stage (1)
Rod temperature at elevations 200, 300 and 400 mm
20
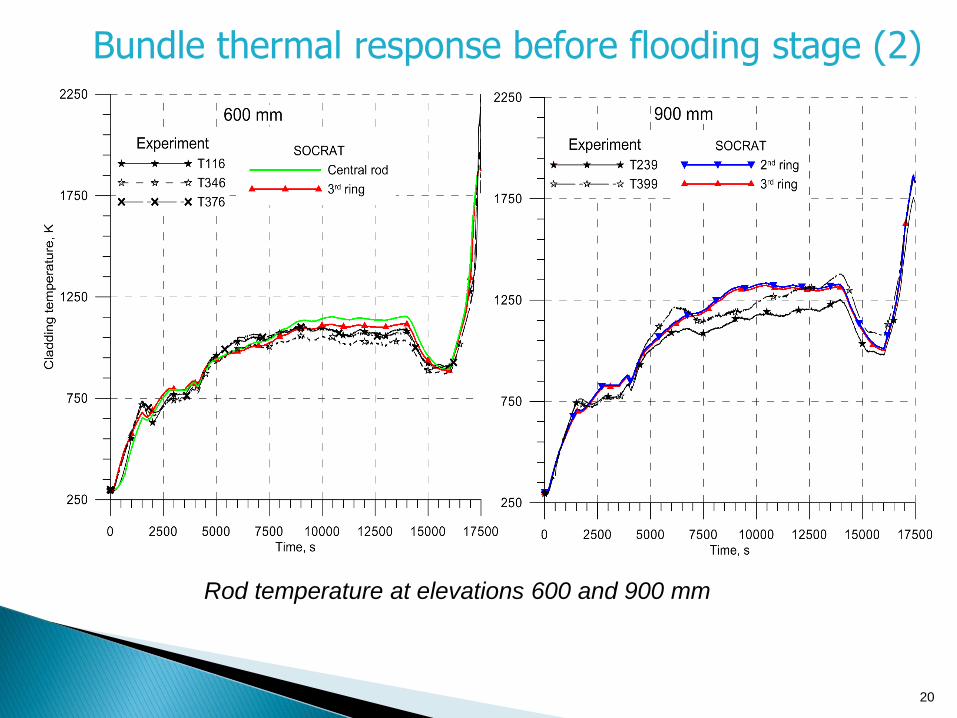
Bundle thermal response before flooding stage (2)
Rod temperature at elevations 600 and 900 mm
21
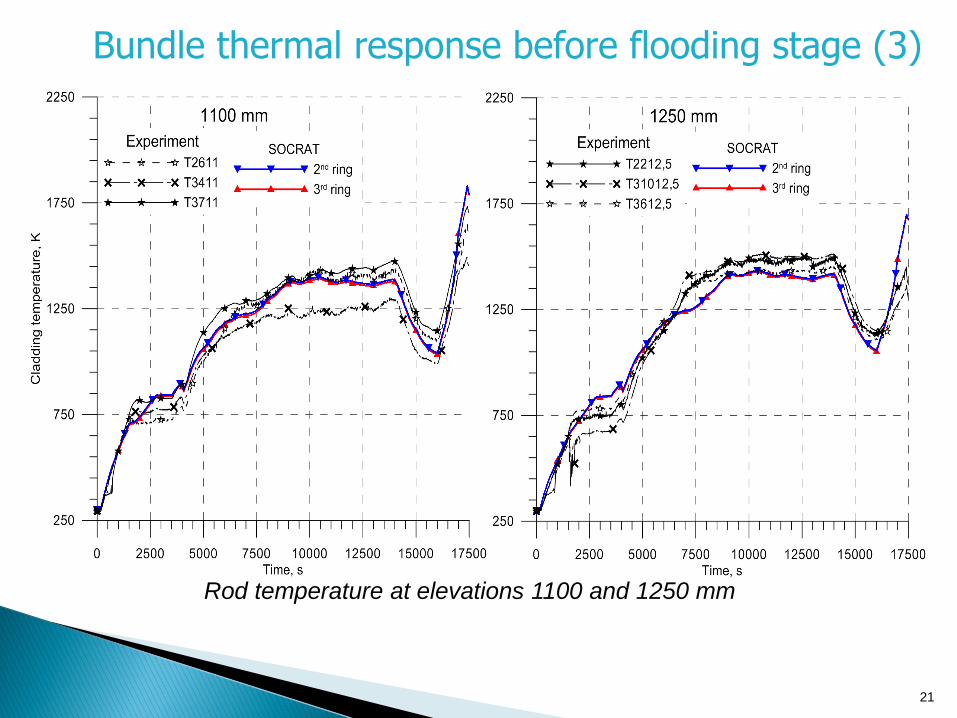
Bundle thermal response before flooding stage (3)
Rod temperature at elevations 1100 and 1250 mm
22
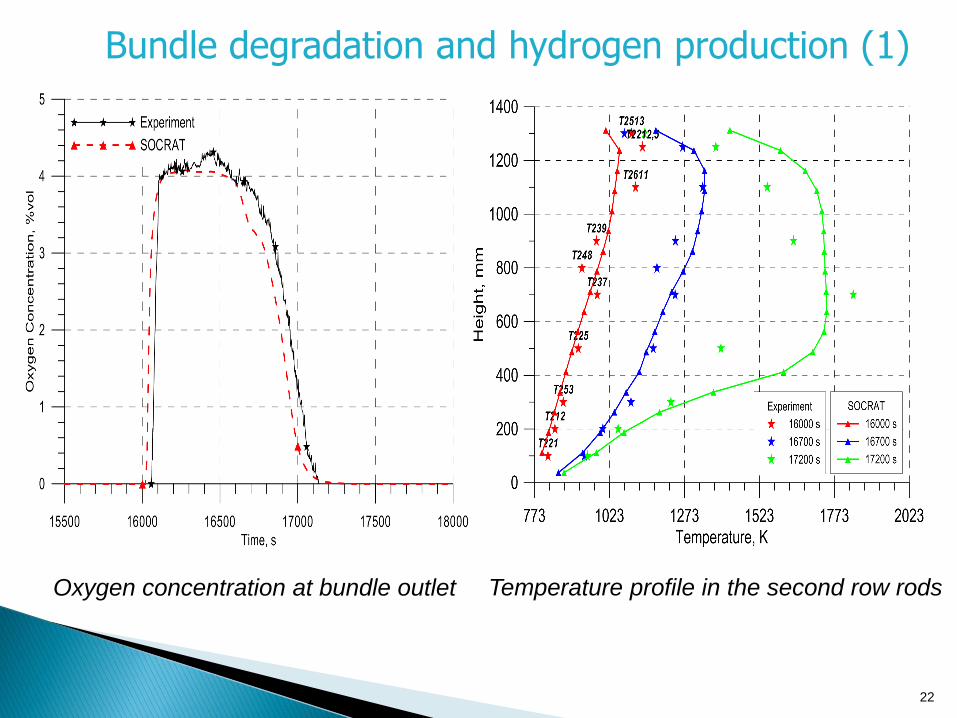
Bundle degradation and hydrogen production (1)
Oxygen concentration at bundle outlet Temperature profile in the second row rods
23
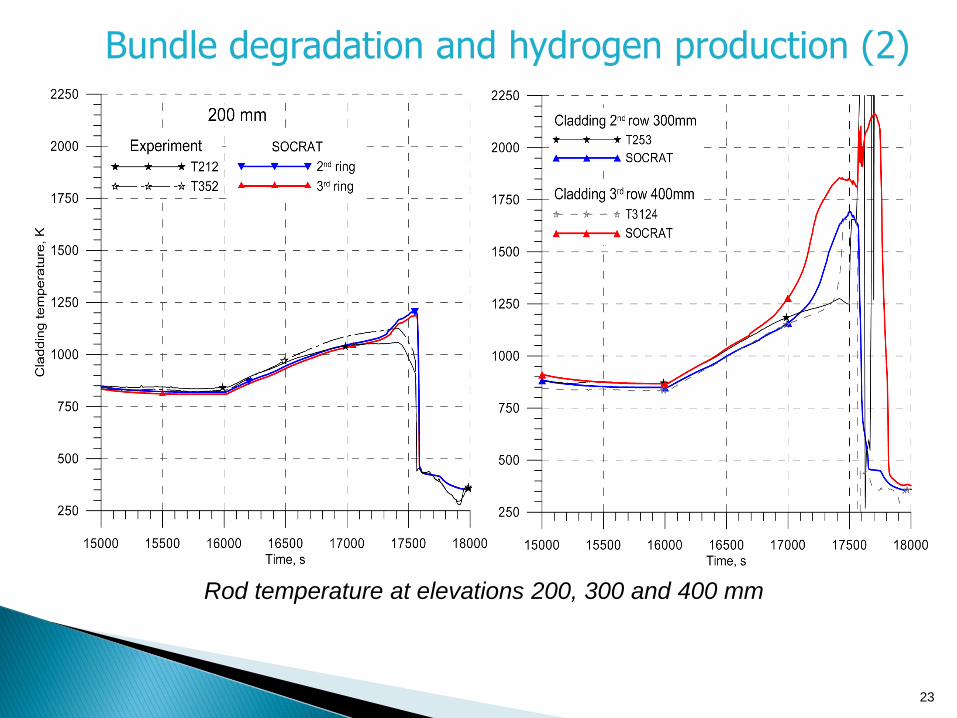
Bundle degradation and hydrogen production (2)
Rod temperature at elevations 200, 300 and 400 mm
24
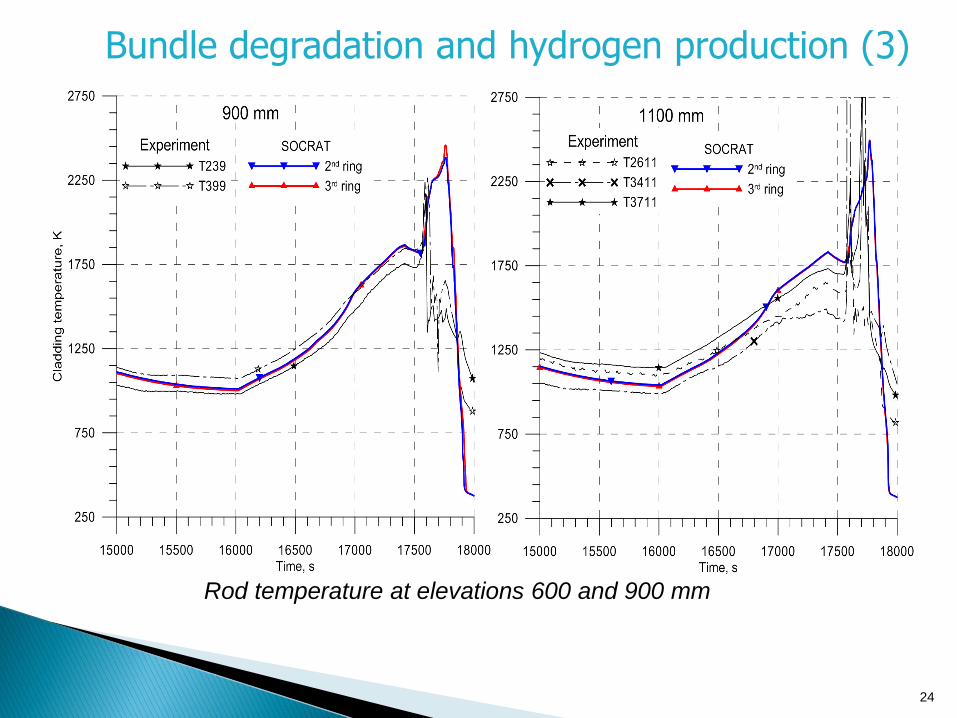
Bundle degradation and hydrogen production (3)
Rod temperature at elevations 600 and 900 mm
25
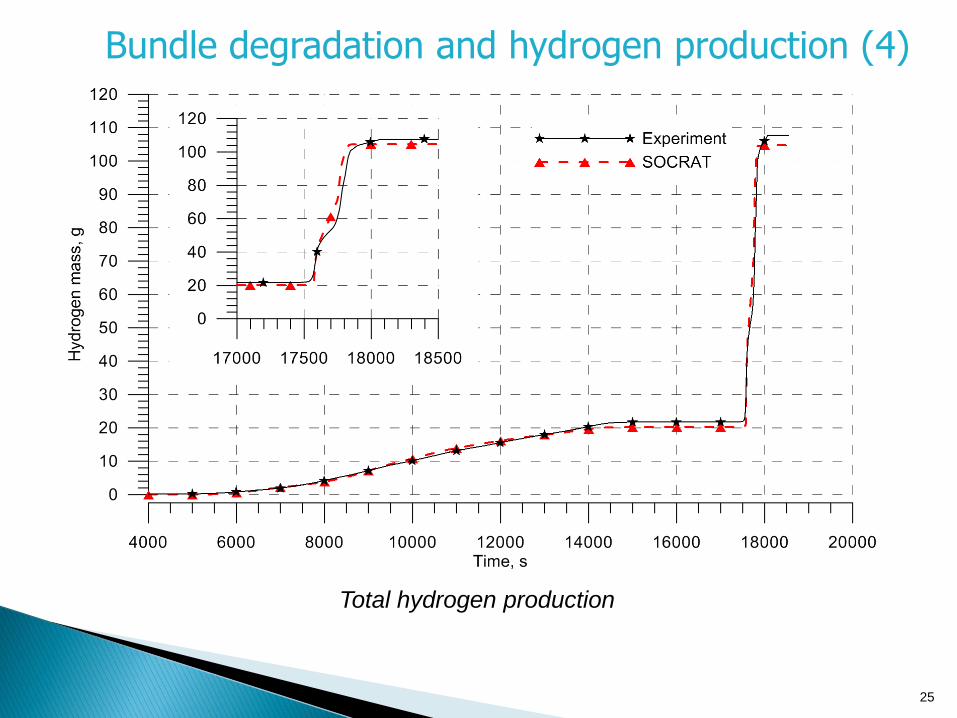
Bundle degradation and hydrogen production (4)
Total hydrogen production
26
Post-test bundle examination
Post-test bundle examination demonstrates that at the
elevation 130 mm the assembly does not have any visible
damages (all fuel rod claddings and periphery rods kept
their integrity). The oxide scale on fuel rod claddings is thin
and well attached to metal; the measured thickness of
zirconium oxide scale varies within 4 – 9 μm. SOCRAT/V1
code predicts the thickness of zirconia to be 6 – 7 μm in
heated rods at this elevation.
Ignatiev, D., 2009. Post-test examination of the PARAMETER-SF4
fuel assembly. In: Proceedings of 15th International QUENCH
Workshop, 3–5 November 2009, Karlsruhe, Germany. ISBN 978-3-
923704-71-2.
27
Conclusion
The air ingress test PARAMETER-SF4 was performed in
July 2009 with the aim to investigate the behavior of a
VVER fuel assembly during water flooding after air ingress
phase. The scenario and conditions of the experiment are
prototypical for a severe accident with fuel rod uncover,
degradation and reflooding in a spent fuel pool. SF4
experiment has been simulated with the severe accident
code SOCRAT/V1.
The results of the simulations show a reasonable
agreement of calculations with measurements of
temperature histories, outlet oxygen concentration and
hydrogen production. Insignificant differences were found in
melt progression and maximal temperatures in the bundle.


![[hal-00238351, v1] Macroelement modeling of shallow ... · Macroelement modeling of shallow foundations ... displacement-based design, non-linear dynamic analysis ... shaped surface](https://img.pdfslide.net/doc/110x75/5ac324437f8b9a57528bc2c8/hal-00238351-v1-macroelement-modeling-of-shallow-modeling-of-shallow-foundations.jpg)