Embed Size (px)
Citation preview

Research ArticleModeling of Photovoltaic System with Modified IncrementalConductance Algorithm for Fast Changes of Irradiance
Saad Motahhir , Abdelaziz El Ghzizal, Souad Sebti, and Aziz Derouich
Laboratory of Production Engineering, Energy and Sustainable Development, Higher School of Technology, SMBA University,Fez, Morocco
Correspondence should be addressed to Saad Motahhir; [email protected]
Received 6 September 2017; Accepted 7 December 2017; Published 13 March 2018
Academic Editor: Philippe Poggi
Copyright © 2018 Saad Motahhir et al. This is an open access article distributed under the Creative Commons Attribution License,which permits unrestricted use, distribution, and reproduction in any medium, provided the original work is properly cited.
The first objective of this work is to determine some of the performance parameters characterizing the behavior of a particularphotovoltaic (PV) panels that are not normally provided in the manufacturers’ specifications. These provide the basis fordeveloping a simple model for the electrical behavior of the PV panel. Next, using this model, the effects of varying solarirradiation, temperature, series and shunt resistances, and partial shading on the output of the PV panel are presented. Inaddition, the PV panel model is used to configure a large photovoltaic array. Next, a boost converter for the PV panel isdesigned. This converter is put between the panel and the load in order to control it by means of a maximum power pointtracking (MPPT) controller. The MPPT used is based on incremental conductance (INC), and it is demonstrated here that thistechnique does not respond accurately when solar irradiation is increased. To investigate this, a modified incrementalconductance technique is presented in this paper. It is shown that this system does respond accurately and reduces the steady-state oscillations when solar irradiation is increased. Finally, simulations of the conventional and modified algorithm arecompared, and the results show that the modified algorithm provides an accurate response to a sudden increase in solar irradiation.
1. Introduction
The energy generated by the PV systems depends on variousparameters, either environmental as temperature and irradi-ance or internal parameters of the PV panel, namely, theseries and shunt resistors [1, 2]. Thus, the load imposes itsown characteristic on the output power [3]. Therefore, inorder to predict and analyze the effect of these parameterson the PV power, the model of the PV panel should bepreviously studied and achieved, and this model should bein accordance with the real comportment of the PV panel.Therefore, different models were proposed in the literature.In [4], a single diode model is used; in [5], a two-diode modelis proposed to illustrate the influence of the recombination ofcarriers; and in [6], a model of three diodes is used to presentthe effects which are neglected by the two-diode model.However, the single-diode model is the most adopted dueto its good simplicity and accuracy [7]. Moreover, manufac-turers of PV panels offer only some characteristics. But othercharacteristics required to model PV panel are missed in the
datasheet, as the photocurrent, the diode saturation current,the series and shunt resistors, and the ideality factor [8].Hence, in [7, 9, 10], researchers have proposed differentmethods to extract the lacking characteristics based on thedatasheet values, but these methods require an implementa-tion and this can increase the time spent in the developmentof a PV application. Therefore, this paper aims firstly toextract lacking parameters in the manufacturers’ datasheetby using a simple tool provided by MathWorks [11] and thenmodel the PV panel. The single-diode model is used in thiswork because it gives a high compromise between accuracyand simplicity [12], and several researchers have used it intheir works [13, 14]. In addition, this work shows the effectof parameters that may change the performance of thePV panel. Then, this model will be a platform to designa PV array.
On the other side, the maximization of the PV poweralways remains a major challenge. Researchers have pro-posed different MPPT algorithms to maximize PV power,namely, FSCC, FOCV, fuzzy logic, neural network, P&O,
HindawiInternational Journal of PhotoenergyVolume 2018, Article ID 3286479, 13 pageshttps://doi.org/10.1155/2018/3286479

and INC [15, 16]. FSCC and FOCV are the simplest MPPTalgorithms, which are based on the linearity of short-circuitcurrent or open-circuit voltage to the maximum power pointcurrent or voltage. However, these techniques isolate the PVpanel to measure the short-circuit current or open-circuitvoltage. Therefore, the loss of energy is increased due to theperiodic isolation of the panel [17]. Alternatively, fuzzy logicand neural network obtain a consistent MPPT technique dueto their ability to treat the nonlinearity of the PV panel. Butthe main drawback of fuzzy logic is that the effectiveness ofthis algorithm depends a lot on choosing the right errorcomputation and an appropriate rule base [18]. In addition,neural network presents many disadvantages like the factthat the data needed for the training process have to be spe-cifically acquired for every PV array and location, and also,the PV characteristics change with time, so the neuralnetwork has to be periodically trained [18]. On the otherhand, P&O and INC are mostly used. These techniquesuse the (P‐V) characteristic of the PV panel. For P&O,steady-state oscillations occur after the MPP is found dueto the perturbation made by this technique to maintain theMPP, which in turn increases the loss of power [19]. ForINC, it is founded in the fact that slope of P‐V characteristicis zero at the maximum power, and theoretically, there is noperturbation after the MPP is found. Therefore, oscillationsare minimized. However, during implementation, the zerovalue is hardly found on the slope of the P‐V characteristicdue to the truncation error in digital processing. Thus, theINC technique can make an inaccurate response when theirradiation is suddenly increased [20]. Therefore, this workaims also to propose and implement a modified INC algo-rithm, which can overcome the wrong response made bythe conventional INC algorithm when the irradiance issuddenly increased. Therefore, this work proposes a newtechnique to detect the increase in solar irradiation. The var-iation of voltage (ΔV) and current (ΔI) are used to identifythe increase in irradiation instead of the slope (ΔP/ΔV) ofthe P‐V characteristic. The modified algorithm detects theincrease of irradiance and makes a correct decision. More-over, a mini error is accepted to admit that the slope is nearto zero and minimize the steady-state oscillations.
This paper is structured as follows. Following the intro-duction, Section 2 presents the modeling of PV panel andarray and presents the impact of different environmentaland internal parameters. Section 3 presents the design ofthe boost converter, the conventional algorithm, and theproposed algorithm.
2. Modeling of PV Panel and Array
2.1. Model of PV Panel. As shown in Figure 1, the single-diode model of PV panel can be presented by a photocurrentsource and a diode connected with series and shunt resis-tances. The mathematical model of the PV panel can bepresented by the following equations [19]:
I = Iph − IS expq V + RsIaKTNs
− 1 −V + IRsRsh
, 1
Iph = ISC + Ki T − 298 15G
1000, 2
IS =ISC + Ki T − 298 15
exp q VOC + KV T − 298 15 /aKTNS − 13
Hence, the physical behavior of the PV panel dependson the shunt and series resistances, solar irradiation, andtemperature. Therefore, in this work, the impact of theseparameters on the output of the PV panel is investigated.
The panel used in this work is MSX-60 panel, and aspresented in Table 1, the datasheet of PV panel provides onlysome characteristics of PV panel. Thus, other characteristicsrequired to model PV panel are missed in the datasheet, asthe photocurrent, the diode saturation current, the seriesand shunt resistors, and the ideality factor. Hence,researchers have proposed different methods to extract thelacking characteristics based on the datasheet [7, 9, 10]. Butthese methods require an implementation and this canincrease the time spent in the development of a PV system.Therefore, this work aims firstly to extract these parametersby using a simple tool provided by MathWorks which is“PV array;” the latter is available in Simulink 2015 or later[11]. Hence, as shown in Figure 2, we only have to set thedatasheet values and automatically it will generate thelacking parameters.
Equations (1), (2), and (3) are modeled using PSIM(software for power electronics simulation), and Figure 3presents the PSIM model.
Figure 4 shows the I‐V and P‐V curves of experimentaland PSIM model under STC. The experimental data P(V)and I(V) are taken from the manufactured datasheet [21].
Iph
Id
I
Ish
+
−
V
Rs
Rsh
Figure 1: PV panel equivalent circuit.
Table 1: Characteristics of MSX-60 PV panel at STC.
PV panel parameters Values
Maximum power, Pmax 60W
Maximum power voltage, Vmp 17.1V
Maximum power current, Imp 3.5 A
Short-circuit current, Isc 3.8 A
Open-circuit voltage, VCO 21.1V
Voltage/temp. coefficient, KV −0.38%/°CCurrent/temp. coefficient, KI 0.065%/°C
The number of cells, Ns 36
2 International Journal of Photoenergy

And as presented, the model data are in accordance with theexperimental data both in the current and power curves.
2.2. Effect of Solar Irradiation Variation. Figure 3 containsthe model of the three equations: one of these equationscomputes the photocurrent based on temperature and
irradiance (2). The model of this equation is presentedin Figure 5, and Figure 6 presents I‐V and P‐V curvesfor different values of solar irradiation.
As presented in Figure 6, the PV panel current dependsheavily on solar irradiation. However, the voltage increasesjust by 1V once the irradiance is increased from 400W/m2
Iph-Id +
−
Rs
V
C
PV module circuit model
Model equations:
V
I
++
++
++
+
+
++
−
−A
T
B
Ki Io
Ki
T-Tref
T-Tref
Isc
Isc
Gref
G
exp (x)−1m
n
exp (x)−1
Io
Iph
Iph-Id
Tref
T-Tref
Voc
Kv
B
T-Tref
IphT
Rs
Ro
Ro
Author: S. MOTAHHIR
Spec of solarex MSX-60 module:
Pmax = 60 wVmp = 17.1 VImp = 3.5 AVoc = 21.1 VISC = 3.8 ANS = 36
I
V
V V
V
P
Parameters of one single module:
A=(a × k ×NS)
q
T
G
Io , nRsRsh
−+ −+ −+−+−+
−+−+−+
−+−+−+−+
TrefGrefIscA
KiKvVoc
ParamSweep
Rsh
I
×
×
××
×
×
××
÷
÷÷
÷
.
. .
.
.
.
.
. . .
Figure 3: PV panel PSIM model.
Figure 2: PV array tool.
3International Journal of Photoenergy

to 1000W/m2. Therefore, the irradiance change affectsheavily the PV panel current.
2.3. Effect of the Temperature Variation. Figure 3 containsalso the modeling of (3), which computes the diode satura-tion current based on the temperature. The model of thisequation is shown in Figure 7, and Figure 8 shows the I‐Vand P‐V curves for different values of temperature.
Generally, as shown in Figure 8, for a fixed solar irradia-tion and when the temperature increases, the open-circuitvoltage decreases and the short-circuit current increases witha little value. Therefore, the temperature change affectsstrongly the PV panel voltage.
2.4. Effect of Series Resistor Variation. The series resistorvalue is very small, and it may be neglected in some cases.Nevertheless, to make the appropriate model for any PVpanel, it is recommended to make a variation of this resistor
and show its effect on the PV panel output. As shown inFigure 9, the change of the series resistor results on the devi-ation of the MPP.
The simulation was made for three values of seriesresistance (1mΩ, 4mΩ, and 8mΩ). Moreover, as shown inFigure 9, the upper values of series resistance decrease theoutput power. In addition, the fill factor presented by (4)decreases as series resistance increases [22].
FF = PmaxVOCISC
4
2.5. Effect of Shunt Resistor Variation. As presented inFigure 10, Rsh should be quite large for a good fill factor.In fact, when Rsh is small, the current collapses morestrongly, then the loss of power is high, and the fill factoris low. Therefore, Rsh of any PV panel should be largeenough for a good efficiency.
Ki
dTIsc
G
Gn
Iph
Tn
T dT+
++
−
×
÷
×
Figure 5: Model of (2).
0
20
40
60
P (W
)
0
1
2
3
4
I (A
)
5 10 150 20V (V)
5 10 15 200V (V)
1000 W/m2
800 W/m2600 W/m2
400 W/m21000 W/m2
800 W/m2600 W/m2
400 W/m2
Figure 6: I‐V and P‐V curves for different values of irradiance.
Model dataExperimental data
00.5
11.5
22.5
33.5
44.5
I (A
)
5 10 15 20 250V (V)
0
10
20
30
40
50
60
70
P (W
)
5 10 15 20 250V (V)
Figure 4: I‐V and P‐V characteristics of model and experimental data.
4 International Journal of Photoenergy

50 15 2010V (V)
0
20
40
60
P (W
)
50 15 2010V (V)
0
1
2
3
4
I (A
)
1 mΩ4 mΩ
8 mΩ 1 mΩ4 mΩ
8 mΩ
Figure 9: I‐V and P‐V curves for different values of Rs.
0
1
2
3
4
I (A
)
5 10 15 200V (V)
0
20
40
60
P (W
)
5 10 15 200V (V)
1000 Ω500 Ω
100 Ω 1000 Ω500 Ω
100 Ω
Figure 10: I‐V and P‐V curves for different values of Rsh.
25˚C 40˚C35˚C
5 10 15 200V (V)
0
20
40
60
P (W
)
5 10 15 200V (V)
0
1
2
3
4
I (A
)
25˚C 40˚C35˚C
Figure 8: I‐V and P‐V curves for different values of temperature.
Ki
dTIsc
++Io
B Voc
dT
Kv
+
+m
exp. (x) −1× ×
÷×
Figure 7: Model of (3).
5International Journal of Photoenergy
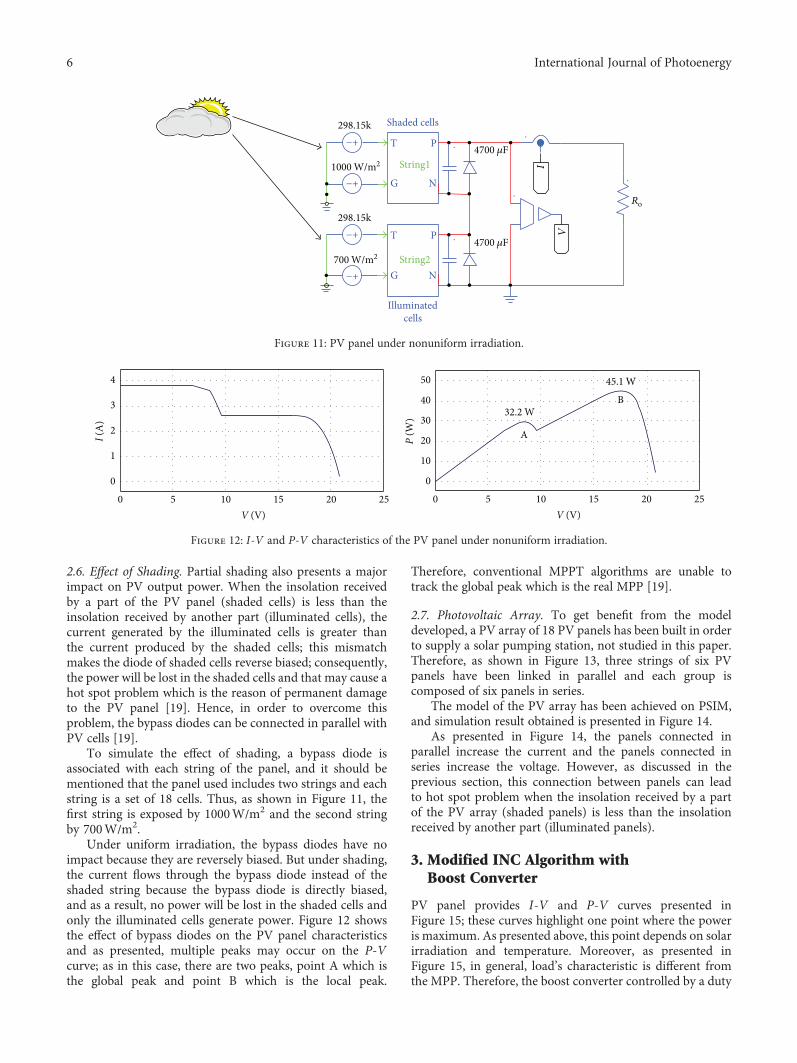
2.6. Effect of Shading. Partial shading also presents a majorimpact on PV output power. When the insolation receivedby a part of the PV panel (shaded cells) is less than theinsolation received by another part (illuminated cells), thecurrent generated by the illuminated cells is greater thanthe current produced by the shaded cells; this mismatchmakes the diode of shaded cells reverse biased; consequently,the power will be lost in the shaded cells and that may cause ahot spot problem which is the reason of permanent damageto the PV panel [19]. Hence, in order to overcome thisproblem, the bypass diodes can be connected in parallel withPV cells [19].
To simulate the effect of shading, a bypass diode isassociated with each string of the panel, and it should bementioned that the panel used includes two strings and eachstring is a set of 18 cells. Thus, as shown in Figure 11, thefirst string is exposed by 1000W/m2 and the second stringby 700W/m2.
Under uniform irradiation, the bypass diodes have noimpact because they are reversely biased. But under shading,the current flows through the bypass diode instead of theshaded string because the bypass diode is directly biased,and as a result, no power will be lost in the shaded cells andonly the illuminated cells generate power. Figure 12 showsthe effect of bypass diodes on the PV panel characteristicsand as presented, multiple peaks may occur on the P‐Vcurve; as in this case, there are two peaks, point A which isthe global peak and point B which is the local peak.
Therefore, conventional MPPT algorithms are unable totrack the global peak which is the real MPP [19].
2.7. Photovoltaic Array. To get benefit from the modeldeveloped, a PV array of 18 PV panels has been built in orderto supply a solar pumping station, not studied in this paper.Therefore, as shown in Figure 13, three strings of six PVpanels have been linked in parallel and each group iscomposed of six panels in series.
The model of the PV array has been achieved on PSIM,and simulation result obtained is presented in Figure 14.
As presented in Figure 14, the panels connected inparallel increase the current and the panels connected inseries increase the voltage. However, as discussed in theprevious section, this connection between panels can leadto hot spot problem when the insolation received by a partof the PV array (shaded panels) is less than the insolationreceived by another part (illuminated panels).
3. Modified INC Algorithm withBoost Converter
PV panel provides I‐V and P‐V curves presented inFigure 15; these curves highlight one point where the poweris maximum. As presented above, this point depends on solarirradiation and temperature. Moreover, as presented inFigure 15, in general, load’s characteristic is different fromthe MPP. Therefore, the boost converter controlled by a duty
A
B
45.1 W
32.2 W
0
10
20
30
40
50
P (W
)
5 10 15 20 250V (V)
0
1
2
3
4
I (A
)
5 10 15 20 250V (V)
Figure 12: I‐V and P‐V characteristics of the PV panel under nonuniform irradiation.
298.15k
298.15k
1000 W/m24700 𝜇F
Shaded cells
Illuminatedcells
−+
−+
−+
−+
T P
NRo
G
T P
NG
4700 𝜇F
V
IString1
String2700 W/m2
Figure 11: PV panel under nonuniform irradiation.
6 International Journal of Photoenergy

1074 W
0
2
4
6
8
10
12
I (A
)
40 80 1200V (V)
0
200
400
600
800
1000
1200
P (W
)
40 80 1200V (V)
Figure 14: I‐V and P‐V curves of the PV array.
ImLoad_1
Load_2
LoadMax
MPP
Vm
0
20
40
60
80
X: 17.03Y: 60.5
0
1
2
3
4
Curr
ent (
A)
Pow
er (W
)
5 10 15 20 250Voltage (V)
Figure 15: The impact of load on I‐V and P‐V characteristics.
T P
NG
PVmodule
PVmodule
PVmodule
PVmodule
PVmodule
PVmodule
PVmodule
PVmodule
PVmodule
PVmodule
PVmodule
PVmodule
PVmodule
PVmodule
PVmodule
PVmodule
PVmodule
PVmodule
−+
−+
−+
−+
−+
−+
−+
−+
−+
−+
−+
−+
−+
−+
−+
−+
−+
−+
−+
−+
−+
−+
−+
−+
−+
−+
−+
−+
−+
−+
−+
−+
−+
−+
−+
−+
−+
−+
−+
−+
2200 uF+
−
T P
NG2200 uF
T P
NG2200 uF
T P
NG2200 uF
T P
NG2200 uF
T P
NG2200 uF
T P
NG2200 uF
+
−
T P
NG2200 uF
T P
NG2200 uF
T P
NG2200 uF
T P
NG2200 uF
T P
NG2200 uF
T P
NG2200 uF
−T P
NG2200 uF
V
T P
NG2200 uF
T P
NG2200 uF
T P
NG2200 uF
T P
NG2200 uF
+
I
Author: S. MOTAHHIRPV array
Figure 13: PV array model.
7International Journal of Photoenergy

cycle (α) generated by the MPPT controller is put betweenthe panel and the load [23]. The interest of this addition isto remove the mismatch between the panel and the load,and then the PV panel can operate at MPP.
3.1. Boost Converter Design. Figure 16 presents the circuit ofthe boost converter; this converter is used as an adapterbetween the source and the load [24].
The operation principle of this converter is described bythe following equations [25]:
VO =V
1 − α,
IO = I 1 − α
5
By using (5), (6) is obtained, which is the relationshipbetween the resistance seen by the PV panel (Req) and theload resistance (R). Hence, based on this equation, theMPPT controller can find the optimum α to remove themismatch between the load and MPP. Therefore, The boostconverter is required to get maximum power available fromthe panel.
Req =VI=VO 1 − α 2
IO= R 1 − α 2 6
3.1.1. Selection of the Inductor. The choice of the inductor candirectly influence the performance of the boost converter.Moreover, the selection of the inductance is a trade-offbetween its cost, its size, and the inductor current ripple. Ahigher inductance value results in a minor inductancecurrent ripple; however, that results in a higher cost andlarger inductor’s size, which means a larger PCB surface.
By the way, the inductance value can be given as follows:During TON state,
V = LΔILTON
⇒L =VαΔILF
, 7
where ΔIL can be computed as below, and r is the induc-tor current ripple ratio, which is optimal in the range[0.3, 0.5] [26]:
ΔIL = r × I 8
Therefore, the optimum inductor value can be computedby using
L ≥VαrIF
9
Based on Figure 17, in order to guarantee the perfor-mance of boost converter in the continuous conductionmode, the following equation must be verified:
I ≥ΔIL2
⇒ΔIL ≤ 2I 10
Therefore,
L ≥α 1 − α 2R
2F11
3.1.2. Selection of the Output Capacitor. The choice of theoutput capacitor is made by using output voltage rippleas follows:
During TON,
IO = COΔVOTON
⇒CO =αIO
ΔVOF12
Therefore, the output capacitor value can be calculatedas below, where the desired ΔVO equals to 2% of outputvoltage [24]:
CO ≥α
0 02 × F × R13
3.1.3. Selection of the Input Capacitor. An input capacitor isused to decrease the input voltage ripple and to deliver analternative current to the inductor. The input voltage ripple
IL,PEAK
tON tOFF
ΔIL
ΔILt
IL,MIN
IL
IL, ICIN
ICIN
IL i = IL + ICIN
Figure 17: Current waveforms of the input capacitor and inductor in CCM.
CinCo
Io
αV
LI
RPV panel Vo
Figure 16: Boost converter.
8 International Journal of Photoenergy

matches to the charge voltage during the charge phase of thecapacitor, and during this phase, ICin is greater than zero,so this phase is illustrated by the blue area in Figure 18;therefore, this area is used to calculate the input capacitoras follows:
ICin = CinΔVΔt ⇒ΔV =
ICinΔtCin
14
Based on Figure 18, and by using (14):
ΔV = ΔIL8FCin
⇒Cin =ΔIL
8FΔV = Vα
8F2LΔV15
Therefore, the input capacitor can be calculated by (16),where the desired ΔV equals to 1% of input voltage [27]:
Cin ≥α
8 × F2 × L × 0 0116
The design of the used boost is presented in Table 2.
3.2. Problem with the Conventional INC Algorithm. A goodMPPT algorithm balances between the tracking speedand steady-state performance. In accordance with theserequirements, the INC algorithm can be used even if itcan fail in some cases [20] and in this study, it will bemodified in order to improve its performance. INC algorithmis founded in the fact that slope of P‐V characteristic is zeroat the MPP [28]. Therefore, this algorithm can be modeled asfollows:
dPdV
= 0 at MPP,
dPdV
> 0 lef t to MPP,
dPdV
< 0 right to MPP
17
Since
dPdV
=d IVdV
=VdIdV
+ I 18
then,
dIdV
= −IV at MPP, 19
dIdV
> −IV lef t to MPP, 20
dIdV
< −IV right to MPP 21
The flowchart of the INC algorithm is presented inFigure 19 [28]. This algorithm measures the current andvoltage of the panel. If (21) is met, the duty cycle is increased,and vice versa if (20) is met. Then, there is nothing to do if(19) is met. Therefore, theoretically, if MPP is reached, thereis no more perturbation of α; consequently, steady-stateoscillations are decreased, and that is the main advantage ofINC algorithm.
However, the conventional INC algorithm fails to makea good decision when the irradiance is suddenly increased[20]. As presented in Figure 20, once the solar irradianceis at 500W/m2 and the PV system operates at load_2, theINC technique controls the PV system in order to reachthe MPP (point B). When the irradiance is increased to1000W/m2, load_2 will lead the system to point G in I‐Vcharacteristic, which matches to point C in P‐V character-istic. The INC technique calculates the slope between pointC and point B which is positive. Therefore, the INC algo-rithm will decrease the duty cycle and consequently, thePV panel voltage will be increased. But since the MPP of1000W/m2 is at point A, and the slope between point Aand C is negative, then the PV panel voltage should havebeen decreased in order to reach point A, instead of increasevoltage and recede from point A as made by the conventionalINC algorithm. In addition, as presented in Figure 6, gener-ally when the solar irradiance increases, the MPP moves tothe right and consequently, the same problem will occur.
Conversely, this weakness does not happen if the solarirradiation is decreased. Because as shown in Figure 20, theslope is positive between point A and D, and also betweenpoint B and D.
3.3. Modified INC Algorithm. Based on the above analysis, itis noted that when the solar irradiance increases, both thevoltage and the current are increased. Therefore, the suddenincrease in solar irradiation can be detected, by checking ifthe MPP was reached and both the voltage and current areincreased. Therefore, a permitted error is accepted (22) todetect that the MPP is reached.
dIdV
+ IV
< 0 07 22
The proposed algorithm is presented in Figure 21. So asshown, the addition is the check if the MPP was reached byusing (22), then set Var to one. After that, when (22) is
ICIN
ΔIL/2ΔIL/2
DischargeCharge
Area
tON/2
tONtOFF
tOFF/2
Figure 18: Current waveforms of the input capacitor in CCM.
Table 2: Design of the boost converter.
Parameters Values
L 1.2mH
Cin 75 μF
CO 75 μF
F 10 kHz
R 50ΩαMPP 0.69
9International Journal of Photoenergy

not met and Var is one, the proposed technique checks ifboth voltage and current are increased; in this case, theduty cycle is increased instead of decreased as made bythe conventional algorithm. Hence, the INC algorithm ismodified to overcome the incorrect decision made by theconventional algorithm when the irradiance is increased.
4. Results and Discussions
The test was made for the conventional and the proposedtechniques. At first, the solar irradiance is suddenly increasedfrom 500W/m2 to 1000W/m2 at t=0.11 s, and then itis decreased from 1000W/m2 to 500W/m2 at t=0.23 s.Figure 22 shows the test result of the conventional tech-nique, and Figure 23 shows the test result of the proposedtechnique. Therefore, as shown in these figures, the steady-state oscillations are minimized by using the proposedalgorithm and admit an error equals to 0.07. Contrary to
the conventional algorithm, the power oscillates between(28.5–29.8W), and this can generate a loss in PV energy.
In addition, as presented in Figure 22, by using theconventional algorithm, when solar irradiation is suddenlyincreased, the power diverges with a value greater than62W and after that, the conventional INC reverses thedirection and the power diverges with a value lower than56W; and like that, the system takes a long time to convergearound MPP that is due to the wrong decision made by theconventional technique. Also, even if the MPP is reached,the power oscillates between (59–61W). On the other side,as presented in Figure 23, the proposed technique detectsthe fast increase of irradiance and makes a correct decisionin duty cycle. As a result, the power converges to the newMPP from the first step and it is maintained at it (60W). Inaddition, it only needs 0.001 s to reach the MPP. Hence, byusing the proposed INC, the power converges fastercompared with the conventional algorithm which needsmore time to reach the MPP.
Table 3 summarizes a comparison of the proposedtechnique to other improved INC techniques proposed inthe scientific literature in term of the oscillation level,tracking efficiency, the response time during sudden increasein irradiation, and if the technique makes an incorrectdecision under sudden increase of irradiation. As presented,the proposed technique shows a very fast tracking speed, ahigher efficiency, and neglected oscillations around theMPP compared to other techniques. Thus, only the proposedalgorithm and that proposed in [29] make a correct decisionunder sudden increase of irradiation, contrary to the conven-tional technique and those proposed in [30, 31] which makean incorrect decision.
5. Conclusion
In this paper, PV panel’s parameters are found using Math-Works tool (PV array); hence, by using these parameters, a
ΔI = I(k) − I(k − 1)ΔV = V(k) − V(k − 1)
ΔI/ΔV = −I/V
ΔI/ΔV > −I/V ΔI > 0
ΔI = 0ΔI = 0
𝛼 = 𝛼 − offset 𝛼 = 𝛼 − offset𝛼 = 𝛼 + offset 𝛼 = 𝛼 + offset
Start
Measure V and I
Yes Yes
YesYes
Yes No
NoNo
NoNo
Figure 19: Flowchart of INC algorithm.
PV voltage (V)
PV cu
rren
t (A
)
PV p
ower
(W)
1.0 kW/m2
0.5 kW/m2
H
EB
C
A
F G Load_2
Load_1
D
Negative slope
Positiveslope
Figure 20: P‐V and I‐V curves for solar irradiation 500W/m2
and 1000W/m2.
10 International Journal of Photoenergy

80
P (W
)
60
40
2030
500 W/m2 500 W/m2
1000 W/m2
28
62
60
58
560
0 0.05 0.1 0.15Time (s)
0.2 0.25 0.3 0.35−20
Figure 22: Test result of the INC algorithm.
Start
Measure V and I
ΔV = V(k) − V(k − 1)ΔI = I(k) − I(k − 1)
ΔV = 0
No
𝛼 = 𝛼 − offset 𝛼 = 𝛼 + offset 𝛼 = 𝛼 + offset 𝛼 = 𝛼 − offset
ΔI = 0|ΔI/ΔV + I/V| < 0.07 NoYes
No
ΔI/ΔV > −I/V ΔI > 0
Yes
YesNoYes No
Var = 1
Set Var to 1
No
YesΔV = 0
Yes
Yes
No|ΔI/ΔV + I/V| < 0.07
Yes
Set Var to 0
ΔI > 0&&ΔV > 0No
𝛼 = 𝛼 + offset
Yes
No
Set Var to 0
Figure 21: Flowchart of the proposed INC algorithm.
80
P (W
)
60
40
2030
500 W/m2 500 W/m2
1000 W/m2
29
62
60
58
56
0
0 0.05 0.1 0.15Time (s)
0.2 0.25 0.3 0.35−20
Figure 23: Test result of the modified INC algorithm.
11International Journal of Photoenergy

PV panel and a PV array are modeled, and the results showthat the model is in accordance with experimental data ofthe used panel (MSX-60). In addition, a modified INC algo-rithm which can overcome the confusion faced by the con-ventional INC technique is proposed in this paper. As aresult, the tests show that the modified technique detectsthe fast increase of irradiation and makes a correct decision,contrary to the conventional technique. Moreover, by usingthe modified algorithm, steady-state oscillations are almostneglected. Hence, the loss of energy is minimized; conse-quently, the efficiency is equal to 98.8% instead of 96%obtained by the conventional technique.
As a perspective, the modified INC algorithm can bemore improved and then implemented in an embeddedhardware device.
Nomenclature
a: Diode’s ideality factorI: Output current of the panel (A)Is: Diode saturation current (A)Iph: Panel photocurrent (A)G: Solar irradiation (W/m2)K: Boltzmann constant (J⋅K−1)q: Electron charge (C)R: The load (Ω)Req: The resistance seen by the panel (Ω)Rs: Series resistance (Ω)Rsh: Shunt resistance (Ω)T: Junction temperature (K)V: Output voltage of the panel (V)VO: Output voltage of the boost converter (V)IO: Output current of the boost converter (A)F: Switching frequency (Hz)ΔV: Input voltage ripple of the boost converter (V)ΔVO: Output voltage ripple of the boost converter (V)ΔIL: Inductor current ripple (A).
Greek Letters
α: Duty cycle.
Abbreviations
CCM: Continuous conduction modeFSCC: Fractional short-circuit currentFOCV: Fractional open-circuit voltageINC: Incremental conductanceMPP: Maximum power point
MPPT: Maximum power point trackingP&O: Perturb and observePV: PhotovoltaicSTC: Standard test conditions.
Conflicts of Interest
The authors declare that they have no conflicts of interest.
References
[1] H. Patel and V. Agarwal, “MATLAB-based modeling to studythe effects of partial shading on PV array characteristics,”IEEE Transactions on Energy Conversion, vol. 23, no. 1,pp. 302–310, 2008.
[2] S. Motahhir, A. Chalh, A. Ghzizal, S. Sebti, and A. Derouich,“Modeling of photovoltaic panel by using proteus,” Journalof Engineering Science and Technology Review, vol. 10, no. 2,pp. 8–13, 2017.
[3] S. Motahhir, A. El Ghzizal, S. Sebti, and A. Derouich,“Proposal and implementation of a novel perturb and observealgorithm using embedded software,” in 2015 3rd Interna-tional Renewable and Sustainable Energy Conference (IRSEC),pp. 1–5, Marrakech, Morocco, December 2015.
[4] H. S. Rauschenbach, Solar Cell Array Design Handbook,Van Nostrand Reinhold, 1980.
[5] N. Barth, R. Jovanovic, S. Ahzi, and M. A. Khaleel, “PV panelsingle and double diode models: optimization of the parame-ters and temperature dependence,” Solar Energy Materialsand Solar Cells, vol. 148, pp. 87–98, 2016.
[6] K. Nishioka, N. Sakitani, Y. Uraoka, and T. Fuyuki, “Analysisof multicrystalline silicon solar cells by modified 3-diodeequivalent circuit model taking leakage current throughperiphery into consideration,” Solar Energy Materials andSolar Cells, vol. 91, no. 13, pp. 1222–1227, 2007.
[7] N. Yıldıran and E. Tacer, “Identification of photovoltaic cellsingle diode discrete model parameters based on datasheetvalues,” Solar Energy, vol. 127, pp. 175–183, 2016.
[8] K. Ishaque, Z. Salam, S. Mekhilef, and A. Shamsudin,“Parameter extraction of solar photovoltaic modules usingpenalty-based differential evolution,” Applied Energy, vol. 99,pp. 297–308, 2012.
[9] K. Ishaque and Z. Salam, “An improved modeling methodto determine the model parameters of photovoltaic (PV)modules using differential evolution (DE),” Solar Energy,vol. 85, no. 9, pp. 2349–2359, 2011.
[10] M. F. AlHajri, K. M. El-Naggar, M. R. AlRashidi, and A. K. Al-Othman, “Optimal extraction of solar cell parameters usingpattern search,” Renewable Energy, vol. 44, pp. 238–245, 2012.
Table 3: Comparison of the proposed algorithm with other improved incremental conductance algorithms proposed in scientific literature.
Technique Oscillation level Efficiency (%)Response time during sudden
increase in irradiationIncorrect decision under sudden
increase of irradiation
Conventional 2.5W 96 Slow Yes
[29] 1W 96.40 Fast No
[30] 1.5W 98.5 Fast Yes
[31] 1W 97.5 Medium Yes
Proposed Neglected 98.8 Very fast No
12 International Journal of Photoenergy

[11] Mathworks, PV Array, 2015, Mai 2017, https://fr.mathworks.com/help/physmod/sps/powersys/ref/pvarray.html.
[12] C. Carrero, J. Amador, and S. Arnaltes, “A single procedure forhelping PV designers to select silicon PVmodules and evaluatethe loss resistances,” Renewable Energy, vol. 32, no. 15,pp. 2579–2589, 2007.
[13] T. Radjai, L. Rahmani, S. Mekhilef, and J. P. Gaubert, “Imple-mentation of a modified incremental conductanceMPPT algo-rithm with direct control based on a fuzzy duty cycle changeestimator using dSPACE,” Solar Energy, vol. 110, pp. 325–337, 2014.
[14] J. Ahmed and Z. Salam, “A modified P&O maximum powerpoint tracking method with reduced steady-state oscillationand improved tracking efficiency,” IEEE Transactions onSustainable Energy, vol. 7, no. 4, pp. 1506–1515, 2016.
[15] A. Amir, J. Selvaraj, and N. A. Rahim, “Study of the MPPtracking algorithms: focusing the numerical method tech-niques,” Renewable and Sustainable Energy Reviews, vol. 62,pp. 350–371, 2016.
[16] A. Gupta, Y. K. Chauhan, and R. K. Pachauri, “A com-parative investigation of maximum power point trackingmethods for solar PV system,” Solar Energy, vol. 136,pp. 236–253, 2016.
[17] D. Verma, S. Nema, A. M. Shandilya, and S. K. Dash,“Maximum power point tracking (MPPT) techniques: recapit-ulation in solar photovoltaic systems,” Renewable and Sustain-able Energy Reviews, vol. 54, pp. 1018–1034, 2016.
[18] J. P. Ram, T. S. Babu, and N. Rajasekar, “A comprehensivereview on solar PV maximum power point tracking tech-niques,” Renewable and Sustainable Energy Reviews, vol. 67,pp. 826–847, 2017.
[19] S. Motahhir, A. El Ghzizal, S. Sebti, and A. Derouich, “Shadingeffect to energy withdrawn from the photovoltaic panel andimplementation of DMPPT using C language,” InternationalReview of Automatic Control, vol. 9, no. 2, pp. 88–94, 2016.
[20] K. S. Tey and S. Mekhilef, “Modified incremental conductanceMPPT algorithm to mitigate inaccurate responses under fast-changing solar irradiation level,” Solar Energy, vol. 101,pp. 333–342, 2014.
[21] Solarex MSX60 and MSX64 photovoltaic panel, data-sheet1998, April 2017, https://www.solarelectricsupply.com/media/custom/upload/Solarex-MSX64.pdf.
[22] F. Bayrak, G. Ertürk, and H. F. Oztop, “Effects of partial shad-ing on energy and exergy efficiencies for photovoltaic panels,”Journal of Cleaner Production, vol. 164, pp. 58–69, 2017.
[23] S. Motahhir, A. El Ghzizal, S. Sebti, and A. Derouich, “MIL andSIL and PIL tests for MPPT algorithm,” Cogent Engineering,vol. 4, p. 1378475, 2017.
[24] S. Sivakumar, M. J. Sathik, P. S. Manoj, and G. Sundararajan,“An assessment on performance of DC–DC converters forrenewable energy applications,” Renewable and SustainableEnergy Reviews, vol. 58, pp. 1475–1485, 2016.
[25] N. Mohan and T. M. Undeland, Power Electronics: Converters,Applications, and Design, John Wiley & Sons, 2007.
[26] S. Maniktala, Switching Power Supplies A-Z, Elsevier, 2012.[27] M. H. Rashid, Power Electronics: Circuits, Devices, and Appli-
cations, Pearson Education India, 2009.[28] A. Loukriz, M. Haddadi, and S. Messalti, “Simulation and
experimental design of a new advanced variable step size incre-mental conductance MPPT algorithm for PV systems,” ISATransactions, vol. 62, pp. 30–38, 2016.
[29] A. Belkaid, I. Colak, and O. Isik, “Photovoltaic maximumpower point tracking under fast varying of solar radiation,”Applied Energy, vol. 179, pp. 523–530, 2016.
[30] M. A. G. De Brito, L. Galotto, L. P. Sampaio, G. de Azevedo eMelo, and C. A. Canesin, “Evaluation of the main MPPT tech-niques for photovoltaic applications,” IEEE Transactions onIndustrial Electronics, vol. 60, no. 3, pp. 1156–1167, 2013.
[31] P. C. Sekhar and S. Mishra, “Takagi–Sugeno fuzzy-basedincremental conductance algorithm for maximum powerpoint tracking of a photovoltaic generating system,” IETRenewable Power Generation, vol. 8, no. 8, pp. 900–914, 2014.
13International Journal of Photoenergy

TribologyAdvances in
Hindawiwww.hindawi.com Volume 2018
Hindawiwww.hindawi.com Volume 2018
International Journal ofInternational Journal ofPhotoenergy
Hindawiwww.hindawi.com Volume 2018
Journal of
Chemistry
Hindawiwww.hindawi.com Volume 2018
Advances inPhysical Chemistry
Hindawiwww.hindawi.com
Analytical Methods in Chemistry
Journal of
Volume 2018
Bioinorganic Chemistry and ApplicationsHindawiwww.hindawi.com Volume 2018
SpectroscopyInternational Journal of
Hindawiwww.hindawi.com Volume 2018
Hindawi Publishing Corporation http://www.hindawi.com Volume 2013Hindawiwww.hindawi.com
The Scientific World Journal
Volume 2018
Medicinal ChemistryInternational Journal of
Hindawiwww.hindawi.com Volume 2018
NanotechnologyHindawiwww.hindawi.com Volume 2018
Journal of
Applied ChemistryJournal of
Hindawiwww.hindawi.com Volume 2018
Hindawiwww.hindawi.com Volume 2018
Biochemistry Research International
Hindawiwww.hindawi.com Volume 2018
Enzyme Research
Hindawiwww.hindawi.com Volume 2018
Journal of
SpectroscopyAnalytical ChemistryInternational Journal of
Hindawiwww.hindawi.com Volume 2018
MaterialsJournal of
Hindawiwww.hindawi.com Volume 2018
Hindawiwww.hindawi.com Volume 2018
BioMed Research International Electrochemistry
International Journal of
Hindawiwww.hindawi.com Volume 2018
Na
nom
ate
ria
ls
Hindawiwww.hindawi.com Volume 2018
Journal ofNanomaterials
Submit your manuscripts atwww.hindawi.com