Embed Size (px)
Citation preview
The University of Manchester Research
Modeling of Transverse Compression Behavior of Yarns
DOI:10.13475/j.fzxb.20161004207
Document VersionAccepted author manuscript
Link to publication record in Manchester Research Explorer
Citation for published version (APA):Guanzhi, L., Qiang, Z., Jun, W., & Gong, R. (2017). Modeling of Transverse Compression Behavior of Yarns.Textile Research Journal, 184-190. https://doi.org/10.13475/j.fzxb.20161004207
Published in:Textile Research Journal
Citing this paperPlease note that where the full-text provided on Manchester Research Explorer is the Author Accepted Manuscriptor Proof version this may differ from the final Published version. If citing, it is advised that you check and use thepublisher's definitive version.
General rightsCopyright and moral rights for the publications made accessible in the Research Explorer are retained by theauthors and/or other copyright owners and it is a condition of accessing publications that users recognise andabide by the legal requirements associated with these rights.
Takedown policyIf you believe that this document breaches copyright please refer to the University of Manchester’s TakedownProcedures [http://man.ac.uk/04Y6Bo] or contact [email protected] providingrelevant details, so we can investigate your claim.
Download date:05. Feb. 2022
Modeling of Transverse Compression Behavior of Yarns
Li Guanzhi 1,2, Zhao Qiang 1,2, Wang Jun 1, 3,Hugh Gong4
(1.School of Textiles, Donghua University,Shanghai; 2.China Textile Academy,Beijing;
3.State Key Laboratory on Fabrics, Donghua University, Shanghai;4.School of Materials,
University of Manchester, M13 9PL, UK
Abstract: On the basis of an ellipse cross-section yarn model, the relationships among the yarn
parameters such as cross-sectional area Sy, yarn cross-sectional perimeter Sp, void ratio Vf, yarn
flattening ratio f, and yarn density ρy during fabric deformation process were evaluated. The
theoretical model indicated that these parameters could be simplified to two factors: Sy and Sp. To
validate the theoretical model, the Finite Element Modeling (FEM) and experimental tests were
conducted to assess the deformation process of a cotton plain fabric. The results showed that the
cross-sectional area varied almost 2 or 3 times more than the cross-sectional perimeter. The rate of
change of the cross-sectional perimeter was about 8~17 %, while which was 17~42 % for
cross-sectional area. The correlation analysis among the ellipse major axis, which has a significant
influence on fabric appearance, the cross-sectional perimeter, and the cross-sectional area was also
conducted. The weak correlation between ellipse major axis and a cross-sectional perimeter was
observed, while ellipse major axis and cross-sectional area was uncorrelated. These findings can
help to overcome the drawbacks of the yarn evenness tester when predicting the fabric appearance
quality.
Keywords: yarn evenness; yarn flattening ratio; finite element analysis; image processing
1 Introduction
Yarn cross-section shape makes a big difference to fabric appearance. As early as
1969, Hearle[1] claimed that yarn cross section was an irregular polygon. The reason
for the irregularity is that the fibers become unevenly distributed in transverse as a
result of stress distribution arising from interactions among fiber property, yarn
property, and spinning parameters among others. Fiber characteristics determine the
cross-sectional shape of yarn in bobbins and spinning process. When considering the
stress yarn suffered during the weaving process, the yarn face to stretching, bending,
rotating and flattening, as a result of the cross-sectional shape of the yarn in fabrics
changed greatly.
In the previous works, to simplify the calculation, most of the researchers
assumed the cross-sectional shape of the yarn in bobbins is circular. In fact, only a
few most compacted yarns for example cords used in automobile tires, the
cross-sectional shape is circular. Ring spinning or rotor yarn was considered to have
an elliptical cross-section. Tsai&Chu[2] pointed out that ring and rotor spun yarns are
more nearly elliptical. The ellipticities f t(f t =a/b, a,b is the major and minor radius of
yarn cross-section) of the best-fit ellipses for ring yarn and rotor spun yarn is 1.09 and
1.07 respectively. The flattening ratio f as f=b/a is 0.917 for ring spun yarns and 0.935
for rotor spun yarns; it shows that rotor yarn was more circular than the ring-spun
yarn which could be attributed to the smaller linear density and yarn twist of
ring-spun yarn. Gunay[3]detected the diameter of the shadow blocked by the yarn core
with CCD sensors and approximated the major and minor radius of the ellipse by the
maximum and minimum length when rotated the yarn, then the flattening ratio f it
could be calculated. He got the values of 30 random locations of a ring-spun yarn with
a yarn count of 17 Ne. The distribution is normal with a mean eccentricity of 0.5
(flattening ratio f =0.866), and the eccentricity is between 0.4 to 0.65(0.76<f <0.99).
When considering the yarn in the fabrics, the yarn was stretched, bent and
flattened; most approaches described the shape of yarn cross-sectional shape as
circular, elliptical, et cetera[4-6] and assumed to have a constant cross-section. In fact,
yarn cross-sectional shape varied depending on the types and structures of the yarns
and fabric. Even in the same yarn, the cross-sectional shape of yarn was different as
result of the compression occurred over the region of contact and released over
low-press contact region. Before, It is hard to study the cross-section deformation due
to the limited of the techniques. Until 2009, Gong[7] abstained continuous yarn
cross-sectional shape scanned by the synchrotron facility of ESRF in France without
destroying the fabric structures. In his detailed study, the yarn cross-sectional shape
can be treated as an ellipse, and ellipse fitting was found to be more suitable for
cotton fabrics. Moreover, also the cross-sectional shape of yarn varied along the yarn
path as a result of deformation. After that, further studies carried out by Ozgen &
Gong[8] investigated the yarn cross-section changes in woven fabrics and the
relationship between the changes in yarn and fabric parameters. A general equation of
change in yarn flattening coefficient was developed with regression analysis method.
These studies could improve the simulations of yarn deformation and fabric
appearance.
However, It is very challenging to predict the fabric appearance with bobbin yarn.
Uster made a great attempt with capacitive yarn evenness testers. The capacitive
evenness tester employs air capacitors as detectors to evaluate yarn evenness from the
principle that the dielectric constant of fiber material is longer than that of air. As the
yarn passes between two metal plates with an electric field, the capacitance changes
the amount of fiber in the yarn section. The changes in capacitance were used to
evaluate yarn evenness and predict fabric appearance qualities. The principle was
based on the assumption that the yarn in bobbins maintained specific numbers during
the process of weaving. In fact, yarn evenness was affected both by fiber numbers and
the air gap between fiber which is known as yarn appearance unevenness, they all
play a major role in fabric appearance. Recently the manufactures of yarn evenness
tester found out the drawback of the capacitive method. So many commercial
equipment providers such as USTER and CHANGLING, they were inclined to add
the photoelectric module in previous capacitive testers to improve the reality of
simulated fabrics[9]. However, the results were still not plausible. While another
reported development in the yarn evenness measurement system, Lawson-Hemphill
EIB, was highly valued which determines the yarn diameter using a line array CCD
sensor to characterize the yarns and simulate yarn board and fabric appearances[10].
Many researchers also made useful attempts towards this work. LIU pointed out
that the evenness tested by EIB was slightly higher than the capacitive testers[11].
Moreover, the CV value is more suitable to represent yarn appearance. Besides, many
researchers devote to the study of yarn appearance test. Carvalho et al [12].presented a
yarn characterization system and yarn diameter measurement using diode laser system.
There have been commendable developments in yarn diameter measurement by image
processing. However, Carvalho[12] et al. acknowledged that the calculated yarn
diameter changes when the image is captured in a different direction. Hamilton[13]
proposed a method to measures both major and minor thread diameters under
conditions of thread tension and compression.
All the above method is from the perspective of yarn quality assurance to
evaluate yarn qualities. They did significant advancements in the study the parameters
changes of yarn cross-sectional shape during the weaving process and which
parameters link the yarn quality and fabric quality. This is the key to consistency
evaluation between yarn qualities and fabric qualities. So this paper further explores
the idea.
2 Theoretical analysis and parameter selection
To evaluate yarn quality and fabric quality with the same criterion, the yarn
cross-sectional shape both the bobbin yarn and yarn in the fabric is assumed to be an
ellipse.
In weaving process, the yarn cross-section is deformed under the forces of
stretching, bending, twisting and flattening. It is evident that the yarn cross-section
parameters, including yarn cross section area Sy, yarn cross section perimeter Sp, fiber
porosity Vf, yarn flattened ratio f, and yarn density ρy, are changing during the weaving
process. Therefore, we will evaluate the changing role of these parameters in the
fabric.
2.1 Theoretical analysis and parameter selecting
0
01
0
0
1
2b
2a 2a’
2b’
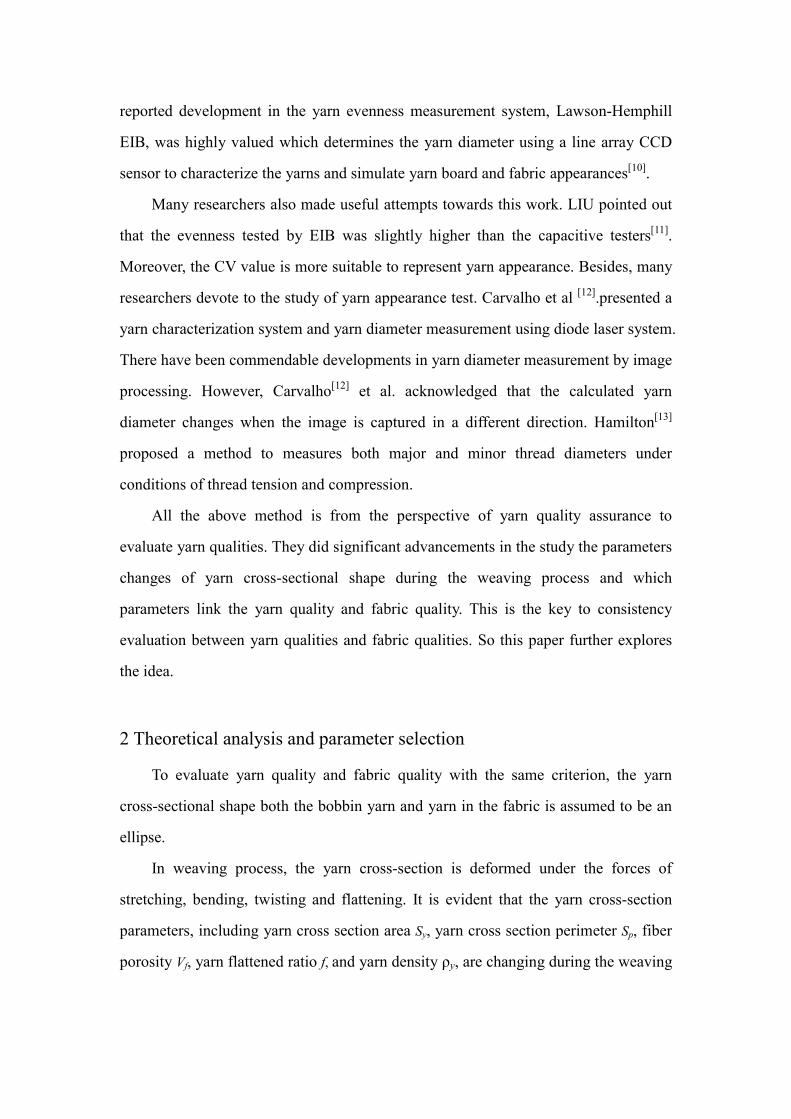
Fig. 1. yarn cross section model, (a) under natural conditions, and (b) in fabric.
Fig. 1(a) shows the cross-section model of individual yarn, with the major axis of
2a and minor axis of 2b. Other parameters are fiber porosity Vf, the yarn cross-section
area , yarn cross-section perimeter , yarn density ρy and yarn flattening
coefficient f. Fig. 1(b) presents the yarn cross section of a yarn in a fabric. The yarn
cross-section major axis and minor axis are 2a’ and 2b’ respectively, with the fiber
porosity factor Vf’, yarn cross-section area ‘, yarn cross section perimeter ’, yarn
density ρy’ and yarn flattening coefficient f ’.
The following study is based on the assumption that the fiber number n, fiber
cross-section area Sf and fiber density ρf are constant in yarn and fiber axial slip does
not exist during the weaving process.
Fiber porosity: = ×, ′ = ×
. Since the total fiber area × is the
same before and after weaving, the fiber porosity in the yarn is inversely proportional
to yarn cross-section area, i.e. ∝ .
Yarn density: ρy=× × ×× = × × = × ρ . Similar to fiber porosity, yarn
density is also inversely proportional to yarn cross-section area, i.e. ρ ∝ .
Yarn cross-section perimeter , yarn cross-section area , and yarn flattening
coefficient f:
yarn cross-section perimeter can be obtained through the following formula.
=4a 1 − sin( ) = 4 1 − (1 − ) sin( ) (1)
From the above formula, the relationship between the yarn cross-section
perimeter, is a co-determination of and , also ∝ .
From the above analysis, it can be obtained that fiber porosity Vf and yarn
density ρy are both proportional to yarn cross-section area . While the relationship
between the yarn cross-section perimeter and yarn cross-section area is
complex, which needs a further verification. Hence and are two major yarn
cross-section parameters considered in this paper.
yarn cross-section perimeter and yarn cross-section area are determined
by the surface fiber of the yarn. The following study is based on the assumption that
the outer fiber of the yarn was closed packed. Then the changes of yarn parameters
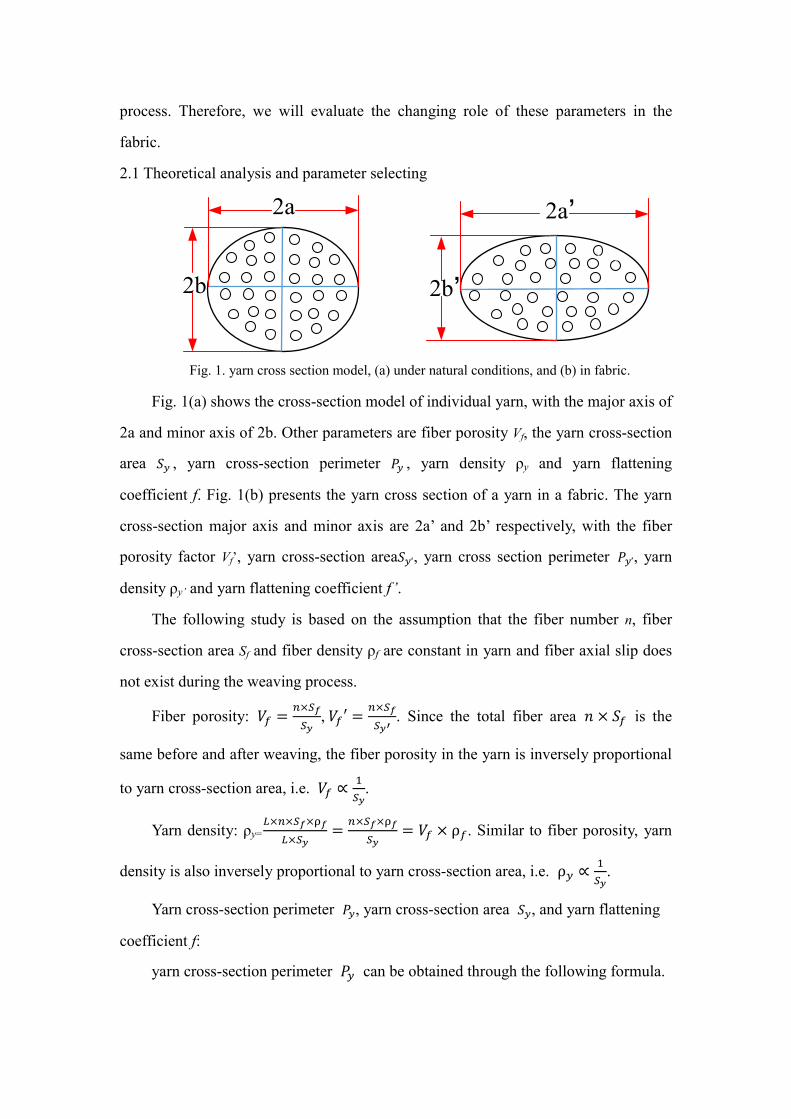
was decided by the air gap surrounded by outer fiber of the yarn. Here is 3 tpyes of
packing deformation under compressions:
When the fiber porosity Vf is minimum as shown in Fig2(a),all the fibers tightly
packed together. So during the process of yarn facing the compression of stress, the
cross-section perimeter increase while almost maintaine the same Fig2(b),
form 1; When he fiber porosity Vf is maximum as shown in Fig2(c), inside of the
yarn is empty. If the outer fibers tied together during the compression process rather
than slip into the yarn core, the cross-section perimeter almost maintaine the same
while decrease, in Fig2(d), form 2; If the yarn slip into the yarn core as shown in
Fig2(f), the cross-section perimeter decrease and decrease, form 3. The
reality yarn must be one of the form 1-3, which need further studies.
form1
(a) (b)
form2
(c) (d)
form3
(e) (f)
Fig. 2 Analysis of yarn compression.
Yarn cross-section area Sy and yarn cross-section perimeter Sp in the fabric is
caused by the forces acting on the contact area of yarns. Those forces are influenced
by many complex factors, such as yarn property, weaving process, and fabric structure
and so on. To investigate the variation of the yarn during the weaving process, the
finite element analysis (FEA) is adopted.
2.2 Model construction and simulation
In the current study, the plain woven fabric composed of 20 tex cotton yarn is
taken as the control group. Warp cover factor and weft cover factor of the fabric are
16 and 12 respectively. The yarn was designed as a cotton yarn packed by 60 fibers.
Assuming that the major axis of the oval yarn cross-section is 2a=0.2mm, and the
minor axis is 2b=0.16mm. The yarn parameters set in Abaqus[14] (software) are
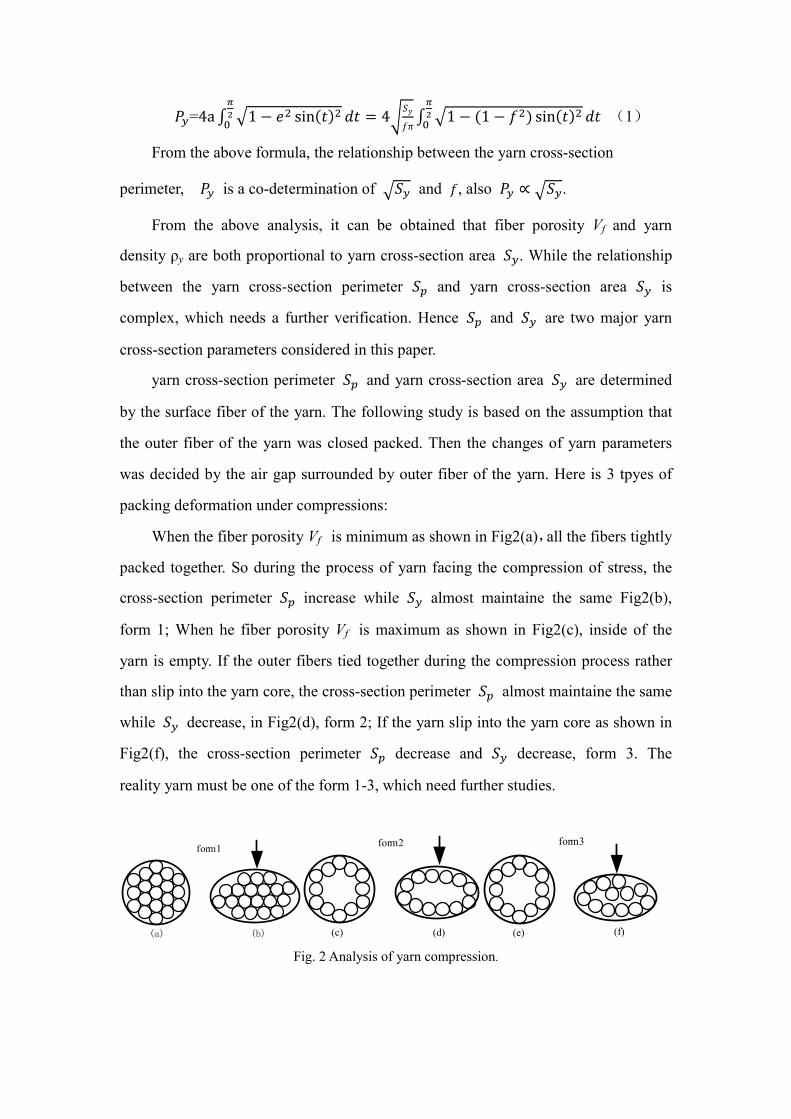
presented in Table 1. The generated fabric model is shown in Fig.3(a). The file was
imported into Abaqus software, and assuming that three weft yarns alternatingly
moved according to the interlacing, the relative displacement is set as 0.42mm.
Tab. 1 Yarn parameters in Abaqus
yarn density
fabric
thickness
Young
modulus X
Young
modulus Y
Young
modulus Z
20tex 0.3 3820Mpa 3820Mpa 3820Mpa
cotton fiber
density
friction
coefficient
Poisson's
ratio X
Poisson's
ratio Y
Poisson's ratio
Z
1.54g/cm3 0.2 0.3 0.4 0.4
Fig. 3 Contours of the fabric weaving modeling.
For simplicity, the middle yarn in Fig. 3 was chosen to compare the variation of
the yarn cross-section perimeter and yarn cross-section area before and after weaving.
Fig. 4 shows the change of yarn cross-section as a function of time during fabric
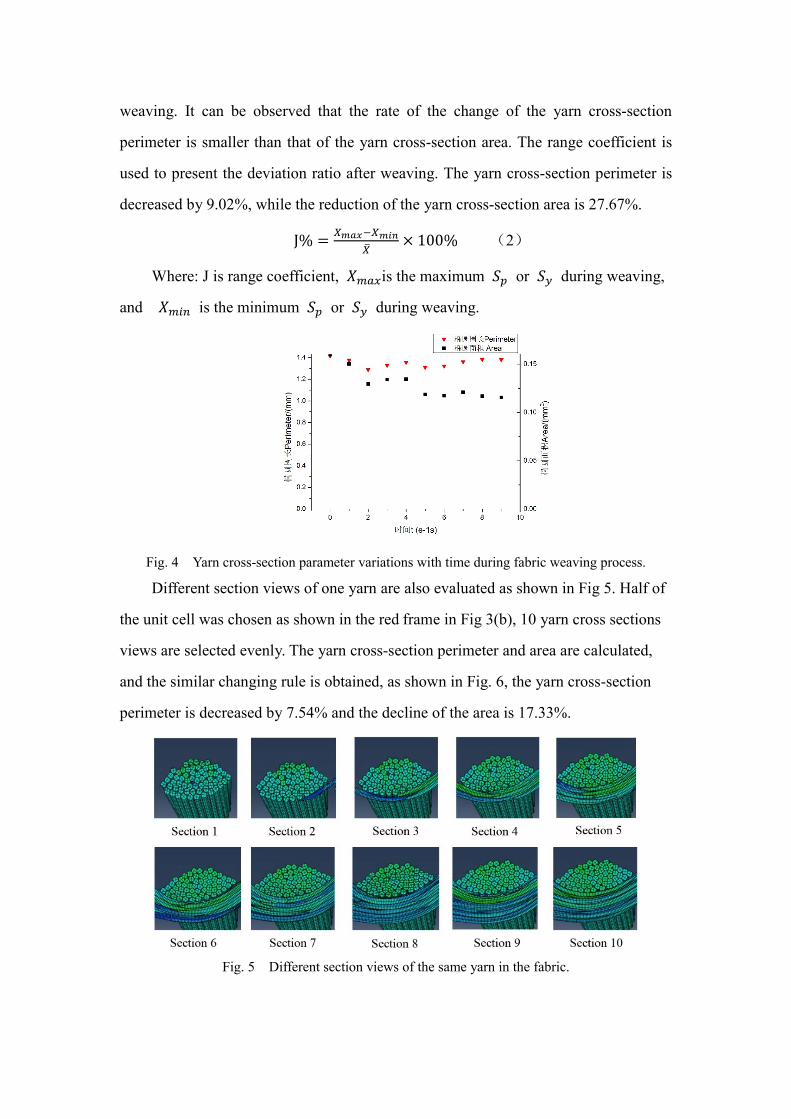
weaving. It can be observed that the rate of the change of the yarn cross-section
perimeter is smaller than that of the yarn cross-section area. The range coefficient is
used to present the deviation ratio after weaving. The yarn cross-section perimeter is
decreased by 9.02%, while the reduction of the yarn cross-section area is 27.67%. J% = × 100% (2)
Where: J is range coefficient, is the maximum or during weaving,
and is the minimum or during weaving.
Fig. 4 Yarn cross-section parameter variations with time during fabric weaving process.
Different section views of one yarn are also evaluated as shown in Fig 5. Half of
the unit cell was chosen as shown in the red frame in Fig 3(b), 10 yarn cross sections
views are selected evenly. The yarn cross-section perimeter and area are calculated,
and the similar changing rule is obtained, as shown in Fig. 6, the yarn cross-section
perimeter is decreased by 7.54% and the decline of the area is 17.33%.
Fig. 5 Different section views of the same yarn in the fabric.
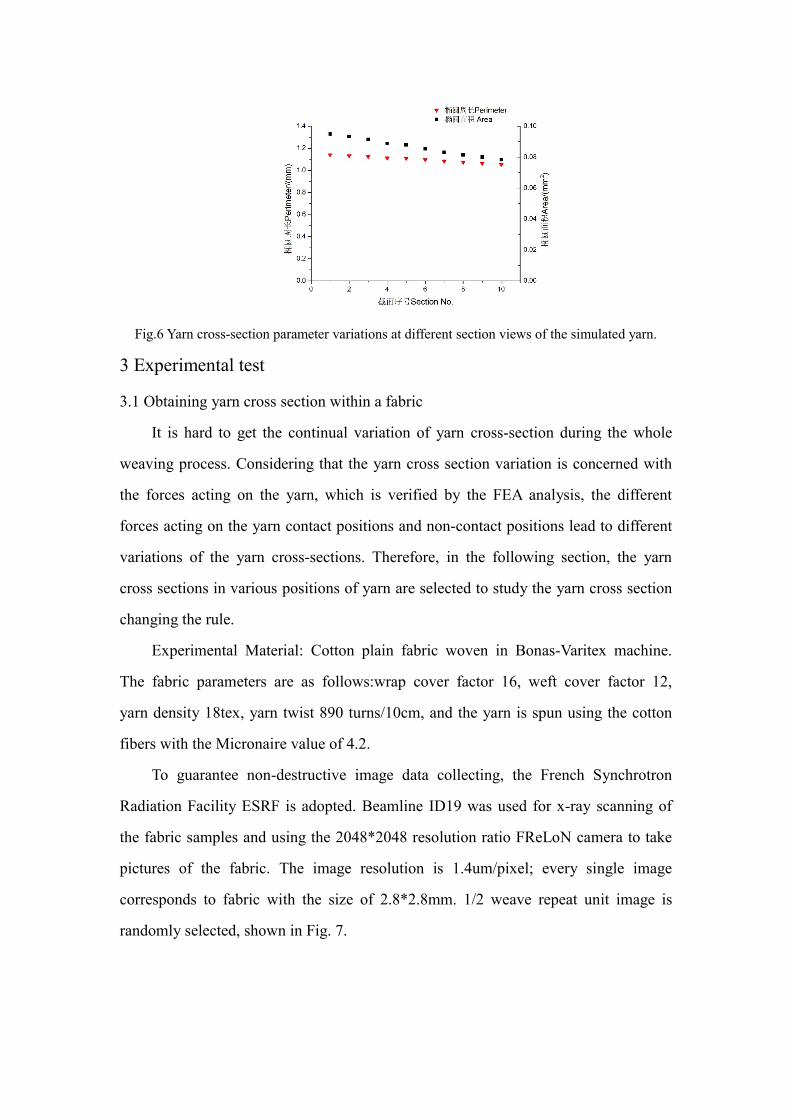
Fig.6 Yarn cross-section parameter variations at different section views of the simulated yarn.
3 Experimental test
3.1 Obtaining yarn cross section within a fabric
It is hard to get the continual variation of yarn cross-section during the whole
weaving process. Considering that the yarn cross section variation is concerned with
the forces acting on the yarn, which is verified by the FEA analysis, the different
forces acting on the yarn contact positions and non-contact positions lead to different
variations of the yarn cross-sections. Therefore, in the following section, the yarn
cross sections in various positions of yarn are selected to study the yarn cross section
changing the rule.
Experimental Material: Cotton plain fabric woven in Bonas-Varitex machine.
The fabric parameters are as follows:wrap cover factor 16, weft cover factor 12,
yarn density 18tex, yarn twist 890 turns/10cm, and the yarn is spun using the cotton
fibers with the Micronaire value of 4.2.
To guarantee non-destructive image data collecting, the French Synchrotron
Radiation Facility ESRF is adopted. Beamline ID19 was used for x-ray scanning of
the fabric samples and using the 2048*2048 resolution ratio FReLoN camera to take
pictures of the fabric. The image resolution is 1.4um/pixel; every single image
corresponds to fabric with the size of 2.8*2.8mm. 1/2 weave repeat unit image is
randomly selected, shown in Fig. 7.
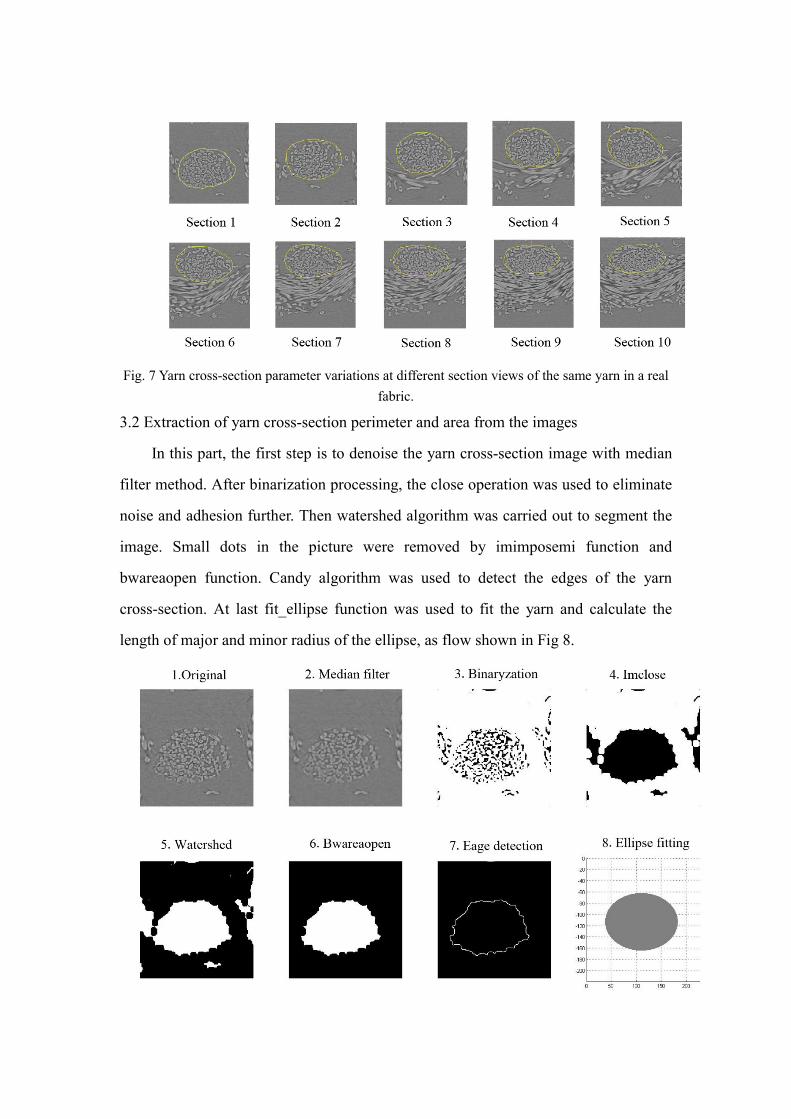
Fig. 7 Yarn cross-section parameter variations at different section views of the same yarn in a real
fabric.
3.2 Extraction of yarn cross-section perimeter and area from the images
In this part, the first step is to denoise the yarn cross-section image with median
filter method. After binarization processing, the close operation was used to eliminate
noise and adhesion further. Then watershed algorithm was carried out to segment the
image. Small dots in the picture were removed by imimposemi function and
bwareaopen function. Candy algorithm was used to detect the edges of the yarn
cross-section. At last fit_ellipse function was used to fit the yarn and calculate the
length of major and minor radius of the ellipse, as flow shown in Fig 8.
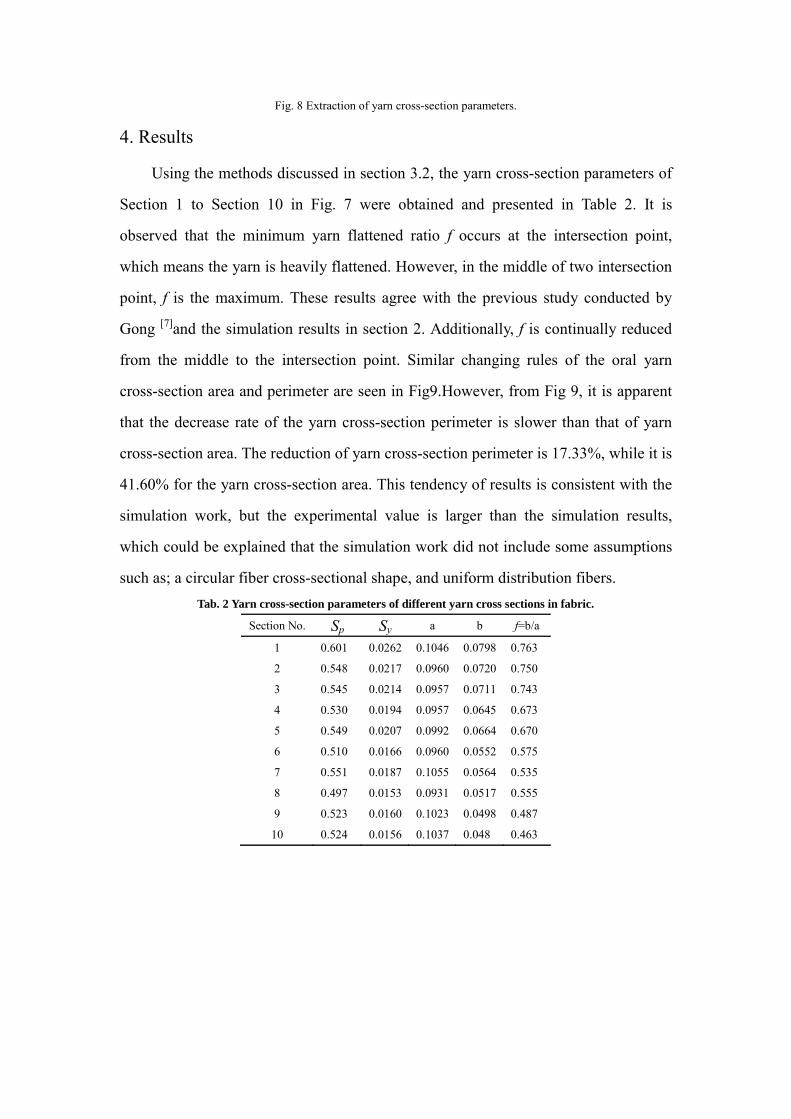
Fig. 8 Extraction of yarn cross-section parameters.
4. Results
Using the methods discussed in section 3.2, the yarn cross-section parameters of
Section 1 to Section 10 in Fig. 7 were obtained and presented in Table 2. It is
observed that the minimum yarn flattened ratio f occurs at the intersection point,
which means the yarn is heavily flattened. However, in the middle of two intersection
point, f is the maximum. These results agree with the previous study conducted by
Gong [7]and the simulation results in section 2. Additionally, f is continually reduced
from the middle to the intersection point. Similar changing rules of the oral yarn
cross-section area and perimeter are seen in Fig9.However, from Fig 9, it is apparent
that the decrease rate of the yarn cross-section perimeter is slower than that of yarn
cross-section area. The reduction of yarn cross-section perimeter is 17.33%, while it is
41.60% for the yarn cross-section area. This tendency of results is consistent with the
simulation work, but the experimental value is larger than the simulation results,
which could be explained that the simulation work did not include some assumptions
such as; a circular fiber cross-sectional shape, and uniform distribution fibers.
Tab. 2 Yarn cross-section parameters of different yarn cross sections in fabric.
Section No. Sp Sy a b f=b/a
1 0.601 0.0262 0.1046 0.0798 0.763
2 0.548 0.0217 0.0960 0.0720 0.750
3 0.545 0.0214 0.0957 0.0711 0.743
4 0.530 0.0194 0.0957 0.0645 0.673
5 0.549 0.0207 0.0992 0.0664 0.670
6 0.510 0.0166 0.0960 0.0552 0.575
7 0.551 0.0187 0.1055 0.0564 0.535
8 0.497 0.0153 0.0931 0.0517 0.555
9 0.523 0.0160 0.1023 0.0498 0.487
10 0.524 0.0156 0.1037 0.048 0.463
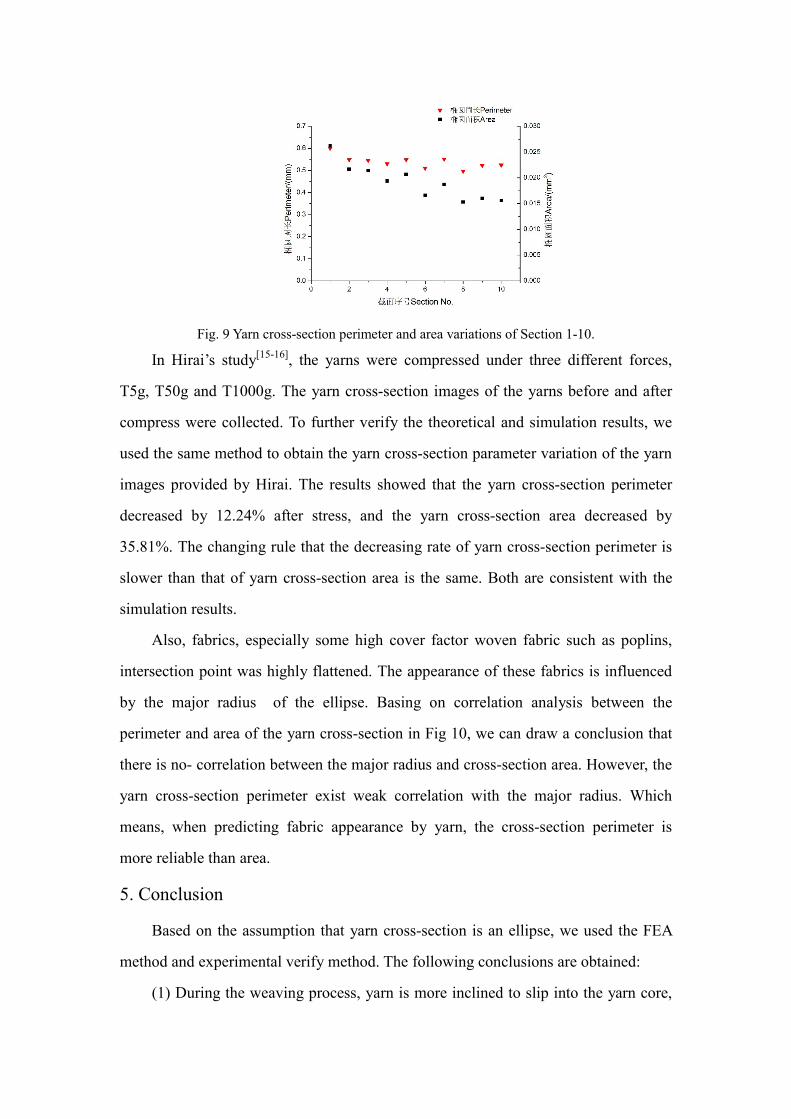
Fig. 9 Yarn cross-section perimeter and area variations of Section 1-10.
In Hirai’s study[15-16], the yarns were compressed under three different forces,
T5g, T50g and T1000g. The yarn cross-section images of the yarns before and after
compress were collected. To further verify the theoretical and simulation results, we
used the same method to obtain the yarn cross-section parameter variation of the yarn
images provided by Hirai. The results showed that the yarn cross-section perimeter
decreased by 12.24% after stress, and the yarn cross-section area decreased by
35.81%. The changing rule that the decreasing rate of yarn cross-section perimeter is
slower than that of yarn cross-section area is the same. Both are consistent with the
simulation results.
Also, fabrics, especially some high cover factor woven fabric such as poplins,
intersection point was highly flattened. The appearance of these fabrics is influenced
by the major radius of the ellipse. Basing on correlation analysis between the
perimeter and area of the yarn cross-section in Fig 10, we can draw a conclusion that
there is no- correlation between the major radius and cross-section area. However, the
yarn cross-section perimeter exist weak correlation with the major radius. Which
means, when predicting fabric appearance by yarn, the cross-section perimeter is
more reliable than area.
5. Conclusion
Based on the assumption that yarn cross-section is an ellipse, we used the FEA
method and experimental verify method. The following conclusions are obtained:
(1) During the weaving process, yarn is more inclined to slip into the yarn core,
form 3, both the cross-section perimeter Sp decrease and cross-section perimeter Sy
decrease.
(2) The variation of the yarn cross-section parameters, yarn cross-section area Sy,
yarn cross-section perimeter Sp, fiber porosity factor Vf, yarn flattening coefficient f
and yarn density ρy during the yarn deformation in weaving process can be simplified
to yarn cross-section area Sy and yarn cross-section perimeter Sp.
(3) During the yarn deformation process, the change rate of the yarn
cross-section perimeter is far less than that of the yarn cross-section area. The change
rate of the yarn cross-section perimeter is between 8% to 17%. For the yarn
cross-section area, the change rate is 14% to 42%, which is 2 to 3 times the yarn
cross-section perimeter.
(4) Fabric appearance was mainly affected by the major radius of yarn
cross-sectional elliptical shape. Moreover, major radius and cross-section area Sy exist
no- correlation; however, the yarn cross-section perimeter Sp exist weak correlation.
When predicting fabric appearance from the yarn properties, the parameter
cross-section perimeter is more reliable than area.
The current study is beneficial to improve existed the drawback of yarn evenness
testers in predicting fabric appearance. The work is helpful to evaluate yarn quality
and fabric quality with the same criterion and provide a new view of designing a new
evenness testers.
Reference
[1] HEARLE J W, GROSBERG P, BACKER S. Structural mechanics of fibers,
yarns, and fabrics[M]. New York: Wiley-Interscience 1969:175-211.
[2] TSAI I, CHU W. The measurement of yarn diameter and the effect of shape
error factor (SEF) on the measurement of yarn evenness[J]. Journal of the Textile
Institute, 1996, 87(3): 496-508.
[3] GÜNAY M. Characterization and Quantification of Woven Fabric
Irregularities Using 2-D Anisotropy Measures[D]. North Carolina State University,
2005.
[4] FREDERICK T P, D Sc, F Inst P, et al. The geometry of cloth structure[J].
Journal of the Textile Institute Transactions, 1937, 28(3): 11-22.
[5] KEMP A. An extension of Peirce's cloth geometry to the treatment of
non-circular threads[J]. Journal of the Textile Institute Transactions, 1958, 49(1):
44-48.
[6] SHANAHAN W J, HEARLE J W S. An energy method for calculations in
fabric mechanics part II: examples of application of the method to woven fabrics[J].
Journal of the Textile Institute, 1978, 69(4): 92-100.
[7] GONG R H, OZGEN B, SOLEIMANI M. Modeling of yarn cross-section in
plain woven fabric[J]. Textile Research Journal, 2009, 79(11): 1014-1020.
[8] OZGEN B, GONG R H. Modelling of yarn flattening in woven fabrics[J].
Textile Research Journal, 2011, 81(15): 1523-1531.
[9] USTER® TESTER 5 Brochure[EB/OL]. [2016-05-01]. http://www.uster.com
/fileadmin/customer/Knowle-dge/Textile_Know_How/Yarn_testing/U_T5_S800
_High_sped_testing_in_01.pdf.
[10] Electronic inspection board[EB/OL].[2016-07-01]. http://www.
lawsonhemphill.com/assets/lh-481-eib-s.pdf.
[11] LIU Changban. The study of yarn comprehensive evaluation with CTT
system[D]. Tianjin: Tianjin Polytechnic University, 2007.
[12] CARVALHO V, GONÇPALVES N, SOARES F, et al. An overview over
yarn mass parameterization methods[C]// Sensor devices 2011, The second
international conference on sensor device technologies and applications, 2011: 18-24.
[13] HAMILTON J B. A direct method for measuring yarn diameters and bulk
densities under conditions of thread flattening—reply[J]. Journal of the Textile
Institute Transactions, 1959, 50(12): 655-672.
[14] LIN H, SHERBURN M, CROOKSTON J, et al. Finite element modelling of
fabric compression[J]. Modelling & Simulation in Materials Science & Engineering,
2008, 16(3):697-704..
[15] HIRAI T, FUKAI S, SENBA T. Yarn tensile property for analysis: finite
element analysis on the biaxial tensile properties of woven fabrics (part 2)[J]. Journal
of the Textile Machinery Society of Japan Transactions, 1982, 35: 79-86.
[16] HIRAI T, SENBA T, IBARAKI N. Application to design of woven fabrics:
finite element analysis on the biaxial tensile properties of woven fabrics (part 3)[J].
Journal of the Textile Machinery Society of Japan Transactions, 1982, 35: 87-96.