Embed Size (px)
Citation preview
Modeling Permafrost – a CMT component
Elchin JafarovVladimir Romanovsky
Sergei Marchenko
Geophysical InstituteUniversity of Alaska Fairbanks
Boulder, October, 2011
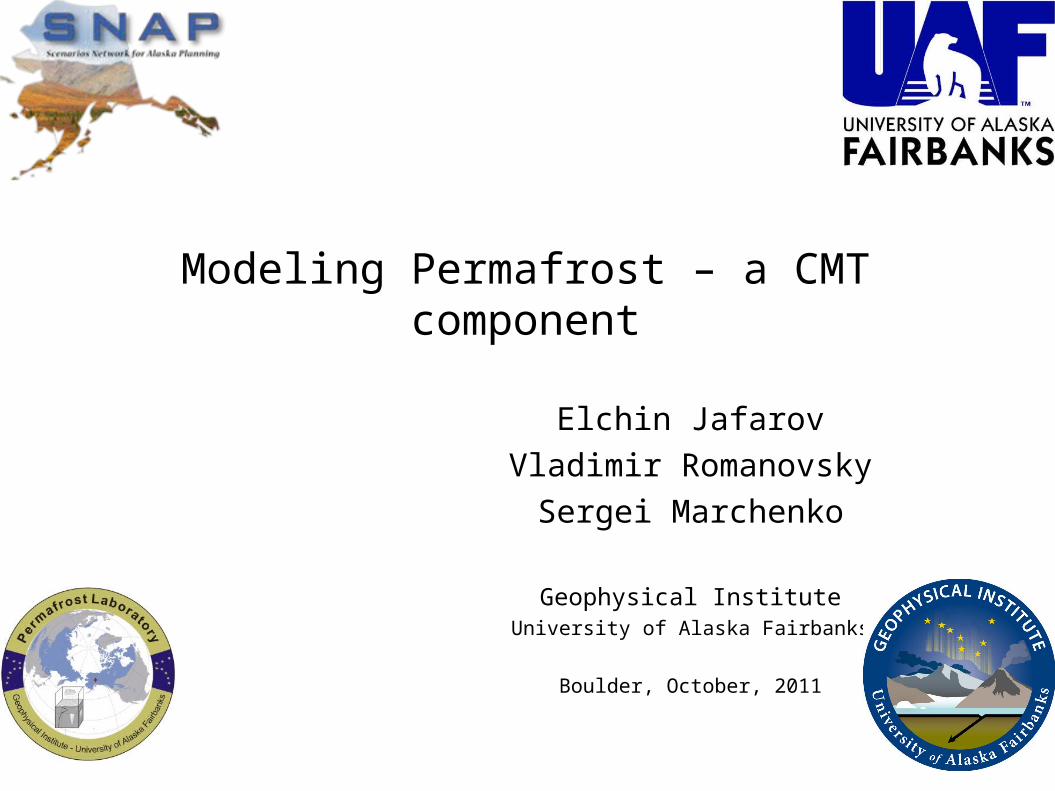
Frozen Soil (Permafrost)
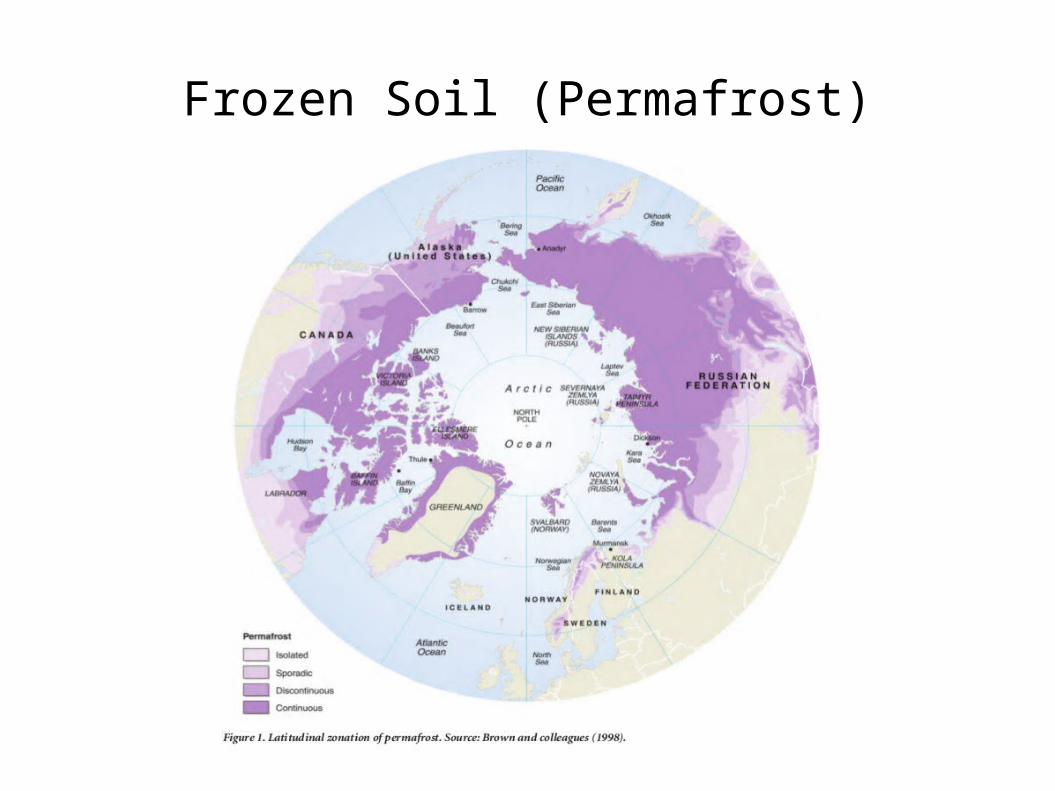
Thawing Permafrost
http://www.libraryindex.com/pages/3372/Permafrost.htmlhttp://ipy.arcticportal.org/index.php?/ipy/detail/permafrost/http://nasadaacs.eos.nasa.gov/articles/2005/2005_permafrost.html
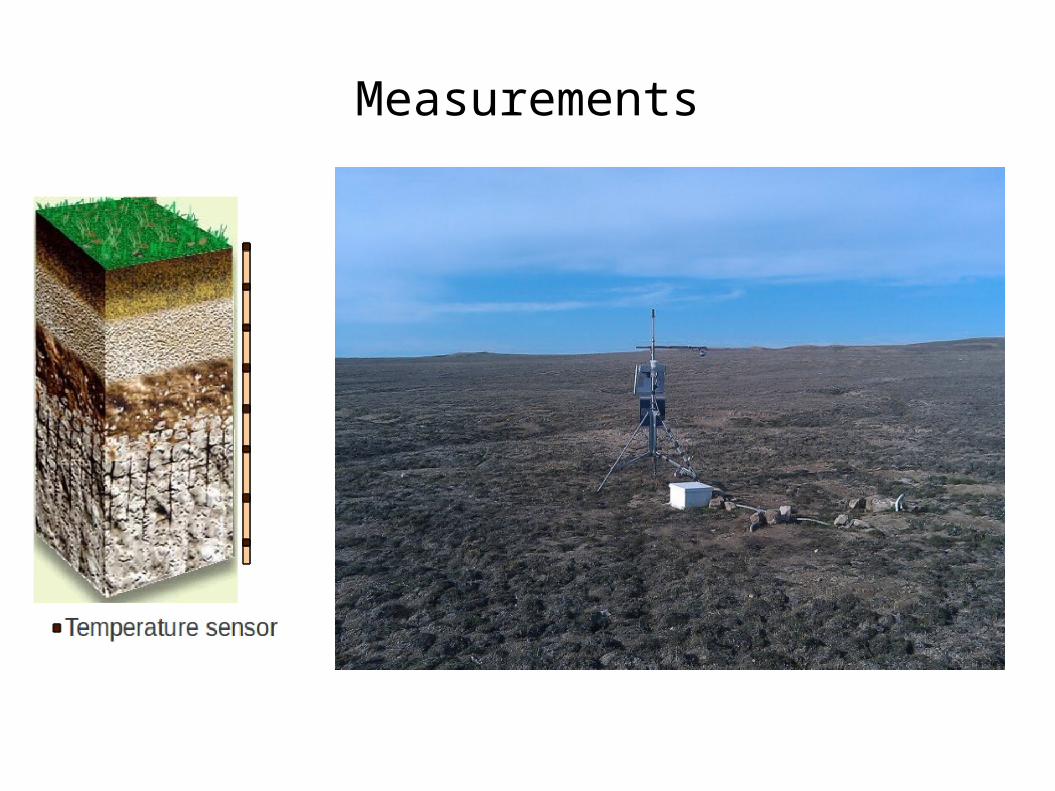
Measurements
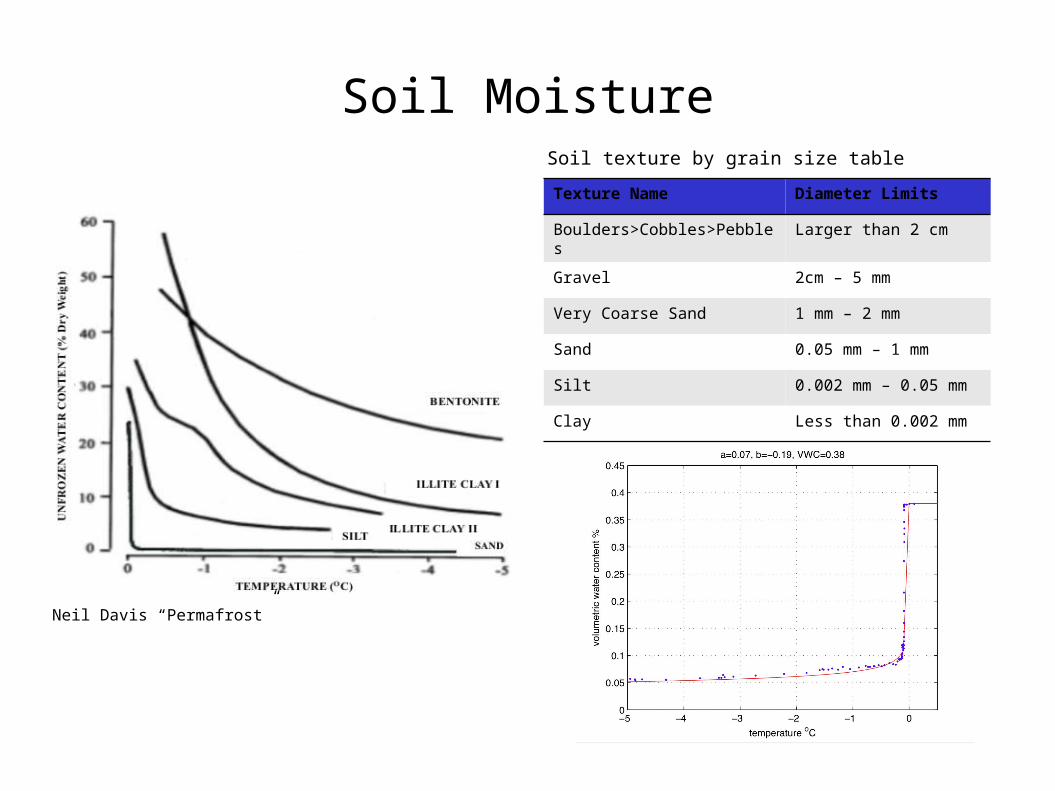
Soil MoistureSoil texture by grain size table
Neil Davis “Permafrost”
Texture Name Diameter Limits
Boulders>Cobbles>Pebbles Larger than 2 cm
Gravel 2cm – 5 mm
Very Coarse Sand 1 mm – 2 mm
Sand 0.05 mm – 1 mm
Silt 0.002 mm – 0.05 mm
Clay Less than 0.002 mm
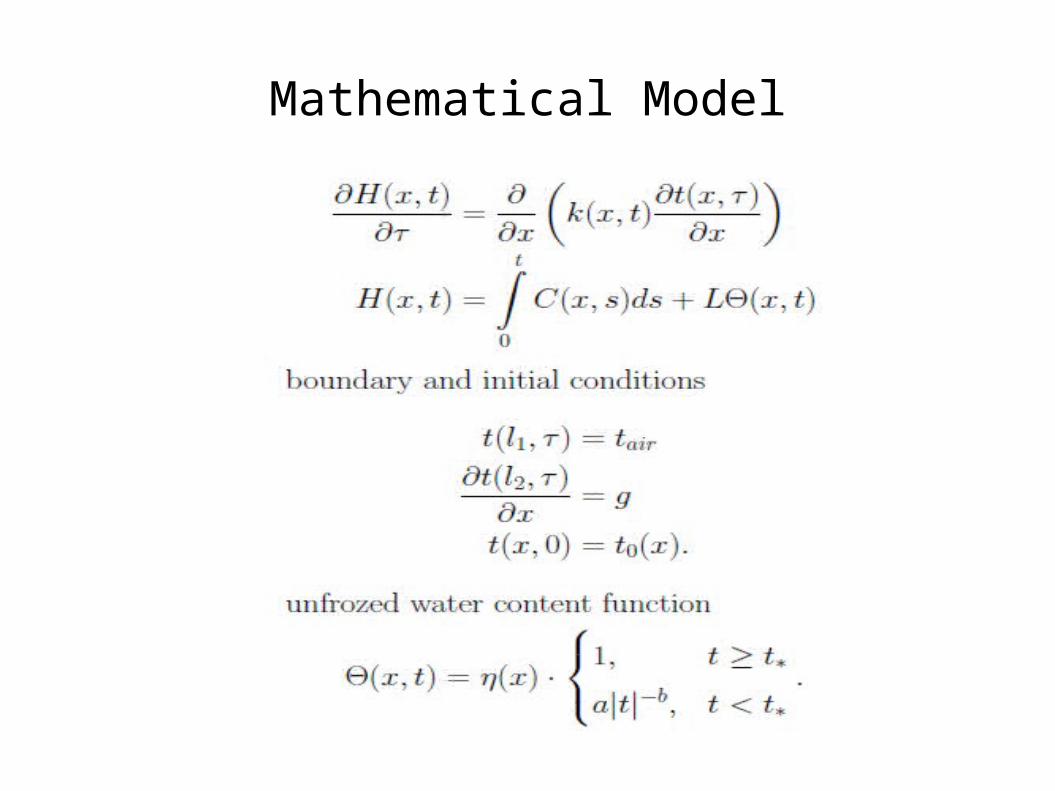
Mathematical Model
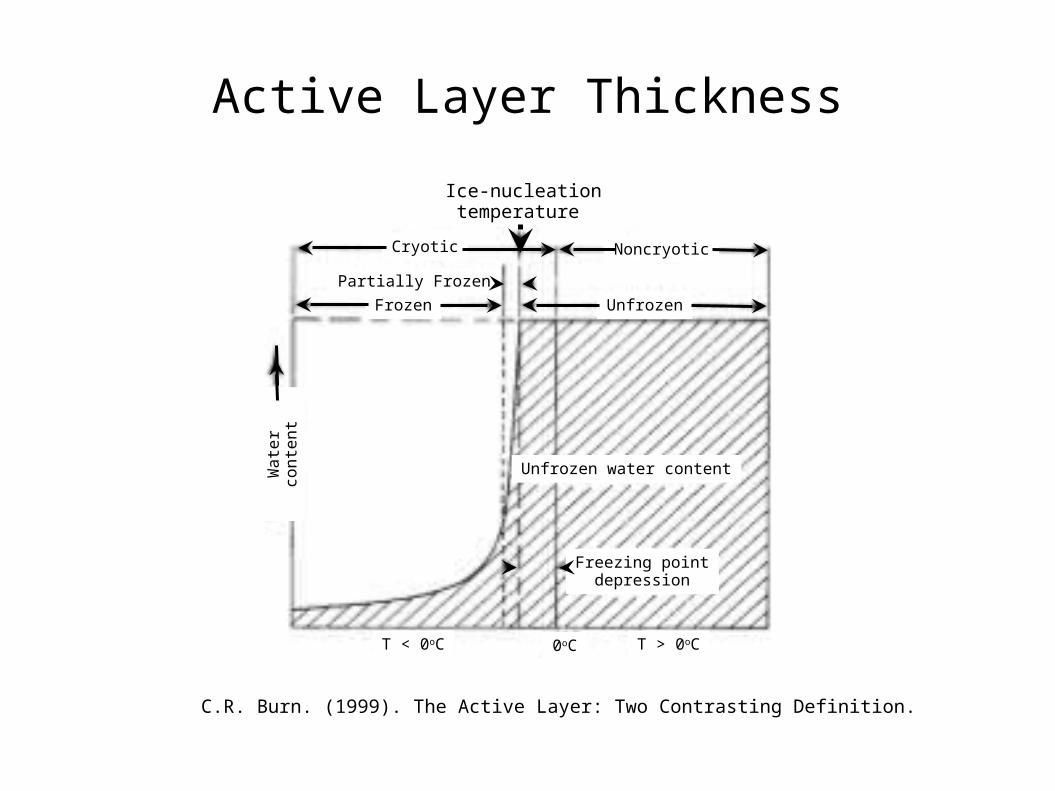
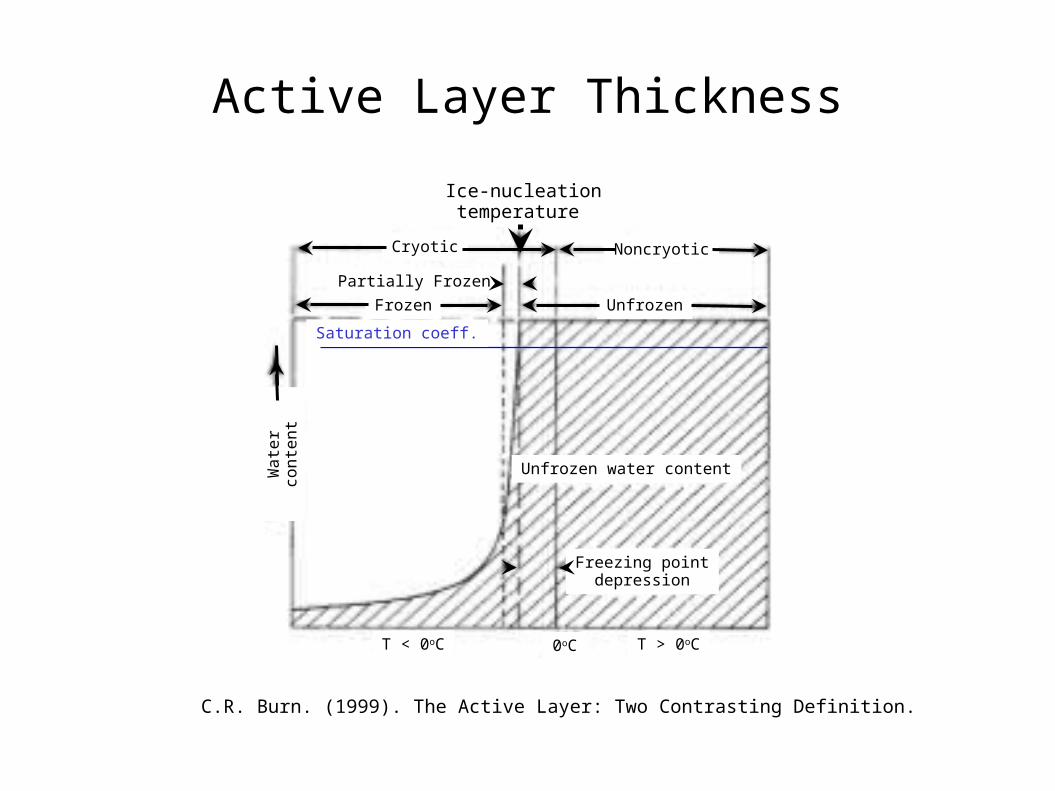
Active Layer Thickness
Ice-nucleationtemperature
NoncryoticCryotic
Partially Frozen
Frozen Unfrozen
Unfrozen water content
Freezing pointdepression
T > 0oC0oCT < 0oC
Wa
ter
con
ten
t
C.R. Burn. (1999). The Active Layer: Two Contrasting Definition.
Active Layer Thickness
Ice-nucleationtemperature
NoncryoticCryotic
Partially Frozen
Frozen Unfrozen
Unfrozen water content
Freezing pointdepression
T > 0oC0oCT < 0oC
Wa
ter
con
ten
t
C.R. Burn. (1999). The Active Layer: Two Contrasting Definition.
Saturation coeff.
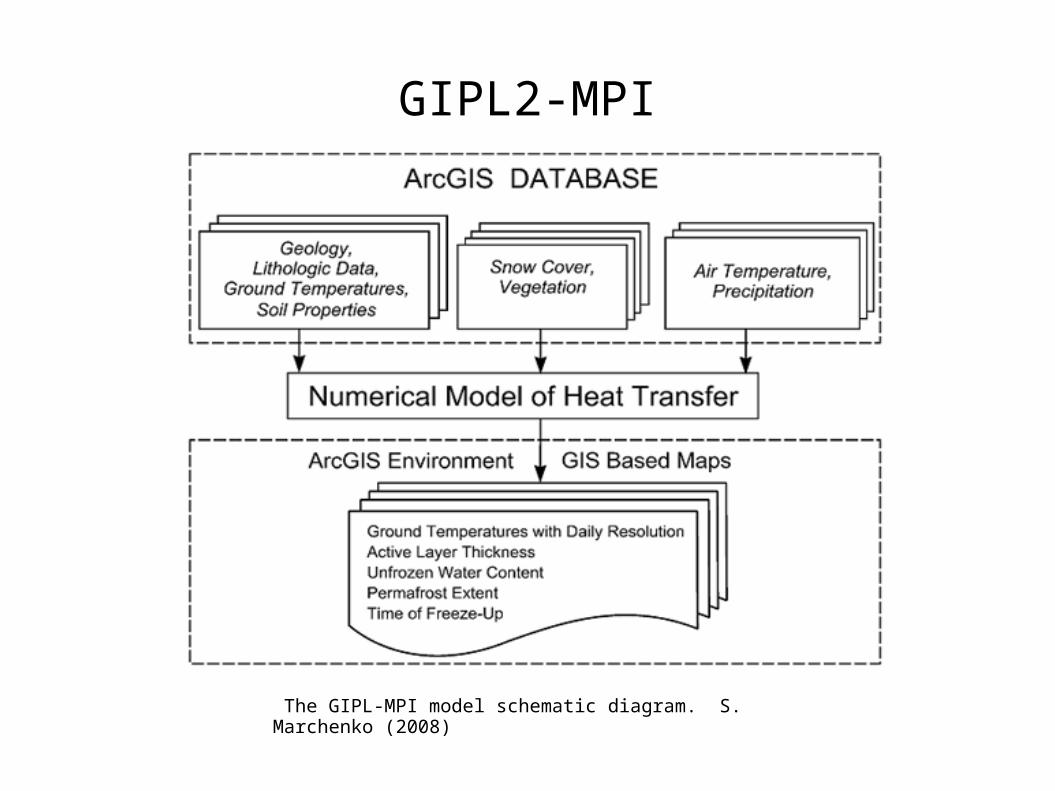
GIPL2-MPI
The GIPL-MPI model schematic diagram. S. Marchenko (2008)
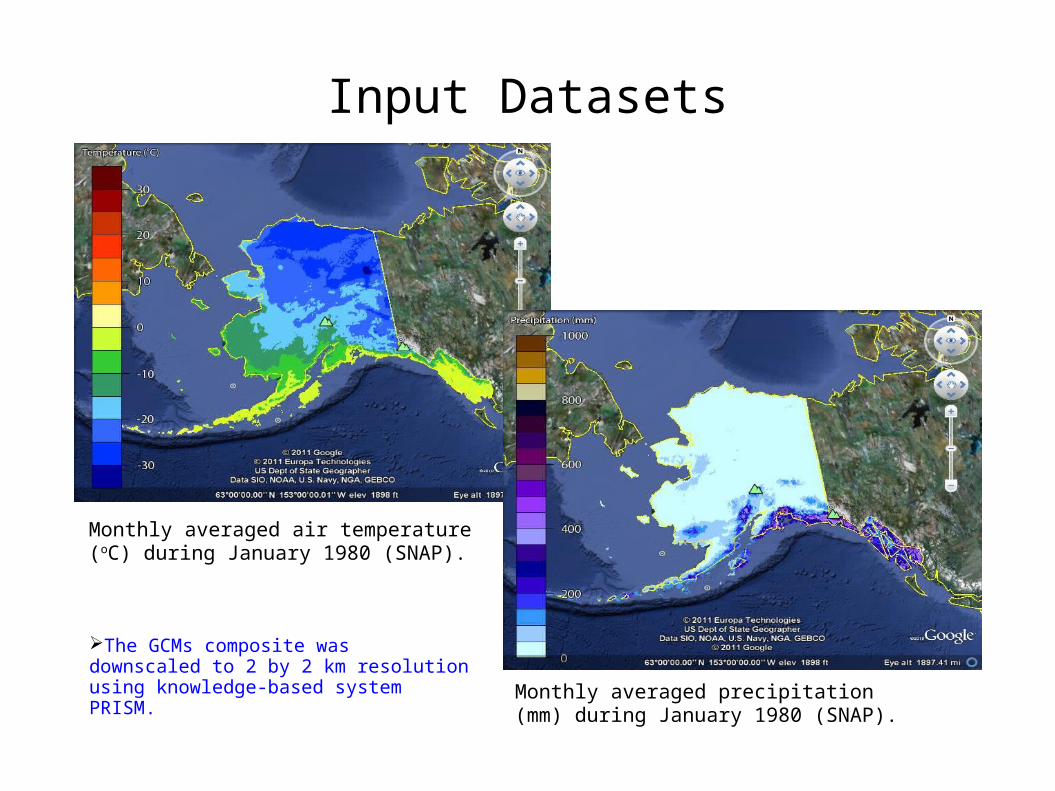
Input Datasets
Monthly averaged air temperature (oC) during January 1980 (SNAP).
Monthly averaged precipitation (mm) during January 1980 (SNAP).
The GCMs composite was downscaled to 2 by 2 km resolution using knowledge-based system PRISM.
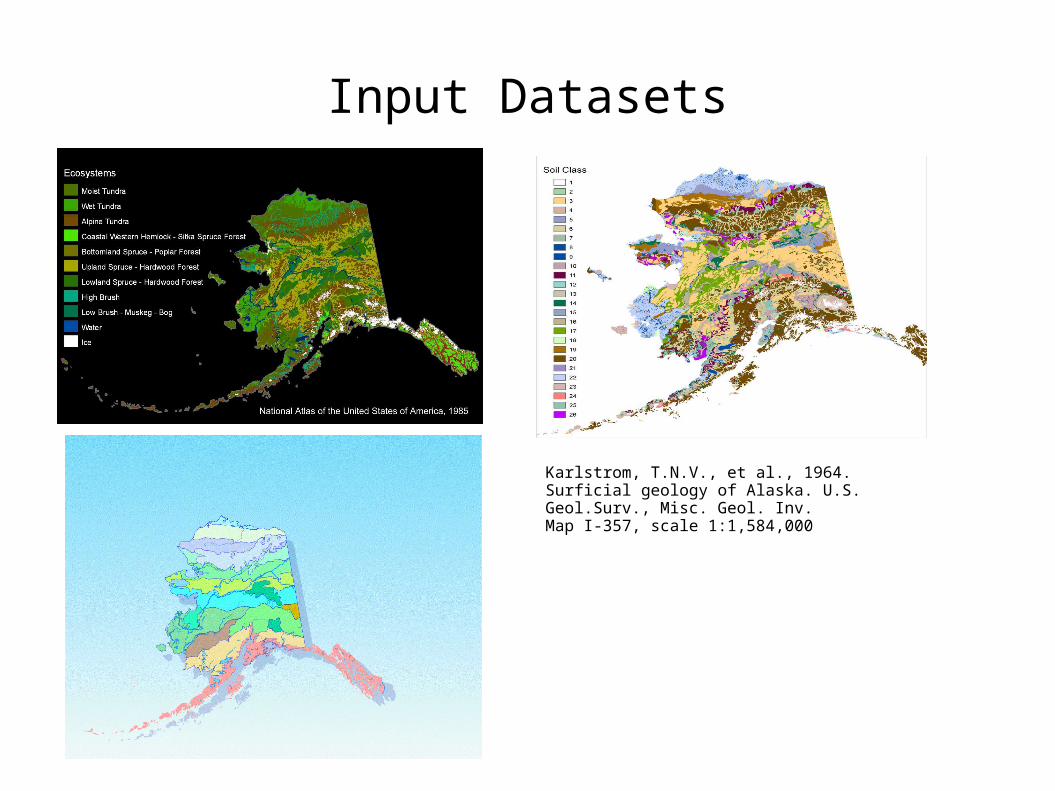
Input Datasets
Karlstrom, T.N.V., et al., 1964. Surficial geology of Alaska. U.S. Geol.Surv., Misc. Geol. Inv. Map I-357, scale 1:1,584,000
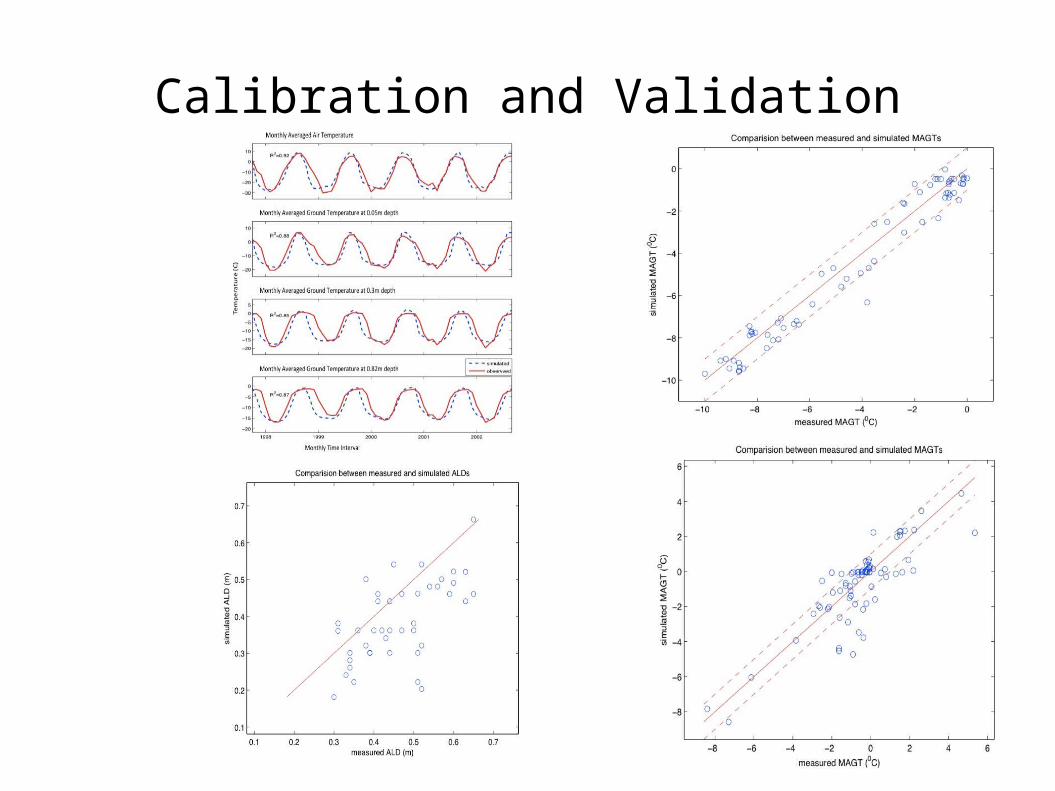
Calibration and Validation
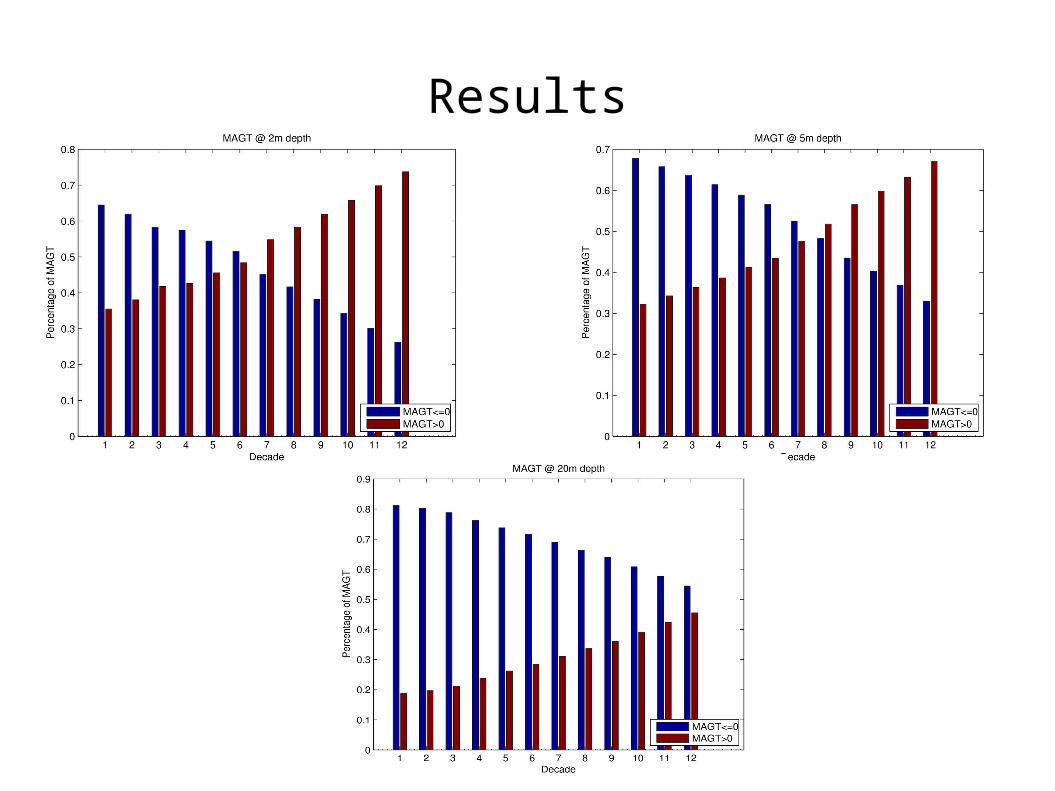
Results
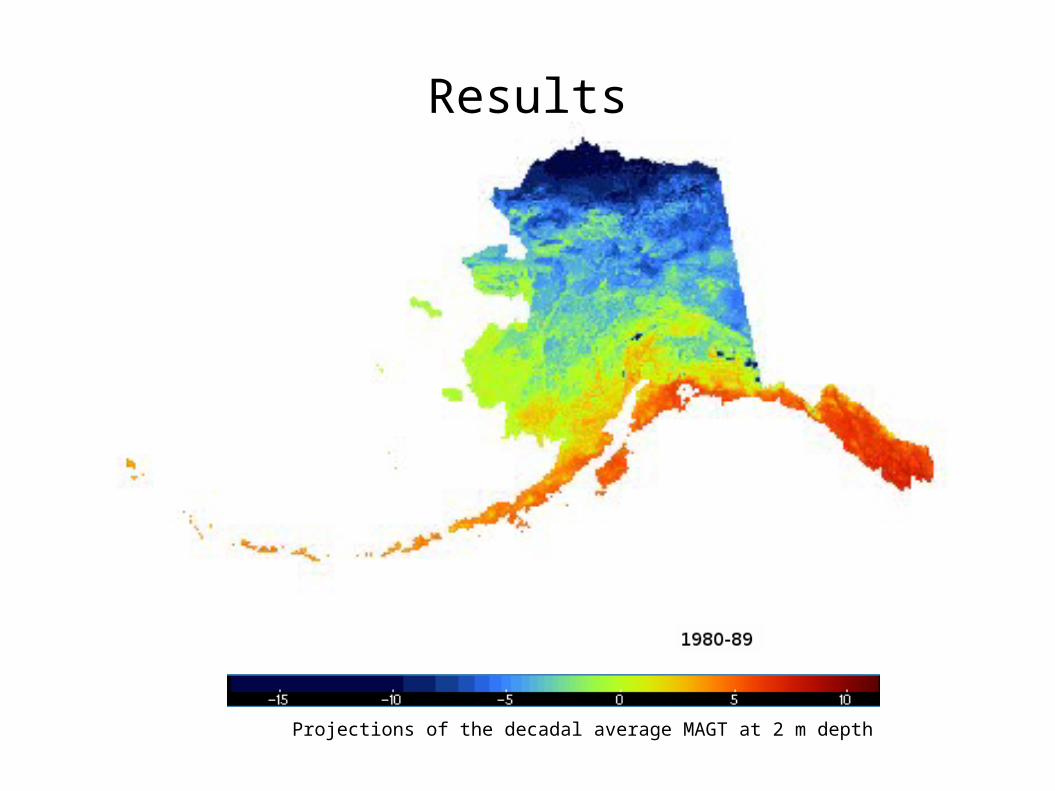
Results
Projections of the decadal average MAGT at 2 m depth
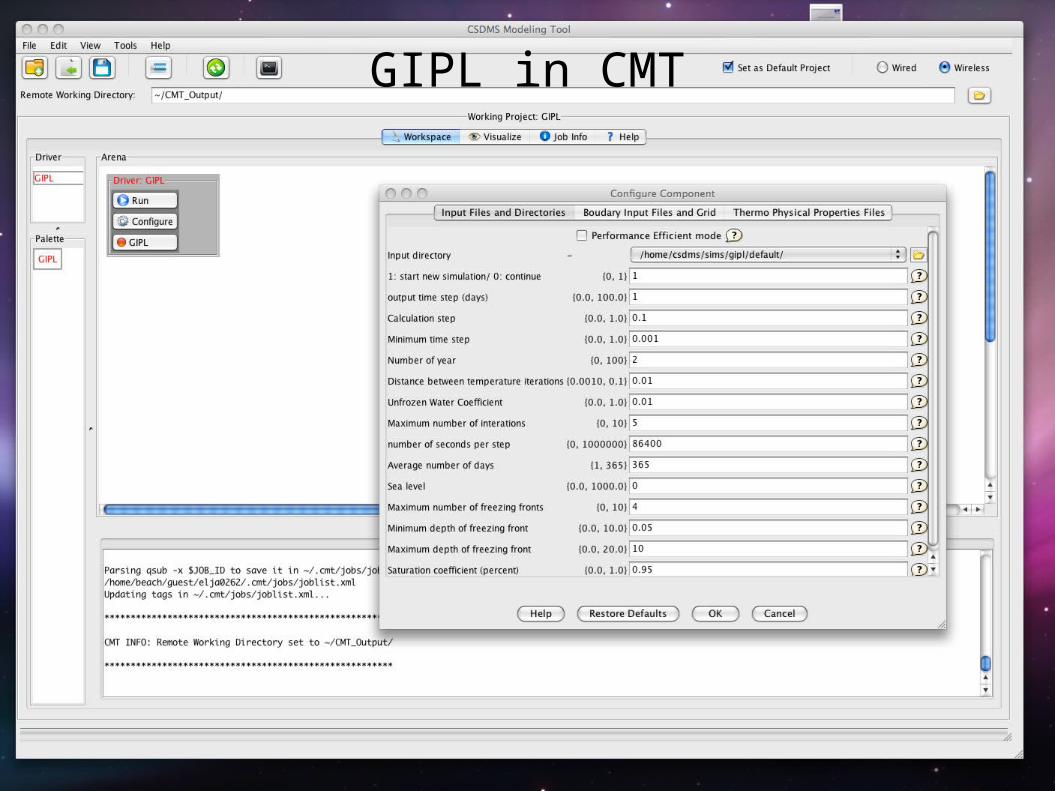
GIPL CMT componentGIPL in CMT
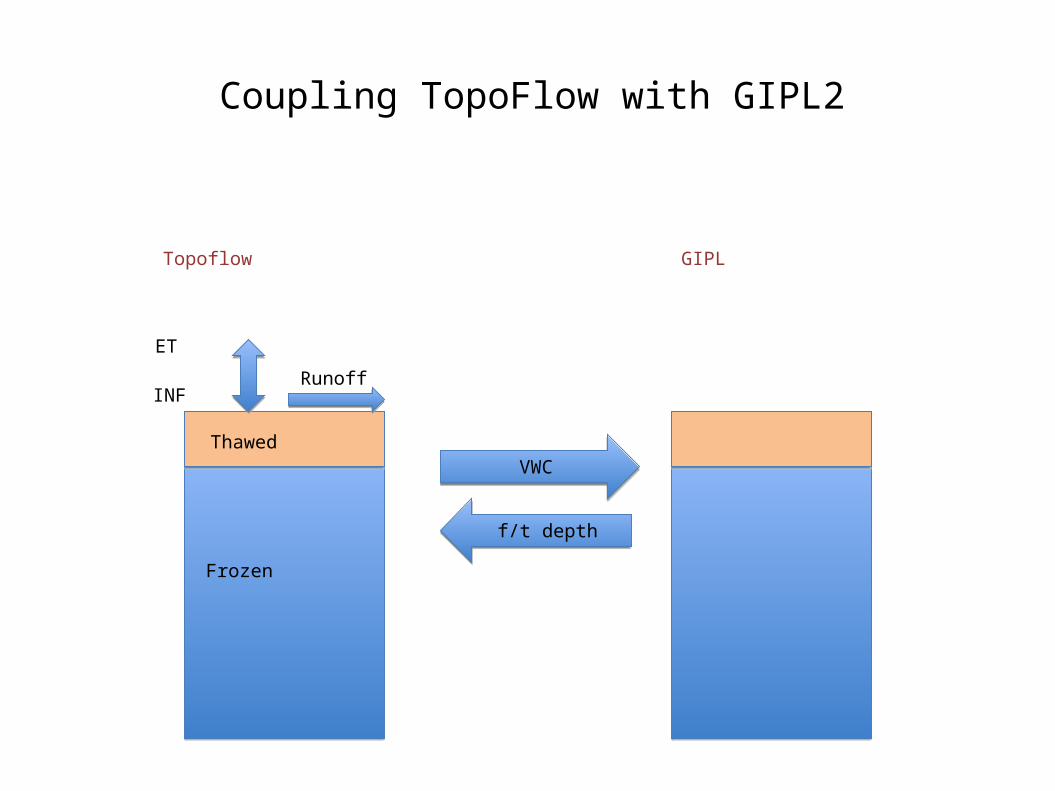
Coupling TopoFlow with GIPL2
VWC
f/t depth
ET
INFRunoff
Topoflow GIPL
Thawed
Frozen
Acknowledgments
& State of AlaskaFunding


![Bibliography - thesis.library.caltech.eduthesis.library.caltech.edu/8631/21/Bibiliography_DavidBrown2015.pdf · Bibliography [1] FF Aliev, MB Jafarov, ... Cation tracer di usion in](https://img.pdfslide.net/doc/110x75/5acfe13a7f8b9ae2138d0acb/bibliography-1-ff-aliev-mb-jafarov-cation-tracer-di-usion-in-the-thermoelectric.jpg)


![The Middle Game in Chess [Piotr Romanovsky, 1960 - Russian]](https://img.pdfslide.net/doc/110x75/55cf97c8550346d033939a3c/the-middle-game-in-chess-piotr-romanovsky-1960-russian.jpg)